Social sensing of high-impact rainfall events worldwide: a benchmark comparison against manually curated impact observations - Natural Hazards and ...
←
→
Page content transcription
If your browser does not render page correctly, please read the page content below
Nat. Hazards Earth Syst. Sci., 21, 2407–2425, 2021
https://doi.org/10.5194/nhess-21-2407-2021
© Author(s) 2021. This work is distributed under
the Creative Commons Attribution 4.0 License.

Social sensing of high-impact rainfall events
worldwide: a benchmark comparison against
manually curated impact observations
Michelle D. Spruce1 , Rudy Arthur1 , Joanne Robbins2 , and Hywel T. P. Williams1
1 College   of Engineering, Maths and Physical Sciences, University of Exeter, Exeter EX4 4SB, UK
2 Met   Office, Exeter EX1 3PB, UK

Correspondence: Michelle D. Spruce (ms886@exeter.ac.uk)

Received: 17 December 2020 – Discussion started: 5 January 2021
Revised: 5 July 2021 – Accepted: 19 July 2021 – Published: 17 August 2021

Abstract. Impact-based weather forecasting and warnings          tial impacts of weather events (Campbell et al., 2018). How-
create the need for reliable sources of impact data to gen-      ever, methods to evaluate these forecasts are currently limited
erate and evaluate models and forecasts. Here we compare         due to a lack of reliable, quality-controlled and sustainable
outputs from social sensing – analysis of unsolicited social     sources of impact data. Meteorological agencies have long-
media data, in this case from Twitter – against a manually cu-   established systems to measure and monitor weather vari-
rated impact database created by the Met Office. The study       ables, which have allowed weather forecasting to develop to
focuses on high-impact rainfall events across the globe be-      its current high level of performance. But evaluating weather
tween January–June 2017.                                         impacts depends on measurements of social activities, health
   Social sensing successfully identifies most high-impact       and wellbeing, socioeconomic processes and other “human
rainfall events present in the manually curated database, with   factors”; this kind of measurement lies beyond the scope of
an overall accuracy of 95 %. Performance varies by loca-         traditional meteorology. In this paper, we compare two ap-
tion, with some areas of the world achieving 100 % accu-         proaches to the evaluation of weather impacts, i.e. manual
racy. Performance is best for severe events and events in        curation of impact databases based on news media and direct
English-speaking countries, but good performance is also         reporting and “social sensing” of impacts based on social me-
seen for less severe events and in countries speaking other      dia.
languages. Social sensing detects a number of additional            Robbins and Titley (2018) made some initial steps to de-
high-impact rainfall events that are not recorded in the Met     velop an impact-based evaluation methodology by collat-
Office database, suggesting that social sensing can usefully     ing information of global socioeconomic impacts related to
extend current impact data collection methods and offer more     heavy rainfall events. These impacts represent the direct and
complete coverage.                                               tangible impacts of high-impact weather (e.g. damage to
   This work provides a novel methodology for the curation       property, loss of life, evacuation and injury and restricted
of impact data that can be used to support the evaluation of     or delayed access to essential services). The community im-
impact-based weather forecasts.                                  pact database was developed to enable the evaluation of high-
                                                                 impact weather forecasts that are available from the Met Of-
                                                                 fice global hazard map (GHM). The Met Office is the na-
                                                                 tional meteorological service for the UK, providing weather
1   Introduction                                                 services and contributing to climate science research world-
                                                                 wide (https://www.metoffice.gov.uk/about-us/who, last ac-
Impact-based weather forecasts are increasingly used by na-      cess: 17 December 2020). The GHM summarises the risk
tional meteorological and hydrological services to provide       of high-impact weather across the globe for the next 7 d
advice and warnings about both the likelihood and poten-

Published by Copernicus Publications on behalf of the European Geosciences Union.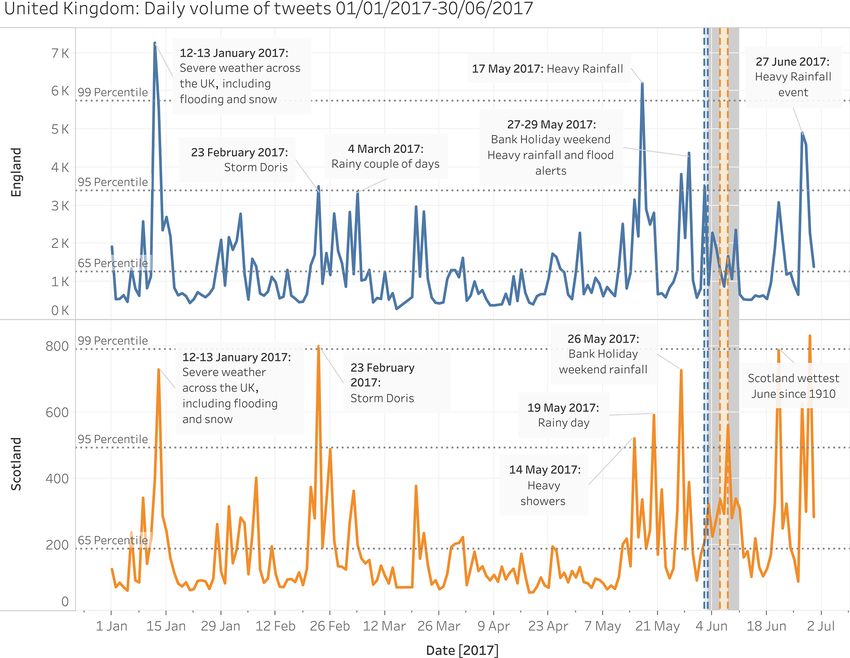
2408                                            M. D. Spruce et al.: Social sensing of high-impact rainfall events worldwide

(i.e. weather which can result in significant impacts on safety,      Twitter data were used by Sakaki et al. (2010) to detect
property or socioeconomic activity). The community impact          earthquakes in Japan, with reports arriving in some locations
database includes information on when and where an impact-         before the shock had been detected by conventional seis-
ful rainfall event occurred, as well as a description of the       mography. Many studies have followed, using a number of
impacts observed, with each event then assigned to an im-          different approaches to explore the use of social media as
pact severity category. The impact severity category ranges        an information source during and following natural hazard
from 1 to 4, where 4 is the most impactful and 1 is the            events. Some studies have focused on the use of social media
least impactful. There are certain criteria that the impacts of    to better understand risk communication during an extreme
the event must meet for each severity category. Data con-          natural hazard event. For example, Stewart and Gail Wil-
tained within the database are obtained from a range of on-        son (2016) explore the use of social media throughout the
line sources across the world, including news, humanitarian        crisis life cycle during Hurricane Sandy in the USA, building
and natural hazard websites, in the English language. Col-         the STREMII model to better understand crisis communica-
lation of the database was labour intensive and required a         tion during an extreme weather event; Rainear et al. (2018)
significant level of manual inspection to extract the relevant     used Twitter data collected during Hurricane Joaquin to ex-
temporal, spatial and impact information for each weather          plore the types of information communicated by state emer-
event. The data were standardised so that the impact informa-      gency management accounts to better understand the flow of
tion could be compared with the high-impact weather fore-          risk communication during a crisis; Bossu et al. (2020) ex-
casts provided by the GHM in an automated way. Despite the         plored the use of crowdsourced information, along with Twit-
labour-intensive nature of the process, the authors found the      ter data, in a bespoke application during the 2019 earthquake
database a good solution to enable impact-based evaluation         in Albania, finding that engagement of users with the app
of high-impact weather forecasts.                                  provided much more information about the damage caused
   There are limited options available for other global            as a result of the earthquake than was available using con-
databases containing weather impacts against which to com-         ventional methods.
pare our methodology. There are databases, such as NatCat-            Other studies have explored the use of social media to
SERVICE, produced to record insurance loss as a result of          better understand the impacts of extreme weather events.
natural catastrophes. However, we would like to consider im-       Many studies focus on individual events. For example, Fang
pacts of extreme weather (i.e. disruption to daily life), which    et al. (2019) use data from the Chinese social media plat-
do not necessarily lead to financial loss and which could          form, Sina Weibo, during the 2016 Beijing rainstorm, and
be missing from this kind of record. ReliefWeb, which is a         find a positive correlation between social media activity and
humanitarian information source on global crises and dis-          precipitation intensity; Sit et al. (2019) examine Twitter data
asters, is another possible database against which to com-         collected during Hurricane Irma, using geo-located tweets to
pare our results; however, this is filtered for disaster events    identify locations with a high density of affected individu-
which are most relevant to global humanitarian workers and         als and infrastructure damage; and Han and Wang (2019) use
decision-makers rather than all impactful events. Other avail-     data from Sina Weibo during the 2018 Shouguang flood to
able databases relying on citizen input (e.g. the European         analyse the changes in the sentiment of social media users
Severe Weather Database – ESWD) may be limited to cer-             during the different development stages of the flood. Further
tain geographical areas and are unlikely to contain the same       examples of other studies examining the impacts of individ-
level of rigour as the community impact database in terms          ual weather events at one particular location include studies
of criteria for inclusion. Considering the options available       relating to specific hurricanes in the USA (Guan and Chen,
to us, the community impact database therefore provides the        2014; Kim and Hastak, 2018; Lachlan et al., 2014; Morss et
most comprehensive database against which to compare our           al., 2017; Niles et al., 2019; Wu and Cui, 2018; Zou et al.,
methodology.                                                       2018) and specific flooding events around the world (Aisha
                                                                   et al., 2015; Brouwer et al., 2017; Cervone et al., 2016;
Related work                                                       Kankanamge et al., 2020; Li et al., 2018; Rossi et al., 2018).
                                                                      Some authors have begun to explore the use of Twitter for
A number of studies have explored the use of social me-            more wide-scale, specific weather event detection. Arthur et
dia as a source of information about the impacts of extreme        al. (2018) use Twitter data to detect and locate flood events
weather. Social sensing is an approach developed in recent         in the UK to produce maps of flood activity. De Bruijn et
years to analyse unsolicited social media data to detect real-     al. (2019) compare Twitter activity relating to flooding and
world events of interest.                                          hydrological information with flood events in the NatCat-
   While social sensing is not specific to natural hazards and     SERVICE disaster database, finding a good comparison be-
can be applied in a variety of contexts (Liu et al., 2015; Wang    tween these data sources. Boulton et al. (2016) use Twitter
et al., 2012, 2019), social sensing has demonstrated useful-       data collected during several time periods to detect and lo-
ness for natural hazard events.                                    cate wildfires in the USA. Cowie et al. (2018) find that user
                                                                   reports on Twitter during the year can help to locate peaks

Nat. Hazards Earth Syst. Sci., 21, 2407–2425, 2021                                https://doi.org/10.5194/nhess-21-2407-2021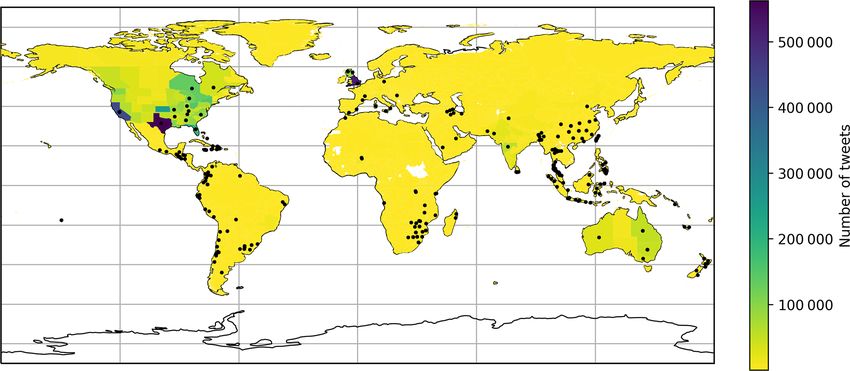
M. D. Spruce et al.: Social sensing of high-impact rainfall events worldwide                                                 2409

in hay fever symptoms as a result of pollen levels in the UK.     tain platforms. Despite this limitation, however, Twitter is
Furthermore, Spruce et al. (2020) examine Twitter data relat-     still one of the most prevalent social media platforms across
ing to named storms, wind and precipitation in the UK, find-      the world and, therefore, is likely to be a good source of in-
ing that it is possible to identify tweets which can be used to   formation for understanding where people are being affected
assess the impact of storms both temporally and spatially.        by extreme weather, and how they are being impacted by it.
   In social sensing, each individual in a social network acts       The methods used in this paper to gather, filter and locate
as a sensor, and their posts provide pieces of sensor data        the Twitter data follow a similar approach to those used in
which can be used to better understand what is happening          previous social sensing studies (Arthur et al., 2018; Cowie et
to or near that individual at a given place and time. Filter-     al., 2018; Spruce et al., 2020). New methods were developed
ing and grouping this information by topic, time or location      to compare the results of the social sensing of Twitter data
provides a better understanding of an event through the eyes      with the Met Office community impact data.
of a social network. In the context of weather, social sensing
can, therefore, be used to determine where, when and how          2.1     Data collection
individuals are being impacted by a specific weather event.
   This study seeks to build on and expand the scope of pre-      2.1.1    Met Office community impact database
vious work to determine if high-impact weather events can
be detected without prior knowledge of when or where an           The extract of the Met Office community impact database
event happened. We use the social media platform Twitter to       provided for this study included records of high-impact rain-
extract tweets from across the world containing key words re-     fall events from 1 January–30 June 2017. The database was
lating to heavy rainfall and its secondary hazards (e.g. flood-   provided as an Excel spreadsheet, which included the follow-
ing or landslides). We then examine peaks in Twitter activity     ing information about each event: impact record date, coun-
(relative to the normal level of tweet activity for each loca-    try in which the impact occurred, along with the nominal lo-
tion) relating to mentions of heavy rain, flooding or land-       cation (state and/or province) provided by latitude/longitude,
slides. This is then compared with the Met Office community       description of impacts observed and media source of infor-
impact database (Robbins and Titley, 2018), for the same pe-      mation. Additional information was provided where known,
riod and hazard focus, to assess the value of socially sensed     including the start and end dates for heavy rainfall events,
tweets for impact database development. Rainfall, and its as-     higher-resolution location (lower administrative division)
sociated secondary hazards, is a good weather type for this       provided by latitude/longitude and additional hazard infor-
kind of evaluation because it occurs in many places across        mation. Each event was also assigned an impact severity cat-
the globe with relatively high frequency. In comparison with      egory from 1 to 4 to reflect the severity of impacts expe-
other hazards, rainfall-related impacts are generally more        rienced during the event. Table 1 provides a breakdown of
widely documented (Robbins and Titley, 2018).                     the criteria used for each severity category. As described by
   The paper is split into several sections. Section 2 gives      Robbins and Titley (2018), the information contained in the
detail of social sensing methods used, followed by Sect. 3,       database was predominantly obtained from online news and
which compares outputs of social sensing to the manually          social media, personal correspondence with National Me-
curated Met Office database. Section 4 gives some interpre-       teorological and Hydrological Services and existing hazard
tation of the findings and places the work in a broader con-      and impact databases. These included specific known sources
text.                                                             (e.g. http://floodlist.com, last access: 17 December 2020) and
                                                                  news/social media via internet searches, including terms such
                                                                  as “heavy rainfall”, “flooding”, “landslide”, etc. The data set
2   Methods                                                       used in this study contained 519 entries (135 unique events)
                                                                  in the period January–June 2017. Unique events refers to the
Most social sensing studies have made use of Twitter data,        fact that a single rainfall event can lead to impacts in multiple
and we follow this pattern here. Twitter is an online so-         locations.
cial networking service that enables users to send short,
280-character messages called tweets. It is currently one of      2.1.2    Twitter data
the leading social media platforms worldwide, based on ac-
tive users (Clement, 2020). It provides a platform for users      To gather the tweet data, English language key words relat-
to share and exchange information and news about current          ing to rainfall and the impacts of heavy rainfall were used to
events as they unfold in a faster way than traditional media      query the Twitter streaming API. This API returns all tweets
sources (Wu and Cui, 2018). It also encourages the use of         containing the key words from the query, up to a limit of 1 %
text in messages, and data are made freely available via the      of the total volume of tweets worldwide at any point in time.
Twitter developer application programming interface (API).        The key words used to identify and download relevant tweets
There are still some countries where the use of the internet is   using the API were “rain”, “rainfall”, “raining”, “rainstorm”,
not as widespread or where social media is limited to cer-        “flood”, “flooding” and “landslide”. It is unlikely that tweets

https://doi.org/10.5194/nhess-21-2407-2021                                 Nat. Hazards Earth Syst. Sci., 21, 2407–2425, 2021
2410                                               M. D. Spruce et al.: Social sensing of high-impact rainfall events worldwide

Table 1. Descriptions of impacts required for each impact severity category related to a heavy rainfall event (adapted from Robbins and
Titley, 2018).

          Severity       Description of impacts
          category
          1 – Low        Some roads and (< 10) properties inundated over a small area; 1 or 2 localised assets affected/damaged.
                         No fatalities/injuries or hospitalisations.
                         Low-level disruption to daily life (e.g. delays in transport and services shut for short periods).
          2 – Moderate   Multiple assets affected (transport, business and residential) over a moderately large area (e.g. multiple
                         districts); > 1000 homes damaged and/or destroyed; > 1000 minor injuries and hospitalisations.
                         Wider-scale and prolonged disruption to daily life and services; > 1000 people displaced/evacuated
                         and/or receiving aid.
          3 – High       >=1 fatalities (but < 50); > 1000 people displaced/evacuated and/or receiving aid.
                         Multiple assets affected (transport, business and residential) over a large area (e.g. province or state);
                         > 1000 homes damaged and/or destroyed.
          4 – Severe     > 50 fatalities; > 50 000 people displaced/evacuated and/or receiving aid.
                         Extensive damage to multiple assets causing prolonged disruption, inaccessibility and hardship.

using these keywords will have reached the global API limit,             tweets do not represent original observations; therefore, re-
since rainfall events tend to be widely dispersed in time and            moving them from the data set prevents any bias in the vol-
space. Based on these considerations and the absence of any              ume of tweet activity because of secondary public interest
obvious artefacts in our time series, we are confident that the          in a specific event or location. Though retweets and quotes
API rate limit does not affect our collection (Morstatter et al.,        could provide additional information, their frequency is con-
2013).                                                                   trolled to a large extent by social network effects, which will
   Tweets were collected during the period 1 January to                  be different in different regions, depending on local popular-
30 June 2017 in line with the time period of the sample of               ity and differences in the use of Twitter. This filter removed
the Met Office Impact Database data used for comparison in               20.7 million tweets (46 %) from the raw unfiltered collection,
this study. Each tweet was saved as a JavaScript Object Nota-            leaving 24 million tweets to be passed to the next stage of fil-
tion (JSON) object containing the tweet text and a number of             tering.
metadata fields relating to each tweet (e.g. timestamp, user-
name, user location, geotag, retweet status, etc). The Twitter           2.2.2    Bot filter
streaming API searches the whole of the tweet metadata for
the search terms requested in the search including tweet text,           Twitter has many automated user accounts (bots) which are
URLs and usernames. Therefore, collected tweets were fil-                set up to perform a particular function. For example, to col-
tered to extract only those with one or more of the selected             late and post content from a set of sources outside of Twitter,
keywords in the tweet text and to remove any duplicate tweet             to deliver advertising or to promote a particular issue. These
IDs. In total, 44.7 million tweets were collected using this             types of tweets are unlikely to contain information relating
method.                                                                  to the impacts that users have experienced from heavy rain-
                                                                         fall and may therefore distort the data set. Therefore, where
2.2     Filtering Twitter data                                           possible, bot content was removed from the data set. As bot
                                                                         accounts tend to create many more tweets than human users,
Once all tweet data collected using the API for the study pe-            simple bot filtering was achieved by identifying user ac-
riod had been extracted, the raw unfiltered data were then               counts which had a disproportionately high number of tweets
passed through a number of filtering steps to remove irrele-             (using a threshold of > 1 % of the total number of tweets in
vant data. Filters were applied in the following order.                  the data set). Any tweet in the data set which was posted
                                                                         by an identified bot account was removed. Manual inspec-
2.2.1    Retweets and quotes                                             tion of tweets during the development of the filtering process
                                                                         identified a number of other bot accounts, which were also
Tweets that were duplicates of an original tweet authored                removed. The bot filter removed 2.7 million tweets (6 % of
by another user and redistributed to their own followers                 the total unfiltered data set), leaving 21.3 million tweets to be
(retweets) and tweets which were posted as a quote from an-              passed to the next stage of filtering.
other user’s tweet (quotes) were removed using tweet meta-
data relating to “retweeted status” or “quoted status”. These

Nat. Hazards Earth Syst. Sci., 21, 2407–2425, 2021                                         https://doi.org/10.5194/nhess-21-2407-2021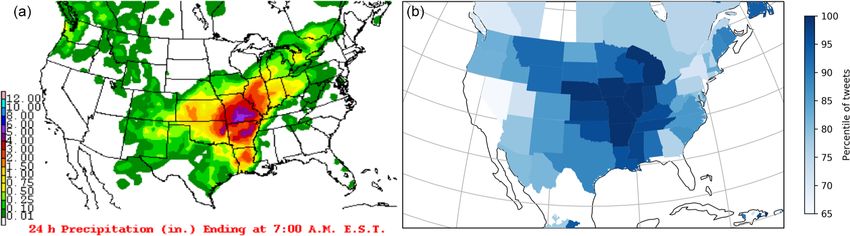
M. D. Spruce et al.: Social sensing of high-impact rainfall events worldwide 2411
2.2.3 Weather station filter A set of 5434 tweets were randomly selected from the
filtered data set of tweets remaining after the phrase filter
As the tweet collection in this study is focused on weather- (Sect. 2.2.4). Each tweet in this random set of tweets was
related terms, a high number of weather station tweets were manually inspected and labelled as relevant or irrelevant.
also present in the data set. Some amateur weather stations A tweet was marked as relevant based on the criteria that
are set up to automatically post observations to Twitter. As the tweet had to relate to rainfall that was currently hap-
for Twitter bots, weather station tweets, while containing in- pening, had happened recently or was about the impacts of
formation on the weather conditions at a particular location rainfall experienced recently. Everything else was marked
and time (such as the amount of rainfall), are unlikely to as irrelevant. For example, “Rain destroys 60 buildings in
provide any relevant information on the impacts from heavy Ondo” would be marked as relevant whereas “Rain expected
rainfall (e.g. damage or disruption). Therefore, any weather in Ondo tomorrow” would be marked as irrelevant. In total,
station tweets not picked up by the bot filter described above there were 1316 tweets marked as relevant and 4118 tweets
required an additional weather station filter to remove them marked as irrelevant.
from the data set. Many of these tweets follow a fixed struc- The labelled data set was then used as training data for a
ture (for example, “06:30 AM Temp: 53.0 ◦ F (12 ◦ C) Hum: multinomial naïve Bayes classifier. As a first validation test
91 % Wind: 7.0 mph (11 kph) N Bar: 29.530 in (1013 mb) for this approach, 25 % of the data were held back as a vali-
Rain: 0.09 in (2.3 mm)”), and therefore, the majority can be dation set, and a classifier was trained on the remaining 75 %
identified by searching for multiple occurrences of meteo- of cases; this classifier had an accuracy (i.e. correctly identi-
rological terms and units. Any tweet with three or more of fied the relevance/irrelevance) of 90 % on the held-back val-
any combination of weather terms and/or units was therefore idation tweets, with an F1 score of 0.88. As a second test,
removed from the data set. A randomised sample of tweets to confirm the robustness of the approach, the same train-
removed using this filter was checked to ensure that no tweets ing/validation test was repeated with sixfold cross-validation.
that were not weather stations were removed using this filter. The results of each test were combined to give an overall
The weather station filter removed 4.7 million tweets (11 % mean F1 score of 0.89, and the summed confusion matrix
of the total unfiltered data set), leaving 16.6 million tweets to (also known as “contingency table”) is shown below (where
be passed to the next stage of filtering. True is relevant, and False is irrelevant), as follows:
2.2.4 Phrase filter Predicted
False True
Actual False 3966
. (1)
Another issue with the collection of tweets containing 152
weather-related keywords is the use of weather terms in True 140 1176
phrases and figures of speech which are not related to the
This confusion matrix shows an overall accuracy of 95 %,
weather. For example, “floods of tears”, “rain check”, “rain-
with most tweets in the filtered data set classified as not rele-
ing offers”, “winning by a landslide”, etc. Other terms found
vant. Accuracy was higher for the False class (3966/4118 =
to be present in irrelevant tweets are also removed. These are
96 %) than the True class (1176/1316 = 89 %). This could
generally political in nature and include terms such as “elec-
be attributed to the training data set being unbalanced and
tion”, “vote”, “trump”, “labour”, “migration”, etc. Song titles
biased towards irrelevant tweets. Overall, the results of the
containing the key words were also removed, for example
machine learning filter testing indicate good performance.
Purple Rain, Singing in the Rain, etc. Applying the phrase
The machine learning filter removed 10.4 million tweets
filter removed 1.3 million tweets (3 % of the total unfiltered
(23 % of the total unfiltered data set), leaving 4.9 million
data set), leaving 15.3 million tweets to be passed to the final
tweets (11 % of the total unfiltered data set) for further anal-
stage of filtering.
ysis.
2.2.5 Machine learning filter 2.3 Location inference
Although the previous stages of filtering removed many irrel- Typically, only ∼ 1 % of tweets collected using the Twitter
evant tweets, manual inspection of remaining tweets found developer API using keywords contain the geo-coordinates
that there were still a large number that contained the key- needed to determine the specific location of a tweet, while a
words but that were not relevant to rainfall or the impacts of further 2 %–3 % contain specific place coordinates (Dredze
heavy rainfall. These included warnings about forecasts of et al., 2013). Therefore, even after filtering for relevance, de-
rainfall, business advertising, links to articles on other topics termining the location of a tweet collected in this way re-
and various other irrelevant content. Therefore a naïve Bayes quires further processing to determine where in the world it
classifier, found to be successful in other studies (Arthur et originated from, or relates to, in a process of location infer-
al., 2018; Cowie et al., 2018; Spruce et al., 2020) for the fil- ence.
tering of tweet content, was employed.
https://doi.org/10.5194/nhess-21-2407-2021 Nat. Hazards Earth Syst. Sci., 21, 2407–2425, 2021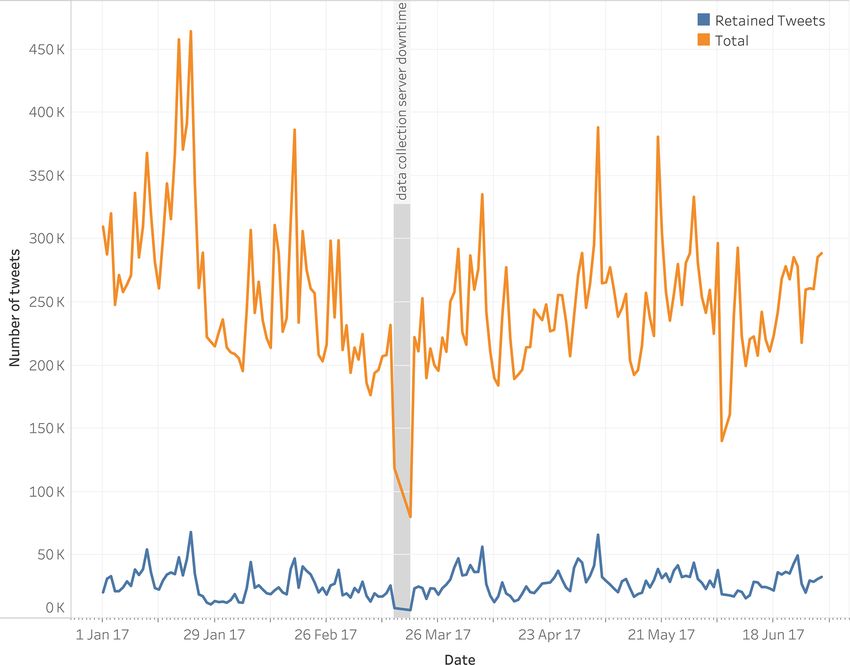
2412                                           M. D. Spruce et al.: Social sensing of high-impact rainfall events worldwide

   The 4.9 million tweets remaining after the relevance fil-      lowing methodology was applied to each tweet which did
tering stages were further processed to see if location could     not contain geo or place coordinates as described in Sect. 2.3
be identified using information contained within the tweet.       above.
The location of the tweet is important in understanding
where in the world the rainfall event had taken place or            – GeoNames was used as our primary source of gazetted
was taking place. We chose to work at a geographic resolu-            features as it is a geographical database with informa-
tion of GADM (the database of global administrative areas)            tion about all countries with over 8 million places, such
level 1 units, which are sub-national administrative regions          as cities and points of interest. Where there was no
(e.g. USA states, UK countries and Australian states). This           match found in the GeoNames database, the DBpedia
choice is a balance between fine-scale resolution and having          database was used.
enough tweet data in each unit to give meaningful outputs; it       – Where a match to a place name is found, a set of co-
is also the resolution at which the Met Office impact database        ordinates or bounding boxes from the gazetteer database
was aggregated for evaluation against weather forecasts.              is returned.
   We found that 2 % of tweets contained specific geo-
coordinates of the tweet origination (geotag) and a further         – Where locations were found in both the user profile and
5 % contained the coordinates for the place a user designated         tweet text, place names in the tweet text are preferred, as
in the Twitter application when posting the tweet (place).            they are more likely to relate to the subject of the tweet.
However, this left 3.7 million tweets without specific location
coordinates. As these tweets would very likely contain rele-        – In a small number of cases, the user profile location and
vant information relating to the impacts of a rainfall event,         tweet text locations may differ; in that case, the place
it was important to try to determine the location of the tweet        determined from the tweet text is given more weight
so that the information contained within the tweet could be           during the location inference process.
used. Therefore, a location inference process was used for          – Where multiple matches to a place name were found
each remaining tweet to see if location could be determined           in GeoNames (i.e. where a place name exists in more
either from the location given in the user profile (user loca-        than one country), if there was no reference to the coun-
tion) or place name detected in the tweet text. The steps taken       try elsewhere in the tweet or the country had not al-
in the location inference process are as follows.                     ready been determined by the country filter described in
                                                                      Sect. 2.3.1 above, then the place with the largest popula-
2.3.1   Country filter                                                tion (which has been found in previous studies to be the
                                                                      most likely location for the tweet (Arthur et al., 2018;
Place names alone, without any other information, such as a           Schulz et al., 2013) was logged and the coordinates re-
country or state name can often apply to more than one coun-          turned.
try. For example York (UK and Canada), London (UK and
Canada), Pasco (USA and Peru), etc. Therefore, an initial           – In addition, where multiple place names are determined
filter was created to identify the country associated with a          from a tweet, to infer the most probable location, ar-
place name. For some countries, place names in the text com-          eas of overlap between the matching location polygons
monly follow a specific pattern or use certain abbreviations.         are detected before a final coordinate or bounding box
For example, in the USA, Canada and Australia, users often            is returned. This assumes that polygon overlaps are the
put a place name followed by a 2 – character or 3 – char-             highest likelihood locations.
acter abbreviation for the state (e.g. Los Angeles, CA; Van-
couver, BC; Sydney, NSW). Text scanning for place names           Since some place names are also commonly used to denote
was extended to look for the “place name, state abbreviation”     something other than a location (Liu et al., 2011), a database
template and the names/abbreviations of states and/or coun-       of words which are also places was used to remove apparent
try name for USA, Canada or Australia. Where a country or         locations which were more likely to be a word than a place
state could be identified in this way, any further location in-   (e.g. dew, aka, var, etc.).
ference steps only checked for place names in that particular
                                                                  2.3.3   Validation
country. This disambiguation step gave much better location
performance overall and computational efficiency benefits.        The method described above is based on the location infer-
                                                                  ence method validated by Schulz et al. (2013), who found
2.3.2   Gazetteer look-up                                         92 % accuracy when the inferred location from a user loca-
                                                                  tion/place name mentioned in tweet was compared against
This filter checked the tweet to determine if a discernible       tweets for which a geotag was known. The method was
place name could be detected from the user location               also used successfully by Arthur et al. (2018) and Spruce et
and/or the tweet text using gazetteers, including GeoNames        al. (2020).
(GeoNames, 2020) and DBpedia (DBpedia, 2020). The fol-

Nat. Hazards Earth Syst. Sci., 21, 2407–2425, 2021                               https://doi.org/10.5194/nhess-21-2407-2021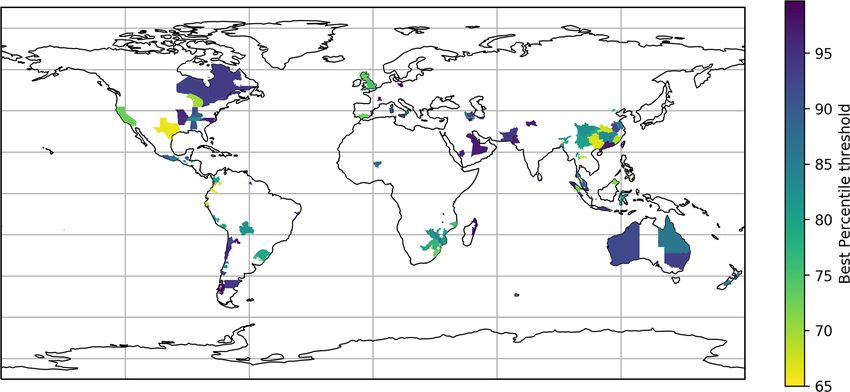
M. D. Spruce et al.: Social sensing of high-impact rainfall events worldwide                                                  2413

   To validate the location inference approach for this study, a       To test our theory that a higher percentile of rainfall-
random sample of 100 tweets, including the tweet metadata,          related tweets in a location implies that a rainfall event or
was taken after the filtering and location inference stage had      the impacts of a rainfall event are being experienced, we
taken place from the whole data set for all dates. Each tweet’s     compare our percentile calculations with the events logged
metadata was examined for location references, and this was         in the Met Office community impact database. For each day
cross-referenced with the GADM level 1 location(s) that the         in the study period and location included in the Met Office
tweet was assigned to using the social sensing location infer-      database, we compare the percentile of tweets with whether
ence method. We found that 93 out of 100 tweets in this sam-        or not an event is logged in the database on that day, in that
ple were assigned to the correct location(s), which shows that      place. As we do not currently know the percentile threshold
the location inference method was working well. This is also        that implies an impactful rainfall event is taking place, we
in line with previous studies’ validation of this location infer-   repeat this comparison for different tweet percentile thresh-
ence approach. Applying this location inference approach on         olds between the 65th and 99th percentiles. Where a rainfall
a global scale carries more potential for place names used in       event spans multiple days in the database, we compare the
multiple countries being misassigned by their geographical          percentile of tweets for each day of the event. The results of
coordinates than if working with tweets for a single country.       these comparisons are discussed below.
Therefore, locating tweets with a 93 % accuracy in this study          It is also worth noting the limitations of the Met Office
is considered a good success rate given the potential ambigu-       impact database as a validation source for our Twitter data.
ities.                                                              As noted by Robbins and Titley (2018), the methods used
                                                                    to create the records in the Met Office database use man-
2.3.4    Matching to GADM level 1                                   ual searches of news and social media sources written in En-
                                                                    glish, which does not necessarily lead to an exhaustive list
Once a place is identified, it is matched to the GADM level 1       of all high-impact rainfall events that have occurred across
administrative area polygon that contains it. If a tweet’s lo-      the world. This means that this study is not necessarily a
cation spans multiple GADM level 1 areas, then the con-             validation of ground truth event detection using Twitter but,
tribution of that tweet to the total count is split proportion-     instead, is a triangulation between identified impact events
ally between each area. After processing the location for           using Twitter and the Met Office impact database. In the re-
all tweets, the overall counts of tweets within each GADM           sults that follow, we present outcomes as if the Met Office
level 1 are then collated for each day within the period of         data were ground truth, i.e. where we find a false negative it
study (1 January–30 June 2017).                                     indicates a case where social sensing does not find an event
                                                                    that is found in the Met Office data. The true number of false
2.4     Metrics for comparison of social sensing and Met
                                                                    negatives (events that occurred in reality but are not detected
        Office community impact database
                                                                    by social sensing OR by Met Office data) is unknown.
The number of relevant tweets in each GADM level 1 area
for each day was used to calculate a ranking for all days in
the study period for each location, given as a tweet count per-     3     Results
centile e.g. day X is in the Y th percentile of tweet counts at
location Z. This metric tells us how the number of tweets on        In this section, we first analyse the coverage of the two
a specific day in that location compares with “normal” tweet        data sets (social sensing and manually curated Met Office
activity in that place. We use percentiles in preference to ab-     database). Then we present some illustrative examples to
solute counts of tweets to account for varying prevalence of        show the properties of the two data sources, before giving
tweets in different locations due to either the size of the pop-    a sensitivity analysis on factors affecting the performance of
ulation or the propensity of the local population for using         social sensing, assuming that the Met Office data represents
Twitter. If the number of tweets in a particular location on        the ground truth (note that this is not necessarily the case; we
a particular day is low for that location, the percentile will      return to this assumption in Sect. 4). The final set of results
be low; if the number of tweets is high for that location, the      shown is an assessment of local/global performance of the
percentile will be high. We are interested in locations and         social sensing method.
days where the percentile of tweets is particularly high as
this indicates that there is an unusually high level of Twitter     3.1    Data coverage
discussion about rainfall on that particular day, which in turn
suggests that there is more likely to be a rainfall event tak-      Figure 1 shows a time series of the number of tweets col-
ing place. We might also infer that the higher the percentile       lected per day and the number of tweets retained after filter-
(i.e. the more extreme the number of tweets for that place),        ing the raw data set for relevance. There was unfortunately
the more impactful the event.                                       some server downtime between 16 and 18 March 2017, re-
                                                                    sulting in missing tweets for this time period (grey bar in
                                                                    Fig. 1). These dates are therefore excluded from all further

https://doi.org/10.5194/nhess-21-2407-2021                                  Nat. Hazards Earth Syst. Sci., 21, 2407–2425, 2021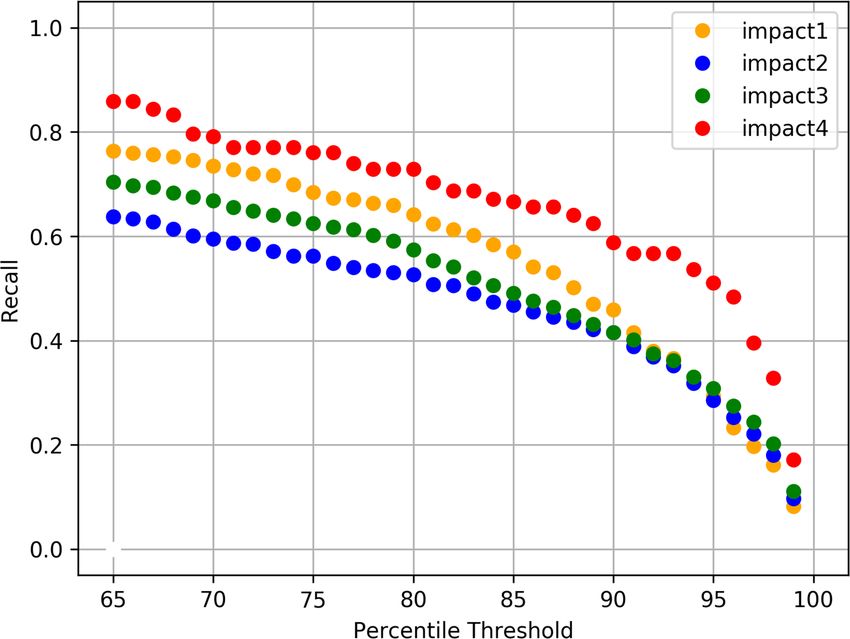
2414                                           M. D. Spruce et al.: Social sensing of high-impact rainfall events worldwide

analysis and comparisons between the Twitter data and the        tribution of peaks in Twitter data correspond to areas of ob-
Met Office database.                                             served rainfall.
   Figure 2 shows the number of tweets in each GADM
level 1 area across the world for the whole study period.        3.2.2   Temporal correspondence between social sensing
The majority of tweets are located within the USA, UK                    and event database outputs
and Australia. This is not surprising given that we have col-
lected tweets containing English language terms, and these       Time series of the volume of tweets for each GADM level 1
are English-speaking countries with a very large number of       area which had an event recorded in the Met Office database
Twitter users. Any areas without any tweets during the study     were examined to determine whether spikes of Twitter ac-
period are shaded white on the map. The figure shows that        tivity correspond to event dates in the Met Office database.
we have good global coverage of discussion about rainfall on     Figure 5 shows an example of this for GADM level 1 areas
Twitter, with at least some tweets in most areas.                in Australia. Events in the Met Office database largely cor-
   Figure 2 also shows the locations of high-impact rainfall     respond with peaks in tweet activity for these regions. It also
events recorded in the Met Office database. Again, there is a    appears that there may be at least one high-impact rainfall
good global spread of events both in English-speaking coun-      event detected by social sensing that is not included in the
tries and countries with speakers of other languages. The        Met Office database. Looking at 9 April 2017, there is a sig-
relevance filters are likely to remove tweets from other lan-    nificantly high number of tweets in Victoria which do not
guages.                                                          correspond to an event in the Met Office database. Investiga-
   Figure 3 shows the number of GADM level 1 areas               tion of news articles and weather reports for this date iden-
which had at least one tweet recorded in the filtered            tified that there was a significant rainfall event on this date
data set (3379/3491 areas) and the number without tweets         that would have met the criteria for inclusion in the Met Of-
(112/3491 areas). GADM areas without tweets were found           fice database. Therefore, this provides an example of where
to be predominantly areas within countries with a low pop-       the use of social sensing could aid with impact event detec-
ulation density (e.g. Angola, Laos and Norway) or island         tion and provide an additional source of impact information.
nations (e.g. the Bahamas, Nauru, Seychelles and Vanuatu).       Other peaks in tweet activity where the volume of tweets is
The areas with and without tweets are also compared with         above the 95th percentile for the region are also labelled as
the number of GADM level 1 areas with an event in the Met        possible high-impact events which might have met the crite-
Office database (224/3491 areas). All GADM level 1 areas         ria for inclusion in the Met Office impact database but were
with an event in the Met Office database had tweets recorded.    missed in the original creation.
None of the areas with zero tweets recorded had an event             Figure 6 shows a similar plot to Fig. 5, but for the United
in the Met Office database. It is striking how many GADM         Kingdom (UK). In this example, there are greater dispari-
level 1 regions have some tweets recorded that talk about ex-    ties between events identified in the Met Office database and
treme rainfall or flooding, compared to the number that have     those identified using the social sensing method.
verified high-impact rainfall events (floods and landslides)         There are a number of rainfall events identifiable from
recorded in the Met Office database. We will return to the       the tweet time series in Fig. 6 which are absent from the
reasons for this disparity in the discussion.                    Met Office database, namely 12–13 January, 23 February,
                                                                 17 May, and 27 June 2017. A significant peak in tweet ac-
3.2     Comparison between social sensing and the Met            tivity (above the 95th percentile) is noted for each of these
        Office database                                          dates, and further investigation of news media and weather
                                                                 reports shows that there were rainfall impacts in the UK on or
                                                                 around these dates. However, not all of the peaks in tweet ac-
The following are illustrative examples that demonstrate the
                                                                 tivity can be attributed to genuine high-impact rainfall events.
properties of the two data sources.
                                                                 For example, the peak in tweet activity seen around the 27–
                                                                 29 May 2017 coincided with a bank holiday weekend in
3.2.1    Spatial correspondence between social sensing           the UK with a weather forecast for bad weather. This gen-
         outputs and precipitation observations                  erated a large amount of news and social media discussion
                                                                 on cancelled events and holiday plans, as well as some travel
For each day in the study period, the percentile of tweets for   disruption, not all of which was related to the weather. This
each GADM level 1 area was mapped. A visual inspection of        provides an example of where social sensing can provide a
each map identified a number of examples of peaks in Twitter     false positive result. False positives could occur for a num-
activity that correlate with observed rainfall. Figure 4 shows   ber of reasons; for example, do smaller, less impactful rain-
an example of a particularly impactful rainfall event in the     fall events in the UK generate more discussion than in other
USA on 30 April 2017. The areas with the highest percentile      countries given that rainfall is quite common there? Or, be-
of tweets appear to correlate well with areas of significant     ing a relatively small country, impacts due to the weather
rainfall. This provides some confidence that the spatial dis-    have the potential to be more localised, affect fewer people

Nat. Hazards Earth Syst. Sci., 21, 2407–2425, 2021                              https://doi.org/10.5194/nhess-21-2407-2021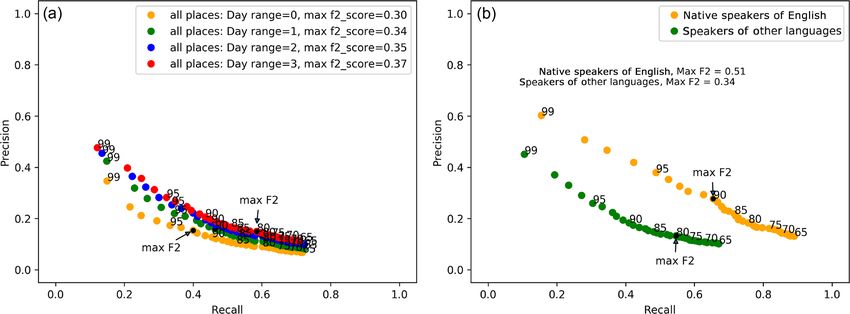
M. D. Spruce et al.: Social sensing of high-impact rainfall events worldwide                                                         2415

Figure 1. Number of tweets collected per day between 1 January and 30 June 2017. Data shown for both the total number of tweets collected
(top line) and the number of tweets retained after filtering for relevance (bottom line). The period where the tweet collection failed (16–
18 March 2017) is shown by a grey bar.

Figure 2. Global map showing the number of filtered heavy rainfall tweets located in each GADM level 1 administrative area during the
period of study (1 January–30 June 2017). Areas with white shading had no located tweets during the period of study; shaded areas had at
least one tweet. Locations of impact events recorded in the Met Office database are shown by black points.

and are, therefore, not as highly severe on the global impact           pacts of rain. We also found a good match between peaks
scale used for the curation of the Met Office database. In this         in tweet activity and events in the Met Office database for
particular example, there is also a question regarding the rel-         some areas (e.g. Australia, some parts of the USA, Malaysia,
evance of a bank holiday in affecting people’s perception of            Saudi Arabia and Angola) and a poorer match for others
risk and impact.                                                        (e.g. UK, India and Haiti). Investigating peaks in tweet ac-
   Examining the illustrative examples above and the time se-           tivity which do not correspond to a recorded event in the Met
ries for other areas (not shown), we found there was a good             Office database, we found that most of these peaks refer to
match between areas with recorded heavy rainfall events and             genuine high-impact rainfall events. These findings suggest
a high percentile of tweet activity relating to rain and the im-        that social sensing of rainfall events can be a useful addition

https://doi.org/10.5194/nhess-21-2407-2021                                     Nat. Hazards Earth Syst. Sci., 21, 2407–2425, 2021
2416                                             M. D. Spruce et al.: Social sensing of high-impact rainfall events worldwide

Figure 3. Bar chart showing the number of GADM level 1 areas (from a total of 3491 areas) with tweets and without tweets, compared with
the number of areas with at least one event in the Met Office database.

Figure 4. (a)The 24 h precipitation (inches; ranging from 0 to 305 mm) for USA on 30 April 2017 (http://www.wpc.ncep.noaa.gov, last
access: 17 December 2020). (b) Map of North America showing the percentile of tweet activity for each GADM level 1 administrative area
on 30 April 2017.

to current manual methods of impact data collection, helping          equal to the chosen percentile threshold (meaning the social
to identify a wider variety and greater number of high-impact         sensing method correctly detects the event). A false nega-
events.                                                               tive would be counted if there is an event in the Met Of-
                                                                      fice database but the percentile of tweets is less than the cho-
3.3     Factors affecting social sensing performance                  sen percentile threshold (i.e. the event was not detected using
                                                                      tweets).
3.3.1    Performance metrics
                                                                                        [true positives]
                                                                      recall =
To understand how the social sensing method is working in                    [true positives] + [false negatives]
terms of links between peaks in Twitter activity (i.e. per-                  [events correctly detected using tweets]
                                                                      =                                                     .      (2)
centile of tweets for a particular area) and events logged in           [events correctly detected] + [events not detected]
the Met Office database, we tested the social sensing method
as an event detector, assuming that the Met Office events             Precision is used to show the proportion of data points a
database represents ground truth. To quantify performance             model says are relevant compared to those which are actu-
and account for the various methodological factors (for ex-           ally relevant (Koehrsen, 2018). In this study, precision shows
ample, the tweet activity percentile threshold used to de-            how accurately the social sensing method finds events in the
cide when an event had occurred), we plotted precision/recall         Met Office database; i.e. if there is a peak in Twitter activ-
curves.                                                               ity in a particular place on a particular day, does this corre-
   Recall is used to show the ability of a model to find all          spond to an event in the Met Office database? Precision is
of the relevant cases in a data set (Koehrsen, 2018). In this         calculated by taking the number of true positives divided by
study, calculating recall indicates how well the social sens-         the number of true positives plus the number of false posi-
ing method finds events in the Met Office database. Recall            tives (Eq. 3). For each day in the study period, a true posi-
is calculated by taking the number of true positives divided          tive would be counted as described for recall above, whereas
by the number of true positives plus the number of false neg-         a false positive would be counted where the percentile of
atives (Eq. 2). For each day in the study period, a true pos-         tweets is greater than or equal to a given percentile thresh-
itive would be counted if there is an event in the Met Of-            old but there is not an event in the Met Office database (event
fice database and the percentile of tweets is greater than or         detected but not actually an event).

Nat. Hazards Earth Syst. Sci., 21, 2407–2425, 2021                                    https://doi.org/10.5194/nhess-21-2407-2021
M. D. Spruce et al.: Social sensing of high-impact rainfall events worldwide 2417
Figure 5. Time series of filtered tweet counts per day for each of the Australian administrative areas with events in the Met Office database.
The period of each heavy rainfall event in the Met Office database is shown by a shaded bar colour coded to the administrative area. The 3 d
after each event is shown by a grey shaded bar. Social sensing events that are not present in the Met Office database are labelled.
find the optimal percentile threshold to signal that a rainfall
[true positives]
precision = event is occurring. The F1 score is defined as the harmonic
[true positives] + [false positives]
mean of precision and recall and aids in tuning a model to
[events correctly detected using tweets]
= . (3) be optimised for both of these metrics (Koehrsen, 2018).
[events correctly detected] + [events incorrectly detected] In this study, we calculate a variation of the F1 score, the
Plotting precision and recall against each other shows how F2 score, which gives a higher weight to recall in its calcula-
well (or not) the social sensing method is replicating the tion (Eq. 4).
Met Office database of recorded events. Recall and precision
Precision · Recall
were therefore calculated for each GADM level 1 adminis- F2 Score = 5 · . (4)
trative areas with an event in the Met Office database. As (4 · Precision) + Recall
we do not know the optimum percentile threshold that would For reference, F2 scores fall in the range [0, 1], with a score
achieve the best social sensing performance, recall and pre- of 1 being perfect recall and perfect precision. As used here,
cision were calculated using tweet percentile thresholds be- we are interested mainly in the change in F2, as different
tween the 65th and 99th percentiles. This will help to deter- parameters are varied, rather than its absolute value.
mine which percentile threshold is optimal for signalling that We choose to favour recall here as we are most interested
an impactful rainfall event is occurring. in how well the social sensing method detects events in the
Further to precision and recall, we also calculated the Met Office database; furthermore, calculations of precision
f score – a metric which takes both precision and recall are somewhat less reliable due to the lack of genuine ground
into account. This is a single score that indicates how well truth data. While the accuracy of the event detection is im-
the social sensing method is working and can be used to portant, we prefer to detect as many events as possible and
https://doi.org/10.5194/nhess-21-2407-2021 Nat. Hazards Earth Syst. Sci., 21, 2407–2425, 20212418 M. D. Spruce et al.: Social sensing of high-impact rainfall events worldwide
Figure 6. Time series of filtered tweets per day for each of the UK administrative areas with events in the Met Office database. The period
of each heavy rainfall event in the Met Office database is shown by a shaded bar colour coded to the administrative area. The 3 d after each
event is shown by a grey shaded bar. Potential missed events in the Met Office database, which are identified in the Twitter data, are labelled.
tolerate occasional peaks in Twitter activity that do not match tley (2018), there can sometimes be a time lag between a
an event in the Met Office database. As previously noted, the rainfall event and impacts of the event being experienced or
Met Office database does not provide a definitive list of all reported. Therefore precision and recall calculations were re-
high-impact rainfall (and secondary hazard) events that have peated for event detection windows of varying duration, i.e.
occurred, and there may well be events missing from this day 0 only, day 0 + day 1 (day + 1), day 0 + day 1 + day 2
database that Twitter can help us detect. In other words, nei- (day + 2) and day 0 + day 1 + day 2 + day 3 (day + 3).
ther data set is perfect, but utilising the positive attributes of Longer time windows were trialled in preliminary work, but
both methods could lead to an enhanced approach for sus- showed no additional benefit; also, longer time windows re-
tainable and robust impact data collection. duce the ability to locate events in time. Figure 7 shows pre-
cision/recall curves for each of these scenarios, showing that
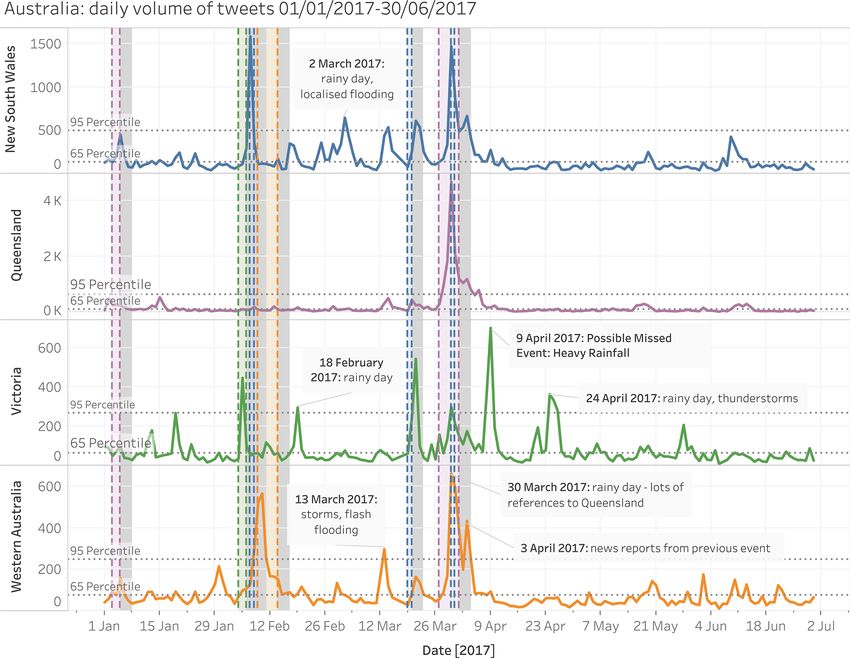
3.3.2 Sensitivity of social sensing performance to event the 3 d window (day + 3) yields the best results.
detection window
3.3.3 Social sensing performance in English-speaking
Figure 7 shows precision and recall calculated for all GADM countries and countries with speakers of other
level 1 areas where an event was recorded in the Met Office languages
database. Each plotted point shows precision and recall for a
given tweet percentile threshold for event detection. Initially, As the tweets collected were in the English language only,
precision and recall were calculated requiring that a peak in we are also interested in whether the social sensing method
tweet activity must exactly match the day of the heavy rain- works better for countries with native speakers of English.
fall event (day 0). However, as identified by Robbins and Ti- Using the precision/recall calculations described above and
Nat. Hazards Earth Syst. Sci., 21, 2407–2425, 2021 https://doi.org/10.5194/nhess-21-2407-2021M. D. Spruce et al.: Social sensing of high-impact rainfall events worldwide 2419
Figure 7. (a) Precision and recall values when comparing tweet data with the Met Office impact database for day 0 only, day + 1, day + 2 and
day + 3 from the impact event date. Each point represents the tweet percentile threshold used to signal true and false positive values for an
event taking place in the Twitter data. Tweet percentile thresholds tested the range from the 65th percentile to the 99th percentile (step size 1).
(b) Precision vs. recall plot for matches (within 3 d of event) to Met Office impact event database vs. tweet percentile thresholds 65–99 (step
size 1) for countries with native speakers of English countries vs. countries with speakers of other languages.
for day range + 3, a precision/recall curve was plotted for
tweets from native English-speaking countries versus other
countries with speakers of other languages. Figure 7 shows
the results of this comparison and that the social sensing
method yields much better results for countries with native
speakers of English with a maximum F2 score of 0.51 com-
pared with 0.34 for countries with speakers of other lan-
guages. The difference in performance is perhaps not surpris-
ing given that tweets were collected with English language
keywords, but it is interesting to note that reasonable perfor-
mance is still achieved in countries with speakers of other
languages.
3.3.4 Social sensing performance at different event
impact levels Figure 8. Recall versus tweet percentile threshold for matches
(within 3 d of event) to the Met Office impact event database for
A further consideration for impact-based forecast evalua- each category of impact severity (where impact severity category 4
represents the most impactful events).
tion is the severity of impacts associated with different (in
this case, hydrometeorological) events. Each event logged in
the Met Office impact database is assigned a category from 3.4 Social sensing performance around the world
1 (least severe) to 4 (most severe; Table 1). To see how effec-
tive the social sensing method is for events with different lev- Having considered some of the factors which affect the per-
els of impact, we plot recall (the number of events in the Met formance of the social sensing methodology, we now exam-
Office database that are matched by peaks in Twitter activ- ine how well social sensing performs in different geographic
ity) for different impact severity categories. Figure 8 shows regions around the world. To do this, we first look at the
recall across a range of percentile thresholds for each impact choice of percentile threshold for different places, then the
severity category. This shows that events with the most severe dependence of social sensing on tweet volumes, before fi-
impacts (severity category 4) are more likely to be picked up nally examining performance in different GADM level 1 re-
by the social sensing method. Surprisingly, the least impact- gions. Again, we assume that the manually curated Met Of-
ful events (severity category 1) achieve the next-best recall. fice impact database is a ground truth, while acknowledging
This plot also shows us that as the percentile threshold is in- that the actual ground truth is unknown.
creased, recall decreases (i.e. more events are missed at the
higher percentile thresholds). More on finding the optimum
tweet percentile threshold for the social sensing method will
be discussed later in Sect. 3.4.
https://doi.org/10.5194/nhess-21-2407-2021 Nat. Hazards Earth Syst. Sci., 21, 2407–2425, 2021You can also read