Sierra Nevada Memorial Hospital
2013 Community Health Needs Assessment
←
→
Page content transcription
If your browser does not render page correctly, please read the page content below
Sierra Nevada Memorial Hospital 2013 Community Health Needs Assessment
2

                                    Acknowledgements

The community health assessment research team would like to thank all those that contributed
to the community health assessment described herein. First, we are deeply grateful for the
many key informants that gave us their time and expertise to inform both the direction and
outcomes of the study. Additionally, many community residents volunteered their time as focus
group participants to give our research team a first-hand perspective of living within the
communities served by Sierra Nevada Memorial Hospital.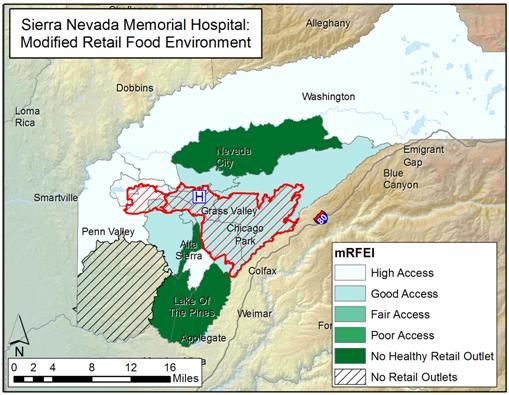
3
Executive Summary
Every three years nonprofit hospitals are required to conduct Community Health Needs
Assessments (CHNA), and use the results of these to develop community health improvement
implementation plans. This is a state and federal requirement for all nonprofit hospitals.
Beginning in early 2012 through February 2013 an assessment of the health needs of residents
living in Sierra Nevada Memorial Hospital’s service area was completed by Valley Vision, Inc. For
the purposes of the assessment, a health need was defined as: “a poor health outcome and its
associated driver.” A health driver was defined as: “a behavioral, environmental, and/or clinical
factor, as well as more upstream social economic factors, that impact health.”
The objective of the CHNA was:
To provide necessary information for Sierra Nevada Memorial Hospital’s community
health improvement plan, identify communities and specific groups within these
communities experiencing health disparities, especially as these disparities relate to
chronic disease, and further identify contributing factors that create both barriers and
opportunities for these populations to live healthier lives.
A community-based participatory research orientation was used to conduct the assessment
that included both primary and secondary data. Primary data collection included input from
seven key informants and one focus group interview. In addition, a community health assets
assessment collected data on nearly 40 assets within Sierra Nevada Memorial Hospital’s service
area. Secondary data used included health outcome data, socio-demographic data, and
behavioral and environmental data at the zip code or census tract level. Health outcome data
included Emergency Department (ED) visits, hospitalization, and mortality rates related to heart
disease, diabetes, stroke, hypertension, chronic obstructive pulmonary disease, asthma, and
safety and mental health conditions. Socio-demographic data included race and ethnicity,
poverty (female-headed households, families with children, people over 65 years of age),
educational attainment, insurance status, and housing status (own or rent). Behavioral and
environmental data helped describe general living conditions of the hospital service area (HSA)
such as crime rates, access to parks, availability of healthy food, and leading causes of death.
Analysis of both primary and secondary data revealed two specific Communities of Concern in
Sierra Nevada Memorial Hospital’s HSA living with a high burden of disease. These Communities
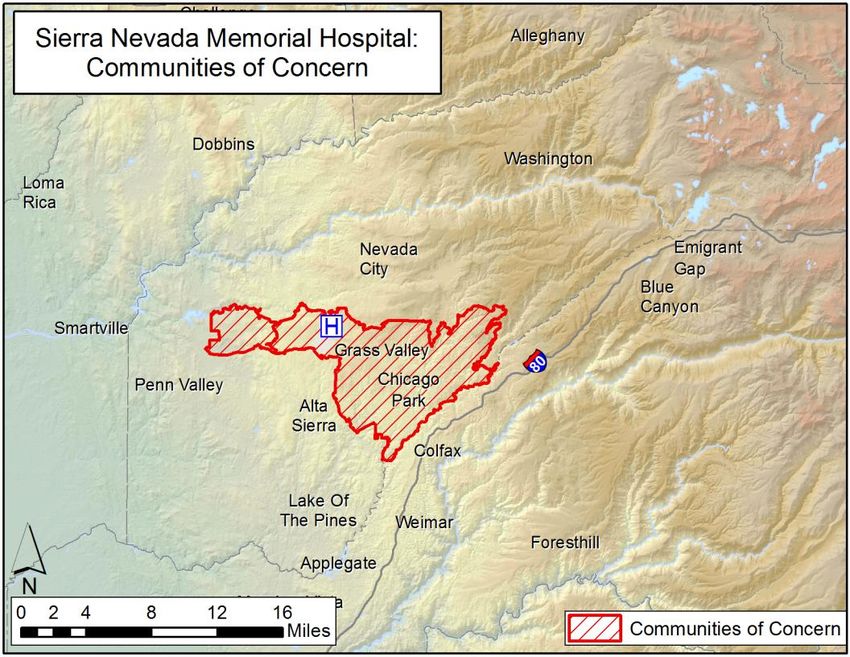
of Concern are shown in Figure 1 below. While many of the socio-demographic characteristics
and health outcome variables indicate these two areas as highly vulnerable with high rates of
negative health outcomes, there are pockets within other zip codes in the HSA that display
similar characteristics and health outcomes. Therefore, it should be stated that other
Communities of Concern reside outside of these two zip codes and are dispersed throughout
the HSA, but are not necessarily easily identified by zip code boundaries.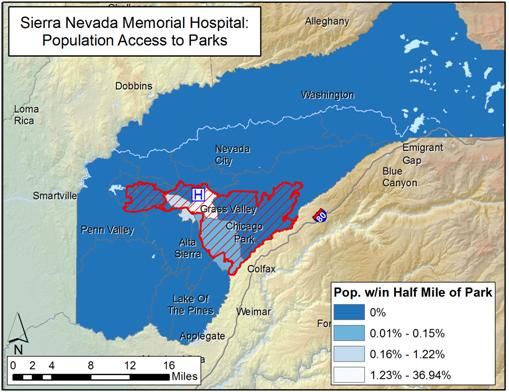
4

         Figure 1: Sierra Nevada Memorial Hospital Communities of Concern

Health Outcome Indicators

Age-adjusted rates of ED visits and hospitalization due to heart disease, diabetes, and
hypertension were higher in these zip codes compared to other zip codes in the HSA. Rates of
stroke were particularly high in the Grass Valley zip code. Mortality data for these conditions
showed high rates as well, and again, particularly high in the Grass Valley zip code.

Environmental and Behavioral Indicators

Analysis of environmental indicators showed that many of these communities had conditions
that inhibited active lifestyles, such as elevated rates of crime, and pedestrian and biking
conditions that were perceived as unsafe. Additionally, these communities frequently had
higher percentages of residents who were obese or overweight and had limited access to
healthy food outlets due to higher concentrations of fast food and convenience stores. Analysis
of the health behaviors of these residents also show many behaviors that correlate to poor
health, such as having a diet that is limited in fruit and vegetable consumption.

Priority Health Needs

When examining these findings with those of the qualitative data (key informant interview and
focus groups), a consolidated list of priority health needs of these communities was compiled.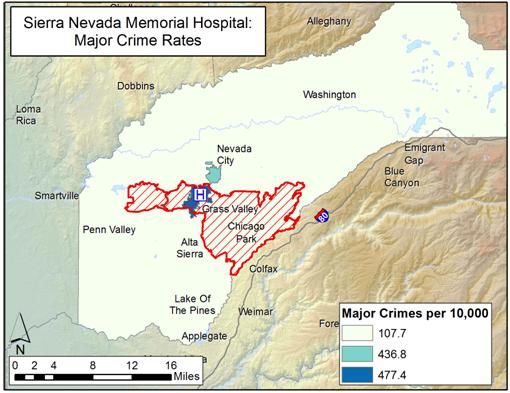
5

These priority health needs are shown below. The complete list of health needs for the Sierra
Nevada Memorial Hospital’s service area can be found in Appendix G.

   •   Lack of access to primary care and preventive services
   •   Lack of integration of behavioral health and primary care
   •   Transportation issues and limitations
   •   Limited access to healthy foods, food security
   •   Lack of access to specialty care
   •   Lack of dental care
   •   Lack of access to mental health services
   •   Eligibility requirements for Medi-Cal and other social services
   •   Lack of access to outdoor and recreational activities
   •   Lack of access to physical therapy
6

                                                               Table of Contents

Executive Summary ................................................................................................................................ 3
Table of Contents ................................................................................................................................... 6
List of Figures ......................................................................................................................................... 7
List of Tables .......................................................................................................................................... 8
Introduction ........................................................................................................................................... 9
Assessment Collaboration and Assessment Team................................................................................. 9
“Health Need” and Objectives of the Assessment .............................................................................. 10
Organization of the Report .................................................................................................................. 10
Methodology........................................................................................................................................ 10
   Community Based Participatory Research (CBPR) Approach .......................................................... 11
   Unit of Analysis and Study Area ....................................................................................................... 11
   Identifying Hospital Service Area (HSA) ........................................................................................... 11
   Primary Data - The Community Voice ............................................................................................. 12
   CHNA Workgroup............................................................................................................................. 12
   Key Informant Interviews ................................................................................................................ 12
   Focus Groups ................................................................................................................................... 13
   Community Health Assets................................................................................................................ 13
   Selection of Data Criteria ................................................................................................................. 13
   Data Analysis .................................................................................................................................... 15
      Identifying Vulnerable Communities ........................................................................................... 15
      Where to Focus Community Member Input? Focus Group Selection ........................................ 16
      Identifying “Communities of Concern”: the First step in Prioritizing Area Health Needs........... 16
      What is the Health Profile for Communities of Concern? What are the Prioritized Health Needs
      of the Area? ................................................................................................................................. 16
Findings ................................................................................................................................................ 17
   Socio-demographic profile of Communities of Concern ................................................................ 17
   Priority Health Needs for Sierra Nevada Memorial Hospital .......................................................... 18
   Health Outcomes ............................................................................................................................. 18
      Diabetes, Heart Disease, Stroke, and Hypertension ................................................................... 18
      Mental Health and Substance Abuse .......................................................................................... 20
      Respiratory Illness: Chronic Obstructive Pulmonary Disease (COPD) and Asthma ..................... 22
      Behavioral and Environmental .................................................................................................... 23
         Safety Profile ........................................................................................................................... 23
         Crime Rates.............................................................................................................................. 23
         Assault and Unintentional Injury ............................................................................................. 24
         Unintentional Injury ................................................................................................................ 24
         Fatality/Traffic Accidents......................................................................................................... 25
         Food Environment ................................................................................................................... 26
         Active Living ............................................................................................................................. 27
         Physical Wellbeing ................................................................................................................... 28
         Health Assets Analysis ............................................................................................................. 29
Limitations............................................................................................................................................ 29
Conclusion ............................................................................................................................................ 30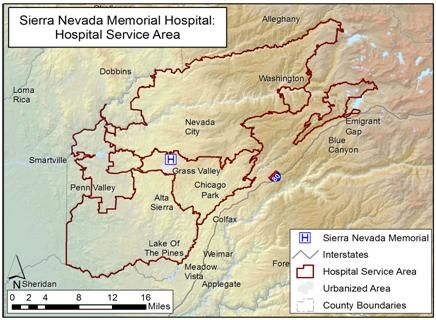
7

                                                                List of Figures

Figure 1: Sierra Nevada Memorial Hospital Communities of Concern .......................................... 4
Figure 2: Map of the Sierra Nevada Memorial Hospital service area........................................... 12
Figure 3: Sierra Nevada Memorial Hospital service area map of vulnerability ............................ 15
Figure 4: Analytical framework for determination of Communities of Concern and health Needs
     ............................................................................................................................................... 16
Figure 5: Majors crimes by municipality as reported by California Attorney General’s Office,
     2010 ...................................................................................................................................... 23
Figure 6: Traffic accidents resulting in fatalities as reported by the National Highway
     Transportation Safety Administration, 2010 ........................................................................ 25
Figure 7: Modified Retail Food Environment Index (mRFEI) by census tracts for SNMH HSA ..... 27
Figure 8: Percent population living in census tract within one-half mile of park space (per
     10,000) .................................................................................................................................. 28
8

                                                               List of Tables

Table 1: Health outcome data used in the CHNA reported as ED visits, hospitalization, and
     mortality................................................................................................................................ 14
Table 2: Socio-demographic, behavioral, and environmental data profiles used in the CHNA ... 14
Table 3: Identified Communities of Concern for SNMH HSA........................................................ 17
Table 4: Socio-demographic characteristics for SNMH Communities of Concern compared to
     national and state benchmarks ............................................................................................ 17
Table 5: Mortality, ED visit, and hospitalization rates for diabetes compared to state, county,
     and Healthy People 2020 benchmarks (rates per 10,000 population) ................................ 19
Table 6: Mortality, ED visit, and hospitalization rates for heart disease compared to state,
     county, and Healthy People 2020 benchmarks (rates per 10,000 population) ................... 19
Table 7: Mortality, ED visit, and hospitalization rates for stroke compared to state, county, and
     Healthy People 2020 benchmarks (rates per 10,000 population) ....................................... 20
Table 8: ED visit and hospitalization rates for hypertension compared to state and county
     benchmarks (rates per 10,000 population) .......................................................................... 20
Table 9: ED visit and hospitalization rates due to mental health issues compared to county and
     state benchmarks (rates per 10,000 population) ................................................................. 21
Table 10: ED Visit and hospitalization rates due to self-inflicted injury compared to specific
     county and state benchmarks (rates per 10,000 population) .............................................. 21
Table 11: ED visit and hospitalization rates due to substance abuse issues compared to county
     and state benchmarks (rates per 10,000 population) .......................................................... 22
Table 12: ED Visits and Hospitalization due to COPD, asthma, and bronchitis compared to
     county and state benchmarks (rates per 10,000 population) .............................................. 22
Table 13: ED Visit and hospitalization rates due to asthma compared to county and state
     benchmarks (rates per 10,000 population) .......................................................................... 22
Table 14: ED Visit and hospitalization rates due to assault compared to county and state
     benchmarks (rates per 10,000 population) .......................................................................... 24
Table 15: Mortality, ED visit, and hospitalization rates due to unintentional injury compared to
     county and state benchmarks (rates per 10,000 population) .............................................. 24
Table 16: ED visit and hospitalization rates for accidents compared to county and state
     benchmarks (rates per 10,000 population) .......................................................................... 26
Table 17: Percent obese, percent overweight, percent not eating at least five fruits and
     vegetables daily, presence (X) or absence (-) of federally defined food deserts, and number
     of farmers markets ............................................................................................................... 26
Table 18: Age-adjusted all-cause mortality rate, life expectancy at birth, and infant mortality
     rate (all cause mortality rate per 10,000 population; infant mortality rate per 1,000 live
     births) .................................................................................................................................... 29
9
Introduction
In 1994, SB697 was passed by the California legislature. The legislation states that hospitals, in
exchange for their tax-exempt status, "assume a social obligation to provide community
benefits in the public interest.” The bill legislates that hospitals conduct a Community Health
Needs Assessment (CHNA) every three years. Based on the results of this assessment, hospitals
must develop a community benefit plan detailing how they will address the needs identified in
the CHNA. These plans are submitted to the Office of Statewide Health Planning and
Development (OSHPD), and are available to the public for review. The state law exempted
some hospitals from the requirement, such as small, rural hospitals as well as hospitals that are
parts of larger educational systems.
In early 2010, the Patient Protection and Affordable Care Act was enacted. Similar to SB697, the
law requires nonprofit hospitals to conduct CHNAs every three years. Results of these
assessments are used by hospitals to develop community health improvement implementation
plans. Nonprofit hospitals are required to submit these annually as part of their Internal
Revenue Service (IRS) Form 990. Unlike California’s SB697, the federal law extends the
requirements to all hospitals operating in the U.S., and defines a hospital organization as “an
organization that operates a facility required by a state to be licensed, registered, or similarly
recognized as a hospital,” and “any other organization that the Secretary determines has the
provision of hospital care as its principal function or purpose constituting the basis for its
exemption under section 501(c)(3).”
In accordance with these legislative requirements, Sierra Nevada Memorial Hospital’s CHNA
was conducted through a participatory process led by Valley Vision, Inc.
Collaborative Assessment Team
Four nonprofit health systems, serving the same or portions of the same communities,
collaborated to sponsor and participate in the CHNA. This collaborative group retained Valley
Vision, Inc., to lead the assessment process. Valley Vision (www.valleyvision.org) is a non-profit
501(c)(3) research and consulting firm serving a broad range of communities across Northern
California. The organization’s mission is to improve quality of life through the delivery of high-
quality research on important topics such as healthcare, economic development, and
sustainable environmental practices. Using a community-based participatory orientation to
research, Valley Vision has conducted multiple CHNAs across an array of communities for over
seven years. As the lead consultant, Valley Vision assembled a team of experts from multiple
sectors to conduct the assessment, including: 1) a public health expert with over a decade of
experience in conducting CHNAs, 2) a geographer with expertise in using GIS technology to map
health-related characteristics of populations across large geographic areas, and 3) additional
public health practitioners and consultants to collect and analyze data.10
“Health Need” and Objectives of the Assessment
The CHNA was anchored and guided by the following objective:
In order to provide necessary information for the Sierra Nevada Memorial Hospital
community health improvement plan, identify communities and specific groups within
these communities experiencing health disparities, especially as these disparities relate
to chronic disease, and further identify contributing factors that create both barriers and
opportunities for these populations to live healthier lives.
The World Health Organization defines health needs as “objectively determined deficiencies in
health that require health care, from promotion to palliation.” Building on this and the
definitions compiled by Kaiser Permanente, the CHNA used the following definitions for health
need and driver:
Health Need: A poor health outcome and its associated driver.
Health Driver: A behavioral, environmental, and/or clinical factor, as well as more
upstream social economic factors, that impact health
Organization of the Report
The following pages contain the results of the needs assessment. The report is organized
accordingly: first, the methodology used to conduct the needs assessment is described. Here,
the study area, or hospital service area (HSA), is identified and described, data and variables
used in the study are outlined, and the analytical framework used to interpret these data is
articulated. Further description of the methodology, including descriptions and definitions, is
contained the appendices.
Next, the study findings are provided, beginning with identified geographical areas described as
Communities of Concern , which were identified within an HSA as having negative health
outcomes and socio-demographic characteristics, often referred to as social determinants of
health, which contribute to poor health. Each Community of Concern is described in terms of its
health outcomes and population characteristics, as well as health behaviors and environmental
conditions. Behavioral and environmental conditions are organized into four profiles: safety,
food environment, active living, and physical wellbeing. The report closes with a brief
conclusion.
Methodology
The assessment used a mixed methods data collection approach that included primary data
such as key informant interviews, community focus groups, and a community assets11 assessment. Secondary data included health outcomes, demographic data, behavioral data, and environmental data. The complete data dictionary is available in Appendix B. Community Based Participatory Research (CBPR) Approach The assessment followed a community-based participatory research (CBPR) approach for identification and verification of results at every stage of the assessment. This orientation aims at building capacity and enabling beneficial change within the hospital CHNA workgroup and the community members for which the assessment was conducted. Including participants in the process allows for a deeper understanding of the results. Unit of Analysis and Study Area The study area of the assessment included Sierra Nevada Memorial Hospital’s service area. A key focus was to show specific communities (defined geographically) experiencing disparities as they related to chronic disease and mental health. To this end, zip code boundaries were selected as the unit-of-analysis for most indicators. This level of analysis allowed for examination of health outcomes at the community level that are often hidden when data are aggregated at the county level. Some indicators (demographic, behavioral, and environmental in nature) were included in the assessment at the census tract, census block, or point prevalence level, which allowed for deeper community level examination. Identifying Hospital Service Area (HSA) The HSA was determined by analyzing patient discharge data. Sierra Nevada Memorial Hospital and other Dignity Health hospitals define the community as the geographic area served by a hospital, which is considered the primary service area. This is based on a percentage of hospital discharges and is also used in various other departments of the system and hospital, including strategy and planning. Sierra Nevada Memorial Hospital’s service area defined as the focus for the needs assessment is depicted in Figure 2.
12

       Figure 2: Map of the Sierra Nevada Memorial Hospital Service Area

Primary Data - The Community Voice

Primary data collection included qualitative data gathered in four ways:

   •   Input from the Dignity Health community benefit team
   •   Key informant interviews with area health and community experts
   •   Focus groups with area community members
   •   Community health asset collection via phone interviews and website analyses

CHNA Workgroup

The CHNA workgroup, comprised of community benefit representatives of Dignity Health,
Kaiser Permanente, Sutter Health Sacramento Sierra Region, and the UC Davis Health System,
was an active contributor to the CHNA process. Using the previously described CBPR approach,
monthly meetings were held with the workgroup at each critical stage in the assessment
process. This data, combined with demographical data, informed the location and selection of
key informant interviews for the assessment

Key Informant Interviews

Key informants are health and community experts familiar with populations and geographic
areas residing within the HSA. To gain a deeper understanding of the health issues pertaining to
13
chronic disease and the populations living in these vulnerable communities, input from seven
key informant interviews were conducted using a theoretically grounded interview guide (see
interview protocol in Appendix D). Each interview was recorded and content analysis was
conducted to identify key themes and important points pertaining to each geographic area.
Findings from these interviews were used to help identify communities in which focus groups
would most aptly be performed. A list of all key informants interviewed, including name,
professional title, date of interview, and a description of their knowledge and experience is
detailed in Appendix C.
Focus Groups
Members of the community representing subgroups, defined as groups with unique attributes
(race and ethnicity, age, sex, culture, lifestyle, or residents of a particular area of the HSA), were
recruited to participate in a focus group. A standard protocol was used for the focus group (see
Appendix F) to understand the experiences of these community members as they relate to
health disparities and chronic disease. One focus group was conducted that included 12
community member participants. Content analysis was performed on the focus group interview
notes to identify salient health issues affecting these community residents.
Community Health Assets
Data were collected on health programs and support services within the HSA and the specific
Communities of Concern. Existing resource directories were explored, and then additional
assets were identified through Internet and related searches. A list of assets was compiled and
a master list was created. Next, detailed information for each asset was gathered though scans
of the organization websites and, when possible, direct contact with staff via phone. The assets
are organized by zip code with brief discussion in the body of the report and detailed in
Appendix H.
Selection of Data Criteria
Criteria were established to help identify and determine all data to be included for the study.
Data were included only if they met the following standards:
• All data were to be sourced from credible and reputable sources
• Data must be consistently collected and organized in the same way to allow for future
trending
• Data must be available at the zip code level or smaller
County, state and Healthy People 2020 targets (when available) were used as benchmarks to
determine severity. All rates are reported per 10,000 of population unless noted otherwise.
Health outcome indicator data were adjusted using Empirical Bayes Smoothing, where possible,
to increase the stability of estimates by reducing the impact of the small number problem. To
provide relative comparison across zip codes, rates of ED visits and hospitalization for heart14
disease, diabetes, hypertension, and stroke were age adjusted to reduce the influence of age.
Appendix B contains a detailed methodology of all data processing and data sources.
Secondary quantitative data used in the assessment include those listed in Tables 1 and 2:
Table 1: Health outcome data used in the CHNA reported as ED visits, hospitalization, and
mortality
ED and Hospitalization Mortality
Accidents Hypertension* All-Cause Mortality* Infant Mortality
Asthma Mental Health Alzheimer’s Disease Injuries
Assault Substance Abuse Cancer Life Expectancy
Chronic Lower
Cancer Stroke* Liver Disease
Respiratory Disease
Chronic Obstructive
Unintentional Injuries Diabetes Renal Disease
Pulmonary Disease
Self-inflicted injury
Diabetes* Heart Disease Stroke
Heart Disease* Hypertension Suicide
*Age adjusted by 2010 California standard population
Table 2: Socio-demographic, behavioral, and environmental data profiles used in the CHNA
Socio-Demographic
Total Population Limited English Proficiency
Family Make-up Percent Uninsured
Poverty Level Percent over 25 with No Nigh School Diploma
Age Percent Unemployed
Race/Ethnicity Percent Renting
Behavioral and Environmental Profiles
Safety Profile Food Environment Profile
• Major Crime • Percent Obese/Percent Overweight
• Assault • Fruit and Vegetable Consumption
• Unintentional Injury (≥5/day)
• Fatal Traffic Accidents • Farmers Markets
• Accidents • Food Deserts
• modified Retail Food Environment Index
(mRFEI)
Active Living Profile Physical Wellbeing Profile
• Park Access • Age-adjusted Overall Mortality
• Life Expectancy
• Infant Mortality
• Health Care Professional Shortage
Areas
• Health Assets15
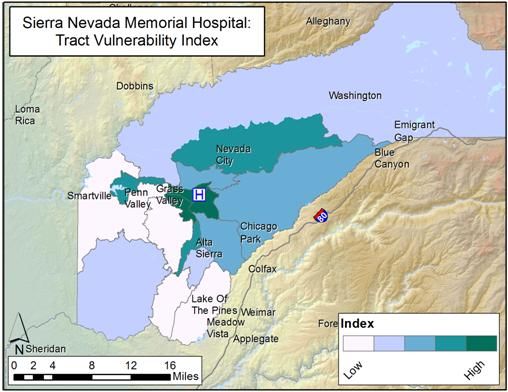
Data Analysis
Identifying Vulnerable Communities
The first step in the process was to examine socio-demographics in order to identify areas of
the HSA with high vulnerability to chronic disease disparities and poor mental health outcomes.
Race/ethnicity, household make-up, income, and age variables were combined into a
vulnerability index that described the level of vulnerability of each census tract. This index was
then mapped for the entire HSA. A tract was considered more vulnerable, or more likely to
have higher unwanted health outcomes than others in the HSA, if it had a higher: 1) percent
Hispanic or non-White population; 2) percent single parent headed households; 3) percent
below 125% of the poverty level; 4) percent under five years old; and 5) percent 65 years of age
or older living in the census tract. This information was used in combination with input from
the CHNA workgroup to identify prioritized areas for which key informants would be sought.
Figure 3 displays the vulnerability index for Sierra Nevada Memorial Hospital’s service area.
Figure 3: Sierra Nevada Memorial hospital service area map of vulnerability
Where to Focus Community Member Input? Focus Group Selection
The selection for the focus group was determined by feedback from key informants and
analysis of health outcome indicators (ED visits, hospitalization, and mortality rates). Due to the16
barriers of low population density and lack of spaces for community members to congregate,
qualitative data collection emphasized key informants that serve area residents over focus
groups.
Identifying “Communities of Concern”: the First step in Prioritizing Area Health Needs
To identify Communities of Concern, primary data from key informant interviews, detailed
analysis of secondary data, health outcome indicators, and socio-demographics were examined.
Zip code communities with rates that exceeded county, state, or Healthy People 2020
benchmarks for ED utilization, hospitalization, or mortality were considered. The health
outcome data analysis was triangulated with primary data and socio-demographic data to
identify specific Communities of Concern. This analytical framework is depicted in the figure
below.
Socio-Demographics ED and Hospitalization
(Index of
Vulnerability)
Communities Mortality Health Needs
ED and Hospitalization (Drivers and
of
Concern Key Informants Associated
Key Informant Input Outcomes)
Focus Groups
Mortality
Health Behavior
Environmental
Characteristics
Figure 4: Analytical framework for determination of Communities of Concern and Health Needs
What is the Health Profile of the Communities of Concern? What are the Prioritized Health
Needs of the Area?
Data on socio-demographics of residents living in these communities, which included socio-
economic status, race and ethnicity, educational attainment, housing status, employment
status, and health insurance status, were examined. Area health needs were determined via in
depth analysis of qualitative and quantitative data, and then confirmed by socio-demographic
data. As noted earlier, a health need was defined as a poor health outcome and its associated
driver. A health need was included as a priority if it was represented by rates worse than the
established quantitative benchmarks, or was consistently mentioned in the qualitative data.17
Findings
Analysis of data revealed two Communities of Concern listed in Table 3.
Table 3: Identified Communities of Concern for Sierra Nevada Memorial Hospital’s Service Area
Zip Community Name County 2010 Population*
95945 Grass Valley Nevada 25,199
95975 Rough and Ready Nevada 1,769
Total population 26,968
(*Source: 2010 Census data)
The HSA is made up of six zip codes in the western part of Nevada County and is home to
approximately 75,000 residents. Based on an analysis of socio-demographic characteristics and
health outcome data at the zip code level, 95945 and 95975 were identified as Communities of
Concern. Nearly 27,000 residents live in these two zip code Communities of Concern. While
many of the socio-demographic characteristics and health outcome variables indicate that
these areas as highly vulnerable and have high rates of negative health outcomes, there are
pockets within other zip codes in the HSA that display similar characteristics and health
outcomes. Therefore, it should be stated that other Communities of Concern exist outside of
these two zip codes and are dispersed throughout the HSA, but are not easily identified by zip
code boundaries (e.g. elderly who may live in or near of Nevada City or low-income families
that reside in or near Penn Valley).
Socio-demographic Profile of Communities of Concern
Table 4 below displays data that serve to describe the socio-demographic profile of the two zip
code Communities of Concern. Unless otherwise stated, values and rates in bold indicate those
that exceed any of the reported benchmarks.
Table 4: Socio-demographic characteristics for Communities of Concern compared to national
and state benchmarks
% over 25 with no
% pop over age 5
with limited Eng.
% Households in
poverty over 65
poverty w/ kids
poverty female
% Unemployed
% Non-White
% Families in
% Families in
% No health
% Residents
high school
insurance
Hispanic
diploma
Renting
headed
headed
95945 7.4 13.9 30.9 7.6 14.9 0.9 8.1 24.6 49.7
95975 12.0 16.2 26.1 6.0 18.7 0.1 15.5 23.5 19.8
National 8.7 15.1 31.2 12.9 -- 8.7 7.9 16.3 --
State -- -- -- 19.4 -- -- 9.8 21.6 --
(Source: Dignity Health Community Benefit, CNI data, 2011)18 An examination of social determinants of health indicated that both zip codes displayed rates that exceeded certain benchmarks. For example, 95975 had 16% unemployment, surpassing both the state and national rates. Zip code 95975 had 12% of households over 65 living in poverty and 16% of households of families living in poverty, both higher than national benchmarks. Both zip codes had a higher rate of residents without health insurance compared to the state and national benchmarks, with 95945 at 25% and 95975 at 23%. Priority Health Needs for Sierra Nevada Memorial Hospital The health needs identified through analysis of both quantitative and qualitative data are listed below. All needs are noted as a “health driver,” or a condition or situation that contributed to a poor health outcome. Health outcome results follow the list below. See Appendix G for a detailed list of health needs, including health outcomes and their associated drivers, identified within the HSA. • Lack of access to primary care and preventive services • Lack of integration of behavioral health and primary care • Transportation issues and limitations • Limited access to healthy foods, food security • Lack of access to specialty care • Lack of dental care • Lack of access to mental health services • Eligibility requirements for Medi-Cal and other social services • Lack of access to outdoor and recreational activities • Lack of access to physical therapy Health Outcomes Diabetes, Heart Disease, Stroke, and Hypertension Diabetes, heart disease, stroke, and hypertension were consistently mentioned in the qualitative data as conditions affecting many area residents. When asked about the biggest health issues within the community, one key informant stated, “… diabetes, hypertension, heart disease are big players for us. As you get into folks from financially disadvantaged areas you start to get higher incidents of things like diabetes, obesity, those kind of things” (KI_Nevada_1). An examination of health outcome data related to these conditions is shown in the following tables.
19

Table 5: Mortality, ED visit, and hospitalization rates for diabetes compared to county, state and
Healthy People 2020 benchmarks (rates per 10,000 population)
                          Zip Code              Mortality          ED Visits      Hospitalization
                            95945                   1.9              228.9            153.8
                            95975                   2.1              111.3            99.9
    Diabetes          Nevada County                 1.6              126.9             95.1
                          CA State                  1.8              188.4            190.9
                    Healthy People 2020            6.6                 --               --
(Sources: Mortality, CDPH 2010; ED visits and hospitalization, OSHPD, 2011)

An examination of mortality due to diabetes reveals both zip codes have rates higher than
county and state benchmarks. Zip code 95945 had a rate of ED visits due to diabetes of 228.9
per 10,000, clearly higher than Nevada County’s rate of 126.9 per 10,000. Rates in 95945 were
drastically higher in Blacks with 2260.0 diabetes related ED visits per 10,000, compared to
Whites with 309.4 visits, and Hispanics with 197.4 visits. Whites were the only group to have a
rate of ED visits related to diabetes in 95975 with 144.0 visits per 10,000, above the county
benchmark. The rate of hospitalizations due to diabetes in 95945 was highest in Blacks with
451.4 per 10,000, a rate more than twice the state benchmark. The rate for ED visits in Whites
was 267.0 per 10,000 in this zip code. Again, Whites were the only group to have a higher rate
of hospitalizations due to diabetes in the 95975 zip code; 141.2 per 10,000.

Table 6: Mortality, ED visit, and hospitalization rates for heart disease compared to county,
state and Healthy People 2020 benchmarks (rates per 10,000 population)
                          Zip Code              Mortality          ED Visits     Hospitalization
                            95945                  33.4              103.4             243.9
                            95975                  14.0               68.8             185.5
                      Nevada County                15.2               69.7             177.7
  Heart Disease
                          CA State                 11.5               93.1             218.4
                       Healthy People
                             2020                  10.1                --               --
(Sources: Mortality, CDPH 2010; ED visits and hospitalization, OSHPD, 2011)

Mortality due to heart disease was more than twice the county rate in zip code 95945, at 33.4
per 10,000 compared to 15.2 per 10,000. Zip code 95945 also had higher rates of ED visits and
hospitalizations due to heart disease compared to county and state benchmarks. Rates for ED
visits related to heart disease in 95945 were highest in Whites, with 205.6 visits, followed by
Asian Pacific Islanders with 47.2 visits, and Native Americans with 40.7 visits. Whites were the
only group to have a rate of ED visits related to heart disease in 95975, with 118.6 visits per
10,000. The rate of hospitalizations due to heart disease in 95945 was highest in Whites, with
291.6 visits per 10,000, compared to the rate for Hispanics, with 112.0 visits per 10,000.
20
Table 7: Mortality, ED visit, and hospitalization rates for stroke compared to county, state and
Healthy People 2020 benchmarks (rates per 10,000 population)
Zip Code Mortality ED Visits Hospitalization
95945 10.5 15.9 56.1
95975 3.9 11.0 45.3
Stroke
Nevada County 6.0 12.6 45.0
CA State 3.5 16.2 51.8
Healthy People 2020 3.4 -- --
(Sources: Mortality, CDPH 2010; ED visits and hospitalization, OSHPD, 2011)
While both Communities of Concern demonstrated mortality rates due to stroke that surpassed
the state benchmark, zip code 94945 had a mortality rate due to stroke that was three times
the state rate. An examination of rates of ED visits and hospitalizations for stroke showed that
rates in 95945 exceeded Nevada County rates.
Table 8: ED visit and hospitalization rates for hypertension compared to county and state
benchmarks (rates per 10,000 population)
ZIP Code ED Visits Hospitalization
95945 308.6 395.8
Hypertension 95975 210.4 251.2
Nevada County 192.6 275.0
CA State 365.6 380.9
(Source: OSHPD, 2011)
Both Communities of Concern had rates of ED visits for hypertension higher than the Nevada
County rate. Zip code 95945 also had a rate of hospitalization for hypertension that surpassed
the state rate.
Mental Health and Substance Abuse
Area experts and community members consistently reported the struggle HSA residents had at
maintaining positive mental health and accessing treatment for mental illness. Such struggles
ranged from overall daily coping in the midst of personal and financial pressures, to the
management of severe mental illness requiring needed in-patient treatment and medications
for care. Table 9 provides data on ED visits and hospitalizations related to mental health.21
Table 9: ED visit and hospitalization rates due to mental health issues compared to county and
state benchmarks (rates per 10,000 population)
Zip Code ED Visits Hospitalization
95945 241.0 352.7
Mental Health
95975 57.5 128.0
(overall)
Nevada County 131.7 192.8
CA State 130.9 182.1
(Source: OSHPD, 2011)
Community of Concern zip code 95945 had rates of ED visits and hospitalizations for mental
health issues that nearly twice exceeded county and state benchmarks.
In addition to mental health issues, rates of ED visits and hospitalization due to self-inflicted
injury were examined.
Table 10: ED Visit and hospitalization rates due to self-inflicted injury compared to specific
county and state benchmarks (rates per 10,000 population)
Zip Code ED Visits Hospitalization
95945 15.6 9.1
Self-Inflicted
95975 0.0 4.6
Injury
Nevada County 9.1 6.2
CA State 7.9 4.4
(Source: OSHPD, 2011)
Area experts mentioned isolation as a concern for people at risk of suicide. Zip code 95945 had
rates of ED visits and hospitalizations due to self-inflicted injury higher than the county and
state benchmarks. Key informants identified areas such as Penn Valley, the outskirts of Nevada
City, and North San Juan as having populations of elderly individuals who may not have family
in the area and who might have minimal contact with other area residents. It was discussed
that this lack of social interaction could be a contributing factor for mental health issues and
suicide.
Area experts and focus group participants also mentioned the lack of public space and areas
where the community can gather and engage with others, which might also contribute to
isolation and related negative health outcomes. As Table 11 shows, rates of substance abuse-
related ED visits and hospitalization were clearly elevated in the Communities of Concern.22
Table 11: ED visit and hospitalization rates due to substance abuse issues compared to county
and state benchmarks (rates per 10,000 population)
Zip Code ED Visits Hospitalization
Mental Health- 95945 717.4 295.9
Substance 95975 375.1 181.7
Abuse Nevada County 363.1 174.5
CA State 232.0 143.8
(Source: OSHPD, 2011)
Both Communities of Concern had rates of ED visits and hospitalizations due to substance
abuse that were above county and state benchmarks. In zip code 95945, the rates for substance
abuse were more than three times the state benchmark for ED visits and more than two times
the state benchmark for hospitalizations. Qualitative data supported these findings, with one
key informant stating, “We also recognize a significant impact on health from substance abuse
issues, be it opiates or pain meds. Marijuana, alcohol, always a big one” (KI_Nevada_1).
Respiratory Illness: Chronic Obstructive Pulmonary Disease (COPD) and Asthma
In an effort to understand the impact of tobacco use and respiratory illness in the Communities
of Concern, rates of ED visits and hospitalization related to chronic obstructive pulmonary
disease (COPD), asthma, and bronchitis were examined and are displayed in Table 12. Rates of
ED visits and hospitalization due to asthma are examined independently in Table 13.
Table 12: ED Visits and Hospitalization due to COPD, asthma, and bronchitis compared to
county and state benchmarks (rates per 10,000 population)
Zip Code ED Visits Hospitalization
95945 369.8 322.6
COPD, Asthma,
95975 177.1 182.1
Bronchitis
Nevada County 201.2 201.9
CA State 202.3 156.8
(Source: OSHPD, 2011)
Table 13: ED Visit and hospitalization rates due to asthma compared to county and state
benchmarks (rates per 10,000 population)
Zip Code ED Visits Hospitalization
95945 176.7 97.8
Asthma 95975 68.6 65.0
Nevada County 95.7 70.4
CA State 134.9 70.5
(Source: OSHPD, 2011)
In zip code 95945, rates of ED visits and hospitalizations related to COPD and asthma were
higher than the county and state benchmarks. The hospitalization rate for COPD, asthma, and23
bronchitis in 95945 was double the state rate, at 322.6 per 10,000 compared to 156.8 per
10,000. The ED visit rate due to asthma in 95945 was nearly double the Nevada County rate.
Behavioral and Environmental
Safety Profile
Examination of safety indicators included examining local law enforcement data reported by
police and sheriff’s departments in the area. In addition, rates of ED visits and hospitalizations
due to assault and unintentional injury were examined.
Crime Rates
Figure 5 shows major crimes by municipality as reported by various jurisdictions. Darker colored
areas denote higher rates of major crime, including homicide, forcible rape, robbery,
aggravated assault, burglary, motor vehicle theft, larceny, and arson.
Figure 5: Majors crimes by municipality as reported by California Attorney General’s Office,
2010
Zip codes 95945 and 95959 are located in two separate municipalities which include the Grass
Valley Police Department and the Nevada City Police Department. The crime rate for the City of
Grass Valley is 477.4 crimes per 10,000 residents compared to Nevada City at 436.8. Portions of
95945 and 95959 are also included in the Nevada County Sheriff’s Department with a crime24
rate of 107.7 per 10,000 residents, which is also lower than the neighboring counties of Placer
and Yuba with rates of 193.6 and 212.6 per 10,000 residents, respectively.
Assault and Unintentional Injury
As an additional indicator of safety within the Communities of Concern, ED visit and
hospitalization rates for assault were examined.
Table 14: ED Visit and hospitalization rates due to assault compared to county and state
benchmarks (rates per 10,000 population)
Zip Code ED Visits Hospitalization
95945 37.1 2.5
Assault 95975 28.6 0.0
Nevada County 22.3 2.3
CA State 29.5 3.9
(Source: OSHPD, 2011)
Both Communities of Concern had rates of ED visits due to assault that surpassed the Nevada
County benchmark. As Table 14 indicates, zip code 95945 exceeded the county benchmarks for
both rates of ED visits and hospitalizations due to assault.
Unintentional Injury
As the fifth leading cause of death in the nation and the first leading cause in those under the
age of 35, examining rates of unintentional injuries was important.
Table 15: Mortality, ED visit, and hospitalization rates due to unintentional injury compared to
county and state benchmarks (rates per 10,000 population)
Zip Code ED Visits Hospitalization
Mortality
95945 4.1 1466.7 369.5
Unintentional 95975 3.1 919.6 183.3
Injury
Nevada County 4.0 948.6 244.7
CA State 2.7 651.8 154.6
Healthy People 2020 3.6 -- --
(Sources: Mortality, CDPH 2010; ED visits and hospitalization, OSHPD, 2011)
As Table 15 displays, both zip code Communities of Concern surpassed the state rates of
mortality, ED visits, and hospitalization due to unintentional injury. The rate of ED visits due to
unintentional injury was notably high in 95945, at 1,466.7 per 10,000, more than double the
state rate. The hospitalization rate for unintentional injury in 95945 was twice the state rate.25
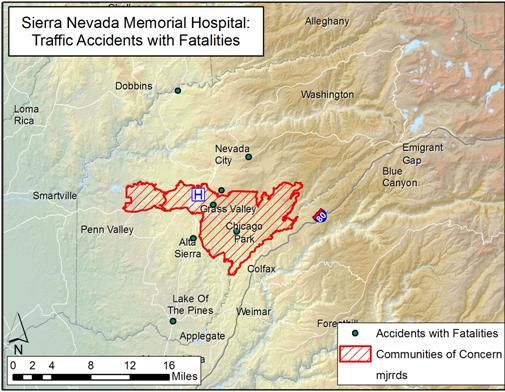
Fatality/Traffic Accidents
Figure 6 displays the locations of traffic accidents that resulted in a fatality. Only those locations
of traffic accidents resulting in a fatality located within the HAS are noted, and accidents
beyond the HSA boundaries are not shown. Table 16 shows bicycle accidents and accidents
involving a motor vehicle versus a pedestrian or bicyclist. Accidents resulting in a fatality,
especially those on city streets, contribute to the perception of safety area residents feel when
traveling through their community, particularly for area residents that rely on public,
pedestrian, and/or bicycle travel. Both area experts and community members in the HSA stated
that access to services and care is largely dependent on adequate transportation and many
residents’ access services by walking, biking, or taking local, sporadically available public
transportation.
Figure 6: Traffic accidents resulting in fatalities as reported by the National Highway
Transportation Safety Administration, 2010
As shown in Figure 6, most fatal traffic accidents in the HSA took place on the highways in the
area; however two accidents occurred on smaller streets close to town centers.26
Table 16: ED visit and hospitalization rates for accidents compared to county and state
benchmarks (rates per 10,000 population)
Zip Code ED Visits Hospitalization
95945 19.1 1.3
Accidents
95975 18.3 2.3
Nevada County 16.0 1.5
CA State 15.6 2.0
(Source: OSHPD, 2011)
Zip code 95975 had rates of ED visits and hospitalization due to bicycle accidents and accidents
involving an automobile and a bicyclist or pedestrian which exceeded county and state
benchmarks.
Food Environment
An examination of the food environment in the Communities of Concern is shown in Table 17.
Approximately 50% of residents within the Communities of Concern reported not eating at least
five servings of fruits or vegetables daily as recommended by the state. While ZIP code 95945
had one farmers’ market, it also contains a federally designated food desert tract. Such tracts
are designated by the federal government as census tracts in which 33% of the population or
more than 500 people have low access to healthy food.
Table 17 : Percent obese, percent overweight, percent not eating at least five fruits and
vegetables daily, presence (X) or absence (-) of federally defined food deserts, and number of
farmers markets
% % % no Food Farmers
Zip Code
Obese Overweight 5-a-day Desert Markets
Food
95945 20.0 34.7 50.3 X 1
Environment
95975 21.2 36.1 49.3 - 0
CA State 24.8 -- -- -- --
[Sources: % Obese & overweight, fruit & vegetable consumption: Healthy City
(www.healthycity.org), 2003-2005; Food deserts: Kaiser Permanente CHNA Data Platform/US
Dept. of Agriculture, 2011; Farmers markets: California Federation of Certified Farmers
Markets, 2012]
Residents and area experts stated that accessing healthy foods may be an issue due to
affordability and difficultly of getting to and from markets. Long drives and limited public transit
become increasing issues the further away residents live from the town centers of Grass Valley
or Nevada City. Figure 7 shows the modified Retail Food Environment Index (mRFEI), which is
the proportion of healthy food outlets to all available food outlets by census tract. Lighter areas
indicate greater access to health foods and the darkest areas indicate no access to healthy
foods.27
Figure 7: Modified Retail Food Environment Index (mRFEI) by census tracts for SNMH HSA
An examination of mRFEI data indicated that much of the area within the Communities of
Concern is categorized as having good access to healthy food. However, other areas within the
HSA are categorized as having no healthy retail outlets.
Active Living
One of the largest barriers to engagement in physical activity is access to recreational areas.
Figure 8 profiles the percent of the population in census tracts that live within one-half mile of a
recreational park.28
Figure 8: Percent population living in census tract within one-half mile of park space (per
10,000)
Zip code 95945 had the census tract with the highest percent of residents, over one-third, living
within one-half mile of a park. However, the vast majority of the HSA has very limited access to
parks. The HSA is surrounded by recreational activities and very close to the Tahoe National
Forest. Despite this, area experts stated that these recreational opportunities are not accessible
to low-income families or the elderly, who may not have the equipment to enjoy activities such
as hiking, biking, or kayaking.
Physical Wellbeing
Age-adjusted all-cause mortality rates are a significant indicator of the health of a community.
Zip code 95945 had the highest age-adjusted overall mortality rate in the HSA at 67.6 deaths
per 10,000. Life expectancy data showed that the Communities of Concern had a lower life
expectancy at birth compared to other zip codes in the HSA; however, the overall life
expectancy was comparable or slightly better than that of the state benchmark. The infant
mortality rate of ZIP code 95945 matched that of the state, at 5.2 deaths per 1,000 live births.29
Table 18: Age-adjusted all-cause mortality rate, life expectancy at birth, and infant mortality
rate (all-cause mortality rate per 10,000 population; infant mortality rate per 1,000 live births)
Age-Adjusted
Zip Code All-Cause Life expectancy Infant Mortality
Mortality
95945 67.6 78.5 5.2
95975 60.3 80.2 0.0
Nevada County 61.5 -- 3.6
CA State 63.3 78.6 5.2
National -- 80.4 --
Healthy People 2020 -- -- 6.0
(Sources: 2010 CDPH and 2010 Census data; rates calculated)
Health Asset Analysis
Communities require resources in order to maintain and improve their health. These include
health related assets such as access to health care professionals and community-based
organizations. An assessment of these resources revealed nearly 40 assets that provide SNMH
opportunities for partnership in addressing some of the health needs identified in this report. A
full listing of health assets in the HSA can be found in Appendix H.
Limitations
Study limitations included difficulties acquiring secondary data and assuring community
representation via primary data collection. ED visit and hospitalization data used in this
assessment are markers of prevalence, but do not fully represent the prevalence of a disease in
a given zip code. Currently there is no publicly available data set with prevalence markers at the
sub county level for the core health conditions examined in this assessment – heart disease,
diabetes, hypertension, stroke, and mental health. Similarly, behavioral level data sets at the
sub county level were difficult to obtain and were not available by race and ethnicity. The
format of the California Health Interview Survey (CHIS) data used in this assessment
necessitated the creation of “small region” estimates. Additionally, the available CHIS data
were from years 2003-2005. To mitigate these weaknesses, primary data were collected,
analyzed, and triangulated with secondary data.
As is common, assuring that the community voice is thoroughly represented in primary data
collection was a challenge. Measures were taken to outreach to area organizations for
recruitment, where the organization represented a Community of Concern geographically,
racially, ethnically or culturally. Focus group participants were offered incentives such as food
and refreshments during the interview. Additionally, data collection of health assets in the
hospital service areas was challenging. Many organizations were weary to provide information
to our staff over the phone, resulting in limited data on some assets. Further, information on
assets such as small community based organizations was difficult to find and catalog in aYou can also read