Mercy Medical Center 2021 Community Health Needs Assessment - The Sisters of Mercy welcome all people of every creed, Mercy Medical ...
←
→
Page content transcription
If your browser does not render page correctly, please read the page content below
Mercy Medical Center
2021 Community Health Needs Assessment

 The Sisters of Mercy welcome all people of every creed,
         color, economic and social condition.

      345 Saint Paul Place | Baltimore, Maryland 21202
                        mdmercy.com

                        June 2021
ABSTRACT: Community Health Needs Assessments (CHNA) and implementation
strategies are required of tax-exempt hospitals as a result of the Patient Protection and
Affordable Care Act. The CHNA and implementation strategies create an important
opportunity to improve the health of communities by ensuring that hospitals have
the information they need to provide community benefits that meet the needs of their
communities. They also provide an opportunity to improve coordination of hospital
community benefits with other efforts to improve community health. On December
31, 2014, the Internal Revenue Service (IRS) published final rules implementing the
“Additional Requirements for Charitable Hospitals” section of the Affordable Care
Act (ACA). The hospital facility must conduct a community health needs assessment
(CHNA) during the current taxable year or in either of the two taxable years
immediately preceding such taxable year, and an “authorized body of the hospital
facility” must adopt an “implementation strategy” to meet the community health
needs identified through the CHNA. Included in this document is Mercy Medical
Center’s CHNA and Implementation Strategy as approved by the Mercy Health
Services Mission & Corporate Ethics Committee on June 9, 2021.

                    The Sisters of Mercy were founded by Catherine McAuley, who used
                    her inheritance to build a refuge for homeless and abused women in
                    Dublin, Ireland in 1827. For 146 Years, Mercy Medical Center has
                    carried out the mission of the Sisters of Mercy.
Table of Contents
EXECUTIVE SUMMARY........................................................................................................................ 2
General Background................................................................................................................................... 4
          History............................................................................................................................................ 4
          Mission & Values............................................................................................................................ 5
          2025 Vision..................................................................................................................................... 5
          MMC Service Area.......................................................................................................................... 6

BALTIMORE’S CHALLENGES.............................................................................................................. 7

MERCY CHNA SERVICE AREA............................................................................................................. 9

CHNA PROCESS AND METHODS.................................................................................................... 11
    Quantitative Data............................................................................................................................... 11
          Key Findings................................................................................................................................. 13
          Demographics............................................................................................................................... 13
          Social Determinants of Health...................................................................................................... 16
          Health Outcomes.......................................................................................................................... 21
    Qualitative Data.................................................................................................................................. 25
          CHNA Public Survey.................................................................................................................... 25
          Stakeholder Interviews.................................................................................................................. 42

PRIORITIZATION OF NEEDS............................................................................................................ 47

CHNA IMPLEMENTATION STRATEGY........................................................................................... 48
    Adoption of Implementation Strategy................................................................................................. 48
    Aligned Population Health Initiatives.................................................................................................. 48
    Community Partnerships.................................................................................................................... 49
    Community Impact............................................................................................................................ 50

EXISTING HEALTH CARE FACILLITIES & OTHER COMMUNITY RESOURCES..................... 53

MERCY MISSION & CORPORATE ETHICS COMMITTEE............................................................ 55

Disclaimer................................................................................................................................................ 56

                                                                                                                                                                  1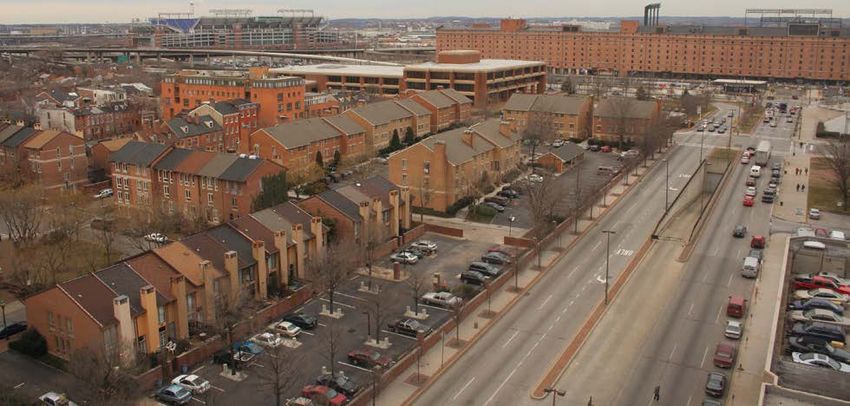
Executive Summary
Mercy Health Services is an independent, not-for-profit, mission-driven health system serving Baltimore since
1874. At its center is a general acute care teaching hospital affiliated with the University of Maryland School
of Medicine located in the heart of downtown Baltimore. The Sisters of Mercy have sponsored Mercy since
its healthcare operations began and Mercy has maintained a special commitment to poor and underserved
persons consistent with the mission of the Sisters of Mercy. Mercy Medical Center is one of 12 general acute
care hospitals in Baltimore City and one of five hospitals within the defined CHNA Service Area. It serves a
unique role as a high-quality community hospital, providing a broad range of primary and secondary acute care
services, as well as a preferred tertiary referral center providing services to patients from a broad geographic area.

                                                                                                                         2
Mercy generates most of its total revenue from regionally oriented, surgically focused specialty programs from
patients from nearly every zip code across Maryland. However, when it comes to Community Health Needs and
Community Benefit activities, Mercy has focused its attention and resources on a smaller geographic area that
represents downtown and inner-city neighborhoods including medically underserved, low income, and minority
populations. Mercy provides an array of specialized citywide support programs for these targeted populations
including: lower-income pregnant women, individuals experiencing homelessness, substance abusers, and
coordination with Federally Qualified Health Centers to meet community health needs. Mercy also houses a
citywide forensic examination program for victims of sexual assault, and a family violence program.

Baltimore City faces numerous social and economic challenges that negatively impact the overall health status of
the population. More than 21% of persons in Baltimore live below the federal poverty line. Baltimore’s economic
challenges also translate to significant social challenges including high rates of violent crime and drug addiction.
As a result, Baltimore City, especially Mercy’s defined CHNA Service Area, suffers from higher rates of mortality
and lower life expectancy. The top causes of death are cardiovascular disease, cancer, drug- and/or alcohol-related,
and stroke. In addition, Baltimore City has higher rates of infant mortality and low birth weight births.
Significantly more people die prematurely from all causes in the defined CHNA Service Area than in the City
as a whole. Further, significant populations of individuals experiencing homelessness are found in Mercy’s
CHNA Service Area. The estimated life expectancy for individuals experiencing homelessness is only 48 years.
Alcohol and drug addiction, mental health, and housing/homelessness were top health and social environmental
problems identified by the local community.

Mercy’s location in the middle of a disproportionately poor city presents challenges and health disparities that
are not evident in other parts of Maryland. Mercy has identified areas of opportunity where the mission and
strengths of the institution intersect with the unmet health needs that merit attention. Consistent with feedback
received from community representatives, Mercy intends to focus its resources specifically on interventions,
programs, and initiatives to: improve access to care and the frequency of care for our homeless neighbors;
provide support to victims of violence and addiction; implement strategies to improve birth outcomes and
pre-natal care for expectant mothers; expand access to preventative health services such as primary care to
improve outcomes, manage chronic disease, and reduce total cost of care; and provide targeted health education
opportunities to the public and support the education of future physicians, advance practice providers, nurses,
and other healthcare workers who in turn serve the community. Finally, Mercy has been successful in improving
quality, lowering costs and responding to community health needs by building up its population health program
to serve patients with chronic illnesses within the CHNA service area and beyond.

                                                                                                                       3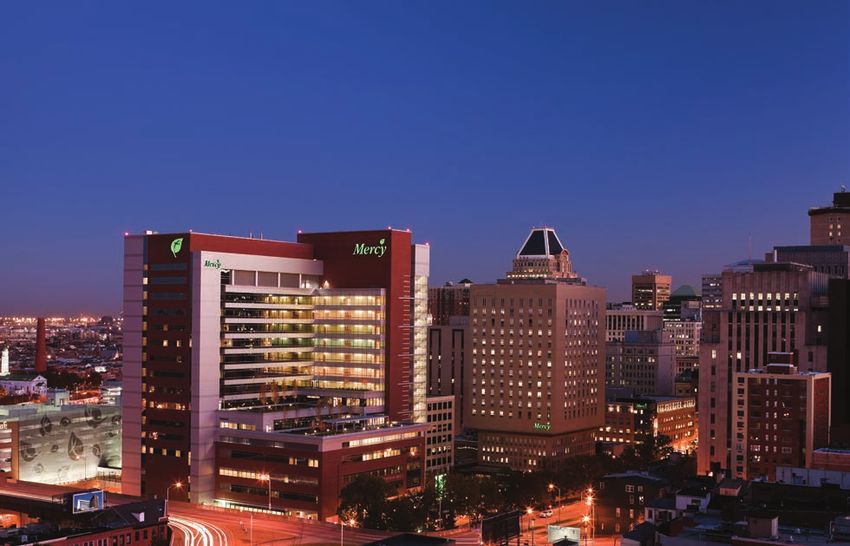
General Background
Mercy Health Services, Inc. (MHS), a Maryland nonstock corporation that has been determined by the Internal
Revenue Service to be a tax-exempt organization described in Section 501(c)(3) of the United States Internal
Revenue Code, owns and operates a health care delivery system in Maryland (the Health System). The Health
System is a patient-centered, integrated system delivering high-quality, high-value health care services in various
locations throughout the Baltimore metropolitan area and State of Maryland. MHS is the parent of Mercy
Medical Center, Inc. (Mercy or MMC), a non-profit corporation, which owns and operates a 183-licensed bed
general acute care teaching hospital affiliated with the University of Maryland School of Medicine. The MMC
campus is located in the heart of Downtown Baltimore, Maryland. MMC is both a prominent community
hospital, providing a broad range of primary and secondary acute care services, as well as a preferred tertiary
referral center in certain select specialties.

Mercy is currently one of only three hospitals in the state to achieve the
highest 5-Star Overall Hospital Rating from the Centers for Medicare
and Medicaid Services (CMS). The Overall Hospital Rating is based on
performance on several dozen inpatient and outpatient quality measures
that are grouped into seven categories, including mortality, safety of
care, readmission, patient experience, effectiveness of care, timeliness
of care, and efficient use of medical imaging. Mercy was awarded an
“A” in both the Fall 2020 and Spring 2021 Leapfrog Hospital Safety
Grades—a national distinction recognizing the hospital’s achievements
protecting patients and providing safe health care. Mercy earned “high
performing” ratings for both hip replacement and knee replacement from U.S. News & World Report in its
annual “Best Hospitals” edition. “High performing” is the highest rating U.S. News awards in the adult
procedure category, recognizing care that was significantly better than the national average as measured by
patient outcomes.

History
                                      The Sisters of Mercy have sponsored Mercy since its healthcare operations
                                      began in 1874 when six Sisters of Mercy arrived in Baltimore to take
                                      charge of a health dispensary named Baltimore City Hospital. Established
                                      four years prior by the Washington University School of Medicine,
                                      the dispensary was located in a former schoolhouse at the corner of
                                      Calvert and Saratoga Streets. Mercy has had a continuing presence in
                                      downtown Baltimore since its founding. In 1999, the Sisters of Mercy
and MHS entered into a formal Sponsorship Agreement. MHS is an independent health system governed
by a 29 member self-perpetuating Board of Trustees comprised primarily of Baltimore area residents with
deep roots in the local business, healthcare, and philanthropic communities.

                                                                                                                      4
Mission & Values
Like the Sisters of Mercy before us, we witness God’s healing love for all people by providing
excellent clinical and residential services within a community of compassionate care.

Dignity: We celebrate the inherent value of each person as created in the image of God. We respond to
the needs of the whole person in health, sickness and dying.

Hospitality: From many religious traditions and walks of life, we welcome one another as children of the
same God, whose mercy we know through the warmth, fidelity and generosity of others.

Justice: We base our relationships with all people on fairness, equality and integrity. We stand especially
committed to persons who are poor or vulnerable.

Excellence: We hold ourselves to the highest standards of care and to serving all with courtesy, respect and
compassion. Maintaining our involvement in the education of physicians and other healthcare professionals
is a priority.

Stewardship: We believe that our world and our lives are sacred gifts which God entrusts to us. We respond
to that trust by constantly striving to balance the good of all with the good of each, and through creative and
responsible use of all our resources.

Prayer: We believe that every moment in a person’s journey is holy. Prayer is our response to God’s faithful
presence in suffering and in joy, in sickness and in health, in life and in death

2025 Vision
As an independent, innovative Catholic health system, we pledge to enhance the health of our region,
with a special commitment to the poor and underserved, by offering:
• The hospital and health system of choice in our market;
• Integrated, cost-effective care across the continuum;
• A comprehensive ambulatory network readily accessible to everyone;
• Nationally and regionally recognized, patient-focused Centers of Excellence; and
• Leadership in clinical quality, customer experience, and value.

                                                                                                                  5
MMC Service Area
Mercy provides healthcare services to patients from a broad geographic area within the State of Maryland and
beyond. Mercy’s primary service area consists of the majority of Baltimore City and portions of Baltimore
and Anne Arundel Counties. Mercy’s secondary service area generally surrounds the Primary Service Area
and includes the remaining portions of Baltimore City, portions of Baltimore County, and a portion of
Anne Arundel County (see map below). These service areas accounted for approximately 76% of Mercy’s
total discharges in the 12 months ended June 30, 2020. The remaining 24% of discharges originate from
outside Mercy’s traditional service areas, including patients from outside of Maryland.

Due to its downtown location near several other
hospitals, including two large academic medical
centers and two other multi-hospital health
systems, Mercy is not the dominant hospital
provider in any of the zip codes comprising
Mercy’s traditional service area. Further, Mercy
Medical Center generates more than sixty-six
percent (66%) of its total revenue from regionally
oriented, surgically focused specialty programs
(Centers of Excellence) drawing patients from
nearly every zip code across Maryland.

While patients throughout Maryland seek-
out Mercy’s high-quality health services, it has      Mercy Primary & Secondary Service Areas
traditionally focused its numerous community
benefit programs and services on economically disadvantaged neighborhoods within Baltimore City,
consistent with its long-standing special commitment to poor and underserved persons. This includes an
array of specialized citywide support programs for lower-income pregnant women, individuals and families
experiencing homelessness, substance abusers, and coordination with Federally Qualified Health Centers to
meet the community health needs.

                                                                                                               6
Baltimore’s Challenges
Baltimore City faces numerous social and economic challenges that negatively impact the overall health status of
the population. The City has suffered a dramatic decline in population, employment and wealth since the 1950s.
Following the post-war industrial era, Baltimore City’s population declined from 949,708 (1950) to 593,490
(2019 estimate), a 38% decrease. Likewise, its population rank among U.S. cities declined from 6th largest to
31st largest. Meanwhile, Maryland’s total population grew from 2,343,001 to 6,045,680 during the same period,
a 258% increase.

As population, jobs, and wealth migrated out to the suburbs and exurbs of the broader metropolitan area;
Baltimore’s poor remained, making the City a concentrated “poorhouse for the region’s minority poor,”
according to one urban scholar (Rusk 1995). Indeed, Baltimore’s current unemployment rate stands at 7.6%
(April 2021), well above Maryland’s rate of 6.2%. The City’s Median Household Income is $ $50,379 (2019
dollars) compared to $84,804 for Maryland. Perhaps most poignantly, more than 1-in-5 (21.2%) or roughly

                                                                                                                   7
126,000 persons in Baltimore live below the federal poverty line, more than double Maryland’s poverty rate of
9.0% (including Baltimore City), and significantly higher than the national poverty rate of 10.5%. A staggering
nearly one-half of Baltimore City residents live below 200% of the federal poverty line and nearly one-third of
children in Baltimore City live in poor households.

Not surprisingly, these economic factors—high unemployment, low income, and extraordinary levels of
poverty—often result in reduced access to health care, especially preventative treatment that could improve
population health and limit potentially avoidable hospital utilization. While the Affordable Care Act has greatly
expanded health insurance to the poor, an estimated 9.5% of individuals in Baltimore under age 65 lack health
insurance coverage, according to the most recent available data from the U.S. Census Bureau’s Small Area Health
Insurance Estimates.

Linked to Baltimore’s economic challenges are significant social challenges impacting community health,
including high rates of violent crime and drug addiction. Baltimore has one of the highest violent crime rates
among major U.S. Cities with a rate of 18.76 per 1000 residents. The Baltimore City Health Department
estimates that roughly 60,000 Baltimore residents are suffering from drug addiction. The U.S. Drug
Enforcement Agency reports Baltimore has the highest per capita heroin addiction rate in the country. In 2017,
Baltimore City recorded nearly 900 drug and alcohol-related intoxication deaths, most of which were opioid-
related, representing more than a third of all intoxication deaths in the state.

Against this backdrop, Mercy
has remained in Baltimore as a
prominent community hospital                   Drug and Alcohol Related Deaths
for more than 146 years, serving
the health care needs of Baltimore
City’s residents regardless of creed,
color, economic or social condition.
In 2010, Mercy rededicated its
commitment to serving Baltimore
City with the completion of a
new, state-of-the-art replacement
hospital, the Mary Catherine
Bunting Center, representing a
$400+ million investment in its
downtown medical campus in the
heart of Baltimore City.

In FY2020, Mercy provided $71.6 million in community benefits representing 14.6% of total hospital operating
expenses—including $17.8 million in charity care. Mercy consistently performs above state average and other
Maryland Catholic Hospitals as a percentage of operating expense.

                                                                                                                    8
Mercy CHNA Service Area
The Sisters of Mercy were originally founded in Dublin, Ireland to care for homeless, abused and neglected
women and children. This timeless legacy influences Mercy’s approach to focus special attention on certain
target populations, such as infants, women, and the impoverished. Mercy defined its CHNA Service Area
as part of its CHNA process for the 2013 tax year. During a series of meetings as part of the CHNA process
for 2013, Mercy’s Community Benefits Committee discussed the socio-economic and health parameters that
define Mercy’s “community”. Following a data driven process (See: Mercy Medical Center 2013 CHNA), the
committee appropriately decided that Mercy should focus its limited resources on Community Benefit activities
to improve population health within 18 Community Statistical Areas (CSAs) that represent downtown and the
inner-city neighborhoods east, west, and south of the city center. The Committee believes that this definition of
Mercy’s community, which represents a smaller geographic area than the CHNA Service Area previously utilized
by Mercy, will foster greater coordination, better strategic partnerships, and improved measurement of outcomes,
in particular with respect to the targeted populations including lower-income mothers and their babies and
individuals experiencing homelessness.
In addition, as part of the CHNA process for 2013, 2016, and 2018, and 2021 Mercy representatives sought
input regarding its proposed CHNA Service Area from community leaders, public health experts, and
representatives of minority, low income, and medically underserved populations. The consensus feedback
from these discussions validates Mercy’s CHNA Service Area Definition. In accordance with IRS regulations
governing CHNAs, Mercy’s defined CHNA community includes “medically underserved, low income or
minority populations”.
The following Community Statistical Areas (CSAs) make up Mercy’s CHNA Service Area: Canton, Clifton
Berea, Downtown/Seton Hill, Fells Point, Greater Rosemont, Greenmount East, Harbor East/Little Italy, Inner
Harbor/Federal Hill, Madison/East End, Midtown, Oldtown/Middle East, Patterson Park North & East,
Poppleton/The Terraces/Hollins Market, Sandtown-Winchester/Harlem Park, South Baltimore, Southwest
Baltimore, Upton/Druid Heights, and Washington Village/Pigtown.
9Mercy Medical Center CHNA Service Area
Cross-Country/ Harford/Echodale
Cheswolde Mt. Washington/ Chinquapin Loch Raven
Coldspring Park/
Greater Belvedere
Roland F
G
Park/ North
Glen-Fallstaff Pimlico/
F
G
Arlington/Hilltop Poplar Hill Bal�more/ Hamilton
E Guilford/
Homeland Greater
Southern Govans
Northwood Lauraville
Park Medfield/
Howard Park/ Heights Hampden/
West Arlington Dorchester/ Woodberry/
Remington Cedonia/
Ashburton F
G The
Frankford
Greater Waverlies
Charles
Penn North/ Midway/
Greater Village/
Reservoir Hill Coldstream Belair-Edison
Forest Park/ Mondawmin Barclay
Walbrook E
Dickeyville/
Greenmount Cli�on- Claremont/Armistead
Franklintown Midtown
East Berea
Upton/
Greater Sandtown- EDruid E Madison/
Winchester/
Edmondson Rosemont HeightsF
G Oldtown/ East End
Village Harlem Park
Middle East F
G Pa�erson Park
Orangeville/
E. Highlandtown
Poppleton/ FE
G Harbor East/
North & East
F
G
The Terraces/ Downtown/
Beechfield/ F
G F
G
Hollins Market Seton Hill
Li�le Italy
Ten Hills/ Southwest
Allendale/Irvington/ Fells Point Canton Highland-
West Hills Bal�more
S. Hilton town
Inner Harbor/
Washington Village/ Federal Hill
Pigtown
F
G Southeastern
South Bal�more
Morrell Park/Violetville
Westport/
Federally Mt. Winans/
E Qualified Lakeland
E
F
G
Health Centers Cherry
Hill
CHNA Service
Area
Brooklyn/Cur�s Bay/
Community Hawkins Point
Sta�s�cal
Areas
Hospitals MedStar Good
F Samaritain
G G Saint
F Agnes
Hopsital
University of
F Maryland
G
F Mercy
G Center
Medical
Hospital F Sinai Hospital
G Medical Center
MedStar University of
F Grace
G Center
Medical F
G Harbor Hospital
The Johns
F Hopkins
G Maryland
Johns Hopkins MedStar Union Hospital F
G Medical Center
F
G Memorial Midtown
F Bayview
G Map created by BNIA-JFI, 2021
Medical Center Campus
10CHNA Process and Methods
Quantitative and qualitative data was gathered by Mercy in order to undertake the 2021 CHNA. As part of the
quantitative data gathering process for the 2018 and 2021 CHNA, Mercy’s Community Benefit Committee
members worked collaboratively with the Baltimore City Health Department and a consortium of Baltimore
City Hospitals to obtain uniform quantitative and qualitative data including demographic and health data for
Community Statistical Areas (CSAs) and qualitative findings of hundreds of community health surveys and
stakeholder interviews.
Quantitative Data
As part of the quantitative data gathering process for the 2021 CHNA, Mercy’s Community Benefit
Committee members worked collaboratively with The Baltimore Neighborhood Indicators Alliance-Jacob
France Institute at the University of Baltimore (BNIA-JFI). BNIA-JFI is a nonprofit organization whose
core mission is to provide open access to meaningful, reliable, and actionable data about, and for, the City of
Baltimore and its communities. BNIA-JFI builds on and coordinates the related work of citywide nonprofit
organizations, city and state government agencies, neighborhoods, foundations, businesses, and universities
to support and strengthen the principle and practice of well informed decision making for change toward
11strong neighborhoods, improved quality of life, and a thriving city. BNIA-JFI is also a partner member of the
National Neighborhood Indicators Partnership of the Urban Institute (NNIP). NNIP is a collaborative effort
by the Urban Institute and nearly 40 local partners to further the development and use of neighborhood-level
information systems in local policymaking and community building.
BNIA-JFI provided to Mercy’s Community Benefit Committee a broad array of neighborhood data
indicators that provide all of the facts and circumstances present in Mercy’s CHNA Service Area including
barriers to accessing care, to prevent illness, to ensure adequate nutrition, or to address social, behavioral and
environmental factors that influence health in the community.
Incorporated into BNIA-JFI’s neighborhood-level socio-economic datasets are individual Neighborhood Health
Profiles completed by the Baltimore City Health Department. The Neighborhood Health Profiles examine
the underlying factors that affect health in each neighborhood—the social determinants of health. The social
determinants of health are the conditions in which residents live, learn, work, and play, and include factors like
access to healthy food, healthy housing, quality schools, and safe places to be active. The Baltimore City’s Office
of Epidemiology utilized rigorous research methods and survey analysis techniques to aggregate all the data to
the Community Statistical Area (CSA) level.
The use of the most recently available (2017) Neighborhood Health Profile information from the Baltimore
City Health Department ensures that the community health priorities of Mercy Medical Center remain
aligned with the current health priorities of the City. The 2017 BCHD Neighborhood Health Profile Data
was incorporated into Mercy’s 2018 CHNA and is not replicated again here as BCHD has not published
more recent data at the neighborhood level since that time.
Additional data sources include a variety of public and private sources such as: The U.S. Census, The
American Community Survey, The Vital Statistics Administration at the Maryland Department of Health,
The National Center for Health Statistics, The Baltimore City Public Schools System, The Mayor’s Office of
Information Technology, The Baltimore City Housing Department, The Baltimore City Comptroller’s Office,
The Baltimore City Planning Department, The Baltimore City Real Property Management Database, The
Baltimore City Liquor Board, The Baltimore City Health Department, Center for a Livable Future, and the
Maryland Department of the Environment.
The Baltimore City Health Department (BCHD) is the oldest, continuously-operating health department in
the United States, formed in 1793, when the governor appointed the city’s first health officers in response to
a yellow fever outbreak in the Fells Point neighborhood. In collaboration with other city agencies, health care
providers, community organizations and funders, the department seeks to empower all Baltimoreans with the
knowledge, access, and environment that will enable healthy living. The Health Department has a wide-ranging
area of responsibility, including acute communicable diseases, animal control, chronic disease prevention,
emergency preparedness, HIV/STD, maternal-child health, restaurant inspections, school health, senior services
and youth violence issues. The agency includes a workforce of approximately 800 employees and has a budget
of approximately $126 million.
12KEY FINDINGS
Demographics
Baltimore City, Maryland, has a population of 620,961 (2010 Census) and the geographic area of the CSAs
included in this profile (referred to hereafter as the CHNA area) has a total population of 186,653 (29% of
Baltimore City’s population). In 2040, Baltimore City’s population is projected to be 693,029 (11.6% change
from 2010 decennial census) while the CHNA area’s population is expected to be 224,871 (20.5% change
from 2010 decennial census) (Baltimore City Health Department (BCHD) analysis of data provided by the
Baltimore City Department of Planning). Fifty-two percent of the CHNA area is female and 58% of the area
is African American, compared to 53% and 61% for Baltimore City, respectively. 20.7% percent of Baltimore
City’s population is aged less than 18 years and 13.6% is aged 65+ years compared to 19.5% and 11.5% in the
CHNA area, respectively.
Demographics - Population Total Population Total Male Total Female
(2010 for all) Population Population
Canton 8,100 4,011 4,089
Clifton-Berea 9,874 4,473 5,401
Downtown/Seton Hill 6,446 3,164 3,282
Fells Point 9,039 4,613 4,426
Greater Rosemont 19,259 8,783 10,476
Greenmount East 8,184 3,737 4,447
Harbor East/Little Italy 5,407 2,628 2,779
Inner Harbor/Federal Hill 12,855 6,528 6,327
Madison/East End 7,781 3,587 4,194
Midtown 15,020 7,305 7,715
Oldtown/Middle East 10,021 4,543 5,478
Patterson Park North & East 14,549 7,289 7,260
Poppletown/Terraces/Hollins Market 5,086 2,403 2,683
Sandtown-Winchester/Harlem Park 14,896 6,810 8,086
South Baltimore 6,406 3,263 3,143
Southwest Baltimore 17,885 8,685 9,200
Washington Village/Pigtown 5,503 2,743 2,760
Upton/Druid Heights 10,342 4,621 5,721
CHNA Service Area Estimate 186,653 89,186 97,467
Baltimore City 620,961 292,249 328,712
13Demographics - Black/African- White/ Asian Two or All Other Hispanic
American Caucasian More Races Races
Race Ethnicity (Non-Hispanic) (Non-Hispanic) (Non-Hispanic) (Non-Hispanic) (Non-Hispanic) (2015-2019)
Percent of Residents (2015-2019) (2015-2019) (2015-2019) (2015-2019) (2015-2019)
Canton 5.0 83.0 5.7 1.6 0.3 4.4
Clifton-Berea 90.8 4.1 0.4 0.2 1.1 3.4
Downtown/Seton Hill 37.7 35.8 13.4 2.7 2.5 7.8
Fells Point 6.3 73.2 6.0 3.4 0.0 11.1
Greater Rosemont 97.3 1.1 0.1 0.7 0.2 0.6
Greenmount East 94.1 3.9 0.5 0.1 0.4 1.0
Harbor East/Little Italy 56.0 31.1 3.4 0.5 0.8 8.2
Inner Harbor/Federal Hill 12.3 74.2 4.9 2.3 2.2 4.1
Madison/East End 86.1 3.0 0.1 0.2 1.9 8.7
Midtown 34.0 48.7 6.0 4.3 1.0 6.0
Oldtown/Middle East 85.6 8.5 2.8 1.2 0.1 1.8
Patterson Park North & East 35.3 44.0 3.6 3.1 0.2 13.9
Poppletown/Terraces/Hollins Market 77.1 17.9 0.5 2.2 0.1 2.3
Sandtown-Winchester/Harlem Park 94.9 2.5 0.4 0.7 1.1 0.4
South Baltimore 2.4 88.7 2.6 1.0 0.9 4.4
Southwest Baltimore 73.9 15.8 2.7 3.1 0.5 4.0
Washington Village/Pigtown 55.7 31.2 2.7 4.5 0.0 5.8
Upton/Druid Heights 91.9 4.6 0.5 1.9 0.2 0.9
CHNA Service Area Estimate 58.0 31.3 3.1 2.0 0.7 4.8
Baltimore City 61.8 27.5 2.6 2.2 0.7 5.3
14Demographics - Age Percent of Percent of Percent of Percent of Percent of
Population Population Population Population Population
Under 5 5-17 18-24 25-64 65 Years
Years old Years old Years old Years old and over
(2015-2019) (2015-2019) (2015-2019) (2015-2019) (2015-2019)
Canton 5.6 3.1 4.1 76.7 10.4
Clifton-Berea 6.7 17.8 6.6 51.0 17.8
Downtown/Seton Hill 4.5 4.7 17.6 68.9 4.4
Fells Point 5.7 4.4 6.4 74.6 8.9
Greater Rosemont 5.7 16.4 8.5 58.1 11.2
Greenmount East 7.3 19.1 5.7 53.5 14.4
Harbor East/Little Italy 4.7 14.2 7.0 61.8 12.2
Inner Harbor/Federal Hill 4.2 6.2 10.0 67.1 12.5
Madison/East End 10.4 21.9 13.0 45.5 9.2
Midtown 1.4 3.4 13.7 65.8 15.7
Oldtown/Middle East 4.7 21.4 9.0 52.1 12.7
Patterson Park North & East 8.7 13.9 6.6 63.0 7.9
Poppletown/Terraces/Hollins Market 7.0 17.3 6.5 60.5 8.8
Sandtown-Winchester/Harlem Park 6.5 21.1 7.5 49.6 15.3
South Baltimore 7.2 5.0 4.6 76.8 6.3
Southwest Baltimore 9.9 16.4 7.7 53.7 12.3
Washington Village/Pigtown 7.1 11.7 7.6 65.3 8.3
Upton/Druid Heights 7.8 22.1 8.8 49.2 12.0
CHNA Service Area Estimate 6.3 13.2 8.6 60.4 11.5
Baltimore City 6.4 14.2 9.8 56.0 13.6
15Demographics - Percent of Female- Percent of Family Percent of Children
Headed Households Households Living Living Below the
Family Poverty with Children Under 18 Below the Poverty Line Poverty Line
(2015-2019) (2015-2019) (2015-2019)
Canton 15.0 2.2 4.8
Clifton-Berea 54.5 19.2 39.7
Downtown/Seton Hill 57.1 3.7 6.2
Fells Point 10.8 5.7 8.4
Greater Rosemont 68.0 26.4 46.8
Greenmount East 73.8 25.5 45.7
Harbor East/Little Italy 69.1 25.5 32.8
Inner Harbor/Federal Hill 15.9 3.3 7.0
Madison/East End 83.0 34.4 55.9
Midtown 28.6 6.5 13.2
Oldtown/Middle East 80.9 35.5 49.5
Patterson Park North & East 33.4 24.2 55.0
Poppletown/Terraces/Hollins Market 77.5 40.6 51.4
Sandtown-Winchester/Harlem Park 68.8 36.4 61.1
South Baltimore 13.3 0.0 0.0
Southwest Baltimore 57.0 33.7 50.9
Washington Village/Pigtown 75.5 25.3 38.1
Upton/Druid Heights 84.4 41.7 66.5
CHNA Service Area Estimate 58.3 22.5 43.9
Baltimore City 51.0 16.0 31.0
Social Determinants of Health
The social determinants of health include a wide variety of exposures that impact health across all ages, from
the individual to the population level. They include factors such as employment, income, education, the built
environment, access to healthy foods, exposure to violence, and stress.
Like most places, employment and income are key social determinants of health in Baltimore. The family
poverty rate (families with children under 18 years) is 16.0% in Baltimore City compared to 22.5% in the
CHNA area.
Regarding the built environment, the percentage of residential properties that are vacant and abandoned (2019)
in Baltimore City is 8.0% vs. 14.7% in the CHNA area. Food access is a major challenge in Baltimore City
with nearly 13% of land classified as a food desert. Exposure to violence is another concern; the violent crime
rate is 18.5 per 1,000 residents in Baltimore City and 27.9 per 1,000 residents in the CHNA area.
16Mercy Medical Center CHNA Service Area
Percentage of Family Households in Poverty,
Baltimore City, 2015-2019
Cross-Country/ Harford/Echodale
Cheswolde Mt. Washington/ Chinquapin Loch Raven
Coldspring Park/
Greater Belvedere
Roland
Glen-Fallstaff Park/ North
Pimlico/ Poplar Hill Bal�more/ Hamilton
Arlington/Hilltop Guilford/
Homeland Greater
Govans
Northwood Lauraville
Southern
Park Medfield/
Howard Park/ Heights Hampden/
West Arlington Dorchester/ Woodberry/
Ashburton Remington Cedonia/
The
Frankford
Greater Waverlies
Charles
Penn North/ Village/ Belair-Edison
Greater Reservoir Hill
Forest Park/ Barclay Midway/
Mondawmin
Walbrook Coldstream
Dickeyville/
Greenmount Cli�on- Claremont/Armistead
Franklintown Midtown
Upton/ East Berea
Greater Sandtown-
Druid
Edmondson Rosemont Winchester/ Madison/
Heights
Village Harlem Park Oldtown/ East End Orangeville/
Middle East Pa�erson Park E. Highlandtown
Poppleton/ North & East
Beechfield/ The Terraces/ Downtown/ Harbor East/
Seton Hill Li�le Italy
Ten Hills/ Southwest Hollins Market
Highland-
West Hills Allendale/Irvington/ Bal�more Fells Point Canton
town
S. Hilton
Inner Harbor/
Federal Hill
Washington Village/
Pigtown
Percent of Family Southeastern
South Bal�more
Households Living Morrell Park/Violetville
Below the Poverty
Line Westport/
Mt. Winans/
0.0% - 5.7% Lakeland
Cherry
5.8% - 10.9% Hill
Ranked into quin�les by
11.0% - 18.6%
Community Sta�s�cal Area.
18.7% - 25.5% Brooklyn/Cur�s Bay/
Bal�more City: 16.0% Hawkins Point
25.6% - 41.7% CHNA Service Area: 22.5%
CHNA Service
Area
Hospitals MedStar Good Saint Agnes University of
Mercy Medical Samaritain Hopsital Maryland
Center Hospital Sinai Medical Center
MedStar Harbor Midtown
Grace Medical The Johns
Hospital Campus
Center Hopkins Hospital
Johns Hopkins MedStar Union University of
Memorial Indicator Source: American
Bayview Medical Maryland Community Survey Map created
Center Medical Center by BNIA-JFI, 2021
17Mercy Medical Center CHNA Service Area
Violent Crime Rate, Baltimore City, 2015-2019
Cross-Country/ Harford/Echodale
Cheswolde Mt. Washington/ Chinquapin Loch Raven
Coldspring Park/
Greater Belvedere
Roland
Glen-Fallstaff Park/ North
Pimlico/ Poplar Hill Bal�more/ Hamilton
Arlington/Hilltop Guilford/
Homeland Greater
Govans
Northwood Lauraville
Southern
Park Medfield/
Howard Park/ Heights Hampden/
West Arlington Dorchester/ Woodberry/
Ashburton Remington Cedonia/
The
Frankford
Greater Waverlies
Charles
Penn North/ Village/ Belair-Edison
Greater Reservoir Hill
Forest Park/ Barclay Midway/
Mondawmin
Walbrook Coldstream
Dickeyville/
Greenmount Cli�on- Claremont/Armistead
Franklintown Midtown
Upton/ East Berea
Greater Sandtown-
Druid
Edmondson Rosemont Winchester/ Madison/
Heights
Village Harlem Park Oldtown/ East End Orangeville/
Middle East Pa�erson Park E. Highlandtown
Poppleton/ North & East
Beechfield/ The Terraces/ Downtown/ Harbor East/
Seton Hill Li�le Italy
Ten Hills/ Southwest Hollins Market
Highland-
West Hills Allendale/Irvington/ Bal�more Fells Point Canton
town
S. Hilton
Inner Harbor/
Federal Hill
Washington Village/
Pigtown
Southeastern
Violent Crime Rate Morrell Park/Violetville
South Bal�more
per 1,000
Residents Westport/
Mt. Winans/
1.5 - 9.0 Lakeland
Cherry
9.1 - 16.1 Hill
16.2 - 19.8 Ranked into quin�les by
Community Sta�s�cal Area.
19.9 - 25.4 Brooklyn/Cur�s Bay/
Bal�more City: 18.5 Hawkins Point
25.5 - 106.4 CHNA Service Area: 27.9
CHNA Service
Area
Hospitals MedStar Good Saint Agnes University of
Mercy Medical Samaritain Hopsital Maryland
Center Hospital Sinai Medical Center
MedStar Harbor Midtown
Grace Medical The Johns
Hospital Campus
Center Hopkins Hospital
Johns Hopkins MedStar Union University of
Bayview Medical Memorial Maryland Indicator Source: Bal�more City
Police Map created by BNIA-JFI, 2021
Center Medical Center
18Social Determinants Number of Percent of Percentage Average Violent Number of
Children Children of Residential Healthy Food Crime Rate Shootings
of Health (Aged 0-6) (Aged 0-6) Properties Availability per 1,000 per 1,000
Tested for with Elevated that are Index Residents Residents
Elevated Blood Blood Vacant and (2015) (2019) (2019)
Lead Levels Lead Levels Abandoned
(2018) (2018) (2019)
Canton 94 0.0 0.5 15.2 6.9 0.2
Clifton-Berea 160 0.0 24.5 8.2 27.9 11.1
Downtown/Seton Hill 94 0.0 10.8 8.9 106.4 14.7
Fells Point 132 0.0 0.9 11.3 19.7 0.7
Greater Rosemont NA NA 19.6 7.5 21.9 5.7
Greenmount East 63 0.0 30.5 10.2 25.4 6.7
Harbor East/Little Italy 105 0.0 1.5 10.4 32.9 5.4
Inner Harbor/Federal Hill 161 0.0 0.4 8.5 16.1 0.8
Madison/East End 214 7.5 19.8 9.7 31.5 9.3
Midtown 58 0.0 1.3 11.2 23.8 0.9
Oldtown/Middle East 248 0.0 11.8 8.9 44.1 11.5
Patterson Park North & East 43 0.0 3.8 10.8 23.6 4.4
Poppletown/Terraces/Hollins Market 82 0.0 11.0 10.7 24.2 7.1
Sandtown-Winchester/Harlem Park 176 2.8 32.5 9.1 22.2 9.4
South Baltimore 175 0.0 0.3 14.0 5.6 0.6
Southwest Baltimore 205 2.4 30.7 8.9 35.3 9.6
Washington Village/Pigtown 129 0.0 6.0 9.0 38.2 2.0
Upton/Druid Heights 239 0.0 28.5 8.5 26.5 9.9
CHNA Service Area Estimate 2,378 1.1 14.7 10.0 27.9 5.5
Baltimore City 15,900 1.0 8.0 9.4 18.5 3.7
19Social Determinants Percent of Percent of Percent of Percent Percent Percent
1st-5th 6th-8th 9th-12th Population Population Population
of Health - Grade Grade Grade (25 Years (25 Years (25 Years
Students Students Students and over) and over) and over)
Education that are that are that are With High
With Less with a
Chronically Chronically Chronically Than a High School Bachelor’s
Absent Absent Absent School Diploma and Degree or
(Missing at (Missing at (Missing at Some College
Diploma or Above
least 20 days) least 20 days) least 20 days) or Associates
GED (2015-2019)
(2018-2019) (2018-2019) (2018-2019) Degree
(2015-2019)
(2015-2019)
Canton 2.1 5.3 27.8 4.6 20.3 75.2
Clifton-Berea 30.3 26.9 63.0 24.4 62.6 13.0
Downtown/Seton Hill 34.7 41.8 59.3 4.8 26.3 68.8
Fells Point 13.2 18.2 50.7 5.5 17.5 77.0
Greater Rosemont 30.8 34.9 55.7 18.7 75.0 6.3
Greenmount East 26.5 35.4 56.2 19.7 68.0 12.3
Harbor East/Little Italy 25.2 34.6 60.1 18.7 40.8 40.5
Inner Harbor/Federal Hill 11.1 15.9 37.0 5.0 20.7 74.4
Madison/East End 18.1 26.5 62.5 24.2 68.1 7.7
Midtown 15.4 28.2 36.5 8.4 30.7 60.9
Oldtown/Middle East 31.3 28.2 59.7 26.1 53.1 20.8
Patterson Park North & East 18.0 27.5 61.6 15.7 36.0 48.2
Poppletown/Terraces/Hollins Market 26.3 26.8 65.5 22.8 57.6 19.7
Sandtown-Winchester/Harlem Park 37.9 34.3 56.6 25.0 68.2 6.8
South Baltimore 5.1 14.9 25.6 7.7 16.2 76.0
Southwest Baltimore 31.0 41.2 61.8 32.1 59.2 8.7
Washington Village/Pigtown 33.3 22.5 52.2 18.5 44.1 37.4
Upton/Druid Heights 34.8 37.1 61.8 21.7 64.3 14.0
CHNA Service Area Estimate 27.7 31.4 57.8 16.1 44.9 39.0
Baltimore City 23.9 24.3 50.6 14.8 53.3 31.9
20Health Outcomes
Life Expectancy
The overall life expectancy at birth in Baltimore City is 72.7 years compared to 71.3 years in the CHNA area.
Life expectancy is highly impacted by deaths among young people, which are often due to intentional and
unintentional injuries. Mortality for ages 1-14 is 2.90 in Baltimore City vs. 3.80 in the CHNA area.
The top causes of death in Baltimore City are cardiovascular disease, cancer, stroke, and drug- and/or alcohol-
related. In the CHNA area, the top causes are cardiovascular disease, cancer, drug- and/or alcohol-related, and
stroke. Among cancer deaths, lung cancer is the most common in Baltimore City, and lung cancer is the most
common in the CHNA area.
While the overall death rates in Mercy’s CHNA Service Area are higher than the city average, the data for the
Downtown/Seton Hill community, Madison/East End, Poppleton, and Southwest Baltmore merits further
examination. The data indicates that residents in these areas are dying far earlier than residents in higher income
neighborhoods. One likely factor in the Downtown/Seton Hill data point could be the disproportionate
concentration of homeless persons in the downtown area. Healthcare for the Homeless estimates that life
expectancy for an individual experiencing homelessness at any point is only 48 years.
21Health Outcomes Life Infant Mortality Mortality Mortality Mortality Mortality Mortality
Expectancy Mortality by Age by Age by Age by Age by Age by Age
(2018) Rate (1-14 (15-24 (25-44 (45-64 (65-84 (85 and
(2018) Years Years Years Years Years over)
old) old) old) old) old)
(2018) (2018) (2018) (2018) (2018) (2018)
Canton 80.80 7.90 - - 6.10 57.40 324.30 1,000.0
Clifton-Berea 67.40 23.00 4.20 18.60 47.80 186.40 394.30 1,497.6
Downtown/Seton Hill 63.20 15.00 25.90 1.40 19.00 188.80 968.00 1,769.2
Fells Point 78.00 7.50 - 5.30 8.60 61.30 336.10 1,444.4
Greater Rosemont 68.50 12.90 1.60 19.50 59.10 158.20 425.40 1,236.7
Greenmount East 67.70 11.70 2.60 12.20 57.40 171.90 488.10 1,092.4
Harbor East/Little Italy 71.90 11.50 1.90 14.50 23.90 125.00 433.40 1,764.7
Inner Harbor/Federal Hill 80.80 1.30 - 3.30 6.60 60.30 291.90 1,218.5
Madison/East End 68.40 7.50 4.20 15.00 40.30 172.80 500.00 1,315.8
Midtown 76.70 9.90 - 2.90 15.90 107.00 367.30 840.3
Oldtown/Middle East 68.90 13.10 5.10 9.70 42.20 184.90 419.40 1,172.4
Patterson Park North & East 72.90 4.80 4.90 10.30 16.70 130.20 449.80 1,114.8
Poppletown/Terraces/Hollins Market 67.20 11.20 2.00 18.60 49.30 215.60 400.90 1,500.0
Sandtown-Winchester/Harlem Park 68.10 8.80 4.10 20.60 59.50 174.40 454.60 996.0
South Baltimore 77.30 2.90 4.00 5.40 6.70 68.60 386.80 1,403.0
Southwest Baltimore 66.40 10.30 5.40 25.50 60.90 196.50 448.20 1,289.5
Washington Village/Pigtown 70.90 10.10 - 9.80 27.10 162.10 472.60 1,066.7
Upton/Druid Heights 68.50 3.80 2.50 24.90 47.70 193.20 420.90 1,089.3
CHNA Service Area Estimate 71.31 9.62 3.80 12.08 33.04 145.26 443.44 1,267.3
Baltimore City 72.70 9.10 2.90 11.70 29.10 127.20 395.20 1,273.8
22Mercy Medical Center CHNA Service Area
Life Expectancy at Birth, Baltimore City, 2018
Cross-Country/ Harford/Echodale
Cheswolde Mt. Washington/ Chinquapin Loch Raven
Coldspring Park/
Greater Belvedere
Roland
Glen-Fallstaff Park/ North
Pimlico/ Poplar Hill Bal�more/ Hamilton
Arlington/Hilltop Guilford/
Homeland Greater
Govans
Northwood Lauraville
Southern
Park Medfield/
Howard Park/ Heights Hampden/
West Arlington Dorchester/ Woodberry/
Ashburton Remington Cedonia/
The
Frankford
Greater Waverlies
Charles
Penn North/ Village/ Belair-Edison
Greater Reservoir Hill
Forest Park/ Barclay Midway/
Mondawmin
Walbrook Coldstream
Dickeyville/ Claremont/Armistead
Franklintown Greenmount Cli�on-
Midtown
Upton/ East Berea
Greater Sandtown-
Druid
Edmondson Rosemont Winchester/ Madison/
Heights
Village Harlem Park Oldtown/ East End Orangeville/
Middle East Pa�erson Park E. Highlandtown
Poppleton/ Downtown/ North & East
Beechfield/ The Terraces/ Seton Hill Harbor East/
Ten Hills/ Southwest Hollins Market Li�le Italy
Highland-
West Hills Allendale/Irvington/ Bal�more Fells Point Canton
town
S. Hilton
Inner Harbor/
Federal Hill
Washington Village/
Pigtown
Southeastern
South Bal�more
Life Expectancy Morrell Park/Violetville
at Birth
Westport/
63.2 - 68.5 Mt. Winans/
Lakeland
68.6 - 70.6 Cherry
Hill
70.7 - 73.1 Ranked into quin�les by
Community Sta�s�cal Area.
73.2 - 76.6 Brooklyn/Cur�s Bay/
Bal�more City: 72.7 Years Hawkins Point
76.7 - 84.7
CHNA Service Area: 71.3 Years
CHNA Service
Area
Hospitals MedStar Good Saint Agnes University of
Mercy Medical Samaritain Hopsital Maryland
Center Hospital Sinai Hospital Medical Center
MedStar Harbor Midtown
Grace Medical The Johns
Hospital Campus
Center Hopkins Hospital
Johns Hopkins MedStar Union University of Indicator Source: Bal�more City
Bayview Medical Memorial Maryland Health Department Map created
Center Medical Center by BNIA-JFI, 2021
23Maternal Health, Birth Outcomes and Infant Mortality
Measures of maternal health are important to understanding the public’s health. The Sisters of Mercy were
originally founded in Dublin, Ireland to care for homeless, abused and neglected women and children. This
influences Mercy’s special attention to mothers and infants. Mercy is the largest birthing hospital in Baltimore
delivering roughly 1-in-5 of all children born in Baltimore City each year. Mercy is the second largest hospital
provider to low-income mothers insured by Medicaid in the state (more than 70% of mothers delivering at
Mercy are Medicaid-insured). Additionally, Mercy has a long-standing practice partnering with Federally
Qualified Health Centers (FQHCs) to improve community health and to help manage high risk populations,
including pregnant women. Mercy currently provides on-site Obstetric services and delivers babies for FQHC’s.
Despite strong efforts among hospital and community providers as well as the successes of the City’s B’more
for Healthy Babies campaign, more must be done to improve the health outcomes for mothers, infants, and
children in our City. Baltimore’s City’s rates of infant mortality, especially in poor neighborhoods, including
those within Mercy’s CHNA Service Area remain unacceptably high. The infant mortaility rate in Baltimore
city is 9.10 vs. 9.62 in the CHNA Service Area.
The teen birth rate in Baltimore City is 21.5 births per 1,000 residents while the same rate in the CHNA
area is 26.8 births per 1,000 residents. 63.1% of pregnant women receive prenatal care in the first trimester in
Baltimore City vs. 65.5% in the CHNA area. The percentage of mothers receiving care has increased in recent
years which may be attributed to the the City’s B‘more for Healthy Babies campaign and Mercy’s efforts.
Maternal Health Teen Birth Rate per 1,000 Percent of Births Where the Mother
Females (Aged 15-19) Received Early Prenatal Care
(2019) (First Trimester) (2019)
Canton 23.3 85.3
Clifton-Berea 20.6 57.5
Downtown/Seton Hill 10.9 74.1
Fells Point 22.2 79.8
Greater Rosemont 22.4 56.5
Greenmount East 24.8 61.4
Harbor East/Little Italy 21.1 72.3
Inner Harbor/Federal Hill 0.0 84.9
Madison/East End 22.8 44.7
Midtown 1.6 78.0
Oldtown/Middle East 29.7 65.8
Patterson Park North & East 39.8 58.2
Poppletown/Terraces/Hollins Market 35.7 49.3
Sandtown-Winchester/Harlem Park 17.5 61.1
South Baltimore 15.4 85.2
Southwest Baltimore 39.2 55.5
Washington Village/Pigtown 34.9 69.4
Upton/Druid Heights 34.2 59.8
CHNA Service Area Estimate 26.8 65.5
Baltimore City 21.5 63.1
24Mercy Medical Center CHNA Service Area
Infant Mortality
Cross-Country/ Harford/Echodale
Cheswolde Mt. Washington/ Chinquapin Loch Raven
Coldspring Park/
Greater Belvedere
Roland
Glen-Fallstaff Park/ North
Pimlico/ Poplar Hill Bal�more/ Hamilton
Arlington/Hilltop Guilford/
Homeland Greater
Govans
Northwood Lauraville
Southern
Park Medfield/
Howard Park/ Heights Hampden/
West Arlington Dorchester/ Woodberry/
Ashburton Remington Cedonia/
The
Frankford
Greater Waverlies
Charles
Penn North/ Village/ Belair-Edison
Greater Reservoir Hill
Forest Park/ Barclay Midway/
Mondawmin
Walbrook Coldstream
Dickeyville/
Greenmount Cli�on- Claremont/Armistead
Franklintown Midtown
Upton/ East Berea
Greater Sandtown-
Druid
Edmondson Rosemont Winchester/ Madison/
Heights
Village Harlem Park Oldtown/ East End Orangeville/
Middle East Pa�erson Park E. Highlandtown
Poppleton/ North & East
Beechfield/ The Terraces/ Downtown/ Harbor East/
Ten Hills/ Southwest Hollins Market Seton Hill Li�le Italy
Highland-
West Hills Allendale/Irvington/ Bal�more Fells Point Canton
town
S. Hilton
Inner Harbor/
Federal Hill
Washington Village/
Pigtown
Southeastern
South Bal�more
Morrell Park/Violetville
Infant Mortality
Rate per 1,000 Westport/
Mt. Winans/
0.0 - 4.6 Lakeland
Cherry
4.7 - 7.6 Hill
Ranked into quin�les by
7.7 - 10.3 Community Sta�s�cal Area.
10.4 - 12.9 Brooklyn/Cur�s Bay/
Bal�more City: 9.1 Hawkins Point
13.0 - 23.0 CHNA Service Area: 9.6
CHNA Service
Area
Hospitals MedStar Good Saint Agnes University of
Mercy Medical Samaritain Hopsital Maryland
Center Hospital Sinai Medical Center
MedStar Harbor Midtown
Grace Medical The Johns
Hospital Campus
Center Hopkins Hospital
Johns Hopkins MedStar Union University of Indicator Source: Bal�more City Health Department
Memorial Map created by BNIA-JFI, 2021
Bayview Medical Maryland
Center Medical Center
25Mercy Medical Center CHNA Service Area
Teen Birth Rate
Cross-Country/ Harford/Echodale
Cheswolde Mt. Washington/ Chinquapin Loch Raven
Coldspring Park/
Greater Belvedere
Roland
Glen-Fallstaff Park/ North
Pimlico/ Poplar Hill Bal�more/ Hamilton
Arlington/Hilltop Guilford/
Homeland Greater
Govans
Northwood Lauraville
Southern
Park Medfield/
Howard Park/ Heights Hampden/
West Arlington Dorchester/ Woodberry/
Ashburton Remington Cedonia/
The
Frankford
Greater Waverlies
Charles
Penn North/ Village/ Belair-Edison
Greater Reservoir Hill
Forest Park/ Barclay Midway/
Mondawmin
Walbrook Coldstream
Dickeyville/
Greenmount Cli�on- Claremont/Armistead
Franklintown Midtown
Upton/ East Berea
Greater Sandtown-
Druid
Edmondson Rosemont Winchester/ Madison/
Heights
Village Harlem Park Oldtown/ East End Orangeville/
Middle East Pa�erson Park E. Highlandtown
Poppleton/ North & East
Beechfield/ The Terraces/ Downtown/ Harbor East/
Seton Hill Li�le Italy
Ten Hills/ Southwest Hollins Market
Highland-
West Hills Allendale/Irvington/ Bal�more Fells Point Canton
town
S. Hilton
Inner Harbor/
Federal Hill
Washington Village/
Pigtown
Teen Birth Rate Southeastern
per 1,000 Morrell Park/Violetville
South Bal�more
Females (Aged
15-19) Westport/
Mt. Winans/
0.0 - 12.7 Lakeland
Cherry
12.8 - 20.5 Hill
Ranked into quin�les by
20.6 - 23.3 Community Sta�s�cal Area.
23.4 - 34.2 Brooklyn/Cur�s Bay/
Bal�more City: 21.5 Hawkins Point
34.3 - 61.5 CHNA Service Area: 26.8
CHNA Service
Area
Hospitals MedStar Good Saint Agnes University of
Mercy Medical Samaritain Hopsital Maryland
Center Hospital Sinai Medical Center
MedStar Harbor Midtown
Grace Medical The Johns
Hospital Campus
Center Hopkins Hospital
Johns Hopkins MedStar Union University of Indicator Source: Maryland Department of
Bayview Medical Memorial Maryland Vital Sta�s�cs Map created by BNIA-JFI, 2021
Center Medical Center
26Qualitative Data
CHNA Public Survey
Mercy collaborated with a consortium of Baltimore City hospitals and the Baltimore City Health Department
to develop and distribute a Community Health Needs Assessment Survey to obtain community feedback and
input from thousands of the Baltimore City and Baltimore County residents regarding community health
and social concerns. Mercy then aggregated survey response data from four zip codes (21201, 21202, 21217,
21231) that align/overlap with its CHNA Community Benefit Service Area shown in detail below (which
includes four other hospitals), representing 617 individual completed surveys. The responses to the geographic,
gender, race, and age demographic questions reflect a healthy and broad sample of Mercy’s CHNA Service
Area, including medically underserved, low income or minority populations.
Survey respondents identified alcohol/drug addiction, mental health, and smoking as the three most important
health problems that affect the health of their community. Survey respondents identified homelessness, lack
of job opportunities, and neighborhood violence as three most important social/environmental problems that
affect the health of their community. Survey respondents identified health care costs, no insurance, and lack
of transportation as the three most important reasons people in their community do not access health care
treatment. These top concerns are the same as the prior 2018 CHNA survey.
Survey respondents also answered several COVID-19 related questions. The survey also provided space
for free response/written feedback regarding ideas or suggestions individuals had to improve the health in
their community. Here, survey respondents identified COVID-19 testing and vaccination, better access to
health care, affordable insurance, and community safety as the primary suggestions to improve health in their
community.
The complete questions and results of the Community Health Needs Assessment Public Survey are summarized
and shown below.
What is your zip code?
Q1: What is your Zip Code?
300
250
Frequency
200
21201 107
150
21202 264 100
50
21217 174
0
21231 72 21201 21202 21217 21231
27Mercy Medical Center CHNA Service Area
by Zip Code
Cross-Country/ Harford/Echodale
Cheswolde Mt. Washington/ Chinquapin Loch Raven
Coldspring Park/
Greater Belvedere
Roland
Glen-Fallstaff Park/ North
Pimlico/ Poplar Hill Bal�more/ Hamilton
Arlington/Hilltop Guilford/
Homeland Greater
Govans
Northwood Lauraville
Southern
Park Medfield/
Howard Park/ Heights Hampden/
West Arlington Dorchester/ Woodberry/
Ashburton Remington Cedonia/
The
Frankford
Greater Waverlies
Charles
Penn North/ Village/ Belair-Edison
Greater Reservoir Hill
Forest Park/ Barclay Midway/
Mondawmin
Walbrook Coldstream
21217
Dickeyville/
Greenmount Cli�on- Claremont/Armistead
Franklintown Midtown
Upton/ East Berea
Greater Sandtown-
Druid
Edmondson Rosemont Winchester/
Heights
21202 Madison/
Village Harlem Park Oldtown/ East End Orangeville/
21201 Middle East Pa�erson Park E. Highlandtown
Poppleton/ North & East
Beechfield/ The Terraces/ Downtown/ Harbor East/
Ten Hills/ Southwest Hollins Market Seton Hill Li�le Italy 21231
Highland-
West Hills Allendale/Irvington/ Bal�more Fells Point Canton
town
S. Hilton
Inner Harbor/
Federal Hill
Washington Village/
Pigtown
Southeastern
South Bal�more
Morrell Park/Violetville
Westport/
Mt. Winans/
CHNA Service Lakeland
Cherry
Area Hill
Surveyed Zip
Code
Brooklyn/Cur�s Bay/
Hawkins Point
Community
Sta�s�cal
Area
Hospitals MedStar Good Saint Agnes University of
Mercy Medical Samaritain Hopsital Maryland
Center Hospital Sinai Hospital Medical Center
MedStar Harbor Midtown
Grace Medical The Johns
Hospital Campus
Center Hopkins Hospital
Johns Hopkins MedStar Union University of
Bayview Medical Memorial Maryland Map created by BNIA-JFI, 2021
Center Medical Center
28You can also read