BETTER ENVIRONMENT, BETTER HEALTH - A GLA guide for London's Boroughs London Borough of Southwark - Greater London Authority
←
→
Page content transcription
If your browser does not render page correctly, please read the page content below

BETTER ENVIRONMENT,
BETTER HEALTH
A GLA guide for London’s Boroughs
London Borough of Southwark
BETTER ENVIRONMENT, BETTER HEALTH

COPYRIGHT

Greater London Authority
November 2013

Published by
Greater London Authority
City Hall
The Queen’s Walk
More London
London SE1 2AA
www.london.gov.uk
enquiries 020 7983 4100
minicom 020 7983 4458
ISBN
Photographs ©
Copies of this report are available
from www.london.gov.uk

Please print and circulate widely

                                      i
BETTER ENVIRONMENT, BETTER HEALTH

CONTENTS
CONTENTS                            1
FOREWORD                            2
INTRODUCTION                        3
GREEN SPACES                        5
ACTIVE TRAVEL & TRANSPORT           8
SURFACE WATER FLOOD RISK            12
AIR QUALITY                         15
HEALTHY FOOD                        18
FUEL POVERTY                        21
OVERHEATING                         24
REFERENCES                          28
FURTHER READING                     31
PUBLIC HEALTH OUTCOMES FRAMEWORK    32
DATA APPENDIX                       35
ACKNOWLEDGEMENTS                    42

                                         1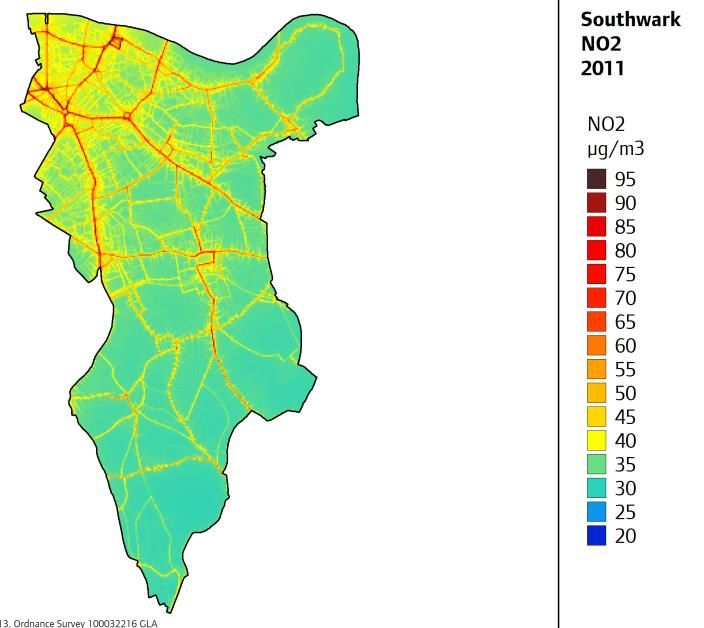
BETTER ENVIRONMENT, BETTER HEALTH

FOREWORD
The Mayor’s vision is for London to be the ‘greatest city on earth’ – this means making the city a
great place for Londoners to live, relax, work and raise a family, whilst being attractive to investors.
However there are significant inequalities in the health and quality of Londoners’ lives. 2009-11 ONS
figures show that average healthy life expectancy reduces by almost one year for every stop
eastwards on the District Line between the boroughs of Richmond and Tower Hamlets – a difference
of 18 years. The reasons for this are complex but the evidence points strongly to the important impact
of the wider determinants of health. This inequality means some Londoners are unable to benefit from
and contribute to the city’s dynamism because of preventable health problems. The Mayor wants to
ensure all Londoners have the chance to participate in what London has to offer.

Furthermore, if we are to maintain and improve London’s position as the attractive world city it is, we
need to create a resilient city, able to deal with extreme weather events, and a city that offers a high
quality of life with green spaces, a fantastic public realm and a pleasant, healthy environment.

Local authorities have a unique role to play in achieving these goals, and with their new
responsibilities for public health they have a new set of capabilities and levers for catalysing change.
Better Environment, Better Health offers a bespoke guide to each of London’s thirty three boroughs,
describing the impact of seven wider environmental determinants of health on their specific
populations and highlighting possible actions that could be taken to promote a better environment
leading to better health and well-being, overall, for Londoners.

For example we know that by encouraging walking and cycling we are not only helping to improve
London’s air quality but also cardiovascular health, whilst reducing levels of obesity. The guides
demonstrate how such an approach can be taken on a range of issues, without necessarily adding to
the financial burden on boroughs’ already squeezed budgets, just by doing things differently.

We hope you will find value in the guide and will use it to drive improvements locally to create strong
environments which promote health and well-being, and are resilient.

Finally, we would like to thank the project team for writing the guides and their drive in taking this
project forward.

Victoria Borwick                                               Matthew Pencharz
Deputy Mayor of London                                         Senior Advisor for Environment
and Mayoral Health Advisor                                     and Energy
                                                                                                           2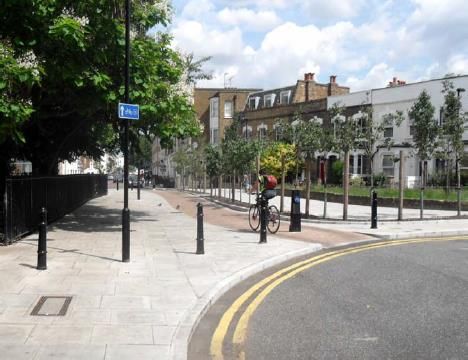
INTRODUCTION
What is likely to shape the health of our communities over the next twenty or thirty years? What will
improve quality of life? What will help people live longer, particularly those most likely to die early?
What will improve people’s quality of life, reducing years lost to disability and poor mental and
physical health? What will improve the health and wellbeing of children and young people? The
United States Center for Disease Control and Prevention (CDC) has argued that in the 20th century
public health measures added 25 years to the life of an average American.1 In its list of top ten
interventions half are closely connected to the environment. The same list would be likely to apply to
the UK and London. In the 21st century public health measures, including measures seeking to
improve the environment, are likely to be as important in supporting good health as improvements in
healthcare. We need to prepare, assess and plan for extreme weather events and their impacts not just
to improve Londoners’ health and wellbeing but to increase economic prosperity, for business and
service continuity and to strengthen community resilience.

In this guide we focus on seven environmental issues and their relationship to health:
    • Green spaces
    • Active travel & transport
    • Surface water flood risk
    • Air quality
    • Healthy food
    • Fuel poverty
    • Overheating

For each of these we ask certain questions:
    • What is the issue and how do we measure it?
    • What is its impact on health? What is the evidence?
    • Who will experience the impact most?
    • What is the local borough picture?
    • What are the key actions to promote good health?

We also provide links to the Public Health Outcomes Framework and suggested further reading.
The aim of the bespoke borough guides is to maximise opportunities for improving health and well-
being, as well as enhancing community resilience. They are aimed at professionals working in health,
environment, regeneration, economic development or any aspect of shaping local places, as well as
local people interested in improving the quality of life in their communities. Where issues are locally
relevant we hope this document will help to start a conversation which enables them to be identified
and addressed in borough Joint Strategic Needs Assessments (JSNA) and health and wellbeing
                                                                                                          3
strategies. These guides do not cover all of the wider environmental determinants of health. For
example, they do not look at some aspects of housing (such as overcrowding), workplace health,
wider resource use, access to services, water resource management or noise pollution. More broadly,
issues of planning and environmental control tie many of these areas together. How we shape
ongoing development and use of our town centres, neighbourhoods and business districts presents
opportunities to maximise the health of users: residents, employees and visitors. Similarly,
environmental consideration provides the scope to address potential risk to resilience, health and well-
being as well as promoting good practice amongst, for example, businesses, landlords and facilities
managers.

                                                                                                      4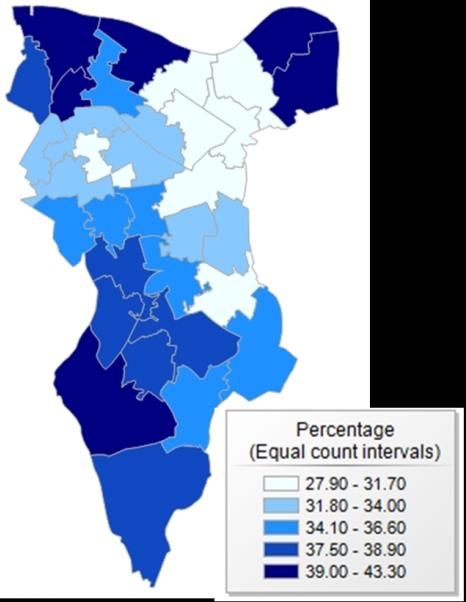
GREEN SPACES
Accessible green space has long been recognised as a wider environmental determinant of good
health. Wide ranging research shows strong evidence that outdoor spaces have a beneficial impact on
both physical and mental well-being2. When considering green space it is helpful to think about both
access and use: availability being a necessary but insufficient indicator and determinant of use. A
range of data are available on both access and use including the Natural England MENE survey
(frequency, mode of access, reasons3); London.gov.data: 'Access to Public Open Space and Access to
Nature by Ward'4; and Sport England: Active people Survey (physical activity rate)5.
What is the impact on health?
Accessible, safe green space is shown to reduce mental distress, depression and Attention Deficit-
Hyperactivity Disorder (ADHD) symptoms in children. Access to a garden or living a short distance
to/from green areas, as well as having the potential to lead to improvements in the environment, are
associated with a general improvement in mental health and wellbeing.6 Both the Marmot Review and
NICE have highlighted evidence that the presence of good quality outdoor green spaces encourages
physical activity7 which is important across a wide range of health issues such as cardiovascular
diseases, obesity, type 2 diabetes and mental/physical health. Increasing and improving the
proportion of green spaces in urban centres also has a secondary positive impact on health through
other wider environment determinants of health such as urban heat-island effect, surface flood risk
and air quality.
Who will experience the greatest impact?
Urban residents (through impact on quality of life)
Older people and children
People suffering from obesity, cardio-vascular diseases, diabetes
People suffering from mental distress and depression.
The Southwark Picture
• 25 per cent of the borough surface has green space coverage; 6 per cent below the London
average.8
• Within Southwark over 50 per cent of households in 7 out of 20 wards have deficient access to
nature.9
• 20 per cent of Southwark’s population participate 5 times per week in physical activity for at least
30 minutes and nearly 60 per cent participate once a week which is above the London average.10
• Southwark’s adult obesity prevalence is 23 per cent, which is higher than the London rate, 21 per
cent, but lower than the national rate, 24 per cent.11
5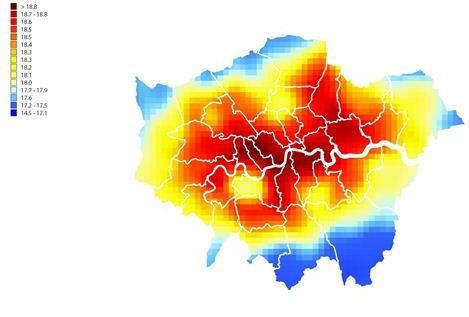
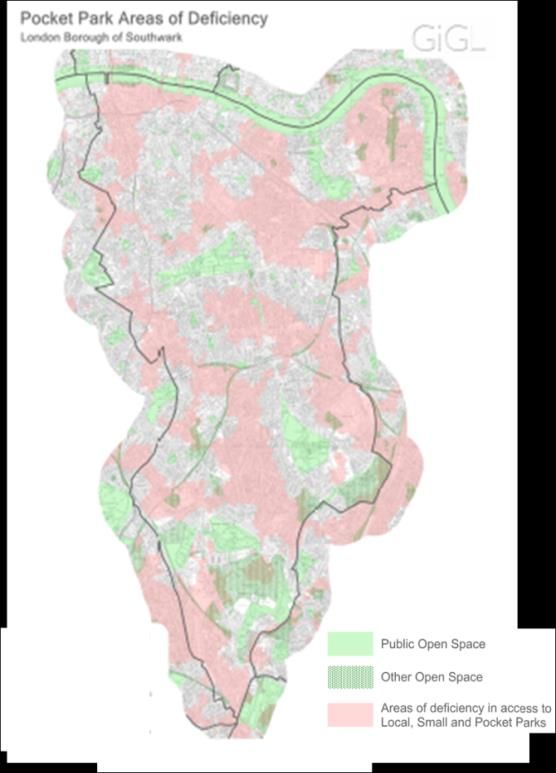
Figure 1 Green Spaces in Southwark
Pink coloured areas are defined as area of deficiency in access to local, small and pocket parks.
Proximity rate is +/- 400m from households.

http://www.gigl.org.uk/Ourdatasets/Openspace/tabid/117/Default.aspx

Potential actions:

Given the significant relationship between health and green spaces in the urban environment some
key actions can be identified to improve quality and proximity in order to enhance access and use.
This includes considering:
• All London Green Grid Supplementary Planning Guidance to improve biodiversity function and
   connectivity of green spaces;12
• The Green Flag Award system to improve quality and promote access to green spaces.13
• Promoting physical activity in outdoor spaces through “outdoor gyms” and “guided walking
   exercise prescription” as a way to recover from cardiovascular diseases and illness.14
See also sections on surface water flood risk and healthy food.

                                                                                                     6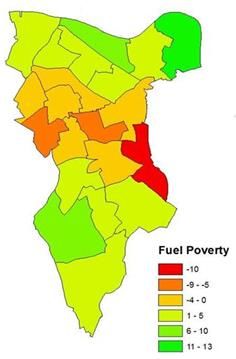
Case Study: Regenerating Burgess Park, London Borough of Southwark
The regeneration of Burgess Park, in Southwark, was underpinned by a comprehensive plan that
made the focus of the park a place for healthy living, showing how to combine ’ natural’ regeneration
with health promotion15. This has also included opportunities for investment, growth and jobs. For
example improved access to, and routes through, the park, alongside enhancements to the lakes,
planting, lighting and on-site facilities, has made the park a much more attractive and welcoming
place, encouraging play and informal recreation. The park also has over 10 km of running, cycling and
fitness routes and a new BMX track, to cater for more formal sport and physical activity.
Contact: Ruth Miller, Burgess Park Project Manager
ruth.miller@southwark.gov.uk

Links to Public Health Outcomes Framework                    Suggested further reading

Primary                                                      • Planning for Health (2009) HUDU
1.16 Utilisation of outdoor space for exercise/health        • The Marmot review (2010)
reasons                                                        www.instituteofhealthequity.org
Additional (for example)                                     • www.nice.org.uk
2.6 Excess weight in 4-5 and 10-11 year olds                 • Benefit of Urban Parks, IFpra (2013):
2.13 Proportion of physically active and inactive adults     • www.ecehh.org
2.23 Self-reported well-being                                • www.naturalengland.org.uk
                                                             • www.hphpcentral.com
                                                             • CMO (2011) Start Active, Stay Active

                                                                                                       7
ACTIVE TRAVEL &
TRANSPORT
Travel is essential for connecting people to employment, recreation, education and health and
community services. Most people travel in some way every day, making it part of everyday life and
therefore a factor that can greatly affect the health of all London’s citizens16. Travel includes walking
and cycling, use of private vehicles, public transport and goods vehicles. In London more than 80 per
cent of journeys take place on roads either by motor vehicle, bike or on foot; therefore road transport
and street environments have a very significant impact on health and wellbeing17. There are
inequalities in the impact of transport upon health, with the most deprived people and those using the
most heavily trafficked roads experiencing the most negative health impacts18. Only a few London
boroughs include a dedicated transport focus in their Joint Strategic Needs Assessment (JSNA),
suggesting the impact of travel on health may be underestimated.
What is its impact on health?
A comprehensive public transport network provides many health benefits including access to services,
reducing social isolation and increasing work and social opportunities. A major benefit of travel in
London is that it enables people to maintain regular physical activity via walking (particularly as part
of public transport trips) and cycling. Only around 20 per cent of Londoners currently meet the
minimum recommendation for physical activity of 150 minutes per week19. Everyday physical activity is
essential for good physical and mental health, contributing to the prevention of over 20 diseases
including obesity, type 2 diabetes, cardiovascular disease and some cancers20. Cycling and walking can
be easily incorporated into daily routines to meet physical activity needs. In London, approximately
4.3 million trips currently made by car or public transport have been identified as easily cyclable21.
Creating opportunities which enable Londoners to walk and cycle has other potential health benefits
including access to safe, green spaces. This could lead to reductions in congestion which, in turn, may
reduce overheating and improve air quality. The negative impacts of transport in London are
concentrated in the London’s most heavily trafficked streets, where high concentrations of vehicles
contribute to air and noise pollution and increased injury risk22. This can create the impression of a
hostile environment for walking and cycling and can exacerbate health inequalities. Motor vehicles are
responsible for 41-60 per cent of air pollutants in the UK, which have an impact on cardiovascular and
respiratory diseases. People who live on or use heavily trafficked streets are the most adversely
affected.
8The Southwark Picture
On average 582,000 trips per day are made by people in Southwark, one of the highest numbers in
London.23
Many people participate in active travel. The percentage cycling to work is double the Greater
London average.
Use of motor vehicles is 14 per cent below the London average.24
There was an average of 1,137 casualties and 6 fatalities per year on Southwark’s roads between
2005 and 200: the 4th highest in London.
The most heavily used road (excluding motorways) is the A3 with an average daily flow of 65,000
motor vehicles.25
The borough has one cycle super highway and three more proposed in the Mayor’s ‘Vision for
Cycling’.26
Figure 2 Journeys in Southwark by modal share
Source: London Travel Demand Survey
Potential actions:
• Designing street environments to encourage walking and cycling.
• Designing and engineering roads to reduce motor vehicle speed and implement 20mph zones
where appropriate.
• Promoting a network of roads and paths that are safe and convenient for cycling and walking.
• Supporting walking and cycling by ensuring that, where possible, the needs of cyclists and
pedestrians are considered before other road users.
9• Promoting cycling through information, maps and cycle hire schemes.
• Improving safety of heavily trafficked streets where most traffic related health risk is concentrated.
See also section on air quality.
Case Study: Cycling across Hackney
Hackney has the highest levels of cycling in London. There are more cyclists than motorists in many
parts of the borough. This is evidenced by the fact that 6 per cent of journey’s originating from
Hackney are on bike, higher than any other borough in London23. Since 2001 the Council has sought
to increase the areas that are cycle friendly by improving the design and increasing the accessibility of
the road network for cyclists.27
• Road safety has been improved by reducing motor traffic speeds and volumes. The aim is to
enforce 20 mph speed limits across the borough on all residential roads.27
• Systematic improvements have been made to the public realm for pedestrians, cyclists and public
transport users and a number of designated cycle routes such as the Hackney Park cycle route have
been created.27
• Hackney has invested in a range of cycle parking bays including lockers in estates, hangars (on
street bike/storage lockers), on residential streets and large bike ports at transport hubs such as
railway stations and town centres.
• A comprehensive free cycling training programme has targeted a range of audiences.27
Contact: Ben Kennedy, Hackney Council, ben.kennedy@hackney.gov.uk
Example of a cycling improvement scheme Wordsworth Road/Palatine Road, Hackney
Links to Public Health Outcomes Framework Suggested further reading
Primary • Healthy Transport Healthy Lives, British
2.13 Proportion of physically active and inactive Medical Association (BMA)
adults • NICE Walking and Cycling, Local
Additional (for example) Government Briefing
1.16 Utilisation of outdoor space for exercise/health • Mayors Vision for Cycling, 2013 GLA
reasons • London Borough of Hackney Sample of
2.7 Hospital admissions caused by unintentional and Schemes for cycling & public realm (2013)
10deliberate injuries in under 18s • What are the health benefits of active
3.1 Fraction of mortality attributable to particulate travel: A systematic review of trials and
air pollution cohort studies, PloSOne, 8
11SURFACE WATER FLOOD
RISK
Surface water flooding describes flooding on the land surface from sewers, drains, groundwater and
runoff from land after a heavy rainfall event28. Surface water flooding events are difficult to predict
but can cause significant disruptions to local populations and to health and other services. London is
vulnerable to surface water flooding because some areas have poor drainage systems and large areas
of impervious surfaces29. Approximately 480,000 London properties and ten hospitals are at risk of
surface water flooding in London30. Surface water flooding is already a considerable risk and one that,
without action, will increase in London due to population growth, urban expansion and ageing of
drainage systems. In addition, changing climate patterns are likely to increase the number and
intensity of large magnitude precipitation events leading to a likelihood of more frequent and larger
magnitude surface water flooding events. Local Flood Authorities are responsible for mapping,
assessing and managing local flood risks, identifying whom and what is at risk and the vulnerability of
services such as hospitals and schools to surface water flooding.
The Mayor’s Regional Flood Risk Appraisal identifies surface water flood risk as the most likely cause
of flooding in London. The GLA, Thames Water, the Environment Agency and London Councils have
been developing and delivering a programme to manage this risk, known as Drain London.
There are multiple ways in which flooding can create health risks:
• Fast flowing water has multiple potential hazards such as moving debris which can cause physical
injury and even death. Contaminated flood water containing pollutants such as chemicals and
sewage can cause disease.
• Flooding of health facilities results in disruption to access to healthcare facilities, with increased
difficulty providing routine medical care and increased patient admissions in neighbouring facilities.
• Exhaust emissions from machinery operating in the clean-up process and recovery from a flood can
cause carbon monoxide poisoning31.
• Disruptions in flood recovery, fear of repeat events and added effects of stress due to insurance
claims and refurbishing properties can cause mental health problems. Up to 25 per cent of people
who experienced flooding in their homes in the major UK floods in 2007 experienced mental health
issues after the event32.
Who might experience the greatest impact?
Some areas in London are at risk of surface water flooding particularly where there is inadequate
sewer/drainage capacity, and some groups are at greater risk4. These include people with limited
mobility or/and those who are dependent on medication and/or regular healthcare at home or at a
12health/social care facility. Those with less flood awareness due to weak social networks and limited or
no access to public warning systems and/or information are also at risk.
The Southwark Picture
The Environment Agency will be releasing a national surface water flood risk map for each London
borough in December 2013. Whilst this will show the areas at risk it should also be noted that any low
lying area could also potentially be affected but may not be visible on the maps because of the
difficulty in assessing surface water flood risk. The maps will provide borough-specific assessments.
Potential actions:
• Developing emergency plans to reduce effects of surface water flood risk.
• Including integrated emergency planning for priority groups/services. Developing land
management strategies such as green roofs to reduce likelihood of surface water flooding.
• Incorporating Sustainable Urban Drainage Systems (SuDS) as an alternative to traditional
approaches to managing runoff.
• Identifying vulnerable and isolated people and implementing early warning systems and evacuation
plans.
• Planning for disruption of infrastructure and increase in patient volumes at health and social care
facilities.
See also section on green spaces and healthy food
Case studies:
Purley (LB Croydon) community flood plan 6
• Purley is vulnerable to flooding and experienced a large flood event in 2007. In response the
community developed a Community Flood Plan.
• The flood plan is owned by the community, and aims to reduce the impact of flooding.
• It advises the community on how to prevent flooding and what to do if it happens.
• It is a low cost but effective way of reducing a wide range of impacts of flooding.
• The community has created a number of flood wardens who play a central role in advising local
citizens and businesses on the flood risk and actions they can take to reduce the impact and nature
of flood events.
Surface water flooding event, London, July 2007 7
• In July 2007, 121mm of rainfall fell in London, mostly on July 20th, causing some significant
surface water flooding.
• Approximately 400 properties were flooded, 158 schools affected and two hospitals were closed as
a result.
• The closure of St George’s Hospital caused major disruption.8
13Links to Public Health Outcomes Suggested further reading
Framework
Primary: • GLA Regional Flood Risk Appraisal, 2013
3.7 Comprehensive, agreed inter- • Drain London-
agency plans for responding to public http://www.london.gov.uk/priorities/environment/loo
health incidents and emergencies king-after-londons-water/drain-london Programme
London Climate Change Adaptation Strategy
Additional (for example) • Multi-Agency Flood Plan, LB Havering, 2012
3.6 Public sector organisations with a • Floods in the European Union, Health effects and their
board-approved sustainable prevention (2013), World Health Organisation (WHO)
development management plan
14AIR QUALITY
Good air quality has long been recognised a basic requirement for good health. The UK Air Quality
Standards Regulations 2000, updated in 2010, set standards for a variety of pollutants that are
considered harmful to human health and the environment. These are based on EU limit values and are
for a range of air pollutants: sulphur dioxide, nitrogen dioxide, oxides of nitrogen, particulate matter
(PM10 and PM2.5), lead, benzene, carbon monoxide, benzo(a)pyrene and ozone.
Much of the focus of air quality action is on nitrogen dioxide (NO2) and particulate matter (PM).
Particulate matter (PM10 and PM2.5) refers to a complex mixture of non-gaseous particles of varied
physical and chemical composition. It is categorised by the size of the particulate. In London, road
traffic is a significant source of PM mainly from exhaust emissions and wear, tyre and brake wear and
dust from road surfaces.
In addition, older furnaces and boilers may have an impact on the overall air quality environment
within a house. Poor air quality could potentially compromise health and well-being.
It should be noted that exceedences apply across the whole of London, particularly near built up areas
and major roads.
What is the impact on health? What is the evidence?
Long-term exposure to poor air quality can contribute to the development of chronic diseases and can
increase the risk of respiratory illness. In Greater London it is estimated that the equivalent of 4,267
deaths in London in 2008 were attributable to long-term exposure to PM2.5. It should be noted that
this does not relate to real individuals, but is a statistical construct whereby all health impact
associated with air pollution are amalgamated. Since everyone breathes the air where they are, a more
realistic interpretation is that the risks are distributed across the whole population, with a total
mortality impact of the concentrations equivalent to that number of deaths. At high concentrations
NO2 can result in inflammation of a person’s airways; long-term exposure can affect lung function and
respiratory symptoms and can increase asthma symptoms. PM aggravates respiratory and
cardiovascular conditions. The smaller the particle, the deeper it will deposit within the respiratory
tract. The impact of PM2.5 on health is especially significant.
Who may experience the greatest impact?
- People who live or work close to areas with poor air quality
- People with respiratory problems
- People with heart problems
15The Southwark Picture
• On some of Southwark’s main arterial roads there are high concentrations of NO2 (see map) which
are above the recommended limits.
• Statistical tools are used by public health specialists to try to understand the comparative impact of
different factors on mortality. Using these techniques, Southwark is the 5th most affected area by
poor air quality in London. 33
• In 2011 the GLA identified nine Air Quality Focus Areas within Southwark.
Figure 3 NO2 emissions on Southwark Roads
Potential actions:
• Promoting a modal shift to encourage higher proportions of walking, cycling and use of public
transport and less use of cars. This could include a wide range of measures from systemic action
within the planning and transport system to one-off events such as car free days. Such measures
could lead to significant improvements in air quality.
• Promoting energy efficiency in homes, public and commercial offices. For more information see the
Energy Company Obligation34.
• Individual steps could be taken to:
16a) reduce personal contribution to air pollution such as engine idling; and,
b) reduce risk of exposure where it is potentially hazardous to health (particularly for people with
underlying vulnerabilities) through systems such as airText.
See also section on active travel and transport.
Case studies:
Reducing exposure – City Air Mitigating impact - Croydon Air Text
‘CityAir’ was launched in May 2011 in the City In 2005 the London Borough of Croydon
of London to encourage businesses to help to developed with the European Space Agency
improve local air quality. and Cambridge Environment Research
Consultants an air quality forecasting service
Best practice guidance and case studies were called ‘airTEXT’. AirTEXT provides
produced to provide advice to City businesses information on pollution levels in the
on reducing emissions from buildings, borough using ‘low’, ‘moderate’ and ‘high’
encouraging staff to walk and cycle in the City, bandings. Whenever moderate or high
using purchase contracts to require low pollution levels are expected, subscribers to
polluting vehicles and building air quality airTEXT receive a text message, call or
targets into environmental reporting. voicemail. This enables recipients to
Information is available at respond, if necessary, for example by taking
www.cityoflondon.gov.uk/cityair. To date over a different route/mode of transport to work,
50 businesses have been engaged, keeping their medication with them or not
representing over 40,000 employees. CityAir exercising outside on certain days. In 2012 a
employee walking campaigns have been very new airTEXT app was developed which
popular. provides information on four health-relevant
Contact: Ruth Calderwood alerts: UV, pollen, air quality and
ruth.calderwood@cityoflondon.gov.uk temperature. Currently around 10,000
people use the airTEXT service through text,
Twitter or the website.
Links to Public Health Outcomes Suggested further reading
Framework
Primary • GLA Local Authority Air Quality Guides
3.1 Fraction of mortality attributable to • www.londonair.org.uk
particulate air pollution • www.comeap.org.uk
• NICE Guidance PH41 Walking and
Additional (for example) cycling: local measures to promote
2.13 Proportion of physically active and inactive walking forms of travel or recreation
adults • Kilbane-Dawe (2012) 14 Cost Effective
1.14 The percentage of the population affected Actions to Cut Central London Air
by noise Pollution
17HEALTHY FOOD
Access to healthy food is an important wider environmental determinant of health. Improving the food
environment means enhancing the availability of affordable and nutritious food and recognising the
relationship between the geography of food retailing and dietary patterns35. It also means considering
of sustainable production, processing and delivery. Policy attention has focused on the role of local
planning measures and the impact of large supermarkets, provision of food growing places, the
physical environment and education on a healthy diet. Many factors influence the availability of
healthy food. The predominance of unhealthy food and low income may interact with environmental
factors to limit access.
Access to healthy food can be measured through the following indicators: cost, quality, geography,
mode of transportation, physical proximity and socio-economic variables.
What is the impact on health? What is the evidence?
Reduced access to healthy food and the ready and cheap availability of unhealthy foods (such as fast-
food and takeaway outlets) increases the risk of a diet based on high consumption of sugar, saturated
fat and salt and low in vegetables and fruit36. This could lead to obesity, cardiovascular disease, type 2
diabetes and some cancers associated with obesity. The National Obesity Observatory estimated the
cost to the UK economy of overweight and obesity to be £15.8 billion per year (2007). This has an
impact on children as well as adults. Studies have also found that an increased density of fast food
restaurants is directly related to increased Body Mass Index (mass index showing body fat based on
height and weight) and that having a fast food outlet within 160m of a school is associated with a 5
per cent increase in obesity37.
The Southwark Picture
Southwark’s adult obesity rate is 23 per cent. This is higher than the London average (21 per cent),
but lower than the national average (24 per cent).38
Southwark’s obesity rate among primary school children (year 6) is 29 per cent. This is significantly
higher than the national and London rates (19 and 23 per cent respectively).39
In 11 out of 33 Middle Super Output Areas (two darkest blue areas on map), 38-43 per cent of the
population consume five portions of fruits and vegetables a day.40
20 per cent of Southwark’s population participate five times per week in physical activity for at
least 30 minutes and nearly 60 per cent participate once a week.41
18Figure 4 Healthy food consumption in Southwark
Model based consumption of fruit and vegetables in Southwark by ward, 2006-8
LA population consuming five portions of fruits and vegetables a day.
Potential actions
• Developing schemes to promote local and easily accessible healthy food from retailers (for example
www.cieh.org/healthier-catering-commitment.html).
• Using planning controls to manage proliferation of fast-food outlets on high streets and near
schools.
• Promoting the GLA Healthy Schools London Awards Initiative (www.healthyschoolslondon.org.uk).
Healthy food choice in schools is recognised as a way to tackle obesity and chronic diseases caused
by poor nutrition. This includes diet, education, and healthy meals provided at schools and
accessible from nearby areas.
• Capital Growth (www.capitalgrowth.org) initiatives have the potential to promote community food
growing. These activities reconnect people to the food system, engages them in issues such as
where their food comes from, seasonality, healthy eating, and food security.
• Procuring from local food suppliers and retailers, signed up to the Healthier Catering Commitment
Plan.
See also section on green spaces and surface flood risk.
19Case Study: Fast-food Fix – LB Waltham Forest - Tackling the Takeaways: Making an Impact
• Community engagement on ‘takeaways’ in the borough identified dissatisfaction with the number
and location of 241 local hot food takeaways (HFT). This included schools, concerned that the
proximity of HFTs to schools had a negative impact on healthy eating programmes.
• A HFT corporate steering group was established to:
- Ensure existing HFT businesses operated as responsibly as possible;
- Develop strategies to tackle the wider social, environmental and economic issues associated
with the proliferation of HFTs in the borough.
Achievements:
• Supplementary planning documents were developed restricting the opening of new HFT shops. So
far, 20 applications have been refused planning permission and only 4 HFTs have been given
planning permission.
• HFTs in the borough have been reduced from 241 to 194
Contact: Gordon Glenday, Head of Planning Policy and Regeneration
gordon.glenday@walthamforest.gov.uk
Links to Public Health Outcomes Suggested further reading
Framework
Primary: NICE guidance: www.nice.org.uk
2.11 Diet Takeaways Toolkit (2012): see www.london.gov.uk
District Action on Public Health:
Additional (for example): http://districtcouncils.info/;
2.6 Excess weight in 4-5 and 10-11 year CIEH Food Policy, (2013): www.cieh.org
olds
Healthy People, Healthy Lives, (2011);
2.12 Excess weight in adults
Good planning for Good Food: see
2.17 Recorded diabetes
www.sustainweb.org/publications/?id=192
20FUEL POVERTY
There are three factors that can result in fuel poverty, often in combination: low income, poor energy
efficiency in homes and increasing energy prices. A household is now defined as ‘fuel-poor’ if its total
income is below the poverty line (taking into account housing energy costs) and its energy costs are
higher than typical for its household type.42 Data on fuel poverty is collected from the English Housing
Survey Domestic Fuel Inquiry and published annually by the Department of Energy and Climate
Change (DECC). More than 560,000 households in London are estimated to be spending more than
ten per cent of their basic income on energy (the previous official definition of fuel poverty).43. Fuel
poverty has the potential to have an adverse impact on children already in poverty as well as to
increase the numbers of children living in poverty. Fuel poverty is also known to have an impact on
well-being as indicated in self-reported well-being surveys.44
What is the impact on health? What is the evidence?
Fuel poverty can have a negative impact on health, especially on people with pre-existing medical
conditions. Fuel poverty results in cold homes, exacerbating cardiovascular and respiratory conditions,
rheumatoid arthritis and influenza, and negatively affects mental health.42 The effects of fuel poverty
may be compounded by social isolation, poor emotional well-being, reduced mobility and poor diet.
Cold homes are also known to affect cognitive performance. However, actual deaths are only one part
of the problem. Age UK estimates the cost to the NHS of cold homes as £1.36 billion per year (not
including additional costs to social services for subsequent care).45 The recent DECC fuel poverty
framework attempts to monetise the health impacts of fuel poverty. It refers to a model estimating
changes in people’s health from the installation of energy efficiency measures (resulting from changes
in the indoor temperature and pollutant exposure).46
Who might experience the greatest impact?
Fuel poverty affects vulnerable groups such as older people, the group most likely to suffer excess
winter deaths. Children, people with disabilities and/or those living in deprivation are also at greater
risk of suffering from the effects of fuel poverty as they often need to spend longer time indoors and
require heating for longer periods of time. Additionally, private sector tenants are at significantly
greater risk of encountering the worst housing quality and are also least likely to access support or
feel empowered to do anything about the issue.
21The Southwark Picture
• The older population of Southwark is projected to rise from 22,900 (2012) to 30,200 (2025) and
43,500 (2040). 47
• A Fuel Poverty Risk score has been developed. There are some stark disparities between wards with
Surrey Docks achieving the second lowest risk score of all London wards but Nunhead being 617th
out of 625 wards and at significantly greater risk.
• Three Southwark wards are low risk of fuel poverty and seven are at high risk according to the fuel
poverty risk indicator. Three wards have shown significant improvement between 2006-2010, but
for Peckham there was a significant decline during this period.48
Figure 5 Fuel Poverty risk in Barnet The Fuel Poverty Risk Index was
developed by the London Assembly
Health and Public Services
Committee in their investigation into
fuel poverty in London. It is
calculated on the basis of twelve
indicators across four sections:
Housing
Dwellings without central heating
Uninsulated cavity walls
Lofts with less than 150mm
insulation
Health
Health Deprivation & Disability
domain (ID2010)
Standardised Mortality Ratio
Incapacity benefit claimant rate
Older people
People aged 60 and over
Older people claiming pension credit
Worklessness
Unemployment
Poverty
Income support claimant rate
Child poverty rates
Households classified 'fuel poor'
Source: GLA (2013) Fuel Poverty Risk Indicators Tool,
available on London Datastore
22Potential actions:
The first key step to any intervention is to identify vulnerable areas/individuals and map the extent of
the problem. Vulnerable individuals and households can be identified and supported through:
• Close collaboration with third-sector organisations which are working with vulnerable
groups/isolated populations/people to refer or inform them of available support.
• Home energy improvements as a vital sustainable solution to fuel poverty. There are opportunities
through initiatives such as the Green Deal and Energy Company Obligation49. The Mayor’s RE:NEW
Programme support team50 can offer advice on funding, procurement and best practice to partner
with energy efficiency providers. In addition, the issue of overheating should be taken into account
when implementing any energy efficiency works especially wall and loft insulation. Whilst take up
of the Green Deal to date has not been significant, it remains an important delivery mechanism to
reduce fuel poverty in London. (See section on overheating).
• Promoting collaboration between local authorities and private landlords in line with upcoming
energy efficiency legislation (2018 energy efficiency requirements51).
• Raising awareness of benefits entitlement and support through public health campaigns, working
with third sector organisations and the local community.
See also section on overheating and air quality.
Case Study: Barts Health in Tower Hamlets – Reducing Fuel Poverty
Barts Health has recently established a partnership project with British Gas and Global Action Plan that
aims to reduce fuel poverty in Tower Hamlets. Hospital staff, GPs and community groups refer patients
from vulnerable groups or those people living in hard-to-treat homes to the Energy Companies
Obligation, supporting the installation of energy efficiency measures in low-income households. The
project will train and support 40 health professionals (GPs, outpatient care staff and community
nurses) plus community groups. The partnership initially aims to target 200 homes. The initiative is
not just a referral mechanism but will raise awareness among vulnerable groups, medical practitioners
and the wider community on what steps could be taken to address fuel poverty. Such an initiative
could be linked with other seasonal health initiatives such as winter flu jab promotion.
Contact: Fiona Daly, Barts Health NHS Trust, fiona.daly@bartshealth.nhs.uk
Links to Public Health Suggested further reading
Outcomes Framework
Primary • Marmot Review Team, 2011 – The Health Impacts of Cold Homes
1.17 Fuel poverty and Fuel Poverty
Additional (for example) • Age UK, 2012 - The Cost of Cold
1.1 Children in poverty • Hills, 2012, Getting the measure of fuel poverty
2.23 Self-reported well-being • DECC, 2013, Helping-households-to-cut-their-energy-bills
4.15 Excess winter deaths • DECC, 2013, Fuel Poverty, A Framework for future action.
• London Assembly, 2012, In from the cold? Tackling fuel poverty
in London, GLA
23OVERHEATING
What do we mean by overheating? How do we measure it?
Extreme weather events are more likely to be a factor affecting people’s health in future years52.
Heatwaves, such as the one in the summer of 2003 which caused the death of 2000 people, could
become more frequent (London had an excess mortality of 42%, compared to England of 17%). The
Urban Heat Island (UHI) effect means that urban areas tend to be hotter than rural areas. This is due
to increased absorption of the sun on concrete compared with green or brown spaces, reduced cooling
from breezes due to buildings and increased heat production from houses, industry, businesses and
vehicles. This is especially relevant for London with its densely built-up central boroughs and high
concentration of traffic and people. The UHI effect is not universally experienced across the city as it
relates to availability of green space/water bodies, building density, amount of traffic and energy
consumption. However there are particularly vulnerable spots in each borough, as well as vulnerable
people across areas. (See maps below). When considering London as a whole, the costs associated
with overheating mortality are expected to be around £7-78 million in the 2030s (473-712 heat-
attributable deaths); by the 2050s, this could rise to £13-149 million (1200-1838 heat-attributable
deaths).53
What is the impact on health?
Overheating54 can cause heat strokes, exacerbates existing cardiovascular and respiratory conditions
and affects people with respiratory conditions due to a combination of overheating and poor air
quality. A heatwave can also affect mental health with peak suicide and homicide rates reported
during previous heatwaves in the UK. Research has shown a direct link between a temperature rise to
more than 24˚C and risk of death.55 Additionally, people may suffer from heat-related illnesses, such as
heat cramps, heat rash and heat syncope (fainting as a result of overheating). Overheating may lead
to dehydration, especially in older people, and there is a strong link between high temperatures,
dehydration and blood stream infections, also particularly in older people.56
Who will experience the greatest impact?
Certain housing conditions (older and small top floor, purpose built flats because of the low solar
protection offered by the top floor of poorly insulated flats; and newly constructed houses not suitably
designed for extreme heat events and the quality of the built environment could potentially contribute
to the overheating of an environment. Certain groups such as children have less efficient body cooling
mechanisms and are therefore at greater risk. Similarly, the body’s thermoregulatory mechanisms could
be impaired in older people and those with chronic health conditions. Those considered vulnerable to
overheating may not always perceive themselves to be at risk. Simple measures to reduce the negative
impacts of overheating are not always implemented which could place these groups at even greater
risk.
24The Southwark Picture
The map below shows temperature differences across the borough and also shows the effects of
existing infrastructure and green space on overheating risk. Combined with data on vulnerable
populations, this will provide a more precise picture of the biggest risk areas.
Figure 6: Average temperatures in Southwark
Model simulations of London’s temperatures were provided by Dr. Sylvia I. Bohnenstengel (University of Reading) using
the Met Office Unified Model and MORUSES (MetOffice Reading Urban Surface Exchange Scheme) (Bohnenstengel et al.,
2010).
25Figure 7 Temperature across the capital
London Average Screen Temperatures in degrees Celsius for the period 26 May-19 July 2006
Equal count mapping method: each interval; contains 7% of the total number of grid points
Potential actions:
The NHS Heatwave Plan for England 2013 suggests actions to mitigate and/ or ameliorate some of
the effects of future heatwaves and hot weather.57 Short term actions include:
Modifying surface properties and integrating green infrastructure, for example, ‘cool roofs’, ‘green
roofs’ and ‘cool pavements’ (paving materials that tend to reflect, provide cooler surfaces and
increase water evaporation ratio).
Planting trees and vegetation and creating green spaces to enhance evaporation and shading,
(temperatures in and around green spaces can be several degrees lower than their surroundings).
The development of ‘green spaces’ can not only help to alleviate the impact of the UIH effect but
has been shown to have other positive health benefits such as improving mental health and well-
being. Increasing green infrastructure also improves air quality.
Insulating homes. This protects against hot weather as well as reducing heating needs in the
winter.
Introducing an active transport plan or car-sharing schemes. These will reduce numbers of vehicles
used leading to improvements in air quality, whist promoting healthy living.
Using reflective paint on south-facing walls and roofs.
• Taking fuel poverty into account when implementing any energy efficiency works.
26• Considering using the planning process to influence planning decisions on housing and commercial
properties’ heat thresholds.
• Retrofitting public buildings with energy-saving technology – including low-energy lighting and
high-efficiency boilers. This presents one of a number of opportunities to improve on
infrastructure, growth and support local job creation.
The Plan makes the case for a medium term (10–30 years) and long term approach (30+ years).
See also section on fuel poverty and air quality.
Case Study: London Borough of Islington and the CRISP Project
CRISP is a joint project between Islington Council and North London Cares that took place in the
beginning of 2013. Research among residents aged 65+ concluded that the majority of elderly people
did not take hot weather issues as seriously as cold weather issues. Although levels of information
were generally found to be good, there were some everyday actions being taken that might exacerbate
the risk of overheating. The project identified the need for a widespread information campaign on
proper use of windows, curtains and fans. The research identified challenges of communicating
information about overheating. The findings and recommendations will inform Islington’s Council
Seasonal Resilience Plan and the work of the Seasonal Health Interventions Network (SHINE).
Contact: John Kolm-Murray, Islington Council
john.kolm-murray@islington.gov.uk
Links to Public Health Suggested further reading
Outcomes Framework
Primary: NHS Heatwave Plan for England
3.7 Comprehensive, agreed RE:FIT is the Mayor of London’s innovative scheme to reduce
inter-agency plans for carbon emissions in Greater London, www.refit.org.uk
responding to public health GLA (2011) London Climate Change Adaptation Strategy
incidents and emergencies London Climate Change Partnership (2012) Heat Thresholds
Project: Final Report
Additional (for example)
Built Infrastructure for Older People in Conditions of Climate
3.6 Public sector organisations Change (BIOPICCC)
with a board-approved
Design and Delivery of Robust Hospital Environments in a
sustainable development
Changing Climate (De2RHECC)
management plan
27REFERENCES
1
Centre for Disease Control and Prevention (CDC), 2013,from CDC (USA);
www.cdc.gov/about/history/tengpha.htm
2
Evidence demonstrating links between access to green spaces and health:
Coombes, E., Jones, A P, & Hillsdon, M. (2010). The relationship of physical activity and overweight to
objectively measured green space accessibility and use. Social science & medicine, 70(6), 816-822;
Maas, J., Verheij, R. A.,et al (2006). Green space, urbanity, and health: how strong is the relation? Journal of
epidemiology and community health, 60(7), 587-592;
Nielsen, T. S., & Hansen, K. B. (2007). Do green areas affect health? Results from a Danish survey on the
use of green areas and health indicators. Health & place, 13(4), 839-850;
Schipperijn, J., Bentsen, P et al (2013). Associations between physical activity and characteristics of urban
green space. Urban Forestry & Urban Greening, 12(1), 109-116.
Mitchell, R., & Popham, F. (2008). Effect of exposure to natural environment on health inequalities: an
observational population study. The Lancet, 372(9650), 1655-1660.
3
MENE Survey evidencing frequency, mode and motivation in access to Green Space, (2012-2013), from
Natural England www.naturalengland.org.uk/ourwork/research/mene.aspx
4
Local access to public open spaces, taken from Access to Public Open Space, (2012), London Data Store
http://data.london.gov.uk/datastore/package/access-public-open-space-and-nature-ward ;
5
Survey showing number of people participating in sport in local communities, taken from Active People
Survey (2013), Sport England www.sportengland.org/research/active_people_survey.aspx
6
Use of small public urban green spaces and health benefits, Peschardt, K. K., Schipperijn, J., & Stigsdotter,
U. K. (2012) Use of small public urban green spaces (SPUGS). Urban Forestry & Urban Greening, 11 (3),
235-244
7
Physical Activity and the Environment, taken from “Marmot Review (2010) Fair Society, Healthy Lives”;
NICE (2008). Physical activity and the environment., PH Guidance 8
8
Toolkit showing levels of adult obesity, taken from Adult Obesity (2005) National Obesity Observatory , NHS UK, Public Health
England; http://www.sepho.nhs.uk/NOO/e-Atlas/adult/atlas.html
9
Access to Public Open Space, (2012), taken from London Data Store, http://data.london.gov.uk/datastore/package/access-public-
open-space-and-nature-ward
10
Toolkit showing levels of adult obesity , taken from Adult Obesity (2011-2012) National Obesity Observatory , NHS UK, Public Health
England; http://www.sepho.nhs.uk/NOO/e-Atlas/adult/atlas.html
11
Toolkit showing levels of adult obesity , taken from Health Need Assessment Toolkit, Data Period, 2006-2008)
http://hna.londonhp.nhs.uk/JSNA.aspx
12
GLA All London Green Grid Supplementary Planning Guidance ,(2012) taken from,
www.london.gov.uk/priorities/planning/publications/all-london-green-grid-spg; Datasets to support this
guidance, taken fromwww.gigl.org.uk/Ourdatasets/Openspace/tabid/117/Default.aspx;
13
Green flag award system for green spaces, taken from Keep Britain Tidy,
http://greenflag.keepbritaintidy.org/
14
Southwark Council outdoor gym, taken from
www.southwark.gov.uk/info/200435/free_outdoor_activities/2611/outdoor_gyms/1
15
Burgess Park regeneration project July 2012, taken from
www.southwark.gov.uk/news/article/792/burgess_park_to_reopen_after_8_million_transformation)
16
London Travel Demand Survey (LTDS),2011,taken from Transport for London, Travel in London,
Supplementary Report: ,www.tfl.gov.uk
17
Evidence demonstrating link between transport and health, March 2013, Keeping well in hard times:
Protecting and improving health & well-being in an income shortfall: taken from, London Health Inequalities
Network.
18
Link between heavily trafficked streets and health impacts, 2005, taken from Health Development Agency
Making the case: Improving health through transport.
19
Data showing physical activity rates in London, 2010, taken from Public Health England: Physical Activity
in London: Key Facts.
www.lho.org.uk/LHO_Topics/Health_Topics/Lifestyle_and_Behaviour/PhysicalActivity.aspx
20
Link between active travel and health, 2012, taken from British Medical Association, Healthy Transport=
Healthy Lives, BMA,www.bma.org.uk
2821
Analysis of cycling potential, 2010, taken from Transport for London, December Analysis of Cycling
Potential, Travel in London, www.tfl.org.uk
22
Report showing negative impacts of transport in London, 2011, taken from Mackett, R.L. & Brown, R. ;
Transport, Physical Activity and Health. Present knowledge and the way around. Centre for Transport
Studies, University College London, www.cege.ucl.ac.uk
23
Number of travel trip by each modal share, 2011, taken from London Travel Demand Survey. Transport for London, www.tfl.org.uk
24
Reported road casualties in Great Britain, annual report 2011, taken from www.gov.uk
25
Most heavily vehicular used roads, 2000-2012, taken from Traffic Statistics, Department of Transport http://www.dft.gov.uk/traffic-
counts/area.php?region=London
26
The Mayor’s proposed cycle superhighways for London, 2013, taken from Mayor’s Vision for Cycling, GLA, www.tfl.gov.uk
27
Hackney’s case study showing cycling promoting measures, 2013, taken from London Borough of
Hackney Sample of Schemes for cycling & public realm. www.hackney.gov.uk (
28
Surface Water Management Plan (SWMP), 2010, taken from, Technical Guidance. DEFRA
www.defra.gov.uk
29
London Regional Flood Risk Appraisal, October 2009, taken from GLA, ; , www.london.gov.uk
30
Overall strategic plan for London, the London Plan, 2011, taken from GLA, www.london.gov.uk
31
Secondary impact of floods on health, 2013, World Health Organisation ; Floods in the WHO European
Union, Health effects and their prevention. Edited by Bettina Menne and Virginia Murray, taken from Public
Health England’s website, www.gov.uk/government/organisations/public-health-england
32
Effects of floods on mental health, 2011, taken from Murray, V, Caldin et al (2011); The Effects of Floods
on Mental Health, Health Protection Agency,www.hpa.org.uk
33
www.phoutcomes.info
34
https://www.gov.uk/green-deal-energy-saving-measures/how-the-green-deal-works
35
Access to healthy food, taken from, White (2007), Food Access and Obesity, Obesity reviews, 8 (s1), 99-
107. ; Chartered Institute for Environment and Health, 2013, taken from Chartered Institute for Environment
and Health Food Policy: http://cieh.org/.
36
Takeaways Toolkit, 2012, taken from, London Food Board and Chartered Institute of Environmental Health
http://www.london.gov.uk/priorities/environment/promoting-healthy-sustainable-food/london-
boroughs/takeaways-toolkit;
37
Effect of fast food restaurants on obesity and weight gain, taken from, Currie, J., Vigna, SD et al (2010),
The effect of fast food restaurants on obesity and weight gain. American Economic Journal: Economic
Policy, 32-63.
38
Health Needs Assessment Toolkit, (2006-2008), NHS UK, Public Health England, http://hna.londonhp.nhs.uk/JSNA.aspx
39
Health Needs Assessment Toolkit, (2011-2012), NHS UK, Public Health England, http://hna.londonhp.nhs.uk/JSNA.aspx
40
Health Needs Assessment Toolkit, (2006-2008), NHS UK, Public Health England, http://hna.londonhp.nhs.uk/JSNA.aspx
41
Adult Obesity (2011-2012) National Obesity Observatory , NHS UK, Public Health England; http://www.sepho.nhs.uk/NOO/e-
Atlas/adult/atlas.html
42
New Fuel Poverty Definition 2013, taken from Department of Energy and Climate Change (DECC), taken
from Fuel Poverty, A Framework for future action. www.decc.gov.uk
43
Tackling fuel poverty in London 2012, taken from GLA - London Assembly In from the cold?
www.london.gov.uk
44
Fuel poverty impact on wellbeing, 2011, taken from, Marmot Review Team, The Health Impacts of Cold
Homes and Fuel Poverty, www.gov.uk/government/organisations/public-health-england
45
Cost of fuel poverty to the NHS, 2012, taken from AgeUK, The Cost of Cold www.ageuk.org.uk/latest-
news/archive/cold-homes-cost-nhs-1-point-36-billion
46
Monetising health impacts of fuel poverty, 2013, taken from Department of Energy and Climate Change,
Fuel Poverty, a Framework for Future Action- Analytical Annex
https://www.gov.uk/government/uploads/system/uploads/attachment_data/file/211137/fuel_poverty_strategic
_framework_analytical_annex.pdf
47
Custom Age Range Creator Tool for GLA Population Projections 2013, taken from GLA London Datastore
wwww.data.london.gov.uk/datastore/applications/custom-age-range-creator-tool-gla-population-projections-borough
48
Fuel Poverty Risk Indicators Toolkit, 2013, taken from GLA London Datastore www.data.london.gov.uk/datastore/package/london-
fuel-poverty-risk-indicators-wards
49
Green Deal and Energy Company Obligation information, 2012, taken from Department of Energy and
Climate Change, www.decc.gov.uk
50
The Mayor’s RE:NEW Programme, 2013, taken from GLA, www.london.gov.uk
51
UK Energy Act 2011, taken from Department of Energy and Climate Change
www.legislation.gov.uk/ukpga/2011/16/contents/enacted
29You can also read