HEALTH CARE REFORM: The Impact on Minority Populations in Tennessee - by Steven L. Coulter, Tionna L. Jenkins, Stephen G. Jones, and J. Payne Carden
←
→
Page content transcription
If your browser does not render page correctly, please read the page content below
HEALTH CARE
REFORM:
The Impact
on Minority
Populations in
Tennessee
by Steven L. Coulter, Tionna L. Jenkins,
Stephen G. Jones, and J. Payne Carden
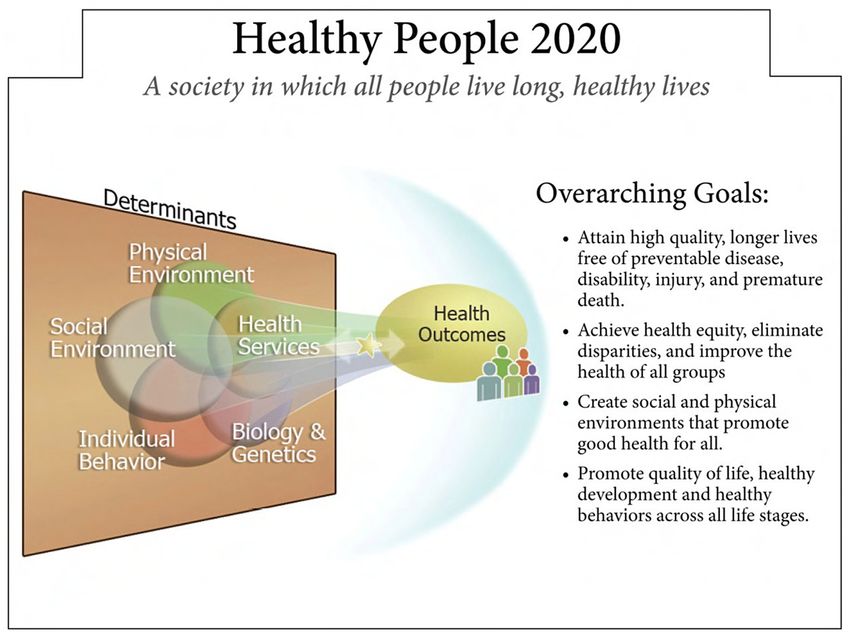

TABLE OF CONTENTS

I.    Introduction................................................................................................................................ 2

II. The Problem of Minority Access to Health Care - What is Known in Tennessee.................................3
		           Racial breakdown of the uninsured....................................................................................... 3
		           Coverage vs. access................................................................................................................ 5

III. Diversity Among Medical Professionals and Institutions that Serve Minorities............................. 6
		           Current state efforts to address diversity in the physician workforce...................................... 9
		           AAMC Recommendations on integrating measures to imporve the quality of care............. 11
		           What effect will PPACA have on the institutions that have traditionally cared
		            for the uninsured?........................................................................................................... 12

IV. Health Care Access Index........................................................................................................... 13

V. An Invitation to Dialogue.......................................................................................................... 14

VI. Conclusions............................................................................................................................... 15

Recommendations............................................................................................................................. 16

Appendices..........................................................................................................................17

ABOUT THE BLUECROSS BLUESHIELD OF TENNESSEE HEALTH INSTITUTE
The BlueCross BlueShield of Tennessee Health Institute was established with the goal of becoming the premier source of
information about health care for Tennessee decision makers.

It is committed to providing a fact-based intellectual framework that will contribute to the public discussion on health care and
policy development. When possible, the Health Institute will articulate with data the likely implications of health care policy
changes on the local market in Tennessee. The mission is to inform interested parties about emerging trends through extensive
research and analysis and to become a trusted source for reliable insights.

BlueCross BlueShield of Tennessee Health Institute is a division of BlueCross BlueShield of Tennessee, an Independent Licensee
of the BlueCross BlueShield Association.

                                                                                                                                                       1
I.   INTRODUCTION

         Minority individuals in the United States have less access to health care and generally poorer health
         outcomes than do whites. This relationship has been extensively studied, and some of the reasons have
         been demonstrated. One of those barriers to access for minorities nationally (which for the purposes
         of this paper will include blacks and Hispanics as defined by the 2009 American Community Survey
         conducted by the US Census Bureau) has historically been a lower rate of insurance coverage. Blacks
         and Hispanics in Tennessee share these circumstances.

         The Patient Protection and Affordable Care Act (PPACA), the formal name for the health care reform
         law, has as one of its stated purposes reducing or eliminating the disparity in insurance coverage by
         race. The review of quantitative data, other research and interviews with experts demonstrate that the
         causes of the problem go far beyond insurance coverage.

         Other barriers include such things as lack of transportation and lack of service capacity (it really doesn’t
         matter if you live next door to a doctor and have good insurance; if her schedule is full, she can’t see
         you). In Tennessee, for example, minorities are highly concentrated in areas of the state where doctors’
         practices are full, and there is simply no excess capacity to absorb newly covered individuals. What’s
         more, it has been shown that many minority patients prefer to see a medical provider of their own race.
         A relative shortage of minority providers – as appears to exist around the nation and in Tennessee – can
         act as another type of barrier to access.

         This paper suggests that although PPACA will most decidedly have a favorable impact on access to
         insurance coverage, it is unlikely to fully address racial disparities in care. As it would be stated in a
         freshman logic class, “coverage is necessary, but not sufficient” to effect change.

         Some solutions have been put forth to address the various causes involved. But the multi-faceted nature
         of the issue has created another difficulty – the problem is difficult to measure. And without a yardstick
         it is difficult to know how much progress, if any, is being made in addressing the various causes.

         To facilitate progress, the authors have developed a draft of a Health Care Access Index which helps
         factor in a variety of causes for lack of access. This is a new concept, and we advance the notion
         primarily to generate discussion, not to “prove” that it is accurate. The Health Care Access does not,
         for example, weight the various factors that the formula considers. Surely some are more important
         than others, but lacking any real basis for weighting, the authors chose to advance the concept rather
         than introduce more potential sources of error into the equations.

         The BlueCross BlueShield of Tennessee Health Institute invites your feedback on both the subject of
         disparities and upon our first attempt at the Health Care Access Index. In the conclusion of this paper,
         we will advise how to contribute to the discussion. For now, the Health Institute’s goal is to provoke
         thought and discussion of this important subject, and we hope you find the following stimulating in
         that regard.

         The authors gratefully acknowledge TennCare Director Darin Gordon for reviewing and commenting on this
         manuscript. Any errors and all opinions are, of course, the responsibility of the authors.

2   HEALTH CARE REFORM: The Impact on Minority Populations in Tennessee
II. THE PROBLEM OF MINORITY ACCESS TO HEALTH CARE – WHAT IS
    KNOWN IN TENNESSEE
      The current state of the uninsured in Tennessee
      In a previous study conducted by the BlueCross BlueShield of Tennessee Health Institute, it was
      estimated there were 963,000 currently uninsured Tennesseans.1 Other studies have arrived at
      somewhat different estimates. One conducted by the University of Memphis estimated 910,0002, the
      2009 American Community Survey estimated 883,0003, and the University of Wisconsin Population
      Health Institute estimated that about 1.1 million4 uninsured people live in Tennessee. Obviously,
      calculating the number of current uninsured residents is not an exact science as evidenced by the range
      of about 200,000 people in the four estimates. It is further complicated by the fact that this population
      demographic is not stable; there are people constantly dropping in and out of periods of being insured.

      The passage of PPACA has given most of the uninsured population a chance to gain government
      health insurance or receive subsidies to pay for individual policies. It also mandates employers to offer
      health insurance. However, there are many issues which PPACA does not address. The Health Institute
      estimates there will still be between 200,000 and 300,000 uninsured people in Tennessee after the
      Act is implemented.5 Additionally, if newly insured patients have poor or no access to primary care
      physicians, what does their newly acquired insurance actually do for them?

      Racial breakdown of the uninsured
      As seen in Figure 1 below, African-Americans and Hispanics make up a disproportionate share of the
      state’s uninsured population. According to the 2010 Census, the population of Tennessee is about 16%
      African-American and 4% Hispanic, however they account for almost 20% and 12% of Tennessee’s
      uninsured population respectively.

      These figures mean that about 22% of African-Americans and 54% of Hispanics in the state are
      uninsured compared to 18% of non-Hispanic whites.

      The authors would like to note that these disproportionate levels of coverage are just one part of a
      larger problem. Nationally, there continues to be an increase in chronic disease, health disparities and
      inequity among minority populations in comparison to non-Hispanic whites. Authoritative sources
      have documented large and widespread socioeconomic and racial or ethnic disparities in access to care
      and in the quality of medical care for many serious health conditions such as heart disease and cancer.6

1    Coulter, S. L. & Cecil, W. T. (2011). National Health Care Reform: The Impact on Tennessee. Available at http://www.bcbst.com/health-
    institute/research/ReformImpact.pdf
2    Chang, C., Mirvis, D., Gnuschke, J., Wallace, J., Walker, J., Smith, S., Stanpill, S. (2012). Impacts of Health Reform in Tennessee.
3    2009 American Community Survey. Selected Characteristics of The Uninsured in Tennessee” American FactFinder. U.S. Census Bureau.
    Available at http://factfinder2.census.gov/faces/tableservices/jsf/pages/productview.xhtml?pid=ACS_10_1YR_S2702&prodType=table
4    Booske, B., Athens, J., and Remington, P. (2011). County Health Rankings: Mobilizing Action Toward Community Health – Tennessee.
    Robert Wood Johnson Foundation and University of Wisconsin Population Health Institute. Available at http://www.countyhealthrankings.
    org/sites/default/files/states/CHR2011_TN.pdf
5    Coulter, S. L. & Cecil, W. T. (2011). National Health Care Reform: The Impact on Tennessee. Available at http://www.bcbst.com/health-
    institute/research/ReformImpact.pdf
6    Robert Wood Johnson Foundation to the Commission to Build a Healthier America (2008). Overcoming Obstacles to Health. Available at
    http://www.rwjf.org/files/research/obstaclestohealth.pdf

                                                                                                                                             3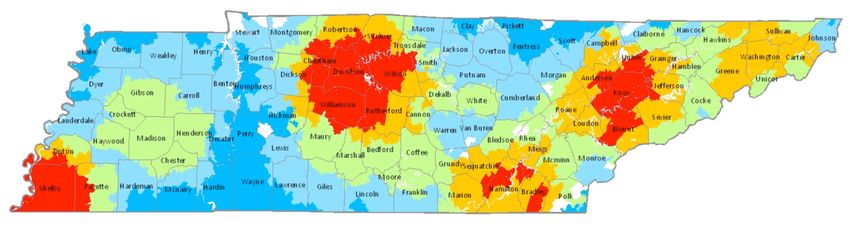
Figure 1 – Tennessee’s Uninsured Population by Race

        This research provided an interesting view of how the coverage issue plays out in Tennessee. To focus
        the study, it was determines that using the state’s six Metropolitan Statistical Areas (MSAs) would
        be the best approach. Each MSA represents one of the six major population centers in Tennessee:
        Chattanooga (Hamilton and Marion counties); Jackson (Madison and Chester Counties); Knoxville
        (Anderson, Blount, Knox, Loudon, Sevier, and Union counties); Memphis (Fayette, Shelby, and
        Tipton counties) Nashville (Cheatham, Davidson, Dickson, Montgomery, Robertson, Rutherford,
        Sumner, Williamson, and Wilson counties); and the Tri-Cities (Carter, Hawkins, Sullivan, Unicoi, and
        Washington counties). The 27 MSA counties account for a little more than 70% of the state’s total
        population. To see a map of the MSAs, please look at Figure 2.

        An overwhelming majority of the state’s minority population also calls these 27 counties home; almost
        90% of the total African-American population and a little more than 75% of the state’s Hispanics live
        in the MSAs (Please see Appendix 5 for further discussion and tabulations by county).

        Figure 2 – Metropolitan Statistical Areas of Tennessee

        By combining the multiple data sources about the uninsured population it was determined that
        Tennessee has about 307,000 uninsured African-Americans and Hispanics. In Table 1, the numbers
        are broken down by race and by MSA.

4   HEALTH CARE REFORM: The Impact on Minority Populations in Tennessee
Table 1 – Minority Population and insurance coverage in Tennessee
     Metropolitan Statistical Areas
                                                             African-            Uninsured
                                         Total              American              African-              Hispanic            Uninsured
                                       Population           Population           Americans1*           Population           Hispanics*
       Chattanooga MSA                  362,000                68,000                14,000               12,000                 6,000
       Jackson MSA                       113,000               35,000                 8,000                 3,000                2,000
       Knoxville MSA                    778,000                48,000                10,000               20,000                12,000
       Memphis MSA                    1,016,000              499,000                112,000               49,000                27,000
       Nashville MSA                  1,625,000              270,000                 67,000             102,000                63,000
       Tri Cities MSA                   407,000                 11,000                2,000                 7,000                3,000
       TOTAL MSA                     4,301,000                931,000              213,000               193,000               113,000
       Non-MSA                       2,095,000                131,000               28,000                62,000                37,000
     *To determine the number of uninsured African-Americans and Hispanics, the number of total uninsured in the county from the 2007
     Small Area Health Insurance Estimates, US Census, was cross referenced with the propensity for one of those individuals to be uninsured,
     as derived from the 2009 American Community Survey. Please see Appendix 5 for the full calculations.

     The Health Institute estimates that about two thirds of the uninsured population will receive coverage
     (This is the same as the overall estimate as to how many of the uninsured will become insured that was
     made in National Health Care Reform: The Impact on Tennessee, because there was no obvious reason
     to suspect that minority populations will gain insurance at a lower rate). This means that research
     estimates about 142,000 African-Americans and 75,000 Hispanics residing in MSAs will be newly
     covered, compared to 19,000 African-Americans and 25,000 Hispanics living outside of the MSAs
     who will be newly covered. However these calculations did not control for the possibility that (a)
     such individuals may have lower incomes and, thus, be relatively more likely to qualify for Medicaid;
     and (b) those African-Americans or Hispanics that are likely to qualify for tax credits may actually be
     disproportionately located outside of the MSAs.

     Coverage vs. access
     The increase in coverage will undoubtedly improve the health status of minorities.

     In the Institute of Medicine’s Coverage Matters Report, a seminal study on the effects of being
     uninsured, researchers looked at the impact insurance has on the health status of individuals. The
     major findings from this report were that uninsured people receive less medical care and less timely
     care if they receive it than insured people. The uninsured also have worse health outcomes and are most
     often already fiscally disadvantaged. Lastly, while safety-net care from hospitals and clinics improves
     access to care, it does not substitute for being insured.7

     Nonetheless, it is critical to realize that extending coverage is just one component in eliminating
     disparities in access to health care for minorities.

     Health care is a finite resource, and while coverage is a necessary prerequisite, it is not sufficient
     unless there is corresponding capacity within the system. PPACA gets us halfway there for minority
     populations – it greatly reduces the number of minority uninsured. In actuality these people may
     gain insurance, but not gain access to care because many of Tennessee’s primary care providers may be
     already operating beyond capacity.

7   Institute of Medicine. (2001) Coverage Matters: Insurance and Health Care. Washington: National Academies

                                                                                                                                                5
Another challenge, according to Dr. Cyril Chang, a health economist and Professor of Economics at
           the University of Memphis, may include decisions by physicians to limit their acceptance of Medicaid.
           Because of the issues of capacity as well as Medicaid reimbursement rates, there may not be the
           incentives in place for primary care physicians to take on new Medicaid patients, states Dr. David
           Mirvis, Senior Research Fellow, Methodist LeBonheur Center for Health Economics and Adjunct
           Professor, Department of Public Health, University of Tennessee, Knoxville.

            “The proposed higher reimbursement rates for primary care under the reform will help,” Mirvis
           said. “But it remains to be seen whether the increased rates will be sufficient to overcome the
           access issue.”

    III. DIVERSITY AMOUNG MEDICAL PROFESSIONALS AND INSTITUTIONS
         THAT SERVE MINORITIES

           Diversity among medical professionals
           Another factor influencing disparity in health care for minorities is insufficient racial diversity among
           medical providers. This paper will take an in-depth look at this issue.

           Solutions targeting diversity have been offered since the early 1970s. Through the use of existing health
           professions education and training programs authorized under the Public Health Service Act Title VII
           and VIII8, funding is available for medical schools and other facilities to promote community-based
           and rural practice, primary care, and opportunities for minorities and disadvantaged students.9

           Additionally, PPACA further highlights the importance of providing solutions around cultural
           competency10 challenges within the health care workforce.11 A number of studies have shown
           the navigational burdens and cultural barriers experienced by minority patients as they try to
           maneuver through the health care system, especially for patients with chronic diseases.12,13,14 This is a
           major concern because minority health care professionals may be more likely to take into account
           sociocultural factors when organizing health care delivery systems to meet the needs of minority
           populations.15 Therefore, PPACA has allocated funds to ensure the integration of cultural competency
           and linguistics training for the health care workforce.

    8    Definition- Public Health Services Title VII and VIII (PHSA, Title VII and VIII)- The purpose of programs funded and administered under
         Titles VII and VIII of the Public Health Services Act is to expand the geographic, racial and ethnic distribution of the health care workforce.
         Available at http://www.apha.org/NR/rdonlyres/13E647B5-E51B-4A47-91A8-652EE973A2DB/0/TitleVIIandTitleVIII.pdf
    9    Redhead, C.S., Williams, E.D (2010). Public Health, Workforce, Quality and Related Provisions in the Patient Protection and Affordable
         Care Act (P.L. 111-148), Congressional Research Service. Washington, D.C.: Penny Hill Press. Available at https://www.aamc.org/
         download/130996/data/ph.pdf.pdf
    10   Definition: Cultural competence has emerged in part to address the factors that may contribute to racial/ethnic disparities in health care.
         Cultural competence in health care describes the ability of systems to provide care to patients with diverse values, beliefs, and behaviors,
         including tailoring delivery to meet patients’ social, cultural, and linguistic needs. The ultimate goal is a health care system and workforce that
         can deliver the highest quality of care to every patient, regardless of race, ethnicity, cultural background, or English proficiency. Available at
         http://www.commonwealthfund.org/usr_doc/betancourt_culturalcompetence_576.pdf
    11   Redhead, S.C., Williams, D.C., (2010). Public Health, Workforce, Quality, and Related Provisions in the Patient Protection and Affordable Care
         Act http://www.idsociety.org/uploadedFiles/IDSA/Policy_and_Advocacy/Current_Topics_and_Issues/Workforce_and_Training/Related_Links/
         Public%20Health%20Workforce%20Quality%20and%20Related%20Provisions%20in%20PPACA%20P.L.%20111-148%20032510.pdf
    12   Center on Aging Society, Georgetown University (2004). Cultural Competence in Healthcare: It is Important for People with Chronic
         Conditions http://ihcrp.georgetown.edu/agingsociety/pdfs/cultural.pdf
    13   The Common Wealth Fund Cultural Competence in Healthcare (2002). http://www.commonwealthfund.org/usr_doc/betancourt_
         culturalcompetence_576.pdf
    14   U.S. Department of Health and Human Services (2004). Setting the Agenda on Research in Cultural Competency in Health Care http://
         www.ahrq.gov/research/cultural.pdf
    15   The Common Wealth Fund, Cultural Competence in Healthcare (2002). http://www.commonwealthfund.org/usr_doc/betancourt_
         culturalcompetence_576.pdf

6   HEALTH CARE REFORM: The Impact on Minority Populations in Tennessee
PPACA was signed into law on March 23, 2010, and includes increased funding, specific provisions
      and initiatives focused on the expansion of workforce diversity, which could have an even greater
      impact on closing the gap as it relates to health disparities and inequity in the United States.

      According to the Joint Center for Political and Economic Studies (2010)16, through reauthorization
      and expansion of the Title VIII programs, PPACA has the potential to improve diversity in such fields
      such as primary care, long-term care, dentistry, mental health, and nursing.

      So why has the federal government through PPACA placed such a strong emphasis on ensuring
      workforce diversity in health care? And is there evidence demonstrating a causal relationship between
      lack of diversity and disparities in access?

      A 2004 report by the Institute of Medicine titled In the Nation’s Compelling Interest: Ensuring Diversity
      in the Health Care Workforce underscored the importance of increasing racial/ethnic diversity in
      health professions to reduce health disparities.17 Racially and ethnically diverse practitioners are more
      likely to practice in medically underserved areas and treat patients of color who are uninsured and
      underinsured, the report said.18 Among 1975 graduates of U.S. medical schools, black and Hispanic
      physicians were more likely than non-Hispanic whites to practice in areas with a shortage of physicians
      and to care for black and Hispanic patients.19

      In fact, minorities often choose to serve vulnerable communities.20 In turn, due to negative experiences
      felt within the health care system minority patients establish better trust with and, indeed, seek out
      physicians from their own racial or ethnic group.21

      A study published in 2000 in Health Affairs showed that minority patients tend to seek care from
      minority physicians for a range of reasons including cultural sensitivity, the patient-physician
      relationship and the ability to communicate effectively.22 However, to further understand the
      correlation between patient patterns of choosing a physician solely based on factors such as ethnicity
      and race would require a more in-depth exploration and research analysis of the doctor-patient race
      concordance hypothesis23 which is beyond the scope and intent of this paper.

      It is also evident that minority physicians are more likely to become primary care professionals, but this
      should not be the major rationale for diversifying the health professions.24 Doing so could potentially

16 Andrulis, D.P., Siddiqui, N.J., Purtle, J.P., Duchon, L. (2010). Joint Center for Political and Economic Studies. Patient Protection and
   Affordable Care act of 2010: Advancing Health Equity for Racially and Ethnically Diverse Populations. Washington, D.C. Available at http://
   www.jointcenter.org/hpi/sites/all/files/PatientProtection_PREP_0.pdf
17 ibid
18 Kington, R., Tisnado, D., Carlisle, D.M. (2001). Increasing racial and ethnic diversity among physicians: An intervention to address health
   disparities. The Right Thing to Do, The Smart Thing to Do: Enhancing Diversity in the Health Profession. Washington, D.C.: The Academy
   Press. Available at http://www.ethnicphysicians.org/publications/NAP%20Article.pdf
19 Kormaromy, M., Grumbach, K., Drake, M., Vranizan, K., Lurie, N., Keene, D., Bindman, A. (1996). The Role of Black and Hispanic
   Physicians in Providing Health Care for Underserved Populations. The New England Journal of Medicine, 334, (20), 1305-1310. Available at
   http://www.nejm.org/doi/pdf/10.1056/NEJM199605163342006
20 Sullivan, L.W., Mittman, I.S. (2010). A State of Diversity in Health Professions A Century After the Flexner Report. The New England
   Journal of Medicine, 85 (2), 246-253. Available at http://journals.lww.com/academicmedicine/Fulltext/2010/02000/The_State_of_Diversity_
   in_the_Health_Professions_a.21.aspx
21 DeVille KA (1999). Trust, Patient Well-Being and Affirmative Action in Medical School Admissions. The Mount Sinai Journal of Medicine,
   66, (4):246-256. Available at http://www.ncbi.nlm.nih.gov/pubmed/10477477
22 Saha, S., Taggart, S.H., Komaromy M., Bindman, A.A. (2000). Do Patients Choose Physicians of Their Own Race? Health Affairs, 19 (4),
   76-83. http://content.healthaffairs.org/content/19/4/76.full.pdf+html
23 LaViest, T.A., Carroll, C. (2002). Race of Physicians and Satisfaction of Care Among African-American Patients. Journal of National Medical
   Association, 94 (11), 937-943. http://www.ncbi.nlm.nih.gov/pmc/articles/PMC2594189/pdf/jnma00328-0017.pdf
24 ibid

                                                                                                                                                 7
marginalize minority health care practitioners to only see specific populations while at the same time
          desensitizing non-Hispanic white clinicians to an obligation to provide care for communities of color.

          Recruitment and placement may be a priority; however, major findings suggest that African-Americans,
          Hispanics, American Indians and Alaska Natives, and Native Hawaiians and Other Pacific Islanders
          remain underrepresented in medicine relative to their numbers in the U.S. population and populations
          in specific states, regions and localities.25

          For example, while Hispanics comprise approximately 16.3 percent of the U.S population, they
          account for less than 4 percent of all physicians. And African-Americans comprise 12.6 percent of the
          nation’s population, but only five percent of physicians.26

          In Tennessee, out of a total of 411 graduates from medical school in 2010, 254 were white (62%), 97
          were Black (24%), 6 were Hispanic (1.4%), 2 were American Indian or Alaska Native (0.4 %), 42 were
          Asian (10%), 1 was other non-Hispanic or Latino race (0. 2%) and 9 were self-identified as foreign
          (2%), according to the Association of American Medical Colleges.27 It should be noted that Meharry
          Medical College in Nashville is a traditionally African-American organization and draws on African-
          American applicants from across the country, which helps explain the number of African-American
          graduates in the statistics above.

          Table 3 –Medical School Graduates in Tennessee (2011)

                                                                          Black or
                                Medical School*                      African- American                  White or Caucasian
                          East Tennessee-Quillen                                 4                                  53
                          Meharry                                               69                                   7
                          Vanderbilt                                             9                                  83
                          Tennessee                                             15                                  111
                          Total                                                 97                                 254
                         *These statistics were taken before data was available from Lincoln Memorial University’s DeBusk College of
                         Osteopathic Medicine’s first graduating class.

          Ensuring diversity within the health care workforce could have a positive impact for patients as it
          pertains to access, quality of care, and chronic disease management, as well as help to empower patients
          to engage in managing their health. And as PPACA is fully implemented, the need to have a more
          global perspective, and recognize and commit to ensuring diversity in the health care workforce will
          become even more important.

          In light of the findings regarding underrepresentation of minorities in medicine in the United States,
          more attention should be focused on recruitment as a specific strategy of implementation within the
          health care workforce at the state and local level while simultaneously addressing workforce diversity

    25 Lee PR, Franks PE. (2010). Executive Summary: Diversity in U.S Medical Schools: Revitalizing Efforts to Increase Diversity in a Changing
       Context, 1960s-2000s. Philip R. Lee Institute for Health Policy Studies, School of Medicine, University of California, San Francisco. Available
       at http://escholarship.org/uc/item/0qt8d0j8#page-2
    26 Smedley, B.D., Stith-Butler, A.Y., & Bristow, L.R. (Eds.). (2004). In the Nations Compelling Interest: Ensuring Diversity in the Health Care
       Workforce. Washington, DC: National Academy Press.
    27 Association of American Medical Colleges. (2010). Total Graduates by U.S. Medical Schools and Race and Ethnicity. Available at https://www.
       aamc.org/download/145668/data/table30-gradsschlraceeth2010-web.pdf.pdf

8   HEALTH CARE REFORM: The Impact on Minority Populations in Tennessee
and equity in PPACA. PPACA calls for monitoring diversity in the health care workforce, but does not
specify a strategy for doing so. Other challenges that exist around implementation of increasing racial/
ethnic diversity in the health care workforce in PPACA include:
• Recruitment strategies and addressing the institutional climate of colleges and universities that
have a legacy of being historically white
• Inequities associated with the quality of K-12 education, which would address the “pipeline”
of qualified applicants in the health care workforce. To adequately prepare culturally diverse
individuals for success in higher education health professions programs, disparities in learning
opportunities, particularly in the sciences, need to be addressed at the pre-college level.28
• College academic preparation and creating an outcome-driven sustainable partnership between
colleges and medical schools
• Medical school application process, associated cost and admissions standards and criteria
• Medical student support and retention. A consistent theme among minority students was that
medical schools should have a formal minority affairs function; it was also stressed that the
program should be adequately funded and staffed, and that it should have some real power within
the school 29
• Minority faculty recruitment and retention as well as development and fully engaged institutional
leadership
The American Medical Association (AMA) also acknowledges that diversity in the health care
workforce among physicians (i.e. African-American, Hispanics) is disproportionate to the U.S.
population. In general, minority representation in medical schools and residency training has not
changed significantly over the past several years.
For example, the percent of entering medical students who self-classify as African- American has been
7.1-7.3%; the percent of Hispanic students has been 7.4-7.5%; the percent of Asian students has been
20-21%; and the percent of white, non-Hispanic students has been 62-63%.30 And according to the
same AMA Masterfile, race and ethnicity is known for about 78% of the total physicians. In 2006,
71.4% of these physicians were white, 15.8% were Asian, 6.4% were Hispanic, and 4.5% were Black.31
In light of these statistics, the AMA has put incentives in place to increase and retain a diverse health
care workforce among physicians by funding programs that provide access to education for diverse
populations, as well as pipeline and retention programs.
Current state efforts to address diversity in the physician workforce
So what are the current institutional practices and policies at the state and local level to address the
disproportionate number of minority physicians as it pertains to recruitment and retention? In 2002,
Vanderbilt University began establishing the Office of Diversity in Medical Education32 to increase
diversity and attract more medical school applications from a broad range of people, including
minority students.
28 ibid
29 Gonzalez P., Stoll, B., (2002). The Color of Medicine: Strategies for Increasing Diversity in the U.S. Physician Workforce (Community
Catalyst). Available at http://www.communitycatalyst.org/doc_store/publications/the_color_of_medicine_apr02.pdf
30 American Medical Association. Report of the Council on Medical Education. Available at http://www.ama-assn.org/resources/doc/council-on-
med-ed/a-08cmerpt7.pdf
31 ibid
32 Available at http://www.mc.vanderbilt.edu/reporter/index.html?ID=11229
9In addition, Vanderbilt takes a broader definition of diversity which includes representation from
different races/ethnicities, sexual orientation, economic backgrounds, rural versus urban upbringing,
and varying religious backgrounds.33
In a Vanderbilt report, “The Changing Face of Medicine,” George C. Hill, PhD, Levi Watkins Jr.
Professor and Associate Dean for Diversity in Medical Education states that “If we want to provide an
excellent medical education for all students, then the students have to learn in a diverse environment
from people who have different points of view.”34 Further, Dr. Hill shares the view of the American
Medical Colleges, that the need for a more diverse physician workforce is imperative, along with
reducing racial disparities in health care.
Demographic studies show that the United States will face a shortage of physicians in the next 20 years
as the population ages. More physicians from all backgrounds will be needed to meet the growing
demand. In June 2006, the AMA recommended a 30% increase in U.S. medical school enrollment
and an expansion of Graduate Medical Education (GME) positions to accommodate this growth.35
A review of the literature shows that solutions to the problems of recruiting and retaining minority
physicians have been limited. In addition those strategies have not been rigorously tested, nor has
sufficient funding been provided for full implementation. Anecdotally, outreach, programs and
partnerships have shown some progress, but minimal success has been shown in changing policy to
address inequity in the medical workforce and in health care delivery.36 37
With regard to the actual number and/or percentage of minority physicians practicing in Tennessee,
the data is limited because it traditionally has not been kept by the sources that keep other data
about physicians. In addition, currently available data make it difficult to break down the racial and
ethnic composition of physicians nationwide. (The data that is available is shown in Appendix 7 and
Appendix 8.)
More important, The Complexities of Physician Supply and Demand: Projection Through 2025 states that
the supply of primary care physicians that many already believe to be insufficient is likely to get tighter
as demand outpaces supply faster for primary care than any of the specialty groups.
The need to improve data collection, workforce studies and expand collaboration among health
professions organizations on data and workforce services is a necessary component of progress toward
solutions.38
The AAMC provides important workforce recommendations related to PPACA for increasing
diversity, ensuring cultural competency and quality. Included below is how the authors believe
Tennessee should follow up on these general recommendations.
33 ibid
34 Vanderbilt. The Changing Face of Medicine (2010). Available at http://www.mc.vanderbilt.edu/vanderbiltmedicine/index.html?article=9115
35 American Medical Association (2008). The Complexities of Physician Supply and Demand: Projections Through 2025. Available at http://
medical-mastermind-community.com/uploads/physician-supply.pdf
36 Rumala, B.B., Carson, F.D. (2007). Recruitment of Underrepresented Minority Students to Medical School: Minority Medical Student
Organization, an Untapped Resources. Journal of the National Medical Association, 99 (9). 1000-1009. Available at http://www.ncbi.nlm.
nih.gov/pmc/articles/PMC2575864/
37 Valcarcel, M., Diaz, C., Borrero, P.J. (2006). Training and retaining of underrepresented minority physician scientist-a Hispanic perspective:
NICHD-AAP workshop on research in neonatology. Journal of Perinatology, 26, 49 Available at http://www.nature.com/jp/journal/v26/n2s/
pdf/7211526a.pdf
38 ibid
10 HEALTH CARE REFORM: The Impact on Minority Populations in TennesseeAAMC Recommendation on Increasing Diversity
• Continue advocacy for and promotion of efforts that would increase enrollment, retention and
graduation of racial and ethnic minorities from medical school and residency programs within the
state of Tennessee
• Tennessee Policy Action
• Require cross-collaboration between diverse stakeholders (i.e. education, medical and
public health disciplines, etc.) that will address failures in the K-12 education system,
minority students attending high-poverty schools that lack academic and financial
resources, pipeline shortages and lack of science exposure at the state and local level
• Create a standardized state assessment to evaluate the climate of racial and gender
inclusivity on college and medical school campuses (i.e. representation of minority
faculty, student, etc.) and the application of diversity principles throughout the mission
and vision statement of the institution
• Ensure culturally appropriate academic advising on both college and medical school
campuses and through residency programs. And in doing so enhance retention by
implementing comprehensive programs that address the student needs in the areas of
finances, academics and career advising.
• Establish accountable and ongoing partnerships between medical schools and historically
black college and universities in Tennessee that would align academic requirements,
preparation and enrollment of minority students
AAMC Recommendation on Ensuring Cultural Competency
• Increase efforts to strongly support the education and training of leaders in medical education and
health care focused on cultural competency and equity within the health care system
• Tennessee Policy Action
• Establish and/or strengthen existing initiatives and incentives that are in concert with
teaching institutions and government agencies, regarding the development, testing, and
implementation of progressive, cross-cultural health care interventions
• Mandate transparent monitoring and documentation of efforts related to cultural
competency and diversity for students, faculty and administration. Incorporate
accountability for achievement of outcomes
AAMC recommendation on integrating measures to improve the quality of care
• Efforts to undertake a study of the geographic distribution of physicians so that a better
understanding of where service is delivered is vital.
• Tennessee Policy Action
• Authorize and adequately fund a state level automated data management system that
would provide updated, organized and workable information to efficiently assess gaps
and disparities within physician workforce and health service delivery for the state of
Tennessee. Fully integrate and track descriptive characteristics such as race, ethnicity and
gender of medical physicians in the data management system to further address mal-
distribution and diversity at a state level as well.
11What effect will PPACA have on the Institutions that have traditionally
cared for the uninsured?
Access to medical care is the availability of care and the ability of an individual to obtain care when he/
she needs it. Lack of coverage has been shown to be a barrier to obtaining health care services.39 40 41 Despite
this, the uninsured do manage to get health care. Traditionally, this care has been rendered by charitable
physicians and hospitals, and by “safety net” hospitals and community health centers. PPACA allocates
$15.6 billion between 2014 and 2015 for community health centers and $1.5 billion for the National
Health Service to recruit minority physicians. From 2016 on, the community health center allocation
increases by approximately the average increase in costs incurred plus one percent per year. What
impact this will have remains to be seen, but it will presumably be positive.
PPACA also eliminates $18 billion in disproportionate share payments (DSH) to hospitals that serve
the uninsured and underinsured. The premise is that the increased number of people with coverage
will more than offset the need for subsidization of charity care. There is also a provision in the law that
requires hospitals to report on and meet certain quality guidelines. If they do not, then their payments
will be reduced.
The BlueCross BlueShield of Tennessee Health Institute interviewed Dr. Reginald Coopwood, CEO of
The Regional Medical Center at Memphis (The MED) regarding this subject. He had done a thorough
analysis of the disproportionate share payments issue and felt fairly comfortable that the gains from the
newly insured would just about equate to the losses of DSH money. He qualified this by stating that
assumed a constant volume of patients and no loss in revenue per patient. Dr. Paul Stanton, president
of East Tennessee State University at the time of the interview and a vascular surgeon by training,
(Dr. Stanton has since retired) agreed that the effects of those two provisions would probably offset
one another, again with the same qualifiers. Both Dr. Stanton and Dr. Coopwood are members of the
BlueCross BlueShield of Tennessee board of directors.
Darin Gordon, TennCare Director, raised the possibility that newly covered individuals might elect
to get their care in different venues than they did while uninsured. Certainly it is possible to see
competition for this group of individuals that previously had few options. Obviously, if there is a
significant shift of people to different institutions, then the financial ramifications will be negative for
the current safety net hospitals.
Dr. Coopwood acknowledged that the penalties for lack of reporting of quality metrics could be an
issue. The Med is chronically underfunded, as are most inner city hospitals, and has a lack of access
to capital. As such, they do not have the reporting infrastructure built that many private hospitals
have. He is a staunch advocate of a “culture of quality” in his institution. However, he notes that
development of that culture takes time and infrastructure, both of which are in short supply.
It is too soon to accurately predict how these variables will impact access to care for minorities.
These issues bear close observation by Tennessee’s policy makers, lest an imbalance occur that creates
unintended negative consequences.
39 Finkelstein, A. et. al. (2011). The Oregon Health Insurance Experiment: Evidence from the First Year. Working Paper- 17190.
40 Maxwell et. al. (2011). Massachusetts’ Health Care Reform Increased Access to Care For Hispanics, But Disparities Remain. Health Affairs 29 (8).
41 Bahls, C. (2011). Achieving Equity in Health. Health Affairs: Health Policy Brief. 29 (10).
12 HEALTH CARE REFORM: The Impact on Minority Populations in TennesseeIV. HEALTH CARE ACCESS INDEX
Access to care may be impacted by physical proximity, transportation, physical barriers, ability to pay,
insurance coverage, or by the capacity of the system to accept more patients. In this paper, the authors
are specifically examining the increase in insurance coverage vs. the other aspects of access to care.
Access is often measured as a function of distance (or travel time) to the nearest medical facility42 and
for most general health care research needs, it is sufficient.43 Other factors influencing geographic access
to care include the distribution of the underlying population (with and without medical insurance)
and the availability of health care providers, both physicians and facilities.44
Effective primary care can improve the quality of care and health outcomes, and lower medical
spending.45 Access to and the delivery of preventive health services generates a healthy lifestyle and can
improve overall health46 because individuals with health insurance have a greater opportunity to receive
those preventive services.47
Unfortunately, not everyone has equal and adequate access to care. Geographic areas with low access
to care have higher rates of hospitalization and chronic diseases.48 Overcoming these various barriers is
necessary if quality health outcomes are to be attained.49
In the Health Insitute’s first paper, the Access-Challenge test developed by Leighton Ku50 and his
associates was used to look at the issue of access in Tennessee. They found that Tennessee was the 20th
worst state in terms of access when looking at the ratio of Medicaid expansion to primary care capacity.
Ku’s study conceded that access-to-care is more complicated than the study made it out to be because it
occurs at a local level, not at the state level.
The Health Institute shares this belief that access to care cannot be measured in a single dimension,
such as distance to a facility, because this fails to capture the known tendency for patients to avoid
utilizing medical services at their nearest facility.51 52 To the authors’ knowledge, no comprehensive
42 Rosero-Bixby, L. (2004). Spatial Access to Health Care in Costa Rica and its Equity: a GIS-Based Study. Social Science & Medicine , Volume
59, Issue 7, Pages 1271-1284.
43 Jones SG, Ashby AJ, Momin SR, Naidoo A. Spatial implications associated with using Euclidean measurements and ZIP code centroid
geoimputation methods in healthcare research. 2010. Health Services Research, 45(1):316-327
44 Health Services Advisory Group, I. (2011). Colorado Medicaid HEDIS 2001 Results Statewide Aggregate Report. Colorado Medicade
HEDIS , 4:1-4:25.
45 Steinbrook, R. M. (2009). Easing the Shortage in Adult Primary Care- Is it All about Money? The New England Journal of Medicine ,
360:2696-2699.
46 Institute of Medicine. (2001). Crossing the Quality Chasm: A New Health System for the 21st Century. Institute of Medicine .
47 Newacheck D. P., Paul W. (1998). Health Insurance and Access to Primary Care for Children. The New England Journal of Medicine ,
338;513-519.
48 Bindman, G. O. (1995). Preventable Hospitalizations and Access to Health Care. The Journal of the American Medical Association , 274;305-
311.
49 Bloomberg School of Public Health, t. S. (n.d.). John Hopkins Center to Eliminate Cardiovascular Health Disparities. Retrieved February 6,
2012, from Access to Care: http://www.jhsph.edu/cardiodisparities/about/influences_on_health/access_to_care.html
50 Ku, L., et al. (2011) The States’ Next Challenge – Securing Primary Care for Expanded Medicaid Population. New England Journal of
Medicine, 364: 493-495.
51 Rosero-Bixby, L. (2004). Spatial Access to Health Care in Costa Rica and its Equity: a GIS-Based Study. Social Science & Medicine , Volume
59, Issue 7, Pages 1271-1284.
52 Coulter, S. L. & Jones, S. (2012). A Geographic Analysis of Patterns of Care in Tennessee. Forthcoming. (This has been researched extensively
and our report on Tennessee will be published in the coming months.)
13health care access index exists. To better understand access to care in Tennessee, we developed a
seven-dimensional index with the four demand factors being membership volume, 2000 US Census
population, inpatient utilization and emergency room utilization. The three supply factors were volume
of primary care practitioners, volume of specialty care physicians and volume of acute care hospitals.
The index uses BlueCross BlueShield of Tennessee and US Census Bureau data where appropriate. The
index was created at the ZIP code level and may be aggregated up to coarser spatial scales (e.g., county,
MSA) or projected down to the members/population residing within the ZIP code. For the purposes
of this study, the study period was defined as calendar year 2011. For the remainder of the technical
data specifications and formulas please see the Appendix.
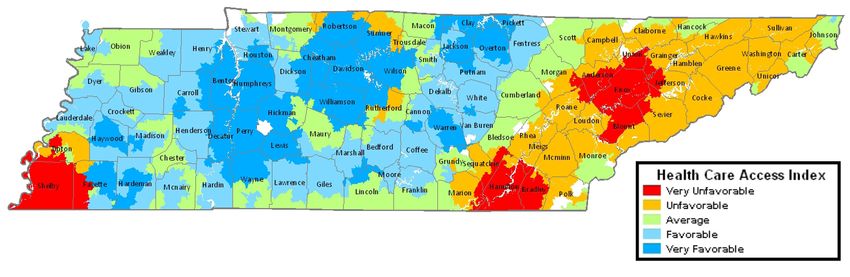
Based on the results from this Health Care Access Index the following map was generated. A map for
each of the seven components can be found in the Appendix.
Figure 4 – Overall Access to Care Index Score (see Appendix 4 for graphs
of each dimension of the index)
See appendix for full-size map
V. AN INVITATION TO DIALOGUE
The Health Care Access index, as seen in its entirety in Appendices 3 and 4, has shown, for the most
part, the six MSAs have favorable or very favorable provider ratios (not access to care) in both PCPs
and specialists. However many of the areas surrounding MSAs have unfavorable or very unfavorable
provider ratios; this causes many rural patients come to the MSA counties to receive care which makes
the MSA provider ratio appear better than it is because of the higher utilization, as seen in Appendices
5 and 6, due to people driving from the rural areas into cities to receive care.53 The newly insured will
only add to the capacity problem facing Tennessee’s PCPs and make it more difficult for everyone to
receive timely care. This is especially relevant to the African-American and Hispanic populations in
Tennessee when considering that an overwhelming majority of both populations call these 27 counties
home. There is the additional consideration that newly insured individuals tend to access care at
significantly higher rates than those who have had continuous insurance or remain uninsured.54
We the authors believe this method has merit but this is the first time it has been used. All seven
components have been weighted equally, but we realize that they all may not be inherently equal. Since
we have no scientific basis at this point upon which to weight them; we chose not to. Although it has
53 ibid
54 Finkelstein, A. et. al. (2011). The Oregon Health Insurance Experiment: Evidence from the First Year. Working Paper- 17190.
14 HEALTH CARE REFORM: The Impact on Minority Populations in Tennesseenot been tested, it does intuitively correspond with what we know about access-to-care in Tennessee.
We hope that others will test this hypothesis to help us improve this index. Our purpose is to initiate
discussion, not make a proclamation. Please direct comments and suggestions about the Health Care
Access Index to health_institute@bcbst.com.
VI. CONCLUSIONS
Although initiatives have been launched to address health care diversity in Tennessee through various
policies and programs on medical campuses, it has not been enough to keep up with the current
workforce needs and is much less the anticipated increase in demand from the newly insured. On a
national level, due to population growth, aging and other factors, demand will outpace supply through
at least 2025 as seen in Figure 5.
Figure 5 – Baseline Physician PTE Supply and Demand Projection 2006-202555
With an estimated influx of 600,000 newly insured individuals into the state’s health care system,
about 250,000 of whom will be African-American or Hispanic, immediate and strategic measures to
address diversity in the workforce, as well as equity and access are vital to ensuring sustainability and
reaching the most vulnerable populations. Overall conditions for the entire state of Tennessee and its
residents are expected to continue to deteriorate because of a number of factors including, but not
limited to:
• Limited pipeline and diversity. Currently, the state’s infrastructure to educate, train and increase
the numbers of health care providers is limited. And is unlikely to significantly change in the near
future. In addition, it is imperative that the state secures a workforce that understands the needs
of communities of color by reflecting the population served.
• Increased disease burden. Tennessee faces some of the highest rates of obesity, diabetes and
hypertension in the country, placing a significant burden on the health care system. Additionally,
populations that are disproportionately impacted and face significant co-morbidities (i.e. minority
populations, low-income, the elderly) create a synergistic impact on demand at the same time that
they see reduced quality of life and productivity.
• Increased number of insured. Under PPACA most of the approximately 960,000 residents of
Tennessee who are currently uninsured will enter into the health care system. And although many
will remain uninsured, 600,000 - 700,000 people are expected to become newly insured. This will
55 ibid
15place an additional strain on the workforce because people who are insured tend to use the health
system more frequently than the uninsured.56 The initial need may be higher due to the pent-up
demand from people who have been uninsured.
RECOMMENDATIONS
In the Health Institute’s initial paper on health care reform, a looming delivery capacity crisis in
Tennessee was identified. In this paper, the authors have examined in some detail the impact this
capacity crisis will have on minorities in Tennessee, who currently constitute a disproportionate share
of the uninsured. This paper has demonstrated that when PPACA takes full effect in 2014, although
more minorities will have health care coverage, actual access to health care will still be difficult, given
that the areas in which these populations are concentrated already have significant access problems.
This paper has also demonstrated, through literature review and data, that increasing the number of
minority providers does result in increased access for minority patients. The recommendation that
follows from this is fairly obvious: Tennessee needs to increase the number of minority physicians.
How to do this is not quite as obvious. Simply increasing the number of medical school slots, and
filling them with minorities has a number of barriers. First, even if the funding became available for
more med school slots, that alone won’t solve the issue. There have to be residency slots for med school
graduates to fill. PPACA does address this in Sections 2551 and 5601, but it is essentially a zero
sum game, and that will not fundamentally help the problem. Second, there are political barriers to
“quotas” as they apply to coveted items like medical school admissions.
Creating interest and recruiting minority students in the life sciences should begin at an early age.
It is pretty difficult to suddenly decide to be a doctor sometime in your junior year in college, if you
haven’t been taking the right courses and had some degree of focus.
The state and its physicians also need to improve throughput in the health care system. The levels
of increased productivity needed range from 10 to 30 percent, depending on the area of the state.
There is no way, given the time it takes to produce a doctor, that gap can be filled in a timely manner.
Tennesseans will have to make more use of and more efficient use of mid-level practitioners to
achieve this kind of productivity enhancement. PPACA, through its support of Accountable Care
Organizations, helps set the stage for a redesign of health care delivery in a more efficient fashion. This
opportunity should not be missed.
56 Finkelstein, A. et. al. (2011). The Oregon Health Insurance Experiment: Evidence from the First Year. Working Paper- 17190.
16 HEALTH CARE REFORM: The Impact on Minority Populations in TennesseeAPPENDIX 1
Graphic Model of Healthy People 2020
The Federal Interagency Workgroup developed a graphic model to depict the ecological and
determinants approach that Healthy People 2020, a plan devised by the U.S. Department of Health
and Human Services, will take in framing the national health objectives. This particular graphic
was designed to emphasize this new approach, and is not meant as a comprehensive representation
of all public health issues and societal domains. The graphic framework attempts to illustrate
the fundamental degree of overlap among the social determinants of health, as well as emphasize
their collective impact and influence on health outcomes and conditions. The framework also
underscores a continued focus on population disparities, including those categorized by race/ethnicity,
socioeconomic status, gender, age, disability status, sexual orientation, and geographic location.
U.S. Department of Health and Human Services. (2010). Healthy People 2020
Available at http://healthypeople.gov/2020/consortium/HP2020Framework.pdf
17APPENDIX 2
Summary of sections of PPACA that address workforce diversity
Table 2. Workforce Diversity Section No.
Collect and publicly report data on workforce diversity 5001
Increase diversity among primary care providers 5301
Increase diversity among long-term care providers 5302
Increase diversity among dentist 5303
Increase diversity among mental health providers 5306
Health professions training for diversity 5402
Increase diversity in nursing professions 5309
Investment in HBCU’s and minority-serving institutions 2104
Community-based training for AHEC’s targeting underserved populations 5403
Grants for Community Health Workers, providing CLAS 5313
Grants to train providers on pain care, including CLAS 4305
Support for low income health professions/home care aid training 5507
*CLAS-culturally and linguistically appropriate service
18 HEALTH CARE REFORM: The Impact on Minority Populations in TennesseeAPPENDIX 3
Health care access Index detailed discussion and formula derivation
To the authors’ knowledge, no comprehensive access to care index exists. We believe one is needed
and have developed a comprehensive health care access index at the ZIP code level based on seven
dimensions. For the study period, the following seven factors were summarized for all ZIP codes within
the state of Tennessee and contiguous counties in neighboring states. (Here, summarized means each
countable observation within each of the seven factors was summed up to each respective ZIP code.):
Demand factors:
1. Membership volume (BCBST enterprise membership)
2. Census population (2000 US Census Bureau data)
3. Inpatient utilization (BCBST data, any cause)
4. Emergency room utilization (BCBST data, any cause)
Supply factors:
1. Volume of primary care physicians (BCBST contracted)
2. Volume of specialty care physicians (BCBST contracted)
3. Volume of acute care hospitals (BCBST contracted)
Membership was defined as any BlueCross BlueShield of Tennessee member residing within the ZIP
code during the study period.
Census population was defined using the total population count of 5,689,283 people from the 2000
US Census Bureau ZIP code data.
Inpatient and emergency room utilization included stays/visits for any reason from members residing
in the ZIP code during the study period.
For all provider volume metrics, the physical locations of the facility or the primary practice address for
physicians were used.
Primary care specialties were defined as any provider with the following listed specialty: family
medicine, general practice, internal medicine, nurse practitioner - acute care, nurse practitioner - adult
health, nurse practitioner - family practice, nurse practitioner - pediatrics, pediatrics, or physician
assistant (primary care). Specialists were defined as any provider not included in the list of primary
care practitioners. Primary and specialist care combined, BlueCross BlueShield of Tennessee contracts
with 98% of actively practicing physicians.
Facilities were defined as any BlueCross BlueShield of Tennessee contracted acute care hospital;
BlueCross BlueShield of Tennessee contracts with all acute care hospitals in Tennessee.
19You can also read