SUDAN WORKING PAPER - Chr. Michelsen Institute
←
→
Page content transcription
If your browser does not render page correctly, please read the page content below
NUMBER 1
S U DA N WO R KI N G PA PE R
M AY 2 0 21
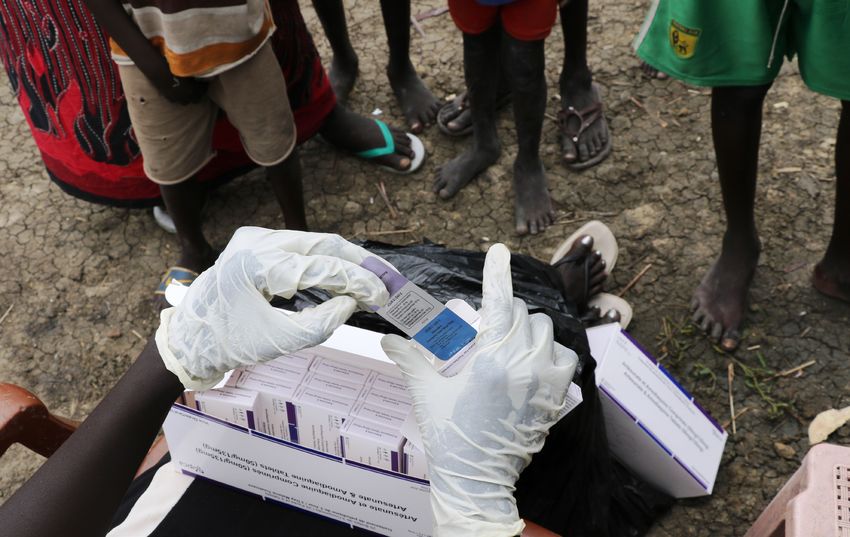
Photo by EC/ECHO/Anouk Delafortrie (flickr)
Out of Pocket Healthcare
Expenditures: Determinants and
Impacts on the Livelihoods of
Urban Households in Selected
Sudanese States
AU T H O R S
Mohammed Elhaj Mustafa Ali
Eltayeb Mohamedain AbdallaOut of Pocket Healthcare Expenditures:
Determinants and Impacts on the Livelihoods of
Urban Households in Selected Sudanese States
Sudan Working Paper
Number 1, May 2021
Authors
Mohammed Elhaj Mustafa Ali
Eltayeb Mohamedain Abdalla
Cover photo
EC/ECHO/Anouk Delafortrie
ISBN 978-82-8062-774-2 (print)
ISBN 978-82-8062-775-9 (PDF)
ISSN 1890-5056Sudan Working Paper 2021:01 Out of Pocket Healthcare Expenditures www.cmi.no
Contents
1. Introduction ....................................................................................................................................................... 6
2. Importance of the study ................................................................................................................................. 8
3. Objectives of the study................................................................................................................................... 9
4. Literature review .............................................................................................................................................. 9
5. Urban populations in Sudan: Some stylized facts ................................................................................... 12
5.1. Urban population growth in Sudan ................................................................................................. 15
5.2. Access to healthcare in Sudan ......................................................................................................... 16
5.3. Healthcare expenditures by households ....................................................................................... 18
6. Research methods .......................................................................................................................................... 18
6.1. Models Specification .......................................................................................................................... 18
6.2. Data ........................................................................................................................................................ 21
6.3. Estimation methodology ................................................................................................................... 22
7. Empirical results.............................................................................................................................................. 22
7.1. Determinants of OOPHE using 2009’s NBHS ............................................................................. 22
7.2. Determinants of OOPHE using 2014’s NBHS ............................................................................. 27
7.3. Determinants of OOPHE according to gender ............................................................................ 34
7.4. Determinants of CHE in the selected states using the 2009 NBHS ....................................... 36
7.5. Determinants of CHE in the selected states using the 2014 NBHS ....................................... 39
7.6. Impact of CHE on urban households’ livelihoods ........................................................................ 43
8. Conclusion and Policy Implications ............................................................................................................ 47
Reference list ............................................................................................................................................................ 50
Appendixes ............................................................................................................................................................... 54
3Sudan Working Paper 2021:01 Out of Pocket Healthcare Expenditures www.cmi.no About the authors Mohammed Elhaj Mustafa Ali Assistant professor, Development Studies and Research Institute, University of Khartoum, Sudan, email: mohdaj1976@gmail.com. Eltayeb Mohamedain Abdalla Associate professor, Department of Economics, University of Kassala, Sudan, Email: eltayebain11@yahoo.com. Acknowledgements We wish to express our deep appreciation and gratefulness to the Assisting Regional University in Sudan (ARUS) program for the financial support to carry out this research. We are solely responsible for any shortcomings of this study, as well as the views expressed in it. 4
Sudan Working Paper 2021:01              Out of Pocket Healthcare Expenditures                  www.cmi.no

Abstract
This study investigates determinants of out-of-pocket and catastrophic healthcare expenditures
(OOPHE and CHE) incurred by urban households in five Sudanese states, namely, Red Sea, Kassala,
Gadarif, Sinnar, and South Darfur. The study also examines the impact of CHE on the livelihoods
of households in these states. To achieve these aims, the study applies ordinary least squares (OLS)
and probit regression methods to data sourced from Sudanese National Baseline Household Surveys
(NBHSs) conducted in 2009 and 2014. An analysis based on the 2009 NBHS shows that OOPHE
is significantly influenced by factors such as household size, the head of household’s educational level,
and the presence of elderly household members. When the 2009 data is disaggregated to the state
level, however, the analysis demonstrates that household income, enrollment in a health insurance
program, very young (under age 5) household members, the head of household’s educational level,
the head of household’s gender, and the family’s wealth correspond the most significantly to the
amount of OOPHE a family incurs. Interestingly, the analysis based on the 2014 NBHS indicates
that health insurance, the family’s wealth, and the head of household’s age, gender, wage employment,
and marital status are correlated with OOPHE. The analysis based on disaggregated data from 2014
indicates that OOPHE is significantly correlated with factors such as the head of household’s age,
household size, the head of household’s educational level, wealth, and distance from healthcare
facilities. Furthermore, the analysis shows that CHE is significantly correlated with health insurance
enrollment, family wealth, household size, distance from healthcare facilities, and the head of
household’s age and education. Finally, the investigation reveals that a high level of CHE is
accompanied with lower shares of food and non-food purchases in a household’s total expenditures
and, thus, worsens households’ livelihoods in those other domains. Based on these findings, the study
ends with some recommendations aimed at alleviating the burden of private healthcare spending on
urban households in the states under consideration.

5
Sudan Working Paper 2021:01                     Out of Pocket Healthcare Expenditures                        www.cmi.no

1. Introduction
In 1992, the Sudanese government implemented a package of economic policies entitled the
“Structural Adjustment Program” (SAP), along with economic reforms recommended by the
International Monetary Fund. In compliance with SAP and IMF recommended policies, the
Sudanese government has reduced its interventions in economic activities, and initiatives have
awarded the production of some public goods (such as healthcare services and education) to the
private sector. Advocates of the SAP have argued that, compared to the public sector, privately owned
business entities are more efficient in managing scarce resources. For example, in the area of health,
in 1992 the government introduced a user-fees system to finance healthcare services as a substitute
for the tax-based system inherited from British colonizers. The user-fees system permitted private
providers to supply healthcare services at market prices to financially capable segments of the
population. However, it soon became clear for both policymakers and health authorities that the user-
fees system failed to provide adequate healthcare services to the vast majority of people, particularly
the poor (Abdu et al. 2004; Lagarde and Palmer 2008).

To mitigate the catastrophic drawbacks of the user-fees system, in 1995 the government launched the
country’s first public health insurance scheme. The declared goals of the scheme were to promote the
utilization of healthcare services, to make healthcare services available to all individuals, and to reduce
the incidence of OOPHE incurred by Sudanese households (Ebaidallah and Ali 2019). However,
current statistics demonstrate that these goals are still out of reach. Healthcare spending in the form
of OOPHE has remained very high, suggesting that the public health insurance scheme has failed to
protect people against health-related financial hardship. The World Development Indicators show
that OOPHE represented 65% of total healthcare spending in Sudan during the 1998–2018
timeframe (World Bank 2020).

The incidence of OOPHE is likely higher in some states, especially in states with poor records in
terms of disease, prevalence of poverty, and social stability. In particular, the exposure of the
population to OOPHE in the states affected by wars and disasters—including the Red Sea, Kassala,
Gadarif, Sinnar, and South Darfur—is anticipated to be higher compared to the rest of the country.
The 2009 Sudanese National Baseline Household Survey (NBHS) indicates that large portions of
population in these five states live under the poverty line1. Moreover, these states experience a high
incidence of both chronic and acute diseases. For example, the average prevalence of diseases such as
malaria, respiratory infections, and malnutrition in these five states exceeds the national average
(Sudan Federal Ministry of Health, 2009). What makes the situation even worse is the fact that the

1   Approximately the percentage of households who live under poverty line is estimated to be 36.3% in Kassala, 57.7% in
    Gadarif, 50.1% in Red Sea, 44.1% in Sinnar, and 60.1% in South Darfur.

6
Sudan Working Paper 2021:01 Out of Pocket Healthcare Expenditures www.cmi.no majority of households in these states are not covered by health insurance: only about 20.6% of the population in Kassala, 36.5% in Gadarif, 23.6% in Red Sea, 27.4 in Sinnar, and 15.8% in South Darfur have health insurance (Ali Siddig and Hassan, 2016). No doubt, all these factors contribute to increases in OOPHE incurred by the population of these five states. However, the burden of OOPHE on urban populations is expected to be even higher. This is so because (at the current stage of development) urban centers in these states receive huge waves of immigration from rural areas, coupled with immigration from neighboring countries. For instance, along with flows of internal immigrants, the eastern states of Gadarif, Kassala, and Red Sea receive huge numbers of foreigners from Ethiopia and Eritrea. In South Darfur state, rates of immigration (mostly from rural to urban centers) have intensified since wars erupted in 2003. Such a growth in urban residents would certainly be expected to increase OOPHE incurred by urban residents. Furthermore, the high incidence of poverty and disease in these five states coincides with poor infrastructures in rural areas, which puts health services in urban centers under the pressure of extensive usage. In other words, an unbalanced distribution of infrastructure between rural and urban areas pushes rural residents to commute to urban centers to receive healthcare services. Thus, public facilities in urban areas are exhausted by large numbers of rural users pushing urban households to spend a large portion of their incomes on healthcare services. The exposure of a large proportion of households to OOPHE hardship is likely to generate serious human development consequences in these states. Previous studies have frequently shown that OOPHE represents a heavy burden on a household's budget, particularly for the poor (Bonu, Bhushan, and Peters 2007; Xu et al. 2007; Bredenkamp, Mendola, and Gragnolati 2010; Berman, Ahuja, and Bhandari 2010; Reddy et al. 2011; Shahrawat and Rao2012; Van Minh et al. 2013; Arsenijevic 2013). OOPHE reduces the proportion of income a household is able to allocate to education, food, and other necessities. Several studies have shown that healthcare spending diminishes household expenditures on necessities and, therefore, deepens the poverty of vulnerable groups (Van Doorslaer et al. 2006; Chuma and Maina 2012; Bhojani et al. 2012; Awiti 2014; Ebaidallah and Ali 2019). To give a relevant example, Ebaidallah and Ali (2019) study the impact of OOPHE on the poverty status of Sudanese households in Sudan and find that incurring OOPHE increases the rate of poverty and impoverishment among urban Sudanese households and significantly reduces their expenditures on education, food, and other life-sustaining items. Based on the above concerns, three questions can be raised regarding OOPHE and its impact on urban households in Red Sea, Kassala, Gadarif, Sinnar, and South Darfur: (1) what are the determining factors of OOPHE incurred by urban households in these states? (2) Which factors are likely to push urban households in these states to incur healthcare expenditures that reach catastrophic levels? And (3) what is the impact of OOPHE on the livelihoods of urban households in these states 7
Sudan Working Paper 2021:01             Out of Pocket Healthcare Expenditures                  www.cmi.no

(that is, the impact of OOPHE on the shares of food and non-food household expenditures)? To
answer these questions, this study applies ordinary least squares (OLS) and probit regression
techniques to data sourced from two rounds of the NBHS conducted by Sudan’s Central Bureau of
Statistics in 2009 and 2014.

2. Importance of the study
This study gains importance in several aspects. First, the size of the urban population in the Sudanese
states under investigation has increased significantly during the last four decades. Other than the
internal immigration, three of these states (Red Sea, Kassala, and Gadarif) are exposed to great waves
of immigrants from neighboring countries. Congestion in urban areas imposes great pressures on
healthcare facilities available to urban populations. Therefore, examining the determining factors of
OOPHE incurred by urban population in these states is very timely. Specifically, the outcomes of this
study could help policymakers develop appropriate actions to bridge the gap between supply and
demand of healthcare services and thus put an end to skyrocketing OOPHE.

Second, at the current stage of development, the states under study need a wide range of investments
to mitigate chronic poverty. The occurrence of wars and disasters has created an inhospitable business
environment, which deters local and foreign investments and, consequently, deepens the incidence of
poverty experienced by urban populations. The eastern states of Red Sea, Kassala, and Gadarif, for
instance, have been severely affected by wars waged between the government and the rebel movements
of the East Front and Alusoud Elhura. South Darfur state has similarly experienced (and still
experiences) prolonged wars with its all the accompanying negative consequences, including genocide,
displacement, and destruction of assets. Sinnar state has been affected by the chronic instability
prevailing in its neighboring states, namely, Blue Nile and Gadarif. All of these complications
discourage business investment and as a result increase the incidence of poverty. To make these states
hospitable for both foreign and domestic investors, policymakers need to create mechanisms for
human capital development. However, this goal cannot be achieved if the labor force remains exposed
to high OOPHE with its adverse effects on labor and productivity. Identifying determinants of
OOPHE and the impacts of OOPHE on the livelihood of urban populations could raise
policymakers’ awareness of how OOPHE hinders economic development in these states.

Third, the states under study suffer greatly from the prevalence of diseases that are linked to poverty,
poor standards of living, and deficient health infrastructure, including (but not limited to)
tuberculosis, anemia, malaria, and chikungunya. The pervasiveness of such diseases increases the pace
of OOPHE and traps a large portion of citizens in a vicious circle of poverty. Owing to this situation,
this study could be of great importance for those who combat poverty in these states. The study aims
to assist such actors to make informed decisions regarding poverty reduction and the inclusion of
vulnerable groups in urban areas. In the end, achieving a triumph over poverty may pacify the ethnic
tensions and overcome social unrests in Sudan.

8
Sudan Working Paper 2021:01               Out of Pocket Healthcare Expenditures                 www.cmi.no

Finally, in the last five years, policymakers in Sudan have taken steps towards the goal of achieving
universal health insurance coverage by 2020. However, the evidence demonstrates that bringing the
entire population under a health insurance umbrella is out of reach in the current situation. With this
in mind, this study may contribute towards achieving this goal. Specifically, giving accurate findings
on the negative impacts of OOPHE on the livelihoods of urban populations may encourage
policymakers to take further steps and actions to accelerate the expansion of health insurance to
include all segments of the population.

3. Objectives of the study
This study aims to identify the determinants of healthcare expenditures and their impacts on the
livelihoods of urban populations in five Sudanese states, Red Sea, Kassala, Gadarif, Sinnar, and South
Darfur. In particular, this study endeavors to:

     1. Identify determinants of OOPHE incurred by urban populations in the selected states;

     2. Detects whether the determining factors determinants of OOPHE incurred by urban
          populations vary among the states;

     3. Discover whether the determining factors of OOPHE incurred by urban populations vary
          among male and female-headed households.

     4. Identify the factors that are likely push OOPHE to exceed certain limits or thresholds and,
          thus, become catastrophic.

     5. Explore OOPHE impact on the livelihood of urban residents.

4. Literature review
Researchers have devoted a large volume of studies to investigating the determinants and impacts of
OOPHE and CHE on people’s livelihoods in both developed and developing countries. However,
the findings often differ based on the socio-economic contexts in which the issues are investigated.
The characteristics of the health system in a certain country or among a certain population group also
shape the determinants and impacts of healthcare spending. Looking at the developing country
context, for instance, Malik and Syed (2012) study the socio-economic determinants of household
OOPHE in Pakistan, applying OLS regression methods to data sourced from Household Integrated
Economic Survey (HIES) and Pakistan Standard of Living Measurement (PSLM) Surveys. They
conclude that factors such as non-food expenditures, literacy of household head and spouse, using an
unhygienic toilet, having had a child within the last three months, drinking unsafe water, and residing
in the Khyber Pakhtunkhwa province are the main predictors of a household’s OOPHE. In the same
regional context, Pal (2010) finds that the educational level of the household head plays a critical role

9
Sudan Working Paper 2021:01 Out of Pocket Healthcare Expenditures www.cmi.no in deciding the amount of OOPHE incurred by an Indian household. Similarly, Chaudhuri and Roy (2008) find that the ability to pay is a key determining factor of OOPHE in Vietnam. Instead of directly studying determinants of OOPHE, some scholars have focused on health insurance coverage as a predictor of private healthcare spending (Johnson and Krishnaswamy 2012; Azam 2018). Johnson and Krishnaswamy, for instance, use 2009 data from the Indian National Sample Survey Organization to estimate the impact of the Indian national health insurance scheme (Rashtriya Swasthya Bima Yojana, or RSBY) on hospitalization and OOPHE. They use a difference in difference approach, and their results reveal that the scheme led to a small reduction in OOPHE for outpatient healthcare services. However, Azam (2018) challenges Johnson and Krishnawamy’s findings. He uses longitudinal nationally representative household survey data to investigate the impact of RSBY on household’s per capita and per patient OOPHE and finds (among other things) that RSBY does not lead to a significant reduction in per capita OOPHE incurred by both rural and urban households. OOPHE is considered to be a “catastrophic” healthcare expenditure (CHE) when it exceeds a certain threshold of a household’s income or capacity to pay. Some researchers have examined the factors that push OOPHE to catastrophic levels. For example, Misra et al. (2015) examine the determinants of CHE in urban Lucknow, India, using data based on a cohort of 400 households. Their analysis indicates that both hospitalization and prolonged sickness without hospitalization are associated with higher CHE. Relying on data sourced from Iranian household income and expenditure survey, Yazdi- Feyzabadi et al. (2018) study the prevalence and intensity of CHE in Iran from 2008 to 2015. The authors define CHE as healthcare expenditures exceeding 40% of a household’s income after subtracting living expenses. Their analysis indicates that the average monthly OOPHE was low in rural areas over the years 2008 to 2015; however, the prevalence of CHE was quite high in comparison to urban areas during this time period. The authors conclude that rural settlement, higher income, receiving inpatient and outpatient services, and the existence of elderly household members increases CHE. In the same way, Amaya-Lara (2016) investigates the incidence and determinants of CHE in Colombia using probit regression techniques. His analysis is based on household data sourced from the 2011 Colombian Quality of Life National Survey. He classifies households as having CHE when OOPHE exceeds 20% of the household’s capacity to pay and finds that about 9.6% of the Colombian households surveyed had CHE. In addition, the author finds that factors such as having a large number of household members, having children or elderly household members, residing in a rural area, and being uninsured are positively correlated with the incidence of CHE. Along with studying determinants of healthcare spending, a strand of research has been devoted to exploring the role of OOPHE and CHE in shaping a population’s poverty status. Koch, Pedraza, and Schmid (2017), for instance, study the extent to which OOPHE exposes Chilean households to financial catastrophe and impoverishment. The authors conduct a systematic literature review to 10
Sudan Working Paper 2021:01             Out of Pocket Healthcare Expenditures                  www.cmi.no

explore empirical studies analyzing financial protection in Chile. They find that 4% of Chilean
households face CHE, defined as OOPHE exceeding 30% of the household’s capacity to pay, but
less than 1% of the Chilean population has been pushed into poverty due to CHE. Similarly, using
data sourced from Sudan’s 2009 National Baseline Household Survey Ebaidalla and Ali (2019)
examine determinants of OOPHE for national, urban, and rural households in Sudan. Their results
reveal that the incidence of disease, household income, literacy level of the head of, household size,
and the number of household members over age 65 or below age 5 are all key factors that drive a
household’s OOPHE. Furthermore, they find that households that have elderly or very young
members or belong to the lowest income quintile are more likely to be pushed into CHE. More
importantly, the findings show that a considerable portion of the Sudanese population falls below the
poverty line after incurring OOPHE.

Applying both bivariate and multivariate analyses to data obtained from the World Health
Organization’s Study on Global Ageing and Adult Health, Kumar et al. (2015) assess the
socioeconomic- differentials that influence the impact of OOPHE on the incidence of poverty in
China and India. Interestingly, they find that OOPHE pushed 7% (in China) and 8% (in India) of
the total population into poverty. Moreover, their multivariate analysis indicate that lacking wealth,
having inpatient and outpatient healthcare raises households’ OOPHE and, as a consequence,
increases the likelihood of falling below poverty line in both countries. Likewise, Rahman et al. (2013)
examine the determinants of high healthcare expenditures and healthcare related financial catastrophe
in Bangladesh using data collected from a cross-sectional household survey conducted in Rajshahi.
They find that the poorest households have a four times higher risk of incurring CHE than the rich.
Additionally, the authors find that the risk of exposure to financial catastrophe among those who use
inpatient and outpatient public and private healthcare facilities is higher than the risk among those
who only use traditional healers.

Garg and Karan (2009) use Consumer Expenditure Survey data from the Indian National Sample
Survey conducted 1999–2000 to investigate the differential impact of OOPHE on inpatient care,
outpatient care, treatments, and poverty across different income quintiles in both developed and less
developed regions in India. Their most important finding is that OOPHE increases overall poverty
by 1%. In the African context, Onwujekwe, Hanson, and Uzochukwu (2012) use data collected by
interviewer administered questionnaires from 4,873 households to assess CHE incurred by the
population of four local government areas in southeast Nigeria. The CHE was measured using a
threshold of 40% of monthly non-food expenditure. They find that urban populations incur higher
OOHPE than other socio-economic groups. However, the incidence of CHE is higher among poorer
and rural residents.

In their widely cited study, Van Doorslaer et al. (2006) challenge conventional estimates of poverty,
arguing that these estimates turn a blind eye to the effect of OOPHE on a household’s poverty status.

11
Sudan Working Paper 2021:01              Out of Pocket Healthcare Expenditures                  www.cmi.no

Using data on healthcare expenditures from nationally representative surveys, the authors reassess
poverty estimates in 11 low and middle-income countries in Asia after considering OOPHE.
Interestingly, they find that, after taking into account OOPHE, the prevalence of absolute poverty in
these countries increases14% above the conventional poverty estimates.

Some studies focus on the prevalence of illness as a measure for the backbreaking burden facing those
who incur OOPHE. For instance, Thuan et al. (2006) use OOPHE on communicable and non-
communicable illnesses as burdens of illness encountered population in the Vietnamese Bavi district.
They confirm that communicable diseases represent the main cause of higher levels of OOPHE and
that this type of illnesses is more dominant among poor populations.

On the whole, the literature reviewed above confirms that the determinants of OOPHE and CHE
are principally linked to socioeconomic, demographic and health characteristics of the households
being studied. This conclusion lends support to conducting an independent analysis to investigate the
determinants and impacts of OOPHE in the Sudanese states under consideration (Red Sea, Kassala,
Gadarif, Sinnar, and South Darfur). In particular, previous studies, including the Sudanese study
conducted by Ebaidallh and Ali (2019), leave unanswered questions about the determinants and
impacts of OOPHE and CHE at regional levels. In addition, the above reviewed studies do not give
attention to the role of gender in deciding the route of healthcare spending. This study fills this gap
by considering the effect of the gender of the head of household on OOPHE and CHE undertaken
by urban households in the selected Sudanese states. Moreover, as shown in the reviewed literature,
researchers often narrow down their analysis by studying determinants and the impact of OOPHE at
the lowest administrative levels, such as district, region, or province. This motivates us to study these
hot issues in each of these five states separately, since each state is likely to possess its own
socioeconomic, demographic, and geographical characteristics.

5. Urban populations in Sudan: Some stylized facts
In the last five decades, the urban population in Sudan has grown dramatically. According to the
World Bank, this segment of the population grew from representing 10.75% of the total population
in 1960 to 33% of the total population in 2019 (World Bank 2020). Figure 1 below depicts the urban
proportion of Sudan’s total population during the 1960–2019time period. Starting from the 1960s,
the urban population began to grow more rapidly, reflecting socioeconomic transformations in the
country. These transformations included the occurrence of drought, famine, as well as the eruption
of wars in the South Darfur, South Kordofan, and Blue Nile states. These developments pushed urban
population to reach one-third of the country’s total population at the beginning of the 1990s, and it
has stayed at roughly this level since that time.

12
Sudan Working Paper 2021:01               Out of Pocket Healthcare Expenditures                www.cmi.no

               Figure 1 : Urban population in Sudan (1960 - 2019)
  40
  35
  30
  25
  20
  15
  10
   5
   0
       1960
       1962
       1964
       1966
       1968
       1970
       1972
       1974
       1976
       1978
       1980
       1982
       1984
       1986
       1988
       1990
       1992
       1994
       1996
       1998
       2000
       2002
       2004
       2006
       2008
       2010
       2012
       2014
       2016
                                       Urban population (% of total)

Source: World Development Indicators (World Bank 2020)

Figure 2 portrays the growth rates of Sudan’s urban population during the 1960–2019 period. Growth
rates were higher during the 1960s and again in the 1980s, reflecting the country’s demographic,
political, and social changes. However, the increase in the 1980s was somewhat higher than the
increase in the 1960s. This can be partially interpreted by the different factors leading to the two
waves of urban population growth. In the 1960s, urban population growth was mainly driven by the
expansion in the national economic base and the relative political stability that the country enjoyed in
that period. It seems those developments motivated a large portion of the rural population to move
to urban areas. Alternatively stated, people began immigrating to urban areas to gain a share of the
economic pie which (due to the bias in allocating development projects) was confined to urban
centers. In contrast, in the 1980s, rural people were pushed to immigrate to urban areas because of
unfavorable economic and climate conditions. During that period, rural areas were exposed to tough
waves of drought and famine that pushed the population (particularly, in western Sudan) to move to
Khartoum and regional capital cities. In short, urban population growth in the 1960s was driven by
pull factors, while urban population growth in the 1980s was caused by push factors. The impact of
the push factors on urban population growth was larger than that caused by the pull factors.

13
Sudan Working Paper 2021:01 Out of Pocket Healthcare Expenditures www.cmi.no
Fgure 2: Urban population growth in Sudan (1960 - 2019)
10
8
6
%
4
2
0
1960
1962
1964
1966
1968
1970
1972
1974
1976
1978
1980
1982
1984
1986
1988
1990
1992
1994
1996
1998
2000
2002
2004
2006
2008
2010
2012
2014
2016
Urban population growth (annual %)
Source: World Development Indicators (World Bank 2020)
The urban population grew at more moderate rates during the 1970s, 1990s, and 2000s. A reasonable
interpretation for this phenomenon may be that Sudan enjoyed a degree of political stability during
these periods. In 1972, for instance, Sudan signed a peace agreement with the Southern Sudan
Liberation Movement (SSLM) in Addis Ababa, which ended the first civil war that had been waged
in Sudan from 1955 to 1972.Peace brought by the Addis Ababa agreement may have slowed the
waves of internally displaced persons to urban areas, given that areas affected by the first civil war
were mostly located in the rural southern regions. Likewise, in 2005, the government of Sudan came
into agreement with the Sudan People's Liberation Movement (SPLM), ending the second civil war
waged in 1983. That agreement brought relative political stability to southern regions, including
South Kordofan and Blue Nile states, which lessened push factors for immigration to urban centers.
In addition, this political stability led to significant economic progress, which could have motivated
the rural population to stay in rural areas, thus lessening pull factors for immigration.
In short, a number of overlapping factors have led the Sudanese urban population to grow dramatically
during the last five decades. This evolution in the urban population has generated and continues to
generate huge pressures on infrastructure in urban areas. Among these pressures, the congestion of
the population in urban centers has created large shortages in healthcare services, pushing people to
incur OOPHE. Moreover, the population density in urban areas boosts the spread of disease,
particularly endemic disease, which may also intensify the burden of healthcare expenditures
encountered by urban population. In the end, increases in OOPHE means people have less money to
spend on other life needs, such as education, sanitation, and food, thus deepening the incidence of
poverty among urban residents. Ebaidalla and Ali (2019) document that OOPHE push a large
portion of Sudan’s population (in both urban and rural areas) to fall into poverty. This situation will
only improve if policymakers increase efforts to eliminate the impoverishing impacts of skyrocketing
OOPHE.
14Sudan Working Paper 2021:01 Out of Pocket Healthcare Expenditures www.cmi.no
5.1. Urban population growth in Sudan
Although the total urban population in Sudan has grown significantly during the last decades,
urbanization has increased faster in some regions. For instance, compared to other regions, the
populations of Kassala, Port Sudan, and Gadarif cities have seen huge increases since 1973. Several
reasons have collectively driven growth in these cities, but a key reason is that these cities were exposed
to huge waves of refugees from Eritrea after the beginning of the war of independence waged between
the Eritrean Liberation Front and the Ethiopian government in 1960. That war pushed thousands of
Eritreans to flee to eastern Sudan, leading to great increases in the urban population of the mentioned
cities. As Table 5.1 shows, between 1973 and 1983, the populations of Kassala, Port Sudan, and
Gadarif cities grew by 4.2%, 5.5%, and 7.6%, respectively.
Table 5.1. Population trends in select Sudanese cities, 1973–2008
Population from census Intercensal average growth rate
City 1973 1983 1993 2008 1973–1983 1983–1993 1993–2008
Gedarif 66,465 116,876 191,164 269,395 5.6% 4.9% 3.4%
Kassala 99,652 141,429 234,622 298,529 3.5% 5.1% 2.4%
Khartoum 333,906 473,597 947,483 1,410,858 3.5% 6.9% 4.0%
Khartoum North 150,989 340,857 700,887 1,012,211 8.1% 7.2% 3.7%
Nyala 59,583 111,693 227,183 492,984 6.3% 7.1% 7.7%
Omdurman 299,399 526,192 1,271,403 1,849,659 5.6% 8.8% 3.7%
Port Sudan 132,632 206,038 308,195 394,561 4.4% 4.0% 2.5%
Sinjah 19,452 27,982 -- 56,058 3.6% -- --
Sinnar 28,546 42,803 72,187 123,158 4.1% 5.2% 5.3%
Source: 2008 priority census tables, Central Bureau of Statistics, Sudan
As Table 5.1 shows, the growth rate of urban population remained quite high until the beginning of
the 1990s. In Kassala, Port Sudan, and Gadarif cities, the population growth rate dropped
dramatically in the 1993–2008 time period, signifying the end of the Eritrean war of independence.
In other words, after the end of war in neighboring countries, increases in urban populations may be
attributed to regular waves of immigrants from rural to urban centers.
Other cities saw even more sizeable population increases. For instance, the population of Nyala
(South Darfur’s capital) has grown considerably, mirroring the end of the second civil war in 2005.
In fact, the average growth rates in Nyala exceeded those in Khartoum, Sinnar, Kassala, Gadarif, and
Port Sudan cities. Perhaps these higher growth rates reflect the role of war in displacing a large
number of people from their rural incubators to the state’s urban center where they could find security
and humanitarian support.
On the whole, as Table 5.1 shows, urban populations grew at alarming rates between 1973 and 2008.
Urban population growth goes hand in hand with a need for policymakers to upgrade infrastructure
to meet increased urban demand.
15Sudan Working Paper 2021:01 Out of Pocket Healthcare Expenditures www.cmi.no
5.2. Access to healthcare in Sudan
High growth rates in Sudan have not always corresponded to expansions in infrastructure, especially
in the areas of health and education. As Table 5.2 shows, a great gap exists between the available
healthcare facilities and the medical needs of urban populations in the states of Red Sea, Gadarif,
Kassala, Khartoum, Sinnar, and South Darfur. Furthermore, there are significant disparities in the
distribution of healthcare facilities and personnel across these states. For instance, the number of
medical technicians per 100,000 individuals in Khartoum state is approximately 18 times that in Red
Sea, 6 times that in Gadarif, 9 times that in Kassala, and 7 times that in Sinnar and South Darfur
states. Overall, the number of medical staff in Khartoum state exceeds that in other states by 62%.
The image is a bit better corrected when it comes to medical assistants. However, it is well known
this category of medical practitioners not qualified to engage in vital medical interventions in cases of
severe diseases. Nonetheless, Sinnar state outperforms Khartoum state in terms of the number of
medical assistants per 100,000 residents.
Table 5.2. Medical staff per 1000,00 residents in selected states, 2016
Medical staff (total) Medical staff (per 100,000 residents)
Public Public
Medical health Medical health
State Technicians assistants Nurses officers Technicians assistants Nurses officers
Gadarif 833 111 800 110 41.4 5.5 44.7 5.5
Kassala 578 192 857 34 24.5 8.1 36.3 1.4
Khartoum 5,076 228 4,343 165 68.7 3.1 58.8 2.2
Red Sea 284 102 557 43 19.6 7.1 38.5 3.0
Sinnar 698 292 1077 46 39.3 16.4 60.6 2.1
South
726 254 544 40 18.3 6.4 13.7 1.0
Darfur
Sudan
(overall) 14,291 2,999 16,037 1,135 26.1 7.6 40.5 2.9
Source: Annual Health Statistical Report (Sudan Federal Ministry of Health 2016)
The above statistics reflect bitter realities of the Sudanese health system. First, there are great
variations in the distribution of medical staff between the presidential state (Khartoum) and the rest
of the country. Second, at the national level, the number of medical staff in the country is insufficient
for the population. Third, healthcare facilities are currently concentrated in urban areas. This reality
is likely to push large portion of rural populations (particularly those with underlying medical
conditions) to immigrate to urban centers, generating more pressure on already inadequate healthcare
facilities. In the long run, this is likely to lead to the under-provision of healthcare services, increases
in OOPHE, and amplified poverty impacts.
16Sudan Working Paper 2021:01 Out of Pocket Healthcare Expenditures www.cmi.no
Table 5.3. Hospitals and beds per 100,000 residents in selected states, 2016
Total Number Number Hospitals per Beds per
State population of hospitals of beds 100,000 residents 100,000 residents
Gedarif 2,012,614 33 1,668 1.6 82.9
Kassala 2,360,083 22 1,334 0.9 56.5
Khartoum 7,385,158 49 6,734 0.7 91.2
Red Sea 1,445,353 28 1,356 1.9 93.8
Sinnar 1,777,982 34 1,781 1.9 96.6
South Darfur 3,968,978 21 1,207 0.5 30.4
Sudan (overall) 39,598,700 503 30,308 1.3 76.5
Source: Annual Health Statistical Report (Sudan Federal Ministry of Health 2016)
Table 5.3 gives statistics on hospitals and beds per 100,000 residents in the Red Sea, Gadarif, Kassala,
Sinnar, South Darfur, and Khartoum states. Both the number of beds and hospitals available
per100,000 residents are far from the international standards recommended by the WHO. For
instance, Kassala, Khartoum, and South Darfur states have no more than one hospital per 100,000
residents, although Red Sea, Gadarif, and Sinnar seem to be better than the national average. Of
course, the number of residents a hospital can serve in reality depends on the number of beds in the
hospital. Importantly, the number of hospital beds per 100,000 residents is below the national average
in Kassala and South Darfur states.
Further revelations about disparities between the states under comparison appear when considering
the number of doctors and specialists per 100,000 residents. As revealed in Table 5.4, there are great
gaps between the number of specialists and the size of population in each of the states under
comparison. Not surprisingly, Khartoum state captures the lion’s share of specialists and doctors.
South Darfur state has the lowest number of specialists and doctors. This is the case, even though the
capital city of South Darfur (Nyala) is Sudan’s second largest city in terms of population. The great
differences between states may indicate that certain segments of Sudan’s population are face severe
shortages in healthcare access. The problem is even more shocking if we take into consideration the
negative consequences of war on health.
Table 5.4. Specialists and doctors per 100,000 residents in selected states, 2016
Total Per 100,000 population
State Doctors Dentist Specialists Doctors Dentists Specialists
Gadarif 186 5 65 9.2 0.2 3.2
Red Sea 144 14 63 10.0 1.0 4.4
Kassala 245 10 81 10.4 0.4 3.4
Khartoum 2,102 220 772 28.5 3.0 10.5
Sinnar 250 12 66 14.1 0.7 3.7
South Darfur 72 5 29 1.8 0.1 0.7
Sudan (overall) 9,175 838 1,813 23.2 1.1 4.6
Source: Annual Health Statistical Report (Sudan Federal Ministry of Health 2016)
17Sudan Working Paper 2021:01 Out of Pocket Healthcare Expenditures www.cmi.no
5.3. Healthcare expenditures by households
Households in Kassala, Gadarif, Sinnar, South Darfur, and Red Sea states have seen an increase in
their healthcare expenditures over the last decades. As Table 5.5 shows, the mean of total healthcare
expenditures in these states increased between 2009 and 2014. In fact, the average healthcare spending
by household in Sinnar and South Darfur states in 2014 was approximately four times that in 2009.
In Kassala and Gadarif states, average healthcare spending per household increased six fold, and in
Red Sea state average healthcare spending increased eleven fold. These large jumps in average
healthcare spending per household are mirrored by significant differences in the maximum amounts
spent by households in 2009 and 2014.
Table 5.5.Average household healthcare expenditures (in SDG) in selected states, 2009 and 2014
State Observations Mean Std. Dev. Minimum Maximum
Gadarif 528 60.06267 133.2655 0.00 1602.5
Kassala 528 65.30979 139.5607 0.00 2283.667
2009
Red sea 528 19.89583 48.34498 0.00 406.5
Sinnar 527 102.9442 341.1373 0.00 5245.167
South Darfur 527 56.77587 109.0155 0.00 1534.667
Gadarif 497 383.4045 564.2551 0.00 7267.803
Kassala 501 387.0145 553.6492 0.00 4653.456
2014
Red sea 689 209.4394 707.8038 0.00 11723.95
Sinnar 535 390.8156 439.4038 0.00 5191.51
South Darfur 608 251.8745 347.0284 0.00 3,745.259
Source: Annual Health Statistical Report (Sudan Federal Ministry of Health 2016)
In summary, households’ average healthcare expenditure in these five states grew significantly
between 2009 and 2014. Combined with the high urban population growth in these states, due to
immigration from rural to urban areas and war, the high OOPHE suggests a great negative livelihood
impact on households in these states.
6. Research methods
6.1. Models Specification
Based on the above reviewed literature and following the steps of Grossman (1972), Parker and Wong
(1997), and Su, Kouyaté, and Flessa (2006), the model for determinants of OOPHE incurred by
urban households in the Red Sea, Kassala, Gadarif, Sinnar and South Darfur states can be written as
follows:
!"##$%&! = (" + (# %*! + ($ !"*"+! + (% ,-.! + (& /."0! + (' !"%123.! + (( $.04! + () 5.04!
+ (* $1.04! + (* 6".04! + (+ 7ℎ2!0! + (#" #!0! + (## 9.:!;ℎ! + (#$ 9.:?! + (#& @2AB! +(#' 920B! +(#( 021;! + C! … … … … … … … … . . … . (1)
18Sudan Working Paper 2021:01 Out of Pocket Healthcare Expenditures www.cmi.no Where ln OOPHE is the natural logarithm of healthcare expenditures undertaken by an urban household during the month preceding the survey. This variable captures the demand by urban households for healthcare services and acts as a substitute for healthcare seeking behavior of the population in the studied states. %*! stands for a household’s health insurance status and takes a value of 1 if the household is insured (and 0 otherwise). !"*"+! is the natural logarithm of a household’s monthly income.,-.! is the age of the head of household./."0! indicates the gender of the head of household and takes a value of 1 if male and 0 if female.!"%123.! indicates the number of individuals in the household. $.04! takes a value of 1 if the head of household attended primary school (and 0 otherwise).5.04! takes value of 1 if the head of household attended secondary education (and 0 otherwise).$1.04! takes a value of 1 if the head of household attended post-secondary education (and 0 otherwise).6".04! takes value of 1 if the head of household attended university(and 0 otherwise). 7ℎ2!0! indicates the number of household members who are younger than 5.#!0! I ndicates the number of household members who are older than 65 members. 9.:?! takes a value of 1 if the head of household is married (and 0 otherwise).@2AB! takes a value of 1 if the head of household is divorced (and 0 otherwise).920B! takes a value of 1 if the head of household is widowed(and 0 otherwise).021;! indicates the time it takes to travel to the nearest healthcare facilities (measured in minutes), and C! is an error term that is assumed to be normally distributed. According to previous literature, enrollment in a health insurance program lowers OOPHE paid by households. Therefore, the coefficient of health insurance (%*! )is expected to carry a negative sign. In contrast, the coefficient of household income (lnInci) should be positive, increases in income permit a household to seek more and higher quality(i.e., more expensive) healthcare services. The coefficient of gender (Gendi)is expected to be positive, since male-headed households are likely to generate higher incomes than female-headed households and, thus, incur higher levels of OOPHE. The coefficient of head of household age (Agei) is expected to be positive, since older heads of household are more likely than younger heads to suffer from chronic diseases and thus to spend more on healthcare. Similarly, the coefficients of young (Childi) and older (Oldi) household members should be positive, since members of these age groups tend to be exposed to higher morbidity rates. The coefficient of household size (lnHsizei) is expected to be positive, since larger households have higher morbidity rates and greater OOPHE. The educational achievement of the head of household should have a positive impact on OOPHE. Literate heads of household are more likely to be capable of accessing high quality healthcare facilities, as well as to understand the value in doing so. Thus, the coefficients of all of the variables relating to educational level (Pedui, Sedui, Psedui, and Unedui) should be positive. 19
Sudan Working Paper 2021:01                 Out of Pocket Healthcare Expenditures               www.cmi.no

The effect of wage employment (Wempi) is expected to be negative. If the head of household is
employed, the household is more likely to have health insurance coverage and, accordingly, will spend
less on healthcare than a household with an informally or self-employed head of household that does
not have membership in a health insurance plan. The wealth variable (Wealthi) should have a positive
coefficient, since households are wealthier are likely to spend more on healthcare. The coefficient of
marital status (Mari) should be positive, since married heads are likely to spend more on healthcare.
However, the coefficients of the divorce (Divoi) and widowed (Widoi) variables cannot be determined
prior to empirical investigation. Finally, the effect of distance (disti) is expected to be positive, as a
household residing far away from hospitals and health centers pay more on transportation to reach
these centers.

The second model is designed to examine determinants of CHE incurred by urban households.
Adopting the method introduced by Berki (1986), Wyszewianski(1986), and O’Donnell et al.(2005),
CHE is defined according to three threshold levels, namely, 10%, 20%, and 30% of a household’s
total expenses on non-food items. This study follows the lead of Wagstaff and Van Doorslaer (2003)
by using household’s non-food expenses as an indicator for household’s capacity to pay. Hence, CHE
is set equal to the proportion of OOPHE to non-food expenditures, as follows:

                              ,,-./
                7%& = 010234………………………………………………….……….(2)

Here, CHE is the share of OOPHE in non-food expenditure, OOPHE is a household’s average
monthly expenditures on health, and nonfex is a household’s average monthly expenses on non-food
expenses. This model’s relationship to the determinants of CHE can be expressed as follows:

  7%&! = (" + (# %*! + ($ !"*"+! + (% ,-.! + (& /."0! + (' !"%123.! + (( $.04! + () 5.04!
                       + (* $1.04! + (* 6".04! + (+ 7ℎ2!0! + (#" #!0! + (## 9.:!;ℎ! + (#$ 9.:?! + (#& @2AB! +(#' 920B! +(#( 021;! + k! … … … … … … … … . . … . (3)

CHEi represents the dependent variable, which takes the value of 1if the household experiences CHE
(that is, its OOPHE exceeds the threshold levels) and zero otherwise, whilek! is an error term that is
assumed to be normally distributed. The other explanatory variables affecting CHE are identical to
those appearing in equation (1).

This study examines the effect of healthcare spending on the livelihoods of urban households. In this
regard, one concern is the impact of CHE on food and non-food expenditures. The model to detect
this impact is shown as follows:

                                 mBB0.n=! = ( + o7%&! +! p5! + q@! + C! (4)

20
Sudan Working Paper 2021:01 Out of Pocket Healthcare Expenditures www.cmi.no
Here,mBB0.n=! represents the average monthly food expenditures undertaken by an urban household
in the sample under consideration, CHEi is household catastrophic healthcare expenditures, and Si and
Di respectively represent socioeconomic and demographic characteristics of each household.
The model to capture the impact of CHE on average monthly non-food expenditures is formulated
by replacing an urban household’s average monthly food expenditures on the left-hand side of
equation (4) with non-food expenditures, as follows:
"B"mBB0.n=! = ( + o7%& +! p5! + q@! + C! (5)
Where "B"mBB0.n=! s represents the average monthly non-food expenditures undertaken by an
urban household in the sample under consideration. The explanatory variables affecting urban
household’s non-food expenditures are identical to those appearing in equation (4).
6.2. Data
The data for this study is sourced from two rounds of the Sudanese Baseline Households Survey
(NBHS), conducted by the Central Bureau of Statistics in 2009 and 2014. The NBHS represents the
largest survey in Sudan and represents national level as well as rural and urban strata. It contains data
on all individual, demographic, social, economic, and location characteristics of the households
surveyed. Specifically, the dataset contains information on households’ expenditures on food, non-
food items, healthcare, and other utilities. In total, the 2009 NBHS includes data from 2,638
households, while the 2014 NBHS includes data from 2,830 households in the five states that are
part of this study. Of these total households, this study focuses on urban households, that is, 948
households in 2009 and 913 households in 2014, as shown in Table 5.6 below.
State Urban households in 2009 Urban households in 2014
Gadarif 133 144
Kassala 156 156
Red Sea 384 384
Sinnar 120 120
South Darfur 144 144
Source: Sudanese Baseline Household Surveys (Sudan Central Bureau of Statistics 2009; 2014)
The survey collected data on each household’s OOPHE during the 30 days prior to being surveyed,
including spending on the services of medical doctors, medical tests, pharmaceutical products, birth
delivery, and hospital services. The data on healthcare expenditures does not include in-kind
21Sudan Working Paper 2021:01 Out of Pocket Healthcare Expenditures www.cmi.no payments, informal payments to health workers, or loss of income due to injury or illness. Tables 1 and 2 in the appendix display descriptive statistics on the variables under consideration. 6.3. Estimation methodology estimate the above models, namely, ordinary least squares (OLS) and probit. The OLS regression technique is used to estimate models on the determinants of OOPHE. For comparability purposes, equation (1) is estimated based on total data and also is estimated based on data disaggregated by whether the household is in an urban or rural area, the state where the household is located, and the gender of the head of household. The study uses the probit regression technique to estimate the model pertaining to determinants of CHE, as represented by equation (3). We adopt this technique because the dependent variable is a binary variable that takes a value of 1 if urban households report CHE and 0 otherwise. Furthermore, equation (3) is estimated using three thresholds of CHE spending: 10%, 20%, and 30%. Finally, equations (4) and (5), which convey the impoverishment impact of CHE, are estimated using OLS methods. 7. Empirical results This section starts by introducing the results on the determinants of OOPHE and CHE undertaken by total, urban, and rural households in the five Sudanese states under study. Accordingly, it reports and compares the study’s findings regarding determinants of OOPHE and CHE based on the 2009 and 2014 NBHSs. This section then presents the results on the impact of OOPHE on households’ livelihoods. 7.1. Determinants of OOPHE using 2009’s NBHS Table 7.1 reports our findings on determinants of OOPHE incurred by urban households in the selected states, using the 2009 NBHS. To allow for a comparative analysis, the table shows the data disaggregated between the urban and rural household samples, as well as the aggregated total data pool. Many of the variables’ coefficients are of acceptable magnitudes and associated with the expected signs; however, several variables lack significance even at conventional levels. For instance, the coefficient associated with the health insurance variable is negative in the urban context, but lacks statistical significance. Nonetheless, it is statistically significant when the urban and rural data is aggregated, which suggests that having health insurance reduces OOPHE and confirms a relatively large number of previous studies that find that expanding health insurance membership reduces OOPHE paid by insured households (Sepehri, Simpson, and Sarma 2006; Cavagnero et al. 2006; Johnson and Krishnaswamy 2012; Kusi et al. 2015; Habib, Perveen, and Khuwaja 2016; Okoroh et al. 2018). However, other studies have found evidence that health insurance participation boosts OOPHE incurred by the insured (Newhouse 1992; Ekman 2007;Selvaraj and Karan 2012). According to these studies, health insurance membership increases the level of medical visits and, 22
Sudan Working Paper 2021:01                   Out of Pocket Healthcare Expenditures                 www.cmi.no

accordingly, diagnosis by those who are insured. In other words, individuals who are insured are more
likely to discover they have a medical condition and will consequently pay more on medication and
consultancies that are not covered by the insurance.

Looking at household income, the coefficient in the rural setting is significant, but the coefficient in
the urban setting is not. This outcome seems to suggest that OOPHE in urban areas does not
correlate with a households’ income. Similarly, the coefficient of wealth (measured by the number of
rooms in a household) is significant in the rural setting, but not in the urban model.

Table 7.1. Estimated determinants of OOPHE, based on the 2009NBHS

 Dependent variable: logarithm of a household’s total healthcare expenditures
 Variable                                             Total                  Rural       Urban
 Insurance                                            -0.343***              -0.109      -0.127
                                                      (0.122)                (0.157)     (0.215)
 lnincome                                             0.206***               0.304***    0.00996
                                                      (0.0422)               (0.0459)    (0.100)
 lnage of householdhead                               -0.0946                -0.0906     0.512
                                                      (0.160)                (0.171)     (0.397)
 Gender                                               -0.327                 -0.331      -0.555
                                                      (0.231)                (0.265)     (0.462)
 lnhousehold size                                     0.502***               0.441***    0.501**
                                                      (0.101)                (0.113)     (0.216)
 Primary education                                    0.138                  0.336**     0.127
                                                      (0.117)                (0.144)     (0.206)
 Secondary education                                  0.294                  0.564**     0.528*
                                                      (0.196)                (0.272)     (0.299)
 Post-secondary education                             -0.178                 0.0605      -0.208
                                                      (0.851)                (0.941)     (1.815)
 University education                                 0.765**                1.009       1.193***
                                                      (0.324)                (0.632)     (0.414)
 No. of under-five children                           0.102**                0.0843*     0.123
                                                      (0.0458)               (0.0493)    (0.109)
 No. of above-65 members                              0.218**                0.112       0.422*
                                                      (0.0942)               (0.100)     (0.235)
 Wage employed                                        0.0980                 0.233**     -0.144
                                                      (0.0941)               (0.105)     (0.202)
 Wealth                                               0.0919***              0.137***    0.00948
                                                      (0.0293)               (0.0317)    (0.0684)
 Married                                              0.397                  -0.0595     0.446
                                                      (0.264)                (0.344)     (0.441)
 Divorced                                             0.0885                 -0.389      0.0845
                                                      (0.431)                (0.507)     (0.911)
 Widowed                                              -0.229                 -0.642      -0.369
                                                      (0.362)                (0.455)     (0.639)
 Distance                                             -0.0868**              -0.0149     -0.119
                                                      (0.0413)               (0.0463)    (0.0906)
 Constant                                             0.907                  0.687       -0.145
                                                      (0.628)                (0.719)     (1.406)

 Observations                                         1,919                     1,412    507
 Adj R-squared                                        0.082                     0.15     0.076
Note: ***p
You can also read