Harper Woods Apartments - Market Feasibility Analysis Columbus, Muscogee County, Georgia - Georgia Department of ...
←
→
Page content transcription
If your browser does not render page correctly, please read the page content below
Market Feasibility Analysis

Harper Woods Apartments

Columbus, Muscogee County, Georgia

Prepared for:
TBG Residential

Effective Date: April 15, 2019

Site Inspection: April 12, 2019
Harper Woods | Table of Contents

TABLE OF CONTENTS
EXECUTIVE SUMMARY........................................................................................................... V
1. INTRODUCTION .............................................................................................................. 1
A.    Overview of Subject..............................................................................................................................................1
B.    Purpose of Report.................................................................................................................................................1
C.    Format of Report ..................................................................................................................................................1
D.    Client, Intended User, and Intended Use .............................................................................................................1
E.    Applicable Requirements......................................................................................................................................1
F.    Scope of Work ......................................................................................................................................................1
G.    Report Limitations ................................................................................................................................................2
2.    PROJECT DESCRIPTION.................................................................................................... 3
A.    Project Overview ..................................................................................................................................................3
B.    Project Type and Target Market ...........................................................................................................................3
C.    Building Types and Placement..............................................................................................................................3
D.    Detailed Project Description.................................................................................................................................3
      1. Project Description.......................................................................................................................................3
      2. Other Proposed Uses ...................................................................................................................................5
      3. Proposed Timing of Development ...............................................................................................................5
3.    SITE AND NEIGHBORHOOD ANALYSIS ............................................................................. 6
A.    Site Analysis ..........................................................................................................................................................6
      1. Site Location.................................................................................................................................................6
      2. Existing Uses.................................................................................................................................................7
      3. Size, Shape, and Topography .......................................................................................................................7
      4. General Description of Land Uses Surrounding the Subject Site .................................................................8
      5. Specific Identification of Land Uses Surrounding the Subject Site...............................................................9
B.    Neighborhood Analysis.......................................................................................................................................10
      1. General Description of Neighborhood .......................................................................................................10
      2. Neighborhood Planning Activities..............................................................................................................10
      3. Public Safety...............................................................................................................................................10
C.    Site Visibility and Accessibility ............................................................................................................................11
      1. Visibility ......................................................................................................................................................11
      2. Vehicular Access (Ingress/Egress) ..............................................................................................................11
      3. Availability of Public Transit and Inter-Regional Transit ............................................................................11
      4. Accessibility Improvements under Construction and Planned ..................................................................12
      5. Environmental Concerns ............................................................................................................................12
D.    Residential Support Network..............................................................................................................................12
      1. Key Facilities and Services near the Subject Site........................................................................................12
      2. Essential Services .......................................................................................................................................13
      3. Commercial Goods and Services ................................................................................................................13
      4. Location of Low Income Housing ...............................................................................................................14
E.    Site Conclusion ...................................................................................................................................................14
4.    MARKET AREA DEFINITION ........................................................................................... 15
A.    Introduction........................................................................................................................................................15
B.    Delineation of Market Area ................................................................................................................................15
5.    ECONOMIC CONTENT ................................................................................................... 17
A.    Introduction........................................................................................................................................................17
B.    Labor Force, Resident Employment, and Unemployment..................................................................................17
      1. Trends in County Labor Force and Resident Employment .........................................................................17
      2. Trends in County Unemployment Rate......................................................................................................17
C.    Commutation Patterns .......................................................................................................................................18
D.    At-Place Employment .........................................................................................................................................18

                                                                                                                                                                   Pa g e i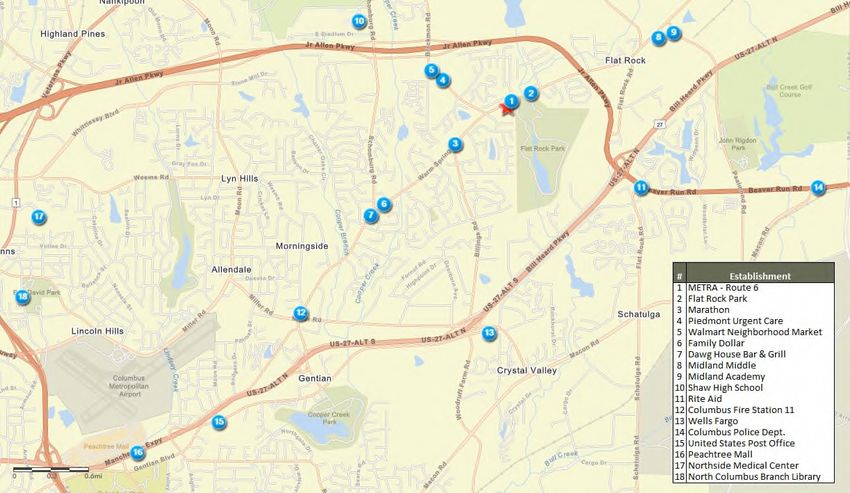
Harper Woods | Table of Contents

     1.      Trends in Total At-Place Employment........................................................................................................18
     2.      At-Place Employment by Industry Sector...................................................................................................19
     3.      Major Employers ........................................................................................................................................20
     4.      Recent Economic Expansions, Contractions, and Projections....................................................................22
     5.      Local Employment Base .............................................................................................................................22
     6.      Conclusions on Local Economics ................................................................................................................22
6.   COMMUNTIY DEMOGRAPHIC DATA.............................................................................. 23
A.   Introduction and Methodology ..........................................................................................................................23
B.   Trends in Population and Households ................................................................................................................23
     1. Recent Past Trends.....................................................................................................................................23
     2. Projected Trends ........................................................................................................................................24
     3. Building Permit Trends...............................................................................................................................24
C.   Demographic Characteristics..............................................................................................................................25
     1. Age Distribution and Household Type .......................................................................................................25
     2. Household Trends by Tenure .....................................................................................................................27
     3. Renter Household Characteristics..............................................................................................................28
     4. Income Characteristics ...............................................................................................................................29
7.   COMPETITIVE HOUSING ANALYSIS ................................................................................ 31
A.   Introduction and Sources of Information ...........................................................................................................31
B.   Overview of Market Area Housing Stock............................................................................................................31
C.   Survey of General Occupancy Rental Communities ...........................................................................................32
     1. Introduction to the Rental Housing Survey................................................................................................32
     2. Location......................................................................................................................................................32
     3. Size of Communities...................................................................................................................................33
     4. Age of Communities...................................................................................................................................33
     5. Structure Type............................................................................................................................................33
     6. Vacancy Rates ............................................................................................................................................34
     7. Rent Concessions .......................................................................................................................................34
     8. Absorption History .....................................................................................................................................34
D.   Analysis of Product Offerings .............................................................................................................................34
     1. Payment of Utility Costs.............................................................................................................................34
     2. Unit Features..............................................................................................................................................35
     3. Parking .......................................................................................................................................................35
     4. Community Amenities................................................................................................................................35
     5. Unit Distribution.........................................................................................................................................36
     6. Effective Rents ...........................................................................................................................................36
     7. DCA Average Market Rent .........................................................................................................................37
E.   Interviews ...........................................................................................................................................................38
F.   Multi-Family Pipeline..........................................................................................................................................39
G.   Housing Authority Data ......................................................................................................................................39
H.   Existing Low-Income Rental Housing..................................................................................................................39
I.   Impact of Abandoned, Vacant, or Foreclosed Homes ........................................................................................40
8.   FINDINGS AND CONCLUSIONS....................................................................................... 42
A.   Key Findings ........................................................................................................................................................42
     1. Site and Neighborhood Analysis ................................................................................................................42
     2. Economic Context ......................................................................................................................................42
     3. Population and Household Trends.............................................................................................................42
     4. Demographic Trends ..................................................................................................................................43
     5. Competitive Housing Analysis ....................................................................................................................43
B.   Affordability Analysis ..........................................................................................................................................44
     1. Methodology..............................................................................................................................................44
     2. Affordability Analysis .................................................................................................................................46
     3. Conclusions of Affordability .......................................................................................................................47

                                                                                                                                                                Pag e ii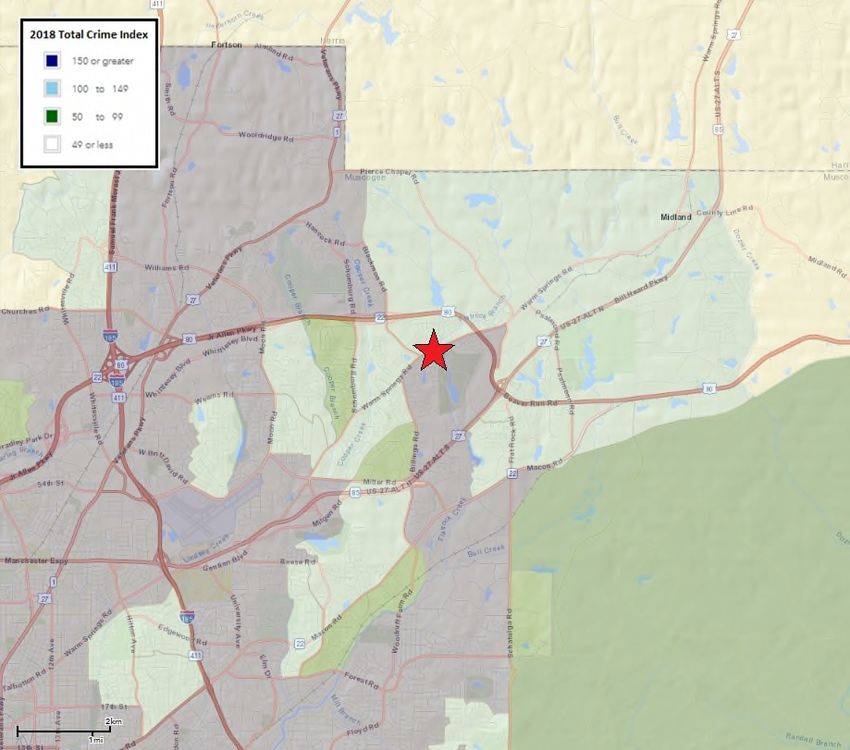
Harper Woods | Table of Contents

C.   Demand Estimates and Capture Rates ...............................................................................................................49
     1. Methodology..............................................................................................................................................49
     2. Demand Analysis ........................................................................................................................................49
D.   Product Evaluation .............................................................................................................................................50
E.   Price Position ......................................................................................................................................................51
F.   Absorption Estimate ...........................................................................................................................................53
G.   Impact on Existing Market..................................................................................................................................53
H.   Final Conclusions and Recommendations ..........................................................................................................54
9. APPENDIX 1 UNDERLYING ASSUMPTIONS AND LIMITING CONDITIONS......................... 55
10. APPENDIX 2 ANALYST CERTIFICATIONS...................................................................... 57
11. APPENDIX 3 NCHMA CERTIFICATION ......................................................................... 58
12. APPENDIX 4 ANALYST RESUMES ................................................................................ 59
13. APPENDIX 5 DCA CHECKLIST ...................................................................................... 61
14. APPENDIX 6 NCHMA CHECKLIST ................................................................................ 66
15. APPENDIX 7 RENTAL COMMUNITY PROFILES ............................................................. 69

                                                                                                                                                             Pag e ii i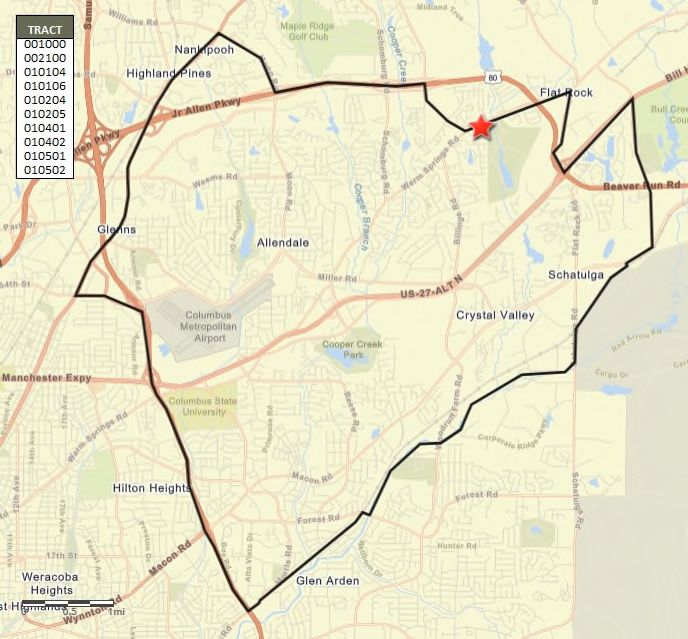
Harper Woods | Table of Contents

TABLES, FIGURES AND MAPS
Table 1 Harper Woods Detailed Project Summary .......................................................................................................4
Table 2 Key Facilities and Services..............................................................................................................................12
Table 3 Labor Force and Unemployment Rates..........................................................................................................17
Table 4 2013-2017 Commuting Patterns, Harper Woods Market Area ......................................................................18
Table 5 Major Employers ............................................................................................................................................21
Table 6 Population and Household Projections..........................................................................................................23
Table 7 Persons per Household, Harper Woods Market Area....................................................................................24
Table 8 Building Permits by Structure Type, Muscogee County.................................................................................25
Table 9 2019 Age Distribution ....................................................................................................................................26
Table 10 2010 Households by Household Type...........................................................................................................26
Table 11 Households by Tenure, 2000-2019 ...............................................................................................................27
Table 12 Households by Tenure, 2019-2021 ...............................................................................................................28
Table 13 Renter Households by Age of Householder ................................................................................................28
Table 14 2010 Renter Households by Household Size ................................................................................................29
Table 15 2019 Household Income ...............................................................................................................................29
Table 16 2019 Household Income by Tenure ..............................................................................................................30
Table 17 Renter Occupied Unit by Structure Type .....................................................................................................31
Table 18 Dwelling Units by Year Built and Tenure......................................................................................................32
Table 19 Value of Owner Occupied Housing Stock......................................................................................................32
Table 20 Rental Summary, Surveyed Communities.....................................................................................................34
Table 21 Utility Arrangement and Unit Features.......................................................................................................35
Table 22 Community Amenities ..................................................................................................................................36
Table 23 Unit Distribution, Size, and Pricing................................................................................................................37
Table 24 Average Market Rent ....................................................................................................................................38
Table 25 Average Market Rent and Rent Advantage Summary .................................................................................38
Table 26 Subsidized Communities, Harper Woods Market Area................................................................................39
Table 27 Foreclosure Rate and Recent Foreclosure Activity, ZIP Code 31909 ...........................................................41
Table 28 2021 Total and Renter Income Distribution.................................................................................................45
Table 29 2018 LIHTC Income and Rent Limits, Columbus, GA-AL MSA .....................................................................46
Table 30 Affordability Analysis, Harper Woods ..........................................................................................................48
Table 31 Substandard and Cost Burdened Calculations ............................................................................................49
Table 32 DCA Demand by Income Level ....................................................................................................................50
Table 33 DCA Demand by Floor Plan .........................................................................................................................50

Figure 1 Site Plan, Harper Woods..................................................................................................................................4
Figure 2 Views of Subject Site........................................................................................................................................7
Figure 3 Satellite Image of Subject Site .........................................................................................................................8
Figure 4 Views of Surrounding Land Uses .....................................................................................................................9
Figure 5 At-Place Employment ...................................................................................................................................19
Figure 6 Total Employment by Sector, 2018(Q3)........................................................................................................20
Figure 7 Change in Employment by Sector 2011-2018(Q3)........................................................................................20
Figure 8 Harper Woods Market Area Households by Tenure 2000 to 2019..............................................................27
Figure 9 Price Position – Harper Woods ......................................................................................................................52

Map 1 Site Location ......................................................................................................................................................6
Map 2 2018 CrimeRisk, Subject Site and Surrounding Areas .....................................................................................11
Map 3 Location of Key Facilities and Services ............................................................................................................13
Map 4 Harper Woods Market Area ............................................................................................................................16
Map 5 Major Employers ..............................................................................................................................................22
Map 6 Surveyed Rental Communities ........................................................................................................................33
Map 7 Subsidized Rental Communities ......................................................................................................................40

                                                                                                                                                             Pa g e i v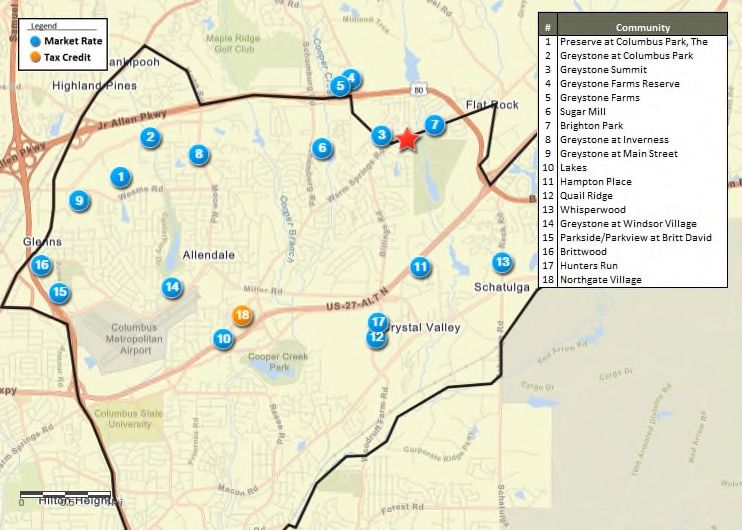
Harper Woods | Executive Summary
EXECUTIVE SUMMARY
TBG Residential has retained Real Property Research Group, Inc. (RPRG) to conduct a comprehensive
market feasibility analysis of Harper Woods, a proposed mixed-income rental community in
Columbus, Muscogee County, Georgia. As proposed, Harper Woods will be financed in part with
nine percent Low Income Housing Tax Credits (LIHTC) allocated by the Georgia Department of
Community Affairs (DCA) and will contain 96 units.
1. Project Description
Harper Woods will be located on the south side of 6000 Warm Springs Road just east of its
intersection with Blackmon Road in northeast Columbus. The newly constructed community
will comprise 96 general occupancy units, of which nearly 90 percent will be income and
rent restricted through the Low-Income Housing Tax Credit (LIHTC) program. Ten units will
be market rate.
Harper Woods’s proposed 86 general occupancy (family) LIHTC units will target very low and
low income renter households earning up to 50 and 60 percent of the Area Median Income
(AMI); 10 units will not be income or rent restricted but rather designated as market rate
units. The proposed unit mix includes one, two, and three-bedroom units, which will attract
a range of households including singles, roommates, couples, and families.
A detailed summary of the newly constructed subject property, including the rent and unit
configuration, is shown in the table below. Although Harper Woods will accept Housing
Choice Vouchers (HCV), it does not have project based rental assistance.
Unit Mix/Rents
Income Heated Sq. Net Utility Gross
Type Bed Bath #
Target Feet Rent Allowance Rent
LIHTC 1 1 50% 6 836 $406 $119 $525
LIHTC 1 1 60% 10 836 $511 $119 $630
MKT 1 1 3 836 $850 $850
Subtotal 19 19.8%
LIHTC 2 2 50% 9 1,091 $482 $148 $630
LIHTC 2 2 60% 49 1,091 $608 $148 $756
MKT 2 2 4 1,091 $950 $950
Subtotal 62 64.6%
LIHTC 3 2 50% 4 1,271 $532 $196 $728
LIHTC 3 2 60% 8 1,271 $677 $196 $873
MKT 3 2 3 1,271 $1,050 $1,050
Subtotal 15 15.6%
Total 96
Rents include: trash Source: TBG Residential
In-unit features offered at the subject property will include a stove/range, refrigerator,
dishwasher, garbage disposal, microwave, ceiling fans, washer/dryer connections, and HVAC
systems; refrigerators and dishwashers will be Energy Star. These unit features are
comparable to or superior to existing communities in the market area including LIHTC
communities.
Harper Woods’s community amenity package will include a clubhouse/community room,
laundry facilities, a fitness center, fenced community garden, and swimming pool. This
amenity package is appropriate based on the community size and price point.
Pa g e v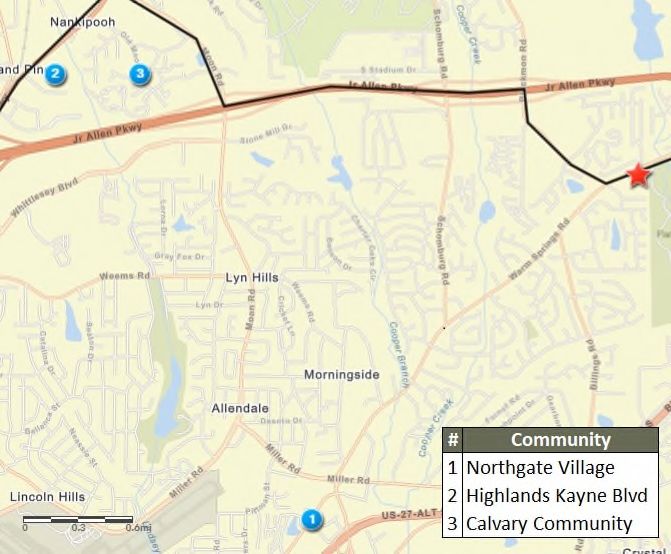
Harper Woods | Executive Summary
2. Site Description / Evaluation
The subject site, at 6000 Warm Springs Road, is a suitable location for a mixed-income rental
housing community as it is compatible with surrounding land uses and has access to amenities,
services, employers, and transportation arteries.
The site includes a vacant land and a single-family detached home with relatively flat
topography.
The site for Harper Woods is in an established residential neighborhood in northwest
Columbus. Residential uses are common in the immediate area including multi-family
apartments, single-family detached homes, and for-sale townhomes. Additional land uses
within one mile of the site include commercial uses including smaller uses just west of the
site and a larger shopping center to the northwest on Blackmon Road. Flat Rock Park is just
east of the site and Blackmon Road Middle School is to the northwest.
Neighborhood amenities and services are within one mile of the subject site including
shopping, a public bus stop, medical care, public school, and public park. Regional amenities
are two to three miles from the subject site.
The subject property will benefit from is frontage along and visibility from Warm Springs
Road. The site will be accessible via entrances Warm Springs Road; RPRG does not anticipate
any issues with site accessibility. The site is within walking distance of a public bus stop.
The positive aspects of the site are the condition of surrounding land uses and proximity to
community amenities; RPRG did not identify any negative attributes.
The subject site is suitable for the proposed development. RPRG did not identify any
negative land uses that would affect the proposed development’s viability in the
marketplace.
3. Market Area Definition
The Harper Woods Market Area consists of census tracts in northwestern Muscogee County
including the suburban areas east of Interstate 185 and south of U.S. Highway 80. This
market area includes the most comparable portions of Columbus and Muscogee County and
is the portion of the county from which more residents would originate. This market area
also includes the most comparable multi-family rental communities in the region. The
market area does not include the areas further to the west and south as these portions of
Columbus are largely built out with an older and less desirable housing stock surrounding
downtown and Fort Benning. Furthermore, the demographics of this area are not
consistent with the area immediately surrounding the subject site as they are more oriented
toward downtown with smaller households and lower incomes. The market area’s northern
boundary is just north of the subject site as the census tract immediately north extends
roughly 13 miles to the east and would inflate the size of the market area without adding
significant households.
The boundaries of the Harper Woods Market Area and their approximate distance from the
subject site are Warm Springs Road/U.S. Highway 80 to the north (0.5 mile), Psalmond
Road/Fort Benning to the east (1.8 miles), undefined line near Norris Road/Snelling Drive to
the south (3.1 miles), and the Interstate 185 to the west (4.2 miles).
4. Community Demographic Data
The Harper Woods Market Area added 2,333 people and 1,604 households from 2000 to
2010 for net growth of 5.4 percent and 9.2 percent, respectively. Annual average growth in
the market area over the decade was 233 people (0.5 percent) and 160 households (0.9
Pa g e v i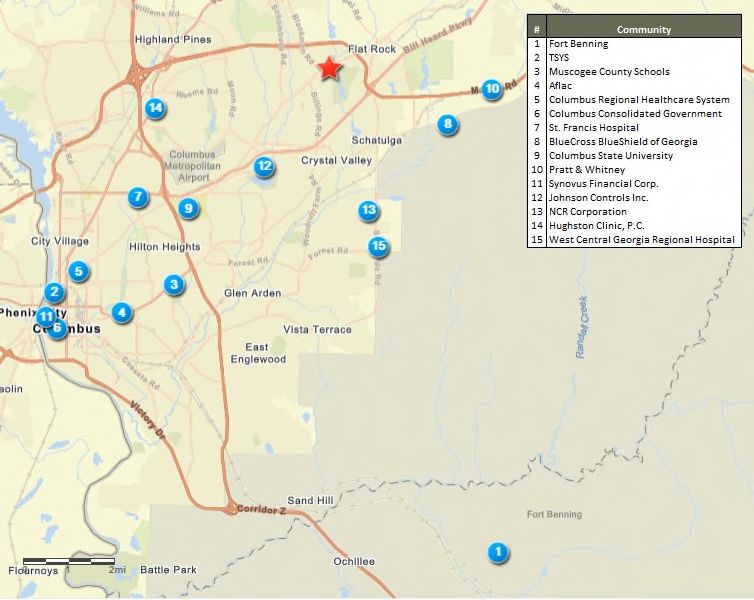
Harper Woods | Executive Summary
percent). Muscogee County’s population and households increased at similar, but slower
rates over the past decade with net growth 1.9 percent for population and 6.1 percent for
households.
Based on Esri estimates, the Harper Woods Market Area’s population and household base
remained relatively unchanged over the past two years with net growth of 121 people and
164 households. Esri projections suggest the market area will lose 290 people and 112
households over the next two years.
The county grew by 3,139 people (1.7 percent) and 1,494 households (2.0 percent) over the
past two years. Similar to the market area, Esri’s projections suggest net population and
households loss in the county at 0.4 percent loss among both.
Adults age 35-61 comprised 32.4 percent of the population in the Harper Woods Market
Area. Children/Youth under the age of 20 and Young Adults age 20-34 each account for
roughly one-quarter of the market area’s population.
Multi-person households without children were the most common household type in the
Harper Woods Market Area at 37.7 percent, followed by households with children at 32.0
percent. Muscogee County had a nearly even distribution of multi-person households with
and without children with 35 percent of each.
The Harper Woods Market Area’s renter household base has increased significantly since
2000 with net growth of 3,543 renter households or 186 renter households per year. The
market area lost nearly 1,800 owner households over the same period. Esri projects total
and renter households to decrease over the next years, which is a departure from past
trends.
Working age households (age 25 to 54 years) form the core of market area renter
households totaling 54.4 percent. Fifteen percent of the market area’s renters are under the
age of 25 and 19.0 percent are 55 or older.
Nearly two-thirds (66.3 percent) of renter households in the Harper Woods Market Area had
one or two people, slightly higher than the 61.0 percent in the county (Table 14). Single-
person households were the most common renter household size in both areas at 38.2
percent in the market area and 35.1 percent in the county. Roughly 27.6 percent of the
market area’s households had three or four people and 6.1 percent had 5+ people.
The Harper Woods Market Area’s 2019 median income of $56,754 is $9,316 or 19.6 percent
higher than Muscogee County’s median income of $45,237. RPRG estimates that the median
income of market area households by tenure is $47,597 for renters and $68,617 for owner
households. Less than a quarter (23.0 percent) of renter households earn less than $26,000
and roughly 30 percent earn $25,000 to $49,999.
5. Economic Data
Muscogee County’s economy is stable with limited net change over the past seven years, but a
significant decrease in the unemployment rate.
The most recent annual average unemployment rate of 5.0 percent in Muscogee County
roughly half of its recession-era high and within roughly a percentage point of the state and
national unemployment rate.
Muscogee County’s At-Place Employment has increased in six of the past eight years with a
net gain of 2,081 jobs since 2011; this growth follows significant losses during the recession-
era of 2007-2009.
Government, Trade-Transportation-Utilities, and Education-Health are Muscogee County’s
largest economic sectors comprising nearly half of all jobs in the county; these three
Pag e v ii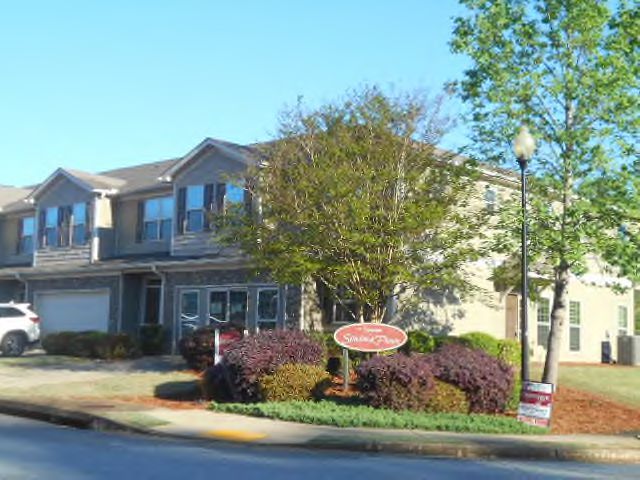
Harper Woods | Executive Summary
economic sectors comprise a similar distribution of jobs in the county (48.8 percent) and
nation (49.3 percent). Three other sectors, Leisure-Hospitality, Financial Activities, and
Professional-Business accounted for 11.7 to 12.8 percent of Muscogee County’s jobs.
Most workers residing in the market area work locally, with 83.7 percent employed in
Muscogee County and 82.9 percent commuting less than 30 minutes.
RPRG did not identify any recent economic expansions or contractions in the Columbus
region. The county’s At-Place Employment was been relatively flat over the past two years.
Foreclosures and abandoned homes are not expected to impact the demand for the subject
property or its ability to achieve and maintain stabilized occupancy.
Muscogee County’s economy has been stable since the national recession with modest net
job growth in most of the past eight years. The county’s most recent annual average
unemployment rate is roughly half of its recession-era high and the lowest level in more
than 10 years.
6. Project Specific Affordability and Demand Analysis:
Harper Woods will comprise 96 general occupancy rental units including 86 LIHTC and 10
market rate units. LIHTC income targeting includes 19 units at 50 percent AMI and 67 units
at 60 percent AMI. The unit mix includes 19 one-bedroom units, 62 two bedroom units, and
15 three bedroom units.
The LIHTC units will target renter householders earning $18,000 to $36,300. The 86
proposed LIHTC units would need to capture 4.4 percent of the 1,974 income qualified
renter households to lease-up. The market rate units will target renter householders earning
$33,223 to $60,500. The 10 proposed units would need to capture 0.3 percent of the 2,915
income qualified renter households to lease-up. The overall capture rate is 2.1 percent.
Based on DCA methodology, total net demand for all 96 proposed units in the Harper
Woods Market Area results in an overall capture rate of 5.3 percent. Capture rates by
income level are 3.6 percent for 50 percent units, 10.9 percent for 60 percent units, and 0.8
percent for market rate units. Harper Woods’s capture rates by floor plan for all AMI levels
range from 0.5 percent to 29.3 percent, which have been adjusted include only large
households for three-bedroom units.
The capture rates for Harper Woods are within DCA’s range of acceptability and indicate
sufficient demand to support the proposed development.
7. Competitive Rental Analysis
RPRG surveyed 18 multi-family rental communities in the Harper Woods Market Area including the
only LIHTC community in the market area. At the time of our survey, the rental market was
performing well with low vacancy rates.
The surveyed communities range from 110 to 1,008 units and average 258 units. Ten
communities range from 154 to 224 units; only four have more than 224 units. The
LIHTC community has 151 units and is among the smaller communities in the market
area
The 18 surveyed communities combine to offer 4,645 units of which 132 units or 2.8
percent were reported vacant. One community is currently undergoing renovations with
35 vacancies among 224 units for a 15.6 percent vacancy rate. The aggregate vacancy
rate among stabilized communities is a low 2.2 percent, reflecting only 97 of 4,421 units
vacant. Thirteen of the 17 stabilized communities reported vacancy rates below 3.0
Pag e v ii i
Harper Woods | Executive Summary
percent including the lone LIHTC community, which was 100 percent occupied. Only
two stabilized communities reported vacancy rates above 4.1 percent; both were still
stable with vacancy rates of roughly 6.0 percent.
The newest community in the market area was placed in service in 2010; absorption
data is neither available nor relevant.
Among the 18 surveyed communities, net rents, unit sizes, and rents per square foot
were as follows:
o One-bedroom effective rents range from $465 to $935 and average $768 per
month. The average one-bedroom unit size is 905 square feet, resulting in a net
rent per square foot of $0.85.
o Two-bedroom effective rents range from $545 to $1,313 and average $894 per
month. The average two-bedroom unit size is 1,242 square feet, resulting in a
net rent per square foot of $0.72.
o Three-bedroom effective rents range from $620 to $1,529 and average $1,085
per month. The average three-bedroom unit size is 1,467 square feet, resulting
in a net rent per square foot of $0.75.
The only LIHTC community in the market area (Northgate Village) offers all 60 percent
units, which are priced at the bottom of multi-family market. The effective LIHTC rents
at this community are more than $100 below the lowest priced market rate community
for one, two, and three bedroom units.
The “average market rent” is $786 for one-bedroom units, $915 for two-bedroom units,
and $1,118 for three-bedroom units. All proposed LIHTC rents are well below the
average market rate with a minimum rent advantage of 50.5 percent; the weighted
average market advantage for LIHTC units is 62.1 percent. Market rate rents for one and
two bedroom units are 7.6 percent and 3.7 percent higher than the average market
rent, but well below the highest priced units in the market area. Three bedroom market
rate rents are 6.5 percent below the average market rent. As they are not adjusted rents
and include older communities, market rate rents at the subject property are not
expected to be significantly lower than the overall market average.
The only identified comparable pipeline community in the market area is Highlands
Kayne Boulevard, which received a nine percent allocation in 2018. This general
occupancy community will include 80 units including one, two, and three bedroom units
at 50 percent, 60 percent, and market rate. The units at this community are subtracted
from the demand estimate for Harper Woods.
8. Absorption/Stabilization Estimate
Based on the product to be constructed and the factors discussed through the report, we
expect Harper Woods to lease-up at a rate of 16 units per month. At this rate, the subject
property will reach a stabilized occupancy of at least 93 percent within approximately six
months. The proposed 50 percent units are expected to lease faster than the 60 percent and
market rate units and expected to be leased within four months or an average monthly
absorption of five units. The 60 percent and market rate units are expected to be leased
within 6 months or monthly rates of 11 units and 2 units, respectively. The overall
absorption period and pace is a weighted average of all units.
Overall, the Harper Woods Market Area’s rental market is performing well with a stabilized
aggregate vacancy rate of 2.2 percent; the market area’s limited supply of LIHTC units is 100
percent occupied. We do not believe that the construction of the 96 units at Harper Woods
will have a negative impact on existing communities (market rate or LIHTC) in the market
area.
Pag e ixHarper Woods | Executive Summary
9. Overall Conclusion / Recommendation
Based on household growth, low affordability and demand capture rates, and strong rental market
conditions, sufficient demand exists to support the proposed mixed income units at Harper Woods.
As such, RPRG believes that the proposed Harper Woods will be able to successfully reach and
maintain a stabilized occupancy of at least 93 percent following its entrance into the rental market.
The subject property will be competitively positioned with the existing market rate and LIHTC
communities in the Harper Woods Market Area and the units will be well received by the target
market. We recommend proceeding with the project as planned.
We do not believe that the proposed development of Harper Woods will have a negative impact on
the existing LIHTC or market rate communities in the market area.
Renter Income Total Net Large HH Capture Average Market Market Proposed
Income/Unit Size Income Limits Units Supply Large HH Absorption
Qualification % Demand Demand Demand Rate Rent Rents Band Rents
50% AMI $18,000 - $30,250
One Bedroom Units $18,000-$22,400 6 4.9% 197 2 195 3.1% 4 Months $786 $574-$935 $406
Two Bedroom Units $21,600-$25,200 9 4.0% 161 8 153 5.9% 4 Months $786 $674-$1,313 $482
Three Bedroom Units $24,960-$30,250 4 6.0% 238 6 232 33.7% 78 5.1% 4 Months $786 $905-$1,529 $532
60% AMI $21,600 - $36,300
One Bedroom Units $21,600-$36,880 10 5.9% 237 6 231 4.3% 6 Months $915 $574-$935 $511
Two Bedroom Units $25,920-$30,240 49 4.9% 194 27 167 29.3% 6 Months $915 $674-$1,313 $608
Three Bedroom Units $29,931-$36,300 8 7.3% 291 15 276 33.7% 93 8.6% 6 Months $915 $905-$1,529 $677
Market Rate $33,223 - $60,500
One Bedroom Units $33,051-$44,800 3 13.9% 553 2 551 0.5% 2 Months $1,118 $574-$935 $850
Two Bedroom Units $37,440-$50,400 4 15.4% 613 7 606 0.7% 2 Months $1,118 $674-$1,313 $950
Three Bedroom Units $42,480-$60,500 3 19.3% 767 7 760 33.7% 256 1.2% 2 Months $1,118 $905-$1,529 $1,050
Project Total $18,000 - $60,500
50% AMI $18,000 - $30,250 19 13.8% 550 16 534 3.6% 4 Months
60% AMI $21,600 - $36,300 67 16.7% 665 48 617 10.9% 6 Months
LIHTC Units $18,000 - $36,300 86 20.7% 826 64 762 11.3% 6 Months
Market Rate $33,223 - $60,500 10 30.6% 1,220 16 1,204 0.8% 2 Months
Total Units $18,000 - $60,500 96 47.8% 1,903 80 1,823 5.3% 6 Months
Pa g e xHarper Woods | Executive Summary
10. DCA Summary Table:
SUMMARY TABLE:
Development Name: Harper Woods Total # Units: 96
Location: 6000 Warm Springs Road, Columbus, Muscogee County, 31909 # LIHTC Units: 86
N – U.S. Highway 80; E – Psalmond Road/Fort Benning; S – Undefined (Norris Road/Snelling
PMA Boundary: Drive); W – Interstate 185
Farthest Boundary Distance to Subject: 4.2 miles
RENTAL HOUSING STOCK (found on page 33, 37)
Type # Properties Total Units Vacant Units Average
Occupancy
All Rental Housing 18 4,645 132 97.2%
Market-Rate Housing 17 4,494 132 97.1%
Assisted/Subsidized Housing not to %
include LIHTC
LIHTC 1 151 0 100%
Stabilized Comps 17 4,421 97 97.8%
Properties in construction & lease up 1 80 80 0.0%
Subject Development Average Market Rent Highest Unadjusted
Comp Rent
# # # Size Proposed Per Per Advantage Per Unit Per SF
Units Beds Baths (SF) Rent Unit SF
6 1 1 836 $406 $786 $0.86 93.5% $935 $1.10
10 1 1 836 $511 $786 $0.86 53.7% $935 $1.10
3 1 1 836 $850 $786 $0.86 -7.6% $935 $1.10
9 2 2 1,091 $482 $915 $0.72 89.8% $1,313 $0.91
49 2 2 1,091 $608 $915 $0.72 50.5% $1,313 $0.91
4 2 2 1,091 $950 $915 $0.72 -3.7% $1,313 $0.91
4 3 2 1,271 $532 $1,118 $0.74 110.2% $1,529 $0.87
8 3 2 1,271 $677 $1,118 $0.74 65.2% $1,529 $0.87
3 3 2 1,271 $1,050 $1,118 $0.74 6.5% $1,529 $0.87
CAPTURE RATES (found on page 50)
Market-
Targeted Population 50% 60% LIHTC Other:__ Overall
rate
Capture Rate 3.6% 10.9% 11.3% 0.8% 5.3%
Pag e xiHarper Woods | Introduction
1. INTRODUCTION
A. Overview of Subject
The subject of this report is Harper Woods, a proposed mixed-income multi-family rental
community in Columbus, Muscogee County, Georgia. Harper Woods will be newly constructed and
financed in part with Low Income Housing Tax Credits (LIHTC) allocated by the Georgia Department
of Community Affairs (DCA). Harper Woods will comprise 96 rental units including 86 income
restricted units and 10 market rate units. Income restricted units will include 19 units reserved for
households earning up to 50 percent of the Area Median Income (AMI) and 67 units will be reserved
for households earning up to 60 percent of the AMI, adjusted for household size.
B. Purpose of Report
The purpose of this market study is to perform a market feasibility analysis through an examination
of the economic context, a demographic analysis of the defined market area, a competitive housing
analysis, a derivation of demand, and an affordability analysis.
C. Format of Report
The report format is comprehensive and conforms to DCA’s 2019 Market Study Manual. The market
study also considered the National Council of Housing Market Analysts’ (NCHMA) recommended
Model Content Standards and Market Study Index.
D. Client, Intended User, and Intended Use
The Client is TBG Residential (developer). Along with the Client, the Intended Users are DCA,
potential lenders, and investors.
E. Applicable Requirements
This market study is intended to conform to the requirements of the following:
DCA’s 2019 Market Study Manual.
The National Council of Housing Market Analyst’s (NCHMA) Model Content Standards and
Market Study Index.
F. Scope of Work
To determine the appropriate scope of work for the assignment, we considered the intended use of
the market study, the needs of the user, the complexity of the property, and other pertinent factors.
Our concluded scope of work is described below:
Please refer to Appendix 5 and 6 for a detailed list of DCA and NCHMA requirements as well
as the corresponding pages of requirements within the report.
Tad Scepaniak (Managing Principal) conducted field research including a site visit on April
12, 2019.
Primary information gathered through field and phone interviews was used throughout the
various sections of this report. The interviewees included rental community property
managers and planning officials from the Columbus Planning Department (Rex Wilkinson).
Pag e 1Harper Woods | Introduction
All pertinent information obtained was incorporated in the appropriate section(s) of this
report.
G. Report Limitations
The conclusions reached in a market assessment are inherently subjective and should not be relied
upon as a determinative predictor of results that will occur in the marketplace. There can be no
assurance that the estimates made, or assumptions employed in preparing this report will in fact be
realized or that other methods or assumptions might not be appropriate. The conclusions expressed
in this report are as of the date of this report, and an analysis conducted as of another date may
require different conclusions. The actual results achieved will depend on a variety of factors,
including the performance of management, the impact of changes in general and local economic
conditions, and the absence of material changes in the regulatory or competitive environment.
Reference is made to the statement of Underlying Assumptions and Limiting Conditions contained in
Appendix I of this report.
Pag e 2Harper Woods | Project Description
2. PROJECT DESCRIPTION
A. Project Overview
Harper Woods will be located on the south side of Warm Springs Road just east of Blackmon Road
and west of Flat Rock Park in northeast Columbus, Muscogee County, Georgia. The site is less than
one-half mile south and west of U.S. Highway 80, which forms a perimeter along the northeast
portion of Columbus. The newly constructed community will comprise 96 mixed-income units,
including 86 income and rent restricted units through the Low-Income Housing Tax Credit (LIHTC)
program and 10 market rate units.
B. Project Type and Target Market
Harper Woods’s proposed general occupancy (family) LIHTC units will target very low to low income
renter households. Roughly 90 percent (86 units) will be income restricted, with 19 units targeting
households earning up to 50 percent of the Area Median Income (AMI) and 67 units targeting
households earning up to 60 percent AMI; 10 units will be market rate without rent or income
restrictions. The proposed unit mix includes one, two, and three-bedroom units, which will attract a
range of households including singles, roommates, couples, and families.
C. Building Types and Placement
Harper Woods’ residential units will be contained within six garden buildings with three stories and
brick and HardiPlank siding exteriors. The buildings will be positioned throughout the site along
community access road with adjacent surface parking (Figure 1). The community building/leasing
office will be in the approximate center of the site.
D. Detailed Project Description
1. Project Description
Harper Woods will offer 19 one-bedroom units (19.8 percent), 62 two-bedroom units (64.6
percent), and 15 three-bedroom units (15.6 percent).
Proposed unit sizes are 836 square feet for one-bedroom units, 1,091 square feet for two-
bedroom units, and 1,271 square feet for three-bedroom units (Table 1).
One-bedroom units will have one bathroom; two and three-bedroom units will have two
bathrooms.
All rents will include the cost of trash removal. Tenants will bear the cost of all other
utilities. All appliances and the heating/cooling for each unit will be electric.
Pag e 3Harper Woods | Project Description
Figure 1 Site Plan, Harper Woods
Source: TBG Residential
Table 1 Harper Woods Detailed Project Summary
Income Heated Sq. Net Utility Gross
Type Bed Bath #
Target Feet Rent Allowance Rent
LIHTC 1 1 50% 6 836 $406 $119 $525
LIHTC 1 1 60% 10 836 $511 $119 $630
MKT 1 1 3 836 $850 $850
Subtotal 19 19.8%
LIHTC 2 2 50% 9 1,091 $482 $148 $630
LIHTC 2 2 60% 49 1,091 $608 $148 $756
MKT 2 2 4 1,091 $950 $950
Subtotal 62 64.6%
LIHTC 3 2 50% 4 1,271 $532 $196 $728
LIHTC 3 2 60% 8 1,271 $677 $196 $873
MKT 3 2 3 1,271 $1,050 $1,050
Subtotal 15 15.6%
Total 96
Rents include: trash Source: TBG Residential
Pag e 4Harper Woods | Project Description
The following unit features and community amenities are planned:
Unit Features Community Amenities
Kitchens with a range, refrigerator, dishwasher, Clubhouse/community room
stove, garbage disposal, and microwave Laundry facilities
Washer/dryer connections Fitness center
Ceiling fans Fenced community garden
Patio/balcony Swimming pool
Central heat and air-conditioning
Window blinds
2. Other Proposed Uses
None.
3. Proposed Timing of Development
Harper Woods is expected to begin construction in September 2020 and will have first move-ins
completed in 2021. For the purposes of this report, the placed in service date is 2021.
Pag e 5Harper Woods | Site and Neighborhood Analysis
3. SITE AND NEIGHBORHOOD ANALYSIS
A. Site Analysis
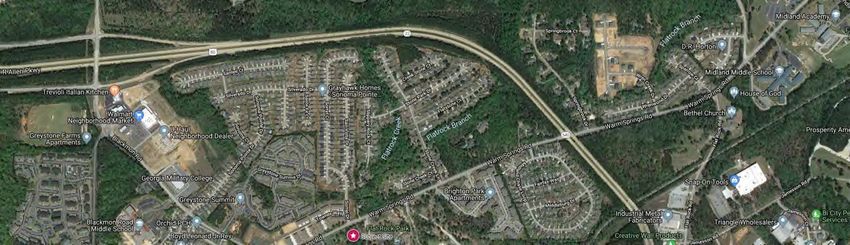
1. Site Location
The subject site is on the south side of 6000 Warm Springs Road, a residential street in northeast
Columbus near U.S. Highway 80, which is the area’s primary thoroughfare. Both U.S. Highways 27
and 80 are accessible within a mile of the subject property, providing access through the region
(Map 1). Surrounding land uses include a balance of residential and commercial uses.
Map 1 Site Location
Pag e 6Harper Woods | Site and Neighborhood Analysis
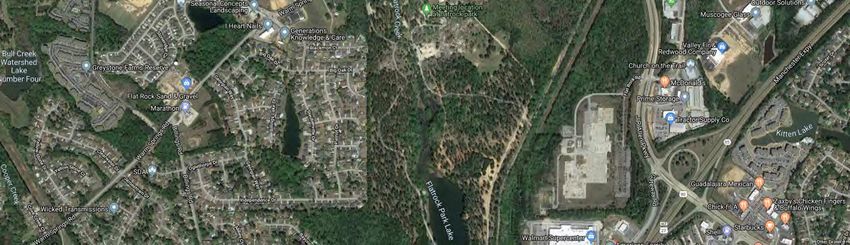
2. Existing Uses
The subject site is a vacant parcel (Figure 2).
3. Size, Shape, and Topography
The site comprises approximately 5.65
acres, is flat, and generally rectangular.
Figure 2 Views of Subject Site
Warm Springs Road facing west, site on left.
Site facing west.
Eastern edge of site, facing southeast.
Site facing southwest.
Pag e 7Harper Woods | Site and Neighborhood Analysis
4. General Description of Land Uses Surrounding the Subject Site
The site for Harper Woods is in an established residential neighborhood in northwest Columbus.
Residential uses are common in the immediate area including multi-family apartments, single-family
detached homes, and for-sale townhomes. Additional land uses within one mile of the site include
commercial uses including smaller uses just west of the site and a larger shopping center to the
northwest on Blackmon Road. Flat Rock Park is just east of the site and Blackmon Road Middle
School is to the northwest.
Figure 3 Satellite Image of Subject Site
Pag e 8You can also read