Place Matters for HealtH in cook county
←
→
Page content transcription
If your browser does not render page correctly, please read the page content below
Place Matters for Health
in Cook County:
Ensuring Opportunities for Good Health for All
A Report on Health Inequities in Cook County, Illinois

Prepared by the
Joint Center for Political and Economic Studies Health Policy Institute
and the Cook County, Il, Place Matters Team

In Conjunction With the
Center on Human Needs, Virginia Commonwealth University
Virginia Network for Geospatial Health Research

Joint Center for Political and Economic Studies
July 2012
The contents of this report reflect the views of the authors and do not necessarily reflect the views of the Joint Center for Political
and Economic Studies or its Board of Governors, the Center on Human Needs at the Virginia Commonwealth University, and the
Virginia Network for Geospatial Health Research.

Opinions expressed in Joint Center publications are those of the authors and do not necessarily reflect the views of the staff, officers
or governors of the Joint Center for Political and Economic Studies or the organizations that support the Joint Center and its
research.

This research was supported by Award Number 1RC2MD004795-01 from the National Institute on Minority Health And
Health Disparities. The content is solely the responsibility of the authors and does not necessarily represent the official views of the
National Center on Minority Health And Health Disparities or the National Institutes of Health.

The Joint Center for Political and Economic Studies, Place Matters and the Cook County, IL, Place Matters Team are
supported by a generous grant from the W.K. Kellogg Foundation.

Joint Center for Political and Economic Studies, Washington, DC 20005
www.jointcenter.org
© 2012
All rights reserved. Published 2012.
Printed in the United States.
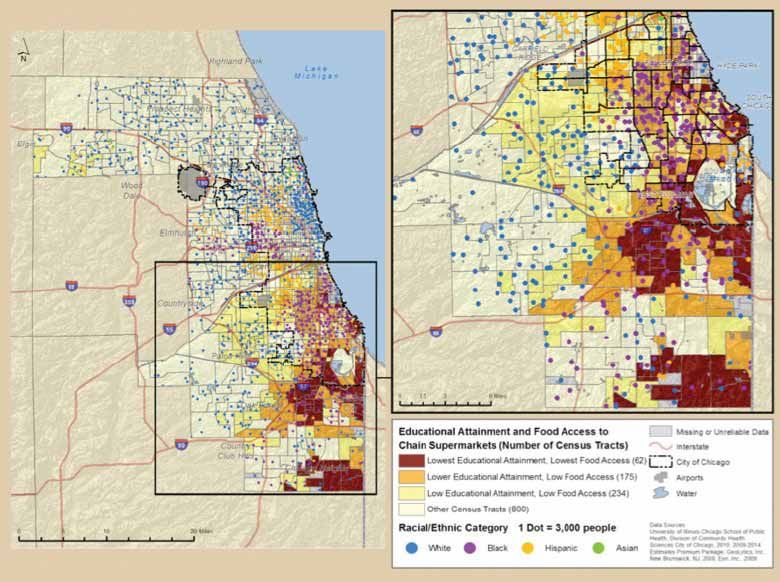
Table of Contents

Preface.......................................................................................................................................................................................................................... 1

Executive Summary................................................................................................................................................................................................... 2

Introduction................................................................................................................................................................................................................ 4

I. Background: Population, Community Characteristics, and Health in Cook County........................................................................... 8

II. Neighborhood Characteristics, Food Access, and Health Outcomes....................................................................................................... 17

III. Conclusions and Recommendations.............................................................................................................................................................. 29

Place Matters for Health in Cook County: Ensuring Opportunities for Good Health for All                                                                                                                                               c
d Joint Center for Political and Economic Studies
Foreword
Place matters for health in important ways, according to a growing body of research. Differences in neighborhood conditions
powerfully predict who is healthy, who is sick, and who lives longer. And because of patterns of residential segregation, these
differences are the fundamental causes of health inequities among different racial, ethnic, and socioeconomic groups.

The Joint Center for Political and Economic Studies and Cook County, IL, Place Matters team are very pleased to add to the
existing knowledge base with this report, “Place Matters for Health in Cook County: Ensuring Opportunities for Good Health for
All.” The report, supported by a grant from the National Institute on Minority Health and Health Disparities (NIMHD) of the
National Institutes of Health, provides a comprehensive analysis of the range of social, economic, and environmental conditions in
Cook County and documents their relationship to the health status of the county’s residents.

The study finds that social, economic, and environmental conditions in low-income and non-white neighborhoods make it more
difficult for people in these neighborhoods to live healthy lives.

The overall pattern in this report – and those of others that the Joint Center has conducted with other Place Matters
communities – suggests that we need to tackle the structures and systems that create and perpetuate inequality to fully close racial
and ethnic health gaps. Accordingly, because the Joint Center seeks not only to document these inequities, we are committed to
helping remedy them.

Through our Place Matters initiative, which is generously supported by the W.K. Kellogg Foundation, we are working with
leaders in 24 communities around the country to identify and address social, economic, and environmental conditions that shape
health. We look forward to continuing to work with leaders in Cook County and other communities to ensure that every child,
regardless of their race, ethnicity, or place of residence, can enjoy the opportunity to live a healthy, safe, and productive life.

Ralph B. Everett
President and CEO
Joint Center for Political and Economic Studies

Place Matters for Health in Cook County: Ensuring Opportunities for Good Health for All                                                e
f Joint Center for Political and Economic Studies
Preface
Chicago and the surrounding suburbs have historically been
                                                                      Previous Chicago-area studies and reports on
segregated by race and class.1 This fact has not changed over
                                                                      food justice
time, despite the often heroic efforts of organizers and activists,
from the well-known to the unsung. For the past two decades
the Chicago metropolitan area has been one of the worst in the        1.   “Finding Food in Chicago and the Suburbs: The Report of
United States in terms of disparate neighborhood conditions                the Northeastern Illinois Food Security Assessment, Report to
for blacks and Latinos compared to whites.2 Racial residential             the Public,” by Daniel Block, Noel Chávez, and Judy Birgen
                                                                           (2008).
segregation concentrates poverty along racial lines. According
                                                                      2.   “A Comparison of the Availability and Affordability of a
to a recent report (using 2000 data), “Black families, even                Market Basket in Two Communities in the Chicago Area,
those with a higher income, tend to live in high-poverty                   “by Daniel Block and Joanne Kouba (2005).
neighborhoods, while white families with lower incomes are            3.   “Food Deserts in Chicago: A Report of the Illinois Advisory
more likely to live in higher income neighborhoods. [While]                Committee to the United States Commission on Civil Rights”
nearly 75% of poor white children live in neighborhoods in                 (2011).
which the poverty level is ≤10%,” less than 5% of poor black          4.   “Food Sovereignty, Urban Food Access, and Food Activism:
children live in low-poverty neighborhoods.3 This exposure                 Contemplating the Connections Through Examples From
to neighborhood poverty is similar for Hispanic children.                  Chicago,” by Daniel R. Block, Noel Chávez, Erika Allen,
                                                                           and Dinah Ramirez (2011).
According to the Institute of Medicine, this segregation is a
national pattern: “Black and Hispanic children consistently live      5.   “Food Access in Suburban Cook County,” prepared by
                                                                           the Chicago State University Community Assistance Center
in neighborhoods with much higher poverty rates than white                 (2011).
children.”4                                                           6.   “Examining the Impact of Food Deserts on Public Health
                                                                           in Chicago,” by Mari Gallagher Research and Consulting
Metropolitan Chicago is a regional center of organizations and             Group (2006).
individuals active in a multifaceted and vibrant food movement        7.   “Food Insufficiency in Urban Latino Families,” by Noel
designed to combat one of the negative consequences of                     Chávez, Sharon Telleen, and Young Ok Rhee Kim (2007).
concentrated poverty: inadequate access to healthy foods and          8.   “Community Food Insecurity Data,” by the Greater Chicago
the resultant detrimental impact on health outcomes. In the                Food Depository (2011).
Chicago area, there is a debate about the definition of goals         9.   “Behind the Kitchen Door: The Hidden Costs of Taking the
for this movement and how to best achieve them. The Cook                   Low Road in Chicagoland’s Thriving Restaurant Industry.”
County Place Matters Team and Steering Committee has                       Restaurant Opportunity Centers United and Chicagoland
identified some values to serve as guideposts: racial equity,              Restaurant Industry Coalition (2010)
social justice, and empowerment of voices usually not heard           10. “Family Food Access Report: When We Have Better, We
in the policy-making process. Cook County Place Matters’                  Can Do Better,” by Angela Odoms-Young and others.
focus is on access to food and food justice. However, it also         11. “’You Have to Hunt for the Fruits, the Vegetables’:
                                                                          Environmental Barriers and Adaptive Strategies to Acquire
recognizes the importance to health equity of transportation,
                                                                          Food in a Low-Income African American Neighborhood,”
housing, employment, education, health care, and meaningful               by Shannon Zenk and others (2011).
participation of Cook County residents in the democratic
process. Together, these are the resources necessary for good
health—resources that are distributed unequally in metro
Chicago. This unfair geographic distribution is why Place
Matters.
The Cook County Place Matters team recognizes that
much work and many contributions have preceded this report.
A selection of other resources is listed in the accompanying box.
Cook County Place Matters is grateful for the valuable
contributions to its thinking made by the other 15 Place
Matters teams around the United States. Together, we have
created a learning community committed to taking action on
the social determinants of health.

Place Matters for Health in Cook County: Ensuring Opportunities for Good Health for All                                                    1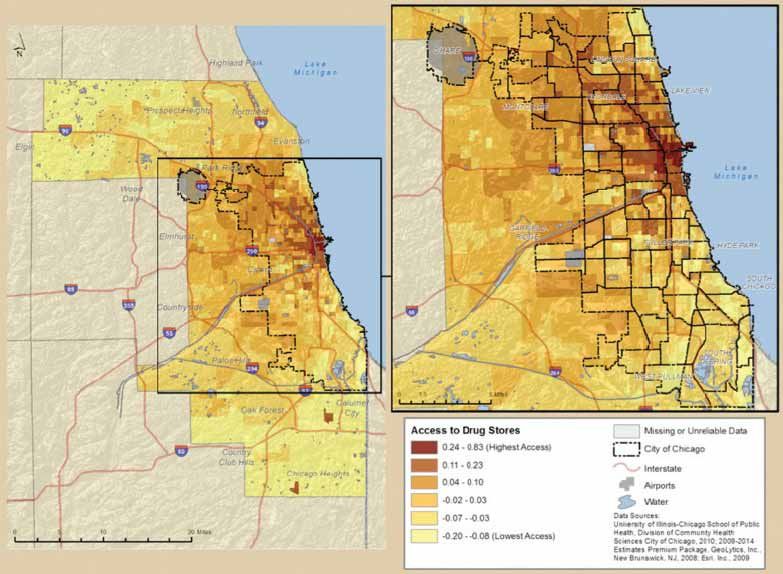
Executive Summary                                                               almost 14 years longer than that of people living in
                                                                                areas with a median income below $25,000 per year.
Place matters for health in important ways. Research                       •    Most of the census tracts with low educational
demonstrates that neighborhood conditions—the quality of                        attainment and low food access are located in the
public schools, housing conditions, access to medical care and                  southern portion of Cook County, which has a high
healthy foods, levels of violence, availability of exercise options,            concentration of minority communities.
exposure to environmental degradation—powerfully predict
who is healthy, who is sick, and who lives longer. And because             •    Residents in the quintile with the least access to chain
of patterns of residential segregation, these differences are                   supermarkets and large independent grocers have an
the fundamental causes of health inequities among different                     average life expectancy that is approximately 11 years
racial, ethnic, and socioeconomic groups. This study examines                   shorter than residents in the quintile with the highest
the relationships between health, community characteristics,                    access to such food providers.
and food access in Cook County, IL, and attempts to address
specific questions raised by the Cook County Place Matters             The overall pattern suggests that socioeconomic conditions
Team:                                                                  in neighborhoods of concentrated poverty, which are
                                                                       predominantly African American and Latino, make it more
     •   What is the relationship between community-level              difficult for people in these communities to live healthy lives. It
         measurements of socioeconomic status—that is,                 is unacceptable in the world’s wealthiest society that a person’s
         wealth, income, and/or education—and access to                life can be cut short by more than a decade simply because
         healthy food?                                                 of where one lives and factors over which he or she has no
                                                                       control. Clearly, there is a strong moral imperative to enact
     •   What is the relationship between access to nutritious         policies to redress the inequities of the past, as well as current
         food and the amount spent for nutritious food?                inequities, in ways that will improve health for all. But, there
     •   What is the relationship between access to different          also is a powerful economic incentive. A study released by the
         types of food providers and health outcomes?                  Joint Center for Political and Economic Studies in 2009 found
                                                                       that direct medical costs associated with health inequities
The study drew the following conclusions:                              among African Americans, Hispanics, and Asian Americans
                                                                       approached $230 billion between 2003 and 2006. When
     •   Between 2005 and 2009, the Index of Dissimilarity             indirect costs, such as lowered productivity and lost tax revenue
         for Cook County between the black and white                   resulting from illness and premature death, were included, the
         populations was 80.8% at the census tract level.5 The         total cost of health inequities exceeded $1.24 trillion.7 Thus,
         higher the index, the more segregated the area. The           for both moral and economic reasons, we must address health
         Index of Dissimilarity between white and Hispanic             inequities and their root causes now.
         populations in Cook County was 60.2%,6 which is
         similar to the state index.                                   Recommendations
     •   Cook County is segregated by race and class, as               In “Closing the Gap in a Generation: Health Equity Through
         shown in Maps 2 and 3, while pockets of poverty exist         Action on the Social Determinants of Health,” issued in 2008,
         throughout the county.                                        the World Health Organization called for three changes to
                                                                       eliminate health inequities. These changes serve as a framework
     •   Educational opportunities and attainment are stratified       for the following specific policy recommendations, some of
         by race and ethnicity.                                        which may be outside the scope of this report, which focuses on
                                                                       access to food and food justice. However, the Place Matters
     •   More than a quarter of Cook County census tracts
                                                                       Team hopes that these recommendations will help to guide
         experience persistent poverty, meaning that at least
                                                                       champions of health equity in metropolitan Chicago as they
         20% of households have been in poverty for two
                                                                       seek to influence change at the applicable level of government—
         decades; 162 census tracts have had at least 20% of
                                                                       municipal, county, state, and federal.
         residents in poverty for five decades.
                                                                           1. Implement the World Health Organization
     •   In Cook County in 2007 the premature death rate
                                                                              recommendations
         for black residents was 445.9 per 100,000 persons;
         for white residents the rate was 179.5; for Hispanic                       a.   Improve daily conditions.
         residents it was 141.3.                                                    b. Tackle the inequitable distribution of power,
                                                                                       money, and resources.
     •   People living in areas with a median income greater
         than $53,000 per year had a life expectancy that was

 2                                                                                  Joint Center for Political and Economic Studies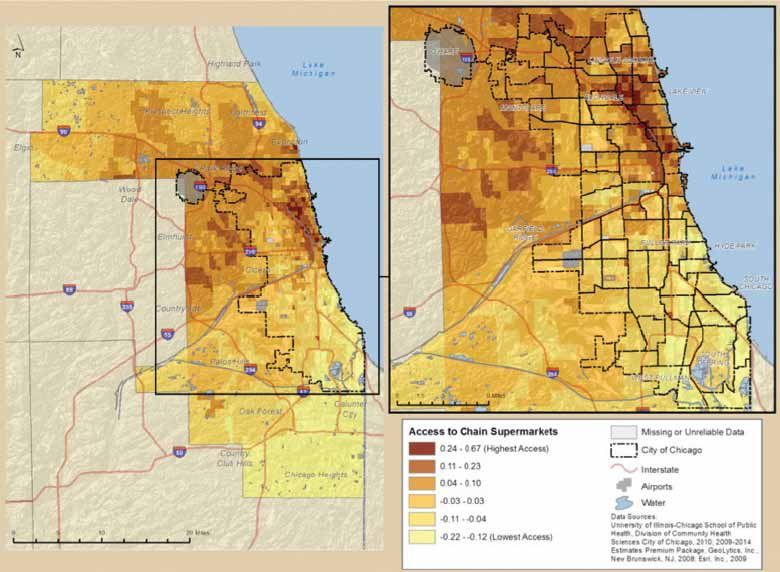
c.   Measure and understand the problem and                             ii. Assist in the improvement in
                assess the impact of action.                                           diversity, quality, and affordability
                                                                                       of the food products that smaller
   2. Track health inequities                                                          providers sell.
           a.   Health departments and other agencies should              e.   Support food sovereignty. The voices and
                monitor health inequities and make the data                    aspirations of neighborhood residents need to
                available to the public. Health departments                    be reflected in solutions to hunger and poor
                need to have funding adequate to the task                      nutrition. Too often policy decisions are made
                of collecting, analyzing, and presenting data                  without the meaningful participation of the
                related to inequities. Health departments                      people affected by the problem. Efforts to
                need infrastructure and capacity sufficient to                 organize and inform residents are necessary
                draft and implement actions to address health                  so that they have the tools to make informed
                inequities. Local health departments should                    decisions about food system failures. Examples
                have sufficient capacity to conduct Health                     of concerns include working conditions, pay
                Impact Assessments.                                            and career advancement, accountability, and
           b. Race/ethnicity/class/gender data should be                       opportunities for local wealth creation and
              collected to monitor health inequities.8                         employment.
           c.   Funding for the U.S. Census and the                       f.   Food policy councils at the municipal,
                American Community Survey should be                            regional, and state level need to be supported.
                strengthened.
                                                                  5. Ensure workplace justice for workers throughout
   3. Strengthen infrastructure for collection of data on            the food chain. Workers in the restaurant industry,
      food retail outlets                                            for example, experience unsafe working conditions.
                                                                     The pay is often less than that needed to feed a family.
           a.   Investigate a classification system for
                                                                     And women and people of color are disproportionately
                restaurants by service level that would allow
                                                                     represented in lower-paid positions9.
                for a clearer mapping of all (rather than just
                chain) restaurants by type.                       6. Address persistent poverty by engaging multiple
           b. Fund local health departments to perform               sectors. Governmental agencies with responsibilities
              a nutrition survey of a sample of restaurants          for health, housing, transportation, education,
              and other food retail outlets in low- and high-        nutrition, employment, the environment, and other
              food-access communities.                               sectors must identify and implement actions to
                                                                     eliminate persistent poverty. People living in such
   4. Implement a public financing program to provide                places need to act collectively, through organized
      financial “seed money” to stimulate healthy food               intentional actions, to achieve a fair distribution of
      retail in neighborhoods with low food access                   society’s resources.
           a.   The state of Illinois should create a financial
                seeding agency to raise capital to invest in
                communities.
           b. Sufficient funds should be available to address
              the need for increased food retail outlets in
              the entire Chicago metro area.
           c.   A broad range of food retail outlets should be
                eligible for funding, including small stores,
                co-ops, and nonprofit enterprises.
           d. Multiple options are needed to increase access
              to food:
                     i. Promote the development of a variety
                        of small and large innovative retail
                        projects that provide high-quality
                        food in areas with low food access.

Place Matters for Health in Cook County: Ensuring Opportunities for Good Health for All                                        3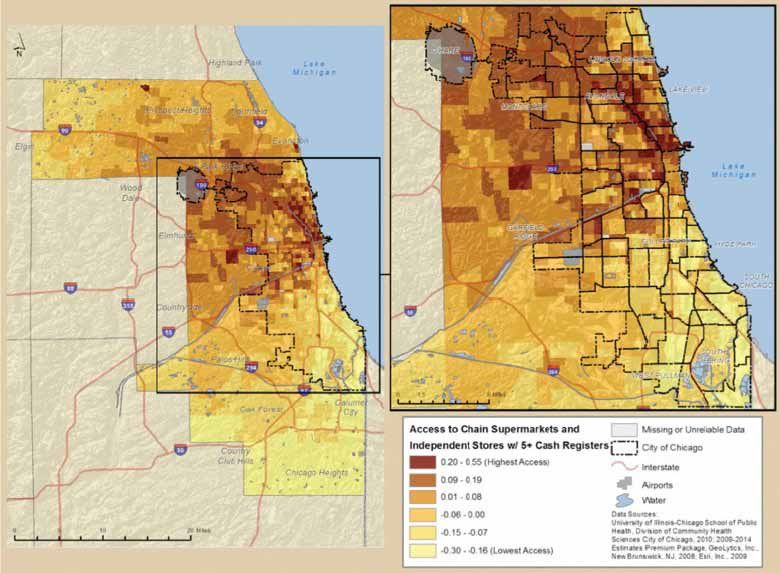
Introduction                                                          While people make personal choices with regard to behaviors
                                                                      that influence health, such as healthy eating and exercise,
[I]nequities in health [and] avoidable health inequalities arise      these choices are often severely limited for those living in
because of the circumstances in which people grow, live, work,        neighborhoods of concentrated poverty. Adopting a healthier
and age, and the systems put in place to deal with illness. The       diet requires access to supermarkets or farmers’ markets that sell
conditions in which people live and die are, in turn, shaped by       fresh produce. These are sorely lacking in poor neighborhoods,
political, social, and economic forces.                               and lack of transportation is a limiting factor in accessing
                                                                      such establishments in other neighborhoods. Regular physical
         World Health Organization Commission on the Social           activity requires a conducive, built environment and access
                             Determinants of Health (2008)            to safe parks, pedestrian routes, and green space for residents
                                                                      to walk, bicycle, and play. These facilities are far less likely to
Place matters for health. Where one lives may be the most             be available in poor, densely populated neighborhoods. Thus,
important factor in determining health outcomes. And                  conditions such as obesity and diabetes, often the products
because of our history of racial oppression and the legacy of         of poor diets and lack of exercise, are more frequent among
that oppression in residential patterns today, the intersection       residents of poor neighborhoods.
of place and race in the persistence of health disparities looms
large.                                                                Institutional policies and practices beyond the control of
                                                                      individuals also play a significant role in health outcomes.
Health outcomes are influenced by several factors—the quality         Environmental pollutants from aging and unhealthy housing
and extent of medical care one receives, individual behaviors         (often with peeling, lead-based paint), nearby factories and
such as those that affect nutrition or exercise, and institutional    smokestacks, and toxic waste dumps are far more prevalent
policies and social structures that are beyond the control of         in poor neighborhoods, as well as in predominantly African
individuals. Choices, tastes, and preferences are shaped by,          American and Hispanic American neighborhoods, largely
and to a significant degree are determined by, income and             because of persistent racism in the institutions of our society
occupation.10 The present mainstream emphasis on educating            and because the residents of these neighborhoods do not have
individuals about “lifestyle choices” is deceptive: It inaccurately   the political or economic clout to resist the decisions of policy
presumes that how much money or other resources one has is            makers. Thus, children growing up in these neighborhoods are
irrelevant.                                                           more likely to ingest lead—and experience subsequent cognitive
                                                                      development problems—and all residents are at higher risk
To a significant degree, all of these factors are a function of
                                                                      for asthma and other conditions that are a product of these
where one lives, works, and plays. In poor neighborhoods
                                                                      pollutants. All are at risk as well from higher levels of violence.
the availability of medical care, healthy foods, and exercise
options are scarce and the levels of exposure to environmental        In addition, access to a quality education and access to good
degradation and violence are high. These conditions are               jobs are severely limited in neighborhoods of concentrated
powerful predictors of more sickness and shorter lives.               poverty. Thus, people living in these neighborhoods not only
                                                                      are at much greater risk for health problems, but the difficulties
Thus, in neighborhoods of concentrated poverty, defined as
                                                                      in obtaining a good education and a decent job at a living wage
neighborhoods in which 30% of the households live at or
                                                                      can create a vicious cycle that perpetuates poor health.
below the poverty level (approximately $22,000 per year for
a family of four), there are fewer family physicians and even         The impact of these factors falls far more heavily on people of
fewer medical specialists, hospitals are likely to be less well-      color, particularly African Americans and Hispanic Americans.
equipped, and clinics and emergency rooms are likely to be            Because of our history of racial oppression and the resulting
more crowded and to be served by overworked and often                 patterns of residential segregation, poor nonwhite families are
less-experienced personnel. Furthermore, because families are         far more likely to live in neighborhoods of concentrated poverty
poor, they are less likely to have health insurance or own a car      than are poor white families. The following are among the
or have the transportation necessary to access better medical         reasons that account for this situation:
care. Therefore, illnesses are left untreated for too long, leading
to more serious conditions; the quality of care for serious               •    The wealth gap has made it difficult for African
conditions such as cardiovascular problems and cancer often is                 Americans and Hispanic Americans to become
inadequate and reflective of a lack of cultural understanding;                 home owners and to sustain home ownership. The
and dental and sight problems may be ignored, leading to more                  wealth gap had its origins in slavery, was augmented
serious problems and, in the case of children, affecting their                 by intentionally discriminatory government policies
ability to learn in school.                                                    in the century that followed the end of slavery, and
                                                                               now actually is widening due to the disproportionate
                                                                               targeting of nonwhite families by predatory lenders.

 4                                                                                 Joint Center for Political and Economic Studies
• Negative racial stereotypes, which arose largely as a • By some estimates racial disparities in the provision
way to justify slavery and Jim Crow racism and that of health care have caused nearly a million premature
tend to demonize all nonwhite Americans, have, in the deaths (886,000) among African Americans.
minds of many white Americans, stamped nonwhites,
particularly African Americans and Hispanic • By some estimates 90,000 African Americans die
Americans, as undesirable neighbors. prematurely each year due to inferior health care.
• Blatantly discriminatory mortgage underwriting • In the case of Hispanic American immigrant families,
policies of the Federal Housing Administration that health outcomes have actually deteriorated the longer
denied mortgages to nonwhite families during the they are in this country, and the health outcomes of
housing boom following World War II, augmented succeeding generations have deteriorated as well.11
by the policy of “redlining” in predominantly
In many ways the situation in Cook County and Chicago
nonwhite neighborhoods, institutionalized residential
mirrors that of similar metropolitan areas throughout the
segregation by locking nonwhite families out of
country. Chicago was a primary destination for many African
suburban home ownership and locking them into high-
American families who came north during the mid-20th
rise rental apartments in government-created ghettoes
century seeking better jobs and more freedom, and it has been a
in the inner cities.
primary destination for immigrants from neighboring countries
• The discriminatory implementation of the GI Bill to our south. This influx of nonwhite people, combined with
following World War II made it far more difficult for white flight and the racially discriminatory tools mentioned
African American veterans to obtain mortgage loans earlier—redlining, steering, blockbusting, and predatory
or loans for a college education or to start a small lending—have severely exacerbated residential segregation.
business. Today, Chicago remains hyper-segregated, with little change
in neighborhood composition except where gentrification has
Despite enactment of the Fair Housing Act of 1968 and increased the white population and driven out low-income
subsequent legislation that was designed to create equal and nonwhite residents. Suburban Cook County has seen its
opportunity for fair and integrated housing and home population in poverty increase between 2000 and 2010. There
ownership, patterns of residential segregation have persisted, was significant population growth of communities of color and
due in large part to ongoing racially biased practices such as a decrease in the white population.12
redlining, steering, blockbusting, and predatory lending. The
migration of African American families north during the mid- These segregated housing patterns have created significant
20th century seeking greater job opportunities and freedom racial and ethnic divisions and disparities, particularly in
from the stifling Jim Crow practices of the South, combined health outcomes. For example, our study found that in seven
with white families leaving the cities for the more spacious of the eight Chicago neighborhoods that have the lowest
suburbs (encouraged both by favorable mortgage terms not life expectancy (ranging from 68.9 years to 71.5 years), the
available to nonwhite families and by construction of interstate percentage of African Americans living in these neighborhoods
highways that have facilitated commuting), intensified these ranges from 77.4% to 98.5%. In six of these neighborhoods
racially biased practices and more fully embedded residential the population is more than 93% African American. In these
segregation in society. More recently, the situation has been same neighborhoods, the percentages of those living below
exacerbated by resistance to immigration from Latin American 150% of the federal poverty level ($22,314 for a family of four)
countries. Thus, despite the growth of the nonwhite middle range from 33.0% to 66.2%. In the eight neighborhoods with
class, particularly the African American middle class, nonwhite the highest life expectancy (ranging from 82.8 years to 84.5
families have remained disproportionately clustered in poor years), the percentage of African Americans ranges from 1.1%
inner-city neighborhoods. to 33.4%, with six of these neighborhoods having African
American populations under 10%.
The health outcomes have been predictable:
Children are especially vulnerable, with more than 75% of
• Life expectancy for black men in the U.S. is 68.8 years all black children in metro Chicago living in neighborhoods
vs. 75.1 years for white men. with poverty rates in excess of 90%. On the other hand,
more than 85% of all white children in metro Chicago live in
• Life expectancy for black women in the U.S. is 75.6 neighborhoods with poverty rates under 10%.
years vs. 80.3 years for white women.
Not surprisingly, neighborhoods of high poverty tend to trap
• Black infant mortality is more than twice that of their residents in an ongoing cycle of poverty and poor health.
whites. A report issued by the Leadership Council for Metropolitan
Communities in 200513 noted that the “highest opportunity”
Place Matters for Health in Cook County: Ensuring Opportunities for Good Health for All 5communities in the Chicago area had 34 times as many jobs with a median household income in 2000
created within a 10-mile radius between 1995 and 2000 as the of just $13,178. Sixty-eight percent of
“lowest opportunity” communities. It further noted that the its children lived in poverty.…[These]
lowest-opportunity communities had a tax capacity of $871 communities show high rates of disease and
per household compared to $2,813 for the highest-opportunity negative environmental factors. In 2004,
communities, and it found that 94% of African American Englewood and West Englewood had the
residents and 83% of Hispanic American residents lived in low- highest rates of positive lead tests (13%)
opportunity communities. This segregation by race and class among children of Chicago communities,
is driven in part, the report found, by the fact that households and were two of the top three communities
with limited incomes were virtually forced into these low- in all-cancer mortality rates, and two of the
opportunity communities by limited housing options: 87% top four communities in homicide rates.
of the housing affordable to households earning poverty-level Food access in both the communities is
incomes was located in low-opportunity communities. low. Despite the opening of a full service
supermarket in West Englewood in 2006,
One of the key characteristics of these low-opportunity this is the only full service supermarket in an
communities is limited access to nutritious foods. Previous area with a combined population of about
national and local studies have demonstrated a relationship 85,000. The mean distance to the nearest large
between limited access to healthy foods and abundant access market from Englewood addresses in 2007
to poor food sources, which in turn can lead to adverse health was 1.41 miles. There were no full-services
outcomes such as obesity, cancer, and cardiovascular disease.14 supermarkets in Riverdale and the mean
The Chicago Sun-Times addressed this issue in a newspaper distance to the nearest large store was 3.65
article that begins: “The greens are wilted, with brownish edges. miles, by far the highest in the city.
The oranges are bruised and yellowing. Bunches of bananas
have started turning brown and spotty.…”15 This same article There have been some public sector efforts in Chicago to
noted that it found this unappetizing situation in one of the address residential segregation and, by extension, access
few grocery stores with a relatively large produce section in a to nutritious foods. Among them is the Chicago Housing
predominantly African American and low-income community Authority’s “Plan for Transformation,” the goal of which “is to
that had only one chain supermarket for 117,000 residents. rehabilitate, redevelop and/or tear down public housing units
to improve the quality of the housing, promote mixed-income
As our study has found, this lack of access to nutritious communities and redefine the relationship between the Chicago
foods is common in predominantly nonwhite, low-income Housing Authority (CHA) and the tenants in these units.” The
communities, which are, for the most part, low-opportunity CHA web site states that the “Plan for Transformation goes far
communities. And they are a significant factor in one’s inability beyond the physical structure of public housing. It aims to build
to eat healthy foods and in the health outcomes that are a and strengthen communities by integrating public housing and
consequence of this inability. its leaseholders into the larger social, economic and physical
fabric of Chicago.” The plan was approved by the Department
The purpose of the study from which the Sun-Times quote
of Housing and Urban Development and funded, and it began
derives was “to make connections between food access, respect,
in 2000 with a target completion date of 2007. However, it has
and activism.” The following paragraph from this study sums up
had very limited success, with former CHA residents tending to
the situation in Chicago’s nonwhite communities:
move from one disadvantaged neighborhood to another—and
Two of the case study areas were in the process losing social networks that had helped to sustain
predominantly African American and them. The plan is now scheduled to be completed by 2015, but
expressions of lack of respect and inequality the realization of its goals is in serious question.
were common in views of food security
At the community level there have been substantial efforts over
expressed by each community. Englewood,
a period of many years by community-based organizations such
with its sister community of West Englewood
as Fresh Moves16 to address this concern as a way to narrow
on Chicago’s mid-South Side, is over 97%
health disparities in the Chicago area. According to the article
African American. In 2000, 54.1% of
referenced above, Food Sovereignty, Urban Food Access, and Food
Englewood children and 43.8% of West
Activism, “in Chicago and elsewhere, residents and activists
Englewood children lived in poverty, far above
often see and experience racial and economic inequalities
the Chicago rate of 28.1%. Riverdale is an
through the variety of stores and other food access sites available
extremely isolated community surrounded by
in their community.” It claims that the concept of “food
industrial land on Chicago’s far South Side.…
sovereignty17 may apply particularly well in Chicago because
Riverdale was 96.6% African American in
many community-based action groups in the city are still
2000, and is the poorest Chicago community,
6 Joint Center for Political and Economic Studiesrooted in the work of [Saul] Alinsky,” the noted 20th century Chicago, as well as present racial and class discrimination,
community organizer from Chicago, and in the work of many and they represent serious challenges to health and equity in
others who, both historically and currently, have engaged in Chicago now and in the future.
developing grassroots power in the Chicago area.
It is our hope that the information contained in this report
It is in this context that the Joint Center’s Health Policy will support and supplement earlier reports and will add to the
Institute undertook to study the relationships between health, ammunition that community-based organizations and others
community characteristics, and food access in Cook County, can use to address inequitable access to healthy food and to
Ill. and to address specific questions raised by the Cook County significantly narrow health disparities in the metropolitan
Place Matters team: Chicago area.
• What is the relationship between community-level Part I of this report provides background information about
measurements of socioeconomic status—that is, Cook County, including population data, health outcomes,
wealth, income, and/or education—and access to socioeconomic conditions, and community characteristics. Part
healthy food? II examines the relationship between various neighborhood
characteristics and food access indicators and health outcomes,
• What is the relationship between access to different including premature mortality and mortality due to heart
types of food providers and health outcomes? disease and stroke. Part III discusses possible implications for
the observed relationships. Appendix A presents detail about
The study found that:
the data and methods that were used in preparing this report.
• People living in areas where a higher percentage of the
population was non-Hispanic white have significantly
longer life expectancies than people living in areas
where a higher percentage of the population is non-
Hispanic black. Similarly, owner-occupied housing and
higher levels of wealth and educational attainment are
associated with longer life expectancies.
• In Cook County, life expectancy across census tracts
varies by as much as 33.3 years, from a high of 95.0
years to a low of 61.7 years.
• People living in areas with a higher percentage of
whites and, to a lesser degree, Asian Americans have
significantly greater access to chain supermarkets and
more nutritious foods, and this access is associated with
longer life expectancies.
• People in Cook County communities with the least
access to nutritious foods (that is, neighborhoods
in the bottom 20% of communities based on
measures of healthy food access) have an average life
expectancy that is more than 12 years shorter than
the communities with the highest access (that is,
neighborhoods in the top 20% of healthy food access).
Although researchers cannot say with certainty that these
neighborhood conditions cause poor health, the overall
pattern suggests that the clustering of social, economic, and
environmental health risks in low-income and nonwhite
neighborhoods, which are populated predominantly by
African American and Hispanic American families, constrains
opportunities for people in these neighborhoods to live healthy
lives. These place-based patterns are neither arbitrary nor
benign. As noted earlier, they reflect the lack of opportunity
in the communities where blacks and Latinos live in metro
Place Matters for Health in Cook County: Ensuring Opportunities for Good Health for All 7Map 1: Population Density by Census Tract, Cook County and Chicago (2009)
I. Background: Population, Community Black and Hispanic residents each comprise nearly one
Characteristics, and Health in Cook County quarter of the total population; Asians comprise 5.8%. These
proportions are larger than those seen either in the state of
Population Illinois or in the nation (see Table 1 and Figure 1).
Cook County is located in the northeastern corner of Illinois Racial and ethnic population densities vary widely across
and is bordered by Lake Michigan. The metropolitan area Cook County. The Index of Dissimilarity19 is a measure
is third largest in the United States after New York and Los of residential segregation that explains the percent of the
Angeles. In 2009, its population of 5,287,037 was more than population that would have to move in order to achieve a
40% of the total population of Illinois (12,910,409).18 Cook completely integrated20 community. The higher the index, the
County is characterized by dense population within the more segregated the area. Between 2005 and 2009, the Index
Chicago city limits, particularly in the northeast portion of the of Dissimilarity for Cook County between the black and white
city along the shore of Lake Michigan. The population becomes populations was 80.8% at the census tract level,21 which ranks
less dense in the suburban areas farther away from the city. it third behind Milwaukee and Detroit as the most segregated
Over half of Cook County’s population is located in the city of of all large U.S. metropolitan areas; by comparison, the state
Chicago, which is also the county seat. The overall population of Illinois had an index of 75.1%.22 The Index of Dissimilarity
density in Cook County was 5,598.3 persons per square mile in between white and Hispanic populations in Cook County was
2009. 60.2%,23 which is similar to the state index.
8 Joint Center for Political and Economic StudiesTable 1. Demographic Characteristics of Cook County, Illinois, and the United States
Cook County Illinois United States
Population (2009)(a) 5,287,037 12,910,409 307,006,556
Population Density (2009)(b) 5,598.3 232.7 86.7
Race/Ethnicity (2009)(a)
White 44.8% 64.4% 64.9%
Black 24.9% 14.4% 12.1%
Hispanic 23.2% 15.3% 15.8%
Asian 5.8% 4.3% 4.4%
Other 1.3% 1.6% 2.8%
Foreign Born (2009)(a) 20.6% 13.5% 12.5%
(a) Source: U.S. Census Bureau, 2009 American Community Survey
(b) Source: 2009 Geolytics Projection
Figure 1: Race/Ethnicity in Cook County (2009)
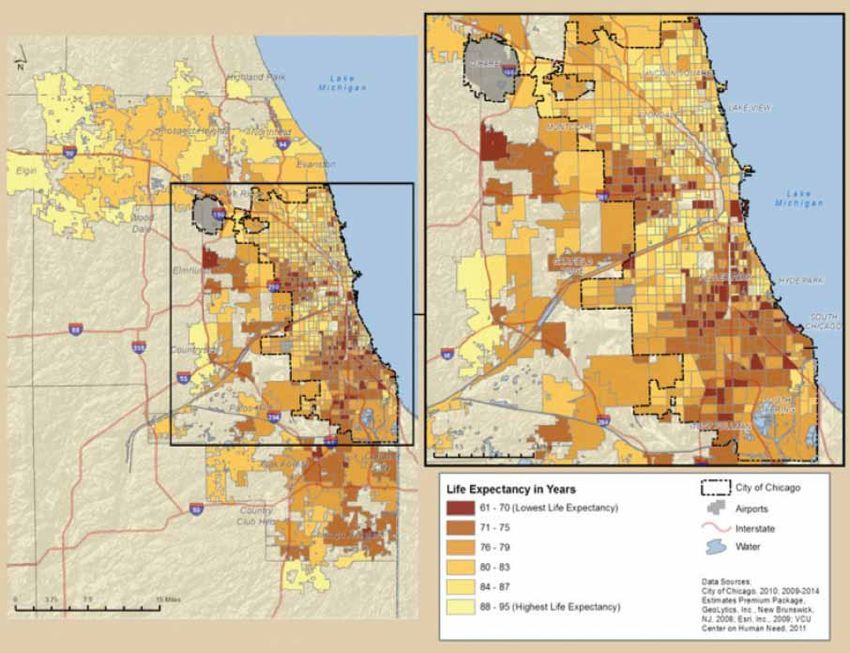
Place Matters for Health in Cook County: Ensuring Opportunities for Good Health for All 9Map 2: Racial and Ethnic Distribution in Cook County and Chicago (2005-2009)
The Index of Dissimilarity is less useful for comparisons at townships of Orland and Bremen are also majority white, while
a smaller geographic level like the census tract. For these Thornton is majority black. Within Chicago, the community
purposes, the diversity index is more useful. The diversity index areas on the northern shore of Lake Michigan (Lakeview,
is a measure of the likelihood that two people randomly chosen Lincoln Park, Near North Side) are majority white, while much
from an area will be of a different race or ethnicity. The higher of the South Side, including Washington Park, Englewood,
the diversity index, the less segregated the area. While the Woodlawn, Greater Grand Crossing, South Shore, South
diversity index for Cook County as a whole in 2009 was 69.8%, Chicago, Avalon Park, and Chatham, is majority black. There
the value ranges from 0.3% (no diversity) in a single census tract are also predominately black communities on Chicago’s West
in Englewood, which is virtually all black, to 83.3% in a single Side and near west suburbs. More than three quarters of the
census tract in Rogers Park (high diversity). The Rogers Park census tracts in South Lawndale, Brighton Park, and Gage Park
population composition is 42% Hispanic American, 25% white, have a Hispanic population that is greater than 70% of the
16% African American, and 11% Asian American. total population. There are also large numbers of Hispanics on
Chicago’s Northwest Side.
Map 2 illustrates the segregation of racial and ethnic groups
in Cook County generally and in the city of Chicago. The
northern suburban townships of Barrington, Hanover, Palatine,
Schaumburg, Wheeling, Elk Grove, Northfield, Maine, New
Trier, Niles, and Evanston are majority white. The southern
10 Joint Center for Political and Economic StudiesFigure 2: Ratio of Income to Poverty in Cook County (2009)
Socioeconomic Characteristics exists in census tracts in which at least 20% of households had
incomes under the FPL for at least two consecutive census
As is true nationally, socioeconomic conditions in Cook periods, or 20 years. This is the case in more than a quarter of
County exert an important, and often unrecognized, influence Cook County census tracts, including the 162 tracts located in
on health status. Nationally, families living below the federal neighborhoods listed in Table 2, where more than 20% of the
poverty level (FPL) (an annual income of approximately population has had incomes below the poverty level for five
$22,000 or less for a family of four) are 3.6 times more likely to decades (see also Map 4). An additional 216 census tracts have
report fair or poor health than those with incomes of at least experienced persistent poverty for two to four decades.
twice the poverty level.24 In 2009, 15.9% of households in Cook
County had incomes below the FPL, compared to 13.3% of In 2009, the median income of Cook County families was
households in Illinois and 14.3% of households in the United $63,612 overall, with sharp differences by race and ethnicity.
States.25 The median income was $87,918 among non-Hispanic whites,
$77,096 among Asians, $40,048 among blacks, and $44,012
The income-to-poverty ratio expresses household income as a among Hispanics.28
percentage of the FPL. Figure 2 shows that 7.4% of households
in Cook County had incomes that were less than half of the In the U.S., the risk of having a housing cost burden29 in 2009
FPL (an income-to-poverty ratio of 50%), nearly 16% in all was almost seven times greater for those earning less than
earned less than the FPL, and almost 35% earned less than twice $20,000 per year than it was for those earning $75,000 or
the FPL, or less than $44,100 in 2009 for a family of four. more.30 Households in Cook County were more likely to be
housing cost burdened in 2009 compared to households in
The U.S. Census Bureau estimates that 23.6% of U.S. Illinois and the U.S. In Cook County, the housing cost burden31
households had incomes below 150% of the FPL in 2009, in 2009 was moderate to severe (between 30% and 49.9% of
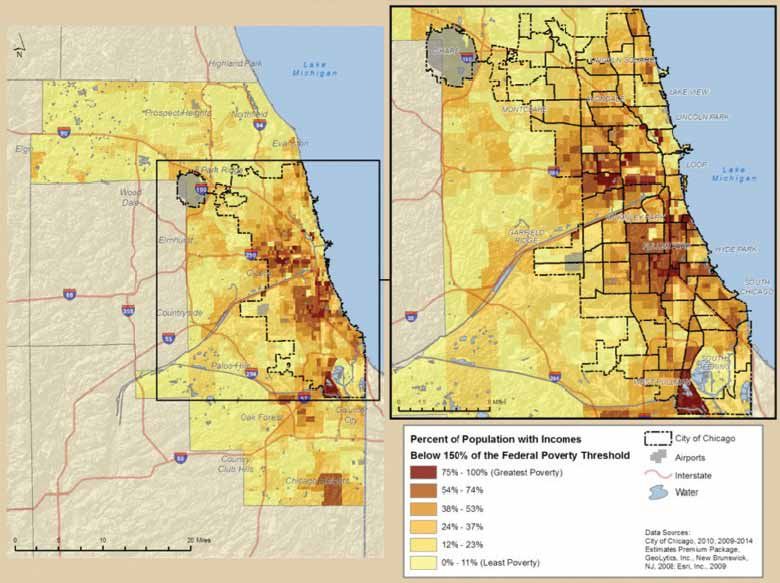
compared with 25.9% in Cook County.26 In 2009, half of income) for over one in five (21.7%) households, and was severe
households in census tracts in the neighborhoods of Armour (more than 50% of income) in another 17.0% of households.32
Square, East Garfield, Englewood, Fuller Park, Grand Cook County’s housing cost burden exceeded that of Illinois
Boulevard, Lower West Side, New City, North Lawndale, (19.1% and 12.5% of households, respectively, experience
Oakland, Riverdale, South Chicago, South Lawndale, moderate or severe cost burden) and the U.S. (18.4% and
Washington Park, West Englewood, West Garfield Park, and 12.0%, respectively).33
Woodlawn had incomes below 150% of the FPL (see Map 3)
Severe overcrowding (an average of more than 1.5 persons per
A persistent lack of economic resources during childhood can room) affected 4.2% of Cook County households, compared to
have negative consequences for a child’s cognitive, emotional, 2.4% of Illinois households and 2.8% of U.S. households.34 Only
behavioral, and physical development. It also may diminish 54.9% of housing units in Cook County were occupied by those
the likelihood of high school completion, thus perpetuating who owned and held a financial stake in the property, compared
disadvantage and the multigenerational cycle of living in to 63.9% in Illinois and 60.7% nationally.35
conditions that adversely affect health.27 Persistent poverty
Place Matters for Health in Cook County: Ensuring Opportunities for Good Health for All 11Map 3: Poverty by Census Tract, Cook County and Chicago (2009)
Map 4: Persistent Poverty by Census Tract, Cook County and Chicago (1970-2009)
12 Joint Center for Political and Economic StudiesTable 2. Cook County Neighborhoods With Persistent Poverty for Five Decades (1970-2009???)
Uptown North Center Lincoln Park
Near North Side Humboldt Park West Town
Austin West Garfield Park East Garfield Park
Near West Side North Lawndale South Lawndale
Lower West Side Near South Side Armour Square
Douglas Oakland Fuller Park
Grand Boulevard Kenwood Washington Park
Woodlawn South Shore South Chicago
Riverdale West Englewood Englewood
Greater Grand Crossing Auburn Gresham Robbins/Blue Island
Chicago Heights/Ford Heights
Source: Geolytics Neighborhood Change Database. Communities in italics are suburbs.
All others are Chicago Community Areas.
Table 3. Cook County Neighborhoods With Low Educational Attainment (2009)*
Near West Side Grand Boulevard New City
Logan Square South Lawndale Douglas
Humboldt Park Grand Boulevard Lower West Side
Brighton Park North Lawndale Hermosa
Cicero Gage Park West Englewood
Belmont Cragin West Town Austin
South Chicago West Pullman Near North Side
Near West Side Englewood McKinley Park
West Garfield Park Melrose Park Franklin Park
Cicero
*Neighborhoods in which at least 50% of adults lacked a high school diploma in at least one census tract in 2009.
Source: Geolytics Neighborhood Change Database. Communities in italics are suburbs.
All others are Chicago Community Areas.
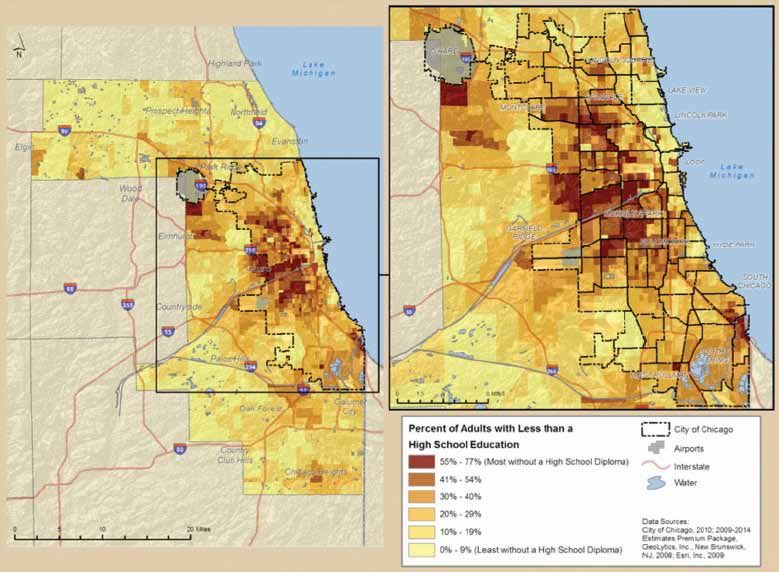
Education In Cook County a larger percentage of adults (age 25 and
older) lacked a high school degree in 2009 (16.4%) than in
Education is a pathway to higher income and net worth, which either Illinois (13.6%) or the nation (14.7%).36 Educational
also have strong influences on health status and access to attainment varies greatly by census tract in Cook County (see
health care. National statistics indicate that adults (age 25 and Map 5): 69.8% of census tracts—representing 929 tracts—had
older) who lack a high school education or equivalent are three a higher percentage of adults without a high school education
times more likely to die before age 65 as those with a college than the overall percentage for Illinois.37 The percentage
education. They are also more likely to engage in unhealthy without a high school diploma varies by census tract from 0.2%
behaviors such as cigarette smoking. in New Trier Township in the northern suburb of Cook County
to 76.6% in a census tract in Near West Side. Cook County
neighborhoods with the highest percentages of adults without a
high school diploma are shown in Table 3.
Place Matters for Health in Cook County: Ensuring Opportunities for Good Health for All 13Map 5: Adults With Less Than High School Education by Census Tract, Cook County and Chicago (2009)
Table 4. Socioeconomic Characteristics of Cook County, Illinois, and the United States
Cook County Illinois United States
Educational Attainment
Less than High School 16.4% 13.6% 14.7%
High School Only 24.2% 27.3% 28.5%
Some College 25.7% 28.5% 28.9%
Bachelor’s Degree or Higher 33.7% 30.6% 27.9%
Poverty Rate
Below 50% 7.4% 6.0% 6.3%
50% - 99% 8.5% 7.3% 8.1%
100% - 199% 18.8% 16.9% 18.4%
200% and Above 65.3% 69.7% 67.3%
Source: U.S. Census Bureau, 2009 American Community Survey
14 Joint Center for Political and Economic StudiesFigure 3: Educational Attainment by Race/Ethnicity, Cook County (2009)
Compared to non-Hispanic white adults (25 years old and was 445.9 premature deaths per 100,000 persons; for white
older) in the same time period, black adults in Cook County residents the rate was 179.5; for Hispanic residents it was 141.3
were more than twice as likely to lack a high school diploma, (see Table 5).
and Hispanic adults were more than five-and-a-half times as
likely (see Figure 3). Nationally, blacks had the highest overall age-adjusted mortality
in 2007, with 208.6 more deaths per 100,000 persons than
Measures of educational proficiency also vary by place. The whites and 411.9 more deaths than Hispanics (see Table 5);
National Assessment of Educational Progress (NAEP) evaluates blacks also had the highest age-adjusted mortality rate from
samples of students in the fourth, eighth, and twelfth grades heart diseases.40 In Cook County, black residents suffered 355.8
to gauge levels of proficiency in various subjects. In 2009, a more deaths per 100,000 from all causes compared to whites,
higher percentage of fourth graders in Chicago scored below a disparity that is higher than in Illinois (296.2 excess deaths)
basic proficiency in reading, math, and science than did fourth or the U.S. (208.6 excess deaths). That is a ratio of 1.5 deaths
graders in either Illinois or the U.S.; among fourth-grade among blacks for every death among whites in Cook County,
students in Chicago, the percentage scoring below basic levels in compared to a ratio of 1.4 for Illinois and 1.3 for the U.S.
all three subjects was nearly double that of students statewide.38 The Hispanic rate was significantly lower than the white rate.
The level of educational proficiency is correlated with high Disparities in heart disease mortality in Cook County for all
school dropout rates and, therefore, educational proficiency three groups are similar to those seen in Illinois and the U.S.
influences health outcomes.
The infant mortality rate in the U.S. was 5.6 per 1,000 for
white mothers, 5.4 per 1,000 for Hispanic mothers, and 12.9
per 1,000 for black mothers in 2006.41 Infant mortality is more
Health Outcomes than 24 times greater for infants with a birth weight of less than
2,500 grams (5.51 pounds) than it is for infants at or above
In 2007, life expectancy at birth in the U.S. averaged 77.9 years. this weight.42 In the U.S., black mothers are 89% more likely to
For whites it was 78.4 years; for blacks it was 4.8 years lower, deliver a child of low birth weight than white mothers (13.4%
at 73.6 years.39 In 2007, blacks in the U.S. experienced 373.7 and 7.1%. respectively). In Cook County, black mothers are
premature deaths (death before the age of 65) per 100,000 more than twice as likely as white mothers to give birth to a
persons. For whites, the rate was 216.7; for Hispanics, it was child of low birth weight (13.9% vs, 6.9%).
173.0. In Cook County in 2007 the rate for black residents
Place Matters for Health in Cook County: Ensuring Opportunities for Good Health for All 15Table 5. Health Outcomes in Cook County, Illinois, and the United States
Cook County Illinois United States
Life Expectancy at Birth 79.1(a) 78.6(b) 77.9(c)
Premature Mortality(d) 239.6 219.0 231.1
White 179.5 191.4 216.7
Black 445.9 425.6 373.7
Hispanic 141.3 132.3 173.0
All Cause Mortality(d) 759.2 760.3 760.2
White 687.1 732.5 749.4
Black 1042.9 1028.7 958.0
Hispanic 449.9 434.4 546.1
Heart Disease Mortality(d) 202.0 192.9 190.9
White 194.7 190.2 191.4
Black 261.8 257.0 251.9
Hispanic 110.9 104.4 136.0
Infant Mortality Rate(e) 7.5 7.4 6.7
White 4.3 6.0 5.6
Black 13.8 14.4 12.9
Hispanic 5.2 6.2 5.4
Low Birth Weight Rate(1) 8.9% 8.4% 8.2%
White 6.9% 7.1% 7.1%
Black 13.9% 13.7% 13.4%
Hispanic 6.6% 6.6% 7.0%
Note 1: Premature, All Cause and Heart Disease mortality rates are calculated per 100,000 persons and are age adjusted to
the 2000 U.S. Census population.
Note 2: Infant Mortality Rates are calculated per 1,000 live births.
Note 3: Heart disease is defined as the following ICD10 codes: I00 - I09, I11, I13, I20 - I51.
Calculations performed by the VCU Center on Human Needs from 2003-2007 mortality data provided by Chicago
and Cook County Public Health Department and 2001-2008 Geolytics Premium Estimates.
Calculations performed by the VCU Center on Human Needs from 2007 data provided by the Centers for Disease
Control and Prevention CDC WONDER on-line tool.
Health, United States 2010: With Special Features on Death and Dying; the Centers for Disease Control and
Prevention, 2007.
Centers for Disease Control and Prevention CDC WONDER on-line tool 2007.
National Center for Health Statistics, National Vital Statistics Report Volume 58, Number 17, 2006.
The Centers for Disease Control and Prevention National Vital Statistics System 2008.
Given the geographic variation in socioeconomic and results. For instance, unusual events may occur in a census tract
environmental factors that affect health in Cook County, it that influence the results in an anomalous fashion. Therefore,
follows that health outcomes—including life expectancy—vary in order to meaningfully represent the data shown in Map 6, we
sharply by neighborhood as well. It should be noted, however, have grouped the census tracts by quintile and by income, which
that measuring life expectancy at the level of the census tract we describe in Figure 4.
can lead to some difficulties in meaningfully interpreting the
16 Joint Center for Political and Economic StudiesMap 6: Life Expectancy by Census Tract and Municipality, Cook County and Chicago (2003-2007)
II. Neighborhood Characteristics, Food Access, due to cost, than were families with incomes of at least 200% of
and Health Outcomes the FPL.45
Socioeconomic Factors and Health In 2009, life expectancy in Cook County was significantly
correlated with a number of key social, economic, and
Socioeconomic factors are strong determinants of the risk of demographic indicators:
illness and premature death.43 In 2007, members of families
living in poverty nationwide were nearly twice as likely to have • Areas (census tracts and suburban municipalities)
diabetes, 5.3 times as likely to report serious psychological where a higher percentage of the population was
distress, and 1.6 times as likely to have been hospitalized during non-Hispanic white had significantly longer life
the previous year compared to families with incomes of at least expectancies. Areas with a higher percentage of
200% of the federal poverty level.44 At the same time, access to non-Hispanic blacks had significantly shorter life
health care services is much more limited for families with low expectancies.
incomes. In 2007, impoverished families—those with incomes • Owner-occupied housing was associated with longer
below the FPL—were two to four times more likely to lack life expectancies, while a high vacancy rate was
health insurance or a usual source of care, or to defer health care associated with shorter life expectancies.
Place Matters for Health in Cook County: Ensuring Opportunities for Good Health for All 17You can also read