Associations between Governmental Policies to Improve the Nutritional Quality of Supermarket Purchases and Individual, Retailer, and Community ...
←
→
Page content transcription
If your browser does not render page correctly, please read the page content below
International Journal of
           Environmental Research
           and Public Health

Review
Associations between Governmental Policies
to Improve the Nutritional Quality of Supermarket
Purchases and Individual, Retailer, and Community
Health Outcomes: An Integrative Review
Alyssa J. Moran 1, *, Yuxuan Gu 2 , Sasha Clynes 2 , Attia Goheer 1 , Christina A. Roberto 3
and Anne Palmer 4,5
 1    Department of Health Policy and Management, Johns Hopkins Bloomberg School of Public Health,
      Baltimore, MD 21205, USA; agoheer1@jhu.edu
 2    Department of International Health, Johns Hopkins Bloomberg School of Public Health,
      Baltimore, MD 21205, USA; yuxuangreen@gmail.com (Y.G.); sclynes1@jhmi.edu (S.C.)
 3    Department of Medical Ethics and Health Policy, Perelman School of Medicine at the
      University of Pennsylvania, Philadelphia, PA 19104, USA; croberto@pennmedicine.upenn.edu
 4    Department of Health Behavior and Society, Johns Hopkins Bloomberg School of Public Health,
      Baltimore, MD 21205, USA; apalmer6@jhu.edu
 5    Center for a Livable Future, Johns Hopkins Bloomberg School of Public Health, Baltimore, MD 21202, USA
 *    Correspondence: amoran10@jhu.edu

 Received: 7 September 2020; Accepted: 30 September 2020; Published: 15 October 2020

 Abstract: Supermarkets are natural and important settings for implementing environmental
 interventions to improve healthy eating, and governmental policies could help improve the nutritional
 quality of purchases in this setting. This review aimed to: (1) identify governmental policies in the
 United States (U.S.), including regulatory and legislative actions of federal, tribal, state, and local
 governments, designed to promote healthy choices in supermarkets; and (2) synthesize evidence
 of these policies’ effects on retailers, consumers, and community health. We searched five policy
 databases and developed a list of seven policy actions that meet our inclusion criteria: calorie labeling
 of prepared foods in supermarkets; increasing U.S. Department of Agriculture (USDA) Supplemental
 Nutrition Assistance Program (SNAP) benefits; financial incentives for the purchase of fruit and
 vegetables; sweetened beverage taxes; revisions to the USDA Special Supplemental Nutrition Program
 for Women, Infants, and Children (WIC) food package; financial assistance for supermarkets to open
 in underserved areas; and allowing online purchases with SNAP. We searched PubMed, Econlit,
 PsycINFO, Web of Science, and Business Source Ultimate to identify peer-reviewed, academic,
 English-language literature published at any time until January 2020; 147 studies were included in
 the review. Sweetened beverage taxes, revisions to the WIC food package, and financial incentives
 for fruits and vegetables were associated with improvements in dietary behaviors (food purchases
 and/or consumption). Providing financial incentives to supermarkets to open in underserved areas
 and increases in SNAP benefits were not associated with changes in food purchasing or diet quality
 but may improve food security. More research is needed to understand the effects of calorie labeling
 in supermarkets and online SNAP purchasing.

 Keywords: food purchase; policy; retail food environment; food and beverage; grocery;
 federal nutrition assistance programs; beverage tax; menu labeling; financial incentives;
 health disparities

Int. J. Environ. Res. Public Health 2020, 17, 7493; doi:10.3390/ijerph17207493   www.mdpi.com/journal/ijerph
Int. J. Environ. Res. Public Health 2020, 17, 7493                                                 2 of 23

1. Introduction
     Poor diet is widely considered a public health crisis, contributing to many of the leading causes of
morbidity and mortality in the United States (U.S.) and globally [1,2]. There is growing recognition that
dietary behaviors are shaped by the environments in which people live, learn, work, and play, and public
health interventions increasingly target these settings [3]. Compared to nutrition interventions aimed
at individuals or groups, upstream interventions designed to alter the environments in which people
make food and beverage choices may be more effective for improving health, and are less costly to
implement in the long-term [4,5]. For example, environmental interventions to treat obesity, such as
sugary drink taxes and reductions in child-directed television advertising, are shown to be more
cost-effective than commonly reimbursed clinical interventions, such as nutrition counseling or bariatric
surgery [5].
     In the U.S., supermarkets are natural and important settings for implementing environmental
interventions to improve healthy eating. These stores, which generate more than $2 million annually in
sales volume, are the primary retail store choice for the vast majority of U.S. households [6]. According
to data from the U.S. Department of Agriculture (USDA) Food Acquisition and Purchase Survey,
in 2012–2013, 89% of households did their primary shopping at supermarkets or other large grocers,
with only 5% doing their primary shopping at other stores (e.g., convenience or dollar stores) [7].
During this time, supermarket purchases made up the majority of calories purchased by U.S. households
(65%) and accounted for between 56% (households participating in the USDA Supplemental Nutrition
Assistance Program [SNAP]) and 64% (higher income non-participating households) of household food
expenditures [6]. Restaurant closures necessitated by the COVID-19 pandemic have likely increased
reliance on supermarkets as a primary food source for many households.
     The in-store environment is a well-recognized and powerful driver of dietary behaviors in
supermarkets. Prior work has documented the important role of in-store food and beverage marketing,
including availability, affordability, prominence, and promotion, in shaping consumer choices [8].
While these strategies hold promise for promoting healthy choices, they are often used to increase
purchases of ultra-processed, nutritionally-poor products. A study of nearly 70 food retailers in three
states found that sugary drinks were the most commonly promoted beverage, displayed in an average
of 25 locations throughout the store [9]. National survey data show that the nutritional quality of
purchases from supermarkets is generally poor, with diet quality scores (measured using the Healthy
Eating Index 2010) closely mirroring those from national surveys of dietary intake [6,10].
     Prior research has assessed the effectiveness of in-store promotions for healthy foods, finding that
changes to product pricing, availability, packaging, display, signage, and labels are associated with
consumer purchasing in the short-term [8]. Implementing these interventions long-term and scaling
them across the nation’s more than 30,000 supermarkets, however, has proven challenging [11].
Grocery stores operate at low margins and rely on trade fees and discounts from food and beverage
companies for revenue [12]. These fees often favor the largest manufacturers and distributors,
allowing them to control which products are stocked and how items are promoted in the store. It is
estimated that supermarkets collect more than $50 billion a year in trade fees and discounts, with fees
accounting for a large proportion of total grocery revenue relative to sales (although fees vary greatly
by product, manufacturer, and store type) [11,12]. These exorbitant financial incentives make voluntary
interventions to promote healthy purchases difficult to implement in supermarkets without food and
beverage company buy-in.
     In the absence of widespread and sustained voluntary action, governmental policies could help
increase healthy purchases and decrease unhealthy purchases in the supermarket setting. To this
end, several policies have been implemented across the U.S., and many studies have been conducted
to evaluate their effects. This integrative review aims to synthesize the academic literature on this
topic by: (1) identifying U.S. governmental policies, including regulatory and legislative actions of
federal, tribal, state, and local governments, designed to promote healthy choices in supermarkets;
and (2) summarizing the available evidence related to these policies’ effects on retailers, consumers,
Int. J. Environ. Res. Public Health 2020, 17, 7493 3 of 23
and community health via changes to the supermarket environment. The objective of this review is
to provide researchers and policymakers with information on existing policy options, their relative
effectiveness
Int.in improving
J. Environ. Res. Publicdietary
Health 2020,behaviors,
17, x FOR PEERco-benefits
REVIEW or unintended consequences (e.g., impacts on
3 of 24
retailer revenues or community economic development), and areas in need of further research. Although
community health via changes to the supermarket environment. The objective of this review is to
previous reviews have examined the effects of some of these policies, in isolation, on individual dietary
provide researchers and policymakers with information on existing policy options, their relative
or health outcomes,
effectivenessthis will be dietary
in improving the first, to ourco-benefits
behaviors, knowledge, to compare
or unintended a wide(e.g.,
consequences range of outcomes
impacts
across multiple policy
on retailer approaches.
revenues or community economic development), and areas in need of further research.
Although previous reviews have examined the effects of some of these policies, in isolation, on
2. Methodsindividual dietary or health outcomes, this will be the first, to our knowledge, to compare a wide
range of outcomes across multiple policy approaches.
This review sought to answer two research questions: (1) which governmental policies in the
U.S. aim to2.promote
Methods healthy choices in supermarkets; and (2) what is known about the effects of these
This review
policies on retailers, sought toand
consumers, answer two research questions:
communities? To answer (1)these
whichquestions,
governmentalwepolicies in the searches
conducted
U.S. aim to promote healthy choices in supermarkets; and (2) what is known about the effects of these
of the peer-reviewed, academic, English-language literature published until January 2020. We searched
policies on retailers, consumers, and communities? To answer these questions, we conducted
PubMed, Econlit,
searchesPsycINFO, Web of Science,
of the peer-reviewed, academic,and Business Source
English-language Ultimate
literature to until
published identify papers
January 2020. spanning
the economics, public PubMed,
We searched health, marketing, consumer
Econlit, PsycINFO, Web ofbehavior,
Science, andand business
Business literature.
Source Ultimate toMethods
identify used to
papers spanning
select and analyze the economics,
results were consistentpublic
withhealth, marketing,Reporting
the Preferred consumer Items
behavior,
forand business Reviews
Systematic
literature. Methods used to select and analyze results were consistent with the Preferred Reporting
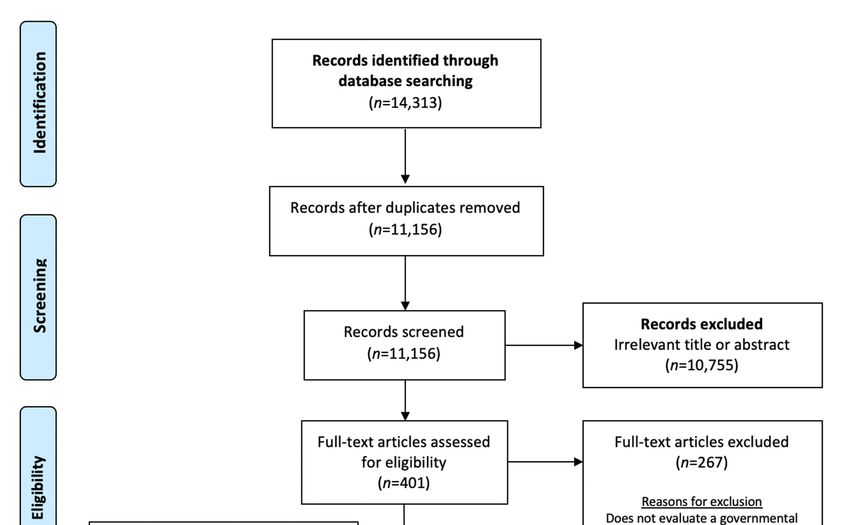
and Meta-Analyses (PRISMA) guidelines (Figure 1) [13].
Items for Systematic Reviews and Meta-Analyses (PRISMA) guidelines (Figure 1) [13].
Figure 1. Preferred Reporting Items for Systematic Reviews and Meta-Analyses (PRISMA) Flow Diagram.
Figure 1. Preferred Reporting Items for Systematic Reviews and Meta-Analyses (PRISMA) Flow
Diagram.
2.1. Policy Identification
To answer the first research question, we reviewed five nutrition policy databases: (1) World
Cancer Research Fund International’s NOURISHING Database [14]; (2) The World Health Organization
Global Database on the Implementation of Nutrition Action [15]; (3) Healthy Food Access Portal [16];
(4) Growing Food Connections Local Government Policy Database [17]; and (5) Healthy Food Policy
Project [18]. From each database, two authors (Y.G. and S.C.) recorded the name, brief summary,Int. J. Environ. Res. Public Health 2020, 17, 7493 4 of 23
date of enactment, and locale of government regulatory or legislative actions, meeting the following
inclusion criteria: (1) implemented in a supermarket setting; (2) enacted in the U.S. as of 26 September
2019; and (3) intended to promote healthy food purchases (with policy intent inferred by the authors
based on subject matter expertise). Policies that had been proposed but not enacted; policies that
may influence food or beverage choices without changes to retailer practices (e.g., food formulation
or front-of-package labeling policies); policies affecting only small stores or other non-supermarket
settings (e.g., a healthy staple food ordinance); or policies that may affect food and beverage purchases,
but were not designed with such intent (e.g., small sales taxes on soda or federal mandates requiring
states to issue Supplemental Nutrition Assistance Program [SNAP] benefits no more than once monthly)
were not included.
2.2. Search Strategy and Inclusion Criteria
Policies identified in this initial search were used to define our search terms, which were developed
in collaboration with an informationist with expertise in public health policy (Appendix A). Papers were
included if they met all of the following criteria: (1) peer-reviewed, original research; (2) conducted in
the U.S.; (3) written in English; (4) evaluated a governmental policy, as defined above; and (5) assessed
outcomes related to retailers (e.g., supermarket or manufacturer sales, revenue, or employment),
consumers (e.g., dietary intake, food purchases, food security, body mass index), or communities
(e.g., healthcare costs). In addition to quantitative evaluations, implementation, mixed methods,
and qualitative research were included. Studies were excluded if they: (1) only assessed outcomes
in small stores or other non-supermarket settings (e.g., availability of healthful foods in convenience
stores); (2) described policy development but did not evaluate policy effects; or (3) described public
comments or public opinion prior to policy enactment. After each search, duplicates were removed
and titles, abstracts, and full texts were independently screened for inclusion by two authors (Y.G. and
S.C.) using Covidence, a software for evidence synthesis (Covidence, Melbourne, Australia). Backward
reference searching of included articles and reviews was conducted to identify additional papers.
A third author (A.J.M.) was available to resolve disagreements (Figure 1).
2.3. Evidence Synthesis
Research was catalogued in alignment with the NOURISHING framework, which classifies
policies into specific actions (e.g., posting calories on menu boards) within ten broad approaches
(e.g., nutrition labeling). Three authors (Y.G., S.C., and A.J.M.) read each article and abstracted data
on study setting (U.S. census region and urbanicity); design (controlled experimental, controlled
quasi-experimental, descriptive (quantitative, including uncontrolled interventions, microsimulations,
and modeling studies); descriptive (qualitative), or mixed/multiple methods); and population (adults,
children, households, or other (e.g., stores, prices, benefit redemptions)). For each study, one study
design was selected, but multiple settings and populations could be selected. Given the large and
varied amount of research reviewed, additional quantitative or meta-analysis was not possible. Instead,
a summary of findings, including outcomes, approaches, and research gaps, was generated using
thematic analysis and narrative synthesis. Results are presented by policy action and approach.
3. Results
We identified 147 peer-reviewed academic research studies for inclusion in this review.
These studies evaluated seven policy actions within three policy approaches (Table 1). The majority
of studies used a descriptive, quantitative (52%) or controlled, quasi-experimental design (37%);
were conducted among adults (48%); and used national data (44%) or were set in the Northeast (30%)
(Table 2). Few studies used experimental (7%), qualitative (4%), or mixed/multiple methods designs
(3%); were conducted among children (24%); or were set in the south (6%), Midwest (7%), or rural
areas (6%).Int. J. Environ. Res. Public Health 2020, 17, 7493 5 of 23
Table 1. Description of policy actions included in the review.
Policy Approach Policy Action Policy Description
The 2010 Affordable Care Act mandated restaurants and similar food retail establishments with 20 or more locations nationwide
disclose the number of calories in prepared foods on menus, menu boards, or in close proximity to food items (“calorie labeling”)
Nutrition Label
Require Calorie (P.L. 111-148, §4205) [19]. Food retailers are also required to display a statement about daily calorie intake (“2000 calories a day is
Standards and
Labeling of used for general nutrition advice, but calorie needs vary”) and must alert consumers that nutrition information for standard menu
Regulations on
Prepared Food in items is available upon request. The federal calorie labeling law differed from previously implemented state and local policies in
The Use of Claims
Supermarkets that it expanded covered food retail establishments to include not only restaurants, but also supermarkets and other venues selling
and Implied
(n = 3) prepared foods. The Food and Drug Administration (FDA) published their final menu labeling rule in December 2014, issued
Claims on Food
draft industry guidance in 2017, and the law took effect on 7 May 2018. The following year, the FDA launched a consumer-facing
nutrition education campaign to encourage the use of calorie information when eating out [20].
SNAP provides monthly food benefits to approximately 36 million low-income Americans [21]. The majority (83%) of SNAP
benefits are spent in supermarkets, totaling about $46 billion annually [21,22]. SNAP benefits are calculated on the assumption
that households will spend 30% of their incomes on food, with SNAP bridging the gap between that contribution and the cost of
the Thrifty Food Plan (a very low cost healthy diet, as determined by the USDA) [23]. Congressional action can increase the
monthly SNAP benefit amount, and Congress has approved benefit increases in response to economic downturns. For example,
in response to the great recession, the American Recovery and Reinvestment Act increased SNAP benefits by an average of 13.6%
Use Economic Increase SNAP
(about $80/month for a family of four) from April 2009 until November 2013 (P.L.111-5, §101). Benefit increases could also be
Tools to Address Benefits (n = 13)
provided by expanding Summer EBT for Children (Summer EBT), which provides benefits to families of students eligible for free
Food Affordability or reduced-price lunch during the summer months, when school is not in session. Additionally, several policies may increase
and Purchase SNAP benefits indirectly, by reducing the number of meals provided to school-aged children by low-income households each
Incentives week [24]. For example, policies that increase school participation in the Community Eligibility Provision, which allows schools or
districts serving a certain percentage of eligible students to provide all students with free breakfast and lunch, may indirectly
increase SNAP benefits among households with children by increasing student participation in school meal programs [25].
Provide Financial The 2014 Farm Bill provided $100 million in mandatory funding for the Food Insecurity and Nutrition Incentive grant program to
Incentives for support programs that provide SNAP participants with financial incentives for the purchase of fruits and vegetables (P.L. 113-79,
Fruits and §4208) [26]. The 2018 Farm Bill expanded and permanently reauthorized this program, renamed the Gus Schumacher Nutrition
Vegetables to Incentive Program (GusNIP), and increased funding to $250 million over five years (P.L. 115-334, §4205). Through GusNIP, the
Low-Income USDA also authorized the Produce Prescription Program, which provides funding to organizations to partner with healthcare
Households providers to provide financial incentives for fresh fruits and vegetables to low-income people at risk of diet-related health
(n = 19) conditions.Int. J. Environ. Res. Public Health 2020, 17, 7493 6 of 23
Table 1. Cont.
Policy Approach Policy Action Policy Description
In 2014, the city of Berkeley, California became the first U.S. city to pass a sweetened beverage excise tax of $0.01 per ounce [27].
Since then, a total of seven U.S. cities and the Navajo Nation have implemented similar taxes. All taxes except that of the Navajo
Tax Sweetened Nation range from $0.01 to $0.02 per ounce. Sweetened beverage taxes typically apply to beverages with added sugar, but may
Beverages (n = 48) also include drinks with low- or no-calorie sweeteners (e.g., the city of Philadelphia, Pennsylvania taxes both calorically and
Use Economic
non-calorically sweetened beverages). Compared to a sales tax, which does not affect the posted retail price, excise taxes on
Tools to Address
beverage distributors can be passed on to consumers through retail price increases (“pass-through”).
Food Affordability
and Purchase In October 2009, as required under the Child Nutrition Act (P.L. 111-296, §17), the USDA reviewed and revised the WIC food
Incentives package to better align with the 2005 Dietary Guidelines for Americans, American Academy of Pediatrics Infant Feeding
Revise the WIC Guidelines, and 2006 Institute of Medicine recommendations [28–30]. The revisions included cash-value vouchers for fruits and
Food Package vegetables, expanded whole grain and low-fat dairy options, reductions in whole milk, juice, eggs, and cheese, and additional
(n = 44) incentives for breastfeeding [31]. WIC-authorized stores were required to stock a minimum variety of fruits, vegetables,
and whole grain products. States have flexibility to determine which specific foods are included in the food package (within
federal guidelines) and may require stricter minimum stocking standards for authorized stores.
Provide Financial
The Healthy Food Financing Initiative (HFFI) was launched in 2011 and formally established at the USDA as part of the 2014 Farm
Assistance to
Bill (P.L. 113-79, §4206) [32]. The goal of the program was to improve access to healthy foods in low-income communities by
Supermarkets to
Set Incentives and building supermarkets or farmers’ markets and improving the quality of foods offered in small stores through grants, loans,
Locate in
Rules to Create a and tax incentives. Between 2011 and 2015, the HFFI awarded $195 million to community development organizations for nearly
Underserved
1000 healthy food access projects in 35 states. Many municipalities operate similar programs at the state or local level [33].
Healthy Retail and Areas (n = 22)
Food Service
The 2014 Farm Bill mandated the USDA Online Purchasing Pilot Program, which tests accepting SNAP/EBT for online grocery
Environment Allow Payment
transactions (P.L. 113-79, §4011) [34]. In 2017, the USDA Food and Nutrition Service announced the selection of seven retailers in
with SNAP for
seven states to participate in the program, which was launched in Amazon, Shoprite, and Walmart in select zip codes in New York
Online Grocery
in April 2019. The program was meant to roll out among the remaining selected states and retailers over the next several years, but
Purchases (n = 4)
has rapidly expanded due to the COVID-19 pandemic. At the time of writing, forty states and five retailers were participating.
Note: The number of studies across all policy actions exceeds 147 because some studies addressed more than one policy action. Abbreviations: SNAP (Supplemental Nutrition Assistance
Program); WIC (Supplemental Nutrition Program for Women, Infants, and Children); EBT (Electronic Benefits Transfer); HFFI (Healthy Food Financing Initiative); USDA (United States
Department of Agriculture).Int. J. Environ. Res. Public Health 2020, 17, 7493 7 of 23
Table 2. Study design features of included articles, by policy action area.
SNAP Fruit and WIC Food Financial
Calorie Sweetened Online
Total Benefit Vegetable Package Assistance for
Study Design Feature Labeling Beverage Tax SNAP/EBT
(n = 147) Increase Incentives Revisions Supermarkets
(n = 3) (n = 48) (n = 4)
(n = 13) (n = 19) (n = 44) (n = 22)
Study Design
Experimental 11 (7%) 0 (0%) 2 (15%) 9 (47%) 0 (0%) 0 (0%) 0 (0%) 0 (0%)
Quasi-experimental 55 (37%) 1 (33%) 8 (62%) 2 (11%) 17 (35%) 14 (32%) 13 (59%) 0 (0%)
Descriptive (Quantitative) 76 (52%) 2 (67%) 3 (23%) 7 (37%) 31 (65%) 25 (57%) 7 (32%) 1 (25%)
Descriptive (Qualitative) 6 (4%) 0 (0%) 0 (0%) 0 (0%) 0 (0%) 4 (9%) 1 (5%) 1 (25%)
Mixed or multiple methods 5 (3%) 0 (0%) 0 (0%) 1 (5%) 0 (0%) 1 (2%) 1 (5%) 2 (50%)
Population
Adults 70 (48%) 2 (67%) 7 (54%) 13 (68%) 20 (42%) 12 (27%) 13 (59%) 3 (75%)
Children 35 (24%) 0 (0%) 3 (23%) 1 (5%) 10 (21%) 19 (43%) 2 (9%) 0 (0%)
Households 38 (26%) 0 (0%) 5 (38%) 9 (47%) 13 (27%) 8 (18%) 3 (14%) 0 (0%)
Other (e.g., stores) 33 (22%) 1 (33%) 1 (8%) 2 (11%) 13 (27%) 10 (23%) 5 (23%) 1 (25%)
U.S. Census Region
National 64 (44%) 1 (33%) 11 (85%) 7 (37%) 26 (54%) 13 (30%) 5 (23%) 1 (25%)
Northeast 44 (30%) 1 (33%) 2 (15%) 8 (42%) 12 (25%) 9 (20%) 11 (50%) 1 (25%)
South 9 (6%) 0 (0%) 0 (0%) 0 (0%) 0 (0%) 5 (11%) 3 (14%) 1 (25%)
Midwest 10 (7%) 0 (0%) 1 (8%) 3 (16%) 2 (4%) 3 (7%) 1 (5%) 0 (0%)
West 30 (20%) 1 (33%) 1 (8%) 1 (5%) 10 (21%) 14 (32%) 2 (9%) 1 (25%)
Urban/Rural *
Urban 54 (37%) 1 (33%) 1 (8%) 9 (47%) 18 (38%) 15 (34%) 11 (50%) 3 (75%)
Rural 9 (6%) 0 (0%) 0 (0%) 6 (32%) 0 (0%) 2 (5%) 1 (5%) 0 (0%)
Not specified or applicable 91 (62%) 2 (67%) 12 (92%) 8 (42%) 31 (65%) 27 (61%) 10 (45%) 1 (25%)
Note: The number of studies across all policy actions exceeds 147 because some studies addressed more than one policy action. Study design categories were mutually exclusive, but some
studies addressed more than one geographic area and/or population. * As described in study (“cities” considered urban).Int. J. Environ. Res. Public Health 2020, 17, 7493 8 of 23
3.1. Nutrition Labeling
Require Calorie Labeling of Prepared Food in Supermarkets
Few (n = 3) studies examined outcomes related to calorie labeling of prepared foods in
supermarkets [35–37] and only one estimated the effects of calorie labels on food choices in a
real-world supermarket setting [35]. Bachman et al. studied 393 women before and after calorie
labeling in nine locations of a regional supermarket using a quasi-experimental design. Only 16% of
study participants exposed to calorie labeling reported noticing the labels, and calorie labels did not
influence food choices, although the sample size was small. In two studies, people trying or wanting
to lose weight were more likely to rate calorie labels as important than people who were satisfied
with their current weight [35,37]. Both studies used self-reported measures of consumer perceptions
to assess the impact of calorie labeling; no studies have measured outcomes using validated dietary
assessment surveys or objective food purchase data.
3.2. Economic Tools to Address Food Affordability and Purchase Incentives
3.2.1. Increase Supplemental Nutrition Assistance Program (SNAP) Benefits
Thirteen studies assessed the effect of increased SNAP benefits (see Table 1 for description of policy) on
household expenditures [38–41], food security [24,40,42,43], dietary behaviors [24,40,43–47], obesity [25],
and healthcare utilization [48], with the majority using experimental (n = 2) or quasi-experimental (n = 8)
designs. Studies indicate that increasing SNAP during the American Recovery and Reinvestment Act
(ARRA) increased food-at-home expenditures but not food-away-from home expenditures [39,41,47],
increased the share of benefits spent at superstores versus small stores [38], and increased spending
on other necessary goods and services, including housing (mortgage, rent, utilities), transportation,
and educational tuition [41]. Studies consistently demonstrated improvements in food security resulting
from the ARRA benefit increase and Summer Electronic Benefits Transfer (EBT), as well as decreases
in food security when the ARRA benefit increase ended [24,40,42,43]. Two studies found that benefit
increases resulting from ARRA significantly reduced, but did not eliminate, declines in energy intake at
the end of the benefit month [44,45], and one study found that ARRA was associated with a 65% reduction
in outstanding medication needs due to cost among SNAP-eligible children [48].
The evidence for improving dietary behaviors and obesity is mixed. Most studies have found null
or limited effects of a SNAP benefit increase on adult dietary quality [43,44,46,47]. A microsimulation
study that directly compared the effects of an increase in SNAP benefits with a targeted subsidy on fruits,
vegetables, and milk found that for the cost, targeted subsidies were more than ten times as effective
in reducing deficiencies of recommended food groups [47]. One study of Summer EBT observed
a small increase in children’s fruit and vegetable, whole grain, and dairy intake, but no change in
consumption of unhealthful foods and beverages [24,40]. One study showed a reduction in BMI among
adults; however, that study assessed the impact of an indirect increase in SNAP benefits resulting
from children’s enrollment in school (and thus, participation in school meal programs), and may have
been confounded by other changes affecting weight that correspond with school enrollment, such as
changes in childcare expenses [25].
3.2.2. Provide Financial Incentives for Fruits and Vegetables to Low-Income Households
Nineteen studies examined the impact of supermarket fruit and vegetable subsidies, incentives,
vouchers, or prescriptions targeted towards low-income households or individuals [47,49–66].
Results from randomized trials and natural experiments consistently demonstrate increases in
household fruit and vegetable purchases or adult fruit and vegetable intake when incentives are targeted
towards SNAP participants [50–58]; yet, few studies have been conducted with children [52]. Studies
assessing substitution found little evidence that fruit and vegetable incentives changed unhealthful
food intake or expenditures [51–53,59]. Intervention effects, however, may not be sustained afterInt. J. Environ. Res. Public Health 2020, 17, 7493 9 of 23
the financial incentive ends [54,57]. Although incentive programs in supermarkets would have high
start-up costs if implemented nationally, they are expected to be cost-saving in the long-term, largely
due to reductions in type 2 diabetes, heart disease, and stroke [60–63]. Compared to research on SNAP
incentives, there are limited data on produce prescription programs, which, to date, have been most
frequently implemented in farmers’ markets or other limited-service food retail settings [49].
When the design and delivery of incentive programs are considered, the impacts on purchasing
and consumption may increase with the size of the incentive. For example, the Healthy Incentives
Pilot, which provided a 30% incentive on fruits and vegetables, saw a 26% increase (equivalent to
approximately 14 serving per day) in consumption among adults participating in SNAP, while the Shop
Five for ME study, which provided a 50% incentive, found a 54% increase in fruit and vegetable purchases
among SNAP households [52,53]. Additionally, incentives delivered as same-day discounts versus
future rebates, administered electronically versus as paper coupons or vouchers, and offered without a
minimum purchase requirement may increase uptake by lower-income households [52,55–57]. Frequent
engagement with participating households and store staff about how the incentives work, which items
qualify, and where they can be used may also be important for increasing utilization [49,52,56,58].
Complementary interventions focused on changing policies or environments to reduce unhealthy food
purchases appear more effective in improving total diet quality at the population level than nutrition
or cooking education, which tend to have low participation [51,52,59,61,63].
3.2.3. Tax Sweetened Beverages
Forty-eight studies evaluated the impact of sweetened beverage excise taxes on a variety of
behavioral, economic, and health outcomes in the U.S [5,60,63–65,67–109]. Evidence from real-world
natural experiments shows that these taxes increase retail prices, although pass-through (the proportion
of the tax that is passed on to the consumer) varies by city, store type, and beverage type and
size [70,71,73,77,98,100]. Excise taxes reduce sales of taxed beverages, but the magnitude of the
reduction is highly variable across cities [68,98,100,101]. For example, a $0.01 per ounce tax on
calorically sweetened beverages in Berkeley, California was associated with a 9.6% decline in sugary
drink sales volume in Berkeley supermarkets after one year [100]. In a natural experiment, a $0.015
per ounce tax on calorically and non-calorically sweetened beverages in Philadelphia, Pennsylvania
was associated with a 38% reduction in taxed beverage volume sales after accounting for people
who avoided the tax by purchasing sweetened beverages outside city limits [98]. Differences across
studies may be due to baseline purchasing habits or income of the population, size of the tax, types of
beverages included in the tax, the proportion of the population able to easily avoid the tax (i.e., by
shopping in a bordering city), or tax salience.
There are less consistent data on changes in beverage consumption, total diet, or health outcomes,
particularly among children. Evidence on dietary intake is mixed, possibly due to measurement error in
dietary assessment tools and inadequate sample sizes [69,78,90,100,108]. For example, one study found
a statistically significant reduction in sales of sugary drinks and increase in sales of untaxed beverages,
but no statistically significant change in adult beverage intake one year after the Berkeley tax [100].
Another study one year after a Philadelphia tax found no changes in children’s beverage intake overall,
but significant reductions in sugary drink intake among children who were high consumers prior to the
tax [71]. There are limited quantitative data on the long-term (>1 year) effects of sweetened beverage
taxes; one study of the earliest tax in Berkeley found an average reduction in sugary drink consumption
(−0.55 times/day) and increased water consumption (+1.02 times/day) among adults 3 years after the
tax [90]. Modeling studies with varying assumptions consistently show taxes improve long-term
health outcomes related to obesity, cardiovascular disease, and diabetes among adults, and reduce
childhood obesity [5,60,63–65,84,87,91,93,94,96,99,103,104]. Several of these studies suggest a tax on
calories or sugar in beverages may better target health harms and encourage industry reformulation,
but these taxation strategies have not yet been implemented in the U.S [85,86,106,109].Int. J. Environ. Res. Public Health 2020, 17, 7493 10 of 23
Economic research shows taxes are highly cost-saving from a public health and societal perspective,
but may be costly to industry [104], with some studies documenting reduced supermarket combined
sales [98], reduced sugar producer revenues [76,104], and increased cross-border shopping in cities
with a tax (which may not be detrimental to supermarkets if shoppers visit the same chain in a different
city) [69,70,98,100]. Although the food and beverage industries frequently voice concerns over job
loss resulting from taxation, no job loss in these industries within the first year of a tax has been
documented [89,97]. Strong and consistent evidence shows that beverage taxes raise revenue for
city programs, such as parks and early childhood education, and these investments may affect social
determinants of health [76,88]. For example, a simulation of Philadelphia’s tax found that investments
in quality pre-kindergarten would further reduce sugary beverage consumption among young children
by 8% [88].
3.2.4. Revise Composition and Quantities of Foods Provided through the USDA Special Supplemental
Nutrition Program for Women, Infants and Children (WIC)
Forty-four studies assessed the association between the 2009 WIC food package revisions and
availability of foods and beverages in supermarkets; purchases, redemptions, or dietary intake among
WIC participants; obesity in early childhood; perinatal and birth outcomes; or outcomes related to
breastfeeding [110–153]. There is consistent evidence of an association between the WIC food package
revisions and improvements in household food purchases and dietary intake among both adults and
children [111,114–116,119,121,135–140,145,147–149,151]. Specifically, revisions to the food package are
associated with improvements in total diet quality, increases in fruit, vegetables, whole grains, dietary
fiber, and low-fat dairy, and reductions in full-fat dairy, saturated fat, and juice (with no evidence of
complete substitution to other sugary drinks). The cash-value voucher, in particular, increased the
perceived value of the program for many participants, although voucher redemption varied across
communities and may be limited in some areas by poor access to fresh fruits and vegetables or negative
store experiences [112,113,117,123,128,131,132,146]. Impacts of the revisions on breastfeeding are
mixed, with some studies showing increases in breastfeeding initiation [129,153], others showing no
effect [118], and none finding a relationship with breastfeeding at six months [129,153]. Recent research
using interrupted time series or controlled quasi-experimental designs show improvements in maternal
and child health outcomes resulting from the food package changes, including reductions in infant and
young child obesity [125–127,130], improvements in infant birth weight outcomes (low birth weight,
small for gestational age, and large for gestational age) [120], and reductions in maternal weight gain
and preeclampsia [120].
With regard to the retail food environment, several studies have documented changes in WIC
food availability, variety, quality, or pricing after implementation of the food package revisions and
minimum stocking requirements [133,134,141–144,152]. While outcomes have generally been positive
for small and medium-sized stores (i.e., greater availability and lower prices of healthful foods), results
in supermarkets and mass merchandisers are mixed, likely due to the wide variety of food options
offered in these stores at baseline. It is important to note that, in addition to the federal requirements,
states have the authority to establish stronger stocking requirements for authorized retailers and there
is substantial variation in regulatory guidance across states [142]. Variation in minimum stocking
standards, as well as other flexibilities in how WIC programs are administered at the state and local
levels, may partially explain observed differences in program impacts across localities; however,
this has not been well studied [130].
3.3. Incentives and Rules to Create a Healthy Retail Environment
3.3.1. Provide Financial Assistance to Supermarkets to Locate in Underserved Areas
Twenty-two studies assessed the impacts of new supermarkets locating in underserved areas.
Though many community residents support the introduction of a new supermarket [154], studies,Int. J. Environ. Res. Public Health 2020, 17, 7493 11 of 23
including many using controlled, quasi-experimental designs, show low adoption of the new
supermarket [155–157] and little or no improvement in body mass indices [155,158–162], household
food purchases [156,157,163,164], or dietary intake [155–160,165] attributable to the new store.
Similarly, modeling studies show these interventions are less cost-effective for supporting the
introduction of new stores and increasing shopping at supermarkets than policies that increase
SNAP benefits or coverage [38,166]. However, distance to the store, health and economic characteristics
of the community, and baseline shopping habits within the population, may be important effect
modifiers [167,168]. Additionally, supermarkets may positively impact health independent of effects on
diet. One longitudinal natural experiment showed no improvement in dietary intake, but reductions
in SNAP participation, food insecurity, and diagnoses of high cholesterol and arthritis one year after
the opening of a new store [169]; however, the mechanism through which these positive health effects
occurred is unclear. Several studies have suggested that investments in healthy retail may positively
impact health by improving economic opportunity, social cohesion, or safety, but these mechanisms
have not been studied [168,170,171].
3.3.2. Allow Payment for Online Grocery Purchases with SNAP
No research has studied the effects of online grocery shopping on the diets of SNAP participants, but
several recent studies provide insight on the availability and uptake of online SNAP purchases [172–175].
Three studies have shown that, while online grocery can address transportation barriers and food
availability, perceptions related to higher food costs online, lack of control over food quality, and distrust
of the online shopping process may prevent SNAP participants from utilizing these services [173–175].
One attempted trial was unable to recruit enough SNAP participants to make online grocery purchases,
mainly due to participants’ perceived lack of control over the quality of food selected [174]. Additionally,
a recent study found that online grocery delivery services disproportionately serve urban areas; services
are rarely available in rural areas [172]. It will be important to continue to monitor equitable access
to online grocery shopping and delivery over the course of the COVID-19 pandemic, particularly in
communities and sub-populations at the highest risk of infection.
4. Discussion
This integrative review aimed to identify governmental policies enacted in the U.S. to promote
healthy choices in supermarkets and to synthesize the academic literature on these policies’ effects.
We identified 147 papers in seven policy areas: calorie labeling, SNAP benefit increases, financial
incentives to purchase fruit and vegetables, sweetened beverage taxes, revisions to the WIC food
package, financial assistance for supermarkets to locate in underserved areas, and allowing online
purchases with SNAP. The majority of identified papers were related to sweetened beverage taxes
(33%), followed by revisions to the WIC food package (30%), and financial incentives for supermarkets
(15%); few studies assessed calorie labeling of prepared foods in supermarkets (2%) or online SNAP
(3%). Most studies leveraged natural experiments to evaluate policy effects, utilizing controlled,
quasi-experimental study designs, microsimulation or agent-based modeling, longitudinal approaches,
and interrupted time series methods; very few studies employed experimental, qualitative, or mixed
methods approaches. With regard to population, many studies were conducted among adults, except in
the case of WIC food package revisions, in which studies of young children were more common.
Studies frequently used national data or data collected in Northeastern or Western U.S. cities.; far fewer
studies were set in the Southern or Midwestern U.S. or in rural areas.
When effects were compared across policy action, we found consistent evidence, including from
real-world randomized trials and natural experiments, of an association between economic tools
to address food affordability and dietary behaviors. Specifically, sweetened beverage taxes were
associated with increased prices and decreased purchases of taxed beverages, revisions to the WIC
food package were associated with improvements in total diet quality and maternal/child health
outcomes, and fruit and vegetable incentives increased purchases and consumption of discountedInt. J. Environ. Res. Public Health 2020, 17, 7493 12 of 23
foods. In modeling studies, all three policies reduced the incidence of cardiometabolic diseases and
were cost-effective in the long-term, but those restricting or discouraging consumption of unhealthful
foods (i.e., taxes, WIC revisions) showed greater gains than those solely encouraging consumption of
healthful foods (i.e., incentives). When incentives were paired with restrictions or taxes on unhealthful
purchases, however, their combined effects on dietary behaviors were greater than those of any
single policy action. This highlights the importance of multiple, synergistic policy interventions
delivered together.
In contrast to the economic levers described above, financial assistance for supermarkets to open
in underserved neighborhoods and increases in the SNAP benefit amount had little effect on diet,
but reduced food insecurity. Food insecurity is associated with a wide range of negative outcomes,
including increased risk of obesity and cardiometabolic diseases [176], poor mental health [177],
and poor early childhood development [178]. Thus, these policy interventions could improve
long-term health by reducing food insecurity, but these mechanisms have not yet been studied.
Longitudinal natural experiments are needed to understand the role of supermarkets in neighborhood
revitalization and the complex relationship between economic development strategies and improved
health of neighborhood residents.
This review exposed several gaps in the literature that could be addressed in future research. First,
research on calorie labeling of prepared foods in supermarkets and online SNAP is nascent and could be
examined using natural experiments or interrupted time series designs. Second, very little research has
been conducted in rural areas or in the Southern or Midwestern U.S.—regions with a disproportionately
high prevalence of obesity and related health conditions [179]. Similarly, few studies assessed policy
impacts on racial or socioeconomic disparities. While some policies may not substantially improve
average dietary intake, they may contribute to improving equity. Third, although this review sought to
include a wide range of outcomes, most studies evaluated policy effects on food security, household
purchases, dietary intake, or obesity. Other important health-related outcomes, such as changes to
social norms, parental feeding practices, and modeling of healthful behaviors, are needed and could
be assessed using qualitative or mixed methods. Fourth, very few studies examined outcomes of
importance to retailers, such as customer loyalty or sales revenue, which could help foster retail
partnerships and industry buy-in. Fifth, policy implementation was rarely addressed. Implementation
of federal policies often varies at the state level, and state and local policies with similar goals often
differ in scope. This variation in implementation could explain variation in outcomes across settings,
but it has not been quantitatively or qualitatively assessed. Similarly, process outcomes, such as
policy adoption, acceptability, or fidelity, were infrequently measured and could help explain null
effects. Lastly, many quasi-experimental studies were limited by small sample sizes and crude
dietary assessment tools, which may have limited investigators’ abilities to detect small policy effects.
Investigators should carefully consider required sample sizes and appropriate dietary assessment
methods to avoid false null findings, which can be detrimental to policy and advocacy efforts.
Strengths and Limitations
This review has several limitations and strengths that should be considered. In line with the
project aims, a large amount of literature was reviewed and, thus, strength and quality of evidence
was not quantitatively assessed but rather qualitatively synthesized. As a means to limit included
studies to the highest quality papers, non-academic, non-peer reviewed sources were not included.
This decision likely led to exclusion of some important evidence, such as reports commissioned by
the USDA or other agencies or organizations. It also excludes industry reports, which may be more
likely to assess outcomes relevant to retailers. We did not include food formulation, front-of-pack,
or back-of-pack labeling policies in this review, although such policies could theoretically influence
the types of products stocked or how they are priced or promoted within the store. Strengths of the
study include extraction of relevant policies from five policy databases, comprehensive search strings
and database searches across the psychology, economics, business, marketing, policy, and publicInt. J. Environ. Res. Public Health 2020, 17, 7493 13 of 23
health literature, inclusion of a wide range of effects on individuals, retailers, and community health,
and narrative comparison of effects across seven distinct policy actions.
5. Conclusions
Governmental policies, particularly sweetened beverage taxes, revisions to the WIC food package,
and financial incentives for fruits and vegetables, are associated with improvements in dietary behaviors.
Providing financial incentives to supermarkets to open in underserved areas and increases in SNAP
benefits are not associated with changes in food purchasing or diet quality but may improve food
security. More research is needed to understand the effects of calorie labeling in supermarkets and
allowing online purchases with SNAP.
Author Contributions: Conceptualization, A.J.M., A.P.; Methodology, A.J.M., A.G., C.A.R.; Formal analysis,
A.J.M., Y.G., S.C.; Investigation, S.C. and Y.G.; Data curation, S.C. and Y.G.; Writing—original draft preparation,
A.J.M.; Writing—review and editing, A.J.M., Y.G., S.C., A.G., A.P., C.A.R.; Visualization, A.J.M.; Supervision,
A.J.M., A.P., A.G., C.A.R.; Project administration, A.J.M.; Funding acquisition, A.P., A.J.M. All authors have read
and agreed to the published version of the manuscript.
Funding: This research was supported by the Johns Hopkins Center for a Livable Future. Publication fees were
supported by Healthy Eating Research, a national program of the Robert Wood Johnson Foundation.
Acknowledgments: A version of this work was presented at the January 2020 Healthy Retail Research Convening
in Washington, D.C. The authors would like to thank the meeting attendees for their constructive feedback,
and Donna Hesson for her assistance in developing the search strategy for this paper.
Conflicts of Interest: The authors declare no conflict of interest. The funders had no role in the design of the
study; in the collection, analyses, or interpretation of data; in the writing of the manuscript, or in the decision to
publish the results.
Appendix A. Search Terms
Search #1
Terms related to supermarket
(grocer* OR supermarket OR store OR Retail* OR outlet OR e-commerce OR mercado)
AND
Terms related to food and beverage
food OR foods OR beverage* OR fruit OR fruits OR vegetable* OR snack* OR drink OR drinks OR lunch OR
dinner* OR breakfast OR meat OR poultry OR beef OR chicken OR fish OR milk OR cheese OR yogurt OR juice
OR soda OR grain OR grains OR meal OR bean OR beans OR nut OR nuts OR candy OR sweets OR cookies
OR chips OR “ice cream” OR sugar OR salt OR sugar-sweetened OR “sugar sweetened” OR sweet OR
nutrition* OR calorie OR calories
AND
Terms related to policy
policy OR policies OR Law OR laws OR regulat* OR ordinance* OR statute* OR tax OR taxes OR taxation OR
incentive* OR “healthy food financing” OR subsid* OR “menu labeling” OR “calorie labeling” OR WIC OR
“supplemental nutrition” OR “food stamps” OR access OR rule OR rules OR “retail expansion” OR
“community development” OR “food trust” OR “food desert” OR loan OR loans OR “healthy food business”
OR “healthy neighborhood” OR “federal nutrition program” OR “fresh food fund” OR “grocery financing” OR
zoning OR “minimum stocking” OR “staple food” OR “excess food” OR “food waste” OR “grocery store
development program” OR “closer to my grocer” OR license OR licensing OR permit OR permitting OR
“Baton Rouge” OR frameworks OR “grocery access” OR “fresh food financing” OR “supermarket access” OR
“healthy food center” OR “neighborhood development” OR “healthy families” OR “fresh food retailer”
Search #2
Terms related to beverage taxes
(“sweetened beverage*” OR “sugary drink*” OR “sugary beverage*”) AND (tax OR taxes OR taxation)Int. J. Environ. Res. Public Health 2020, 17, 7493 14 of 23
Search #3
Terms related to SNAP benefit increases
(ARRA OR (benefit AND increase)) AND “Supplemental Nutrition Assistance Program”
Search #4
Terms related to WIC food package revisions
((WIC AND (fruit* OR vegetable*) AND voucher)
OR
(((WIC OR “Special Supplemental Nutrition Program for Women, Infants, and Children”) AND (“food
package OR revisions))) AND (“2014/04”[Date–Publication]: “3000”[Date-Publication]))
Search #5
Terms related to the online purchasing pilot
“online grocery” OR “online purchas* pilot” OR (online AND shopping AND “Supplemental Nutrition
Assistance Program”)
Search #6
Terms related to produce prescription programs
((fruit OR vegetable* OR produce) AND (prescription OR rx)) AND (supermarket OR grocer*)
References
1. Afshin, A.; Sur, P.J.; Fay, K.A.; Cornaby, L.; Ferrara, G.; Salama, J.S.; Mullany, E.C.; Abate, K.H.; Abbafati, C.;
Abebe, Z. Health effects of dietary risks in 195 countries, 1990–2017: A systematic analysis for the Global
Burden of Disease Study 2017. Lancet 2019, 393, 1958–1972. [CrossRef]
2. Jardim, T.V.; Mozaffarian, D.; Abrahams-Gessel, S.; Sy, S.; Lee, Y.; Liu, J.; Huang, Y.; Rehm, C.; Wilde, P.;
Micha, R. Cardiometabolic disease costs associated with suboptimal diet in the United States: A cost analysis
based on a microsimulation model. PLoS Med. 2019, 16, e1002981. [CrossRef] [PubMed]
3. Hoffman, J.S.; Salerno, J.; Moss, A.; Dunne, B.; Fineberg, H.V.; Brownell, K.D. The Weight of the Nation:
Surprising Lessons About Diets, Food, and Fat from the Extraordinary Series from HBO Documentary Series;
St. Martin’s Press: New York, NY, USA, 2012.
4. Food-PRICE: Food Policy Review and Intervention Cost-Effectiveness. Available online: https://www.food-
price.org/ (accessed on 28 July 2020).
5. Gortmaker, S.L.; Long, M.W.; Resch, S.C.; Ward, Z.J.; Cradock, A.L.; Barrett, J.L.; Wright, D.R.; Sonneville, K.R.;
Giles, C.M.; Carter, R.C. Cost effectiveness of childhood obesity interventions: Evidence and methods for
CHOICES. Am. J. Prev. Med. 2015, 49, 102–111. [CrossRef] [PubMed]
6. Mancino, L.; Guthrie, J.; Ver Ploeg, M.; Lin, B.-H. Nutritional Quality of Foods Acquired by Americans: Findings
from USDA’s National Household Food Acquisition and Purchase Survey; United States Department of Agriculture,
Economic Research Service: Washington, DC, USA, 2018.
7. Ver Ploeg, M.; Mancino, L.; Todd, J.E.; Clay, D.M.; Scharadin, B. Where Do Americans Usually Shop for Food and
How Do They Travel to Get There? Initial Findings from the National Household Food Acquisition and Purchase
Survey; United States Department of Agriculture, Economic Research Service: Washington, DC, USA, 2015.
8. Glanz, K.; Bader, M.D.; Iyer, S. Retail grocery store marketing strategies and obesity: An integrative review.
Am. J. Prev. Med. 2012, 42, 503–512. [CrossRef]
9. Cohen, D.A.; Bogart, L.; Castro, G.; Rossi, A.D.; Williamson, S.; Han, B. Beverage marketing in retail outlets
and The Balance Calories Initiative. Prev. Med. 2018, 115, 1–7. [CrossRef]
10. Shan, Z.; Rehm, C.D.; Rogers, G.; Ruan, M.; Wang, D.D.; Hu, F.B.; Mozaffarian, D.; Zhang, F.F.;
Bhupathiraju, S.N. Trends in dietary carbohydrate, protein, and fat intake and diet quality among US
adults, 1999–2016. JAMA 2019, 322, 1178–1187. [CrossRef]
11. An FTC Staff Study. Slotting Allowances in the Retail Grocery Industry: Selected Case Studies in Five Product
Categories; Federal Trade Commission: Washington, DC, USA, 2003.
12. Rivlin, G. Rigged Supermarket Shelves for Sale; Center for Science in the Public Interest: Washington, DC, USA, 2016.
13. Moher, D.; Liberati, A.; Tetzlaff, J.; Altman, D.G.; Group, P. Preferred reporting items for systematic reviews
and meta-analyses: The PRISMA statement. PLoS Med. 2009, 6, e1000097. [CrossRef]
14. World Cancer Research Fund. NOURISHING Database; World Cancer Research Fund International:
London, UK, 2018.Int. J. Environ. Res. Public Health 2020, 17, 7493 15 of 23
15. World Health Organization. Global database on the Implementation of Nutrition Action (GINA). In World
Health Organization; World Health Organization: Geneva, Switzerland, 2012.
16. Healthy Food Access Portal. Healthy Food Financing Funds. Available online: https://extranet.who.int/
nutrition/gina/en/home/ (accessed on 28 July 2020).
17. Growing Food Connections, Briefs. Growing Food Connections; Metropolitan Universities: Towson, MD, USA,
2017; p. 1.
18. Healthy Food Policy Project. Available online: https://healthyfoodpolicyproject.org/ (accessed on 11 October 2020).
19. Food and Drug Administration. Menu Labeling Requirements. Available online: https://www.fda.gov/food/
food-labeling-nutrition/menu-labeling-requirements (accessed on 28 July 2020).
20. Food and Drug Administration. Menu Labeling Social Media Toolkit for Consumer Outreach.
Available online: https://www.fda.gov/food/nutrition-education-resources-materials/menu-labeling-social-
media-toolkit-consumer-outreach (accessed on 28 July 2020).
21. Supplemental Nutrition Assistance Program Participation and Costs; United States Department of Agriculture,
Food and Nutrition Services: Washington, DC, USA, 2020.
22. Center on Budget and Policy Priorities. Chart Book: SNAP Helps Struggling Families Put Food on the Table.
Available online: https://www.cbpp.org/sites/default/files/atoms/files/3-13-12fa-chartbook.pdf (accessed on
28 July 2020).
23. Center on Budget and Policy Priorities. Policy Basics: The Supplemental Nutrition Assistance Program
(SNAP). Available online: https://www.cbpp.org/research/food-assistance/policy-basics-the-supplemental-
nutrition-assistance-program-snap (accessed on 8 October 2020).
24. Gordon, A.R.; Briefel, R.R.; Collins, A.M.; Rowe, G.M.; Klerman, J.A. Delivering summer electronic benefit
transfers for children through the supplemental nutrition assistance program or the special supplemental
nutrition program for women, infants, and children: Benefit use and impacts on food security and foods
consumed. J. Acad. Nutr. Diet. 2017, 117, 367–375. [CrossRef] [PubMed]
25. Almada, L.N.; Tchernis, R. Measuring effects of SNAP on obesity at the intensive margin. Econ. Hum. Biol.
2018, 31, 150–163. [CrossRef]
26. United States Department of Agriculture. Local and Regional Foods. Available online: https://www.ers.
usda.gov/agriculture-improvement-act-of-2018-highlights-and-implications/local-and-regional-foods/
(accessed on 28 July 2020).
27. Healthy Food America. TAXING SUGARY DRINKS. Available online: http://www.healthyfoodamerica.
org/taxing_sugary_drinks#:~{}:text=The%20evidence%20of%20harm%20from,diet%20drinks%20in%
20beverage%20taxes (accessed on 28 July 2020).
28. Institute of Medicine. WIC Food Packages: Time for a Change; The National Academies Press:
Washington, DC, USA, 2006.
29. Dietary Guidelines for Americans; United States Department of Health and Human Services, United States
Department of Agriculture: Washington, DC, USA, 2005.
30. Kleinmann, R. Pediatric Nutrition Handbook; American Academy of Pediatrics: Elk Grove Village, IL, USA, 2004.
31. United States Department of Agriculture. Final Rule: Revisions in the WIC Food Packages. Available online:
https://www.fns.usda.gov/wic/fr-030414 (accessed on 28 July 2020).
32. The Food Trust. Special Report: HFFI Impacts. Available online: http://thefoodtrust.org/administrative/hffi-
impacts (accessed on 28 July 2020).
33. Lange, S.J.; Moore, L.V.; Galuska, D.A. Local government retail incentives for healthier food retailers in the
USA, 2014. Public Health Nutr. 2019, 22, 2521–2529. [CrossRef] [PubMed]
34. United States Department of Agriculture. FNS Launches the Online Purchasing Pilot. Available online:
https://www.fns.usda.gov/snap/online-purchasing-pilot (accessed on 28 July 2020).
35. Bachman, J.L.; Arigo, D. Reported Influences on Restaurant-Type Food Selection Decision Making in a
Grocery Store Chain. J. Nutr. Educ. Behav. 2018, 50, 555–563. [CrossRef] [PubMed]
36. Cleveland, L.P.; Simon, D.; Block, J.P. Compliance in 2017 with Federal Calorie Labeling in 90 Chain Restaurants
and 10 Retail Food Outlets Prior to Required Implementation. Am. J. Public Health 2018, 108, 1099–1102.
[CrossRef]You can also read