Cost-Benefit Analysis of Policy Option Scenarios for the Clean Air for Europe programme - European Commission
←
→
Page content transcription
If your browser does not render page correctly, please read the page content below

AEAT/ ED48763001/ABC Scenarios. Issue 2

Cost-Benefit Analysis of Policy
Option Scenarios for the Clean
  Air for Europe programme

                            August 2005

Service Contract for Carrying out Cost-Benefit Analysis of Air
Quality Related Issues, in particular in the Clean Air for Europe
                     (CAFE) Programme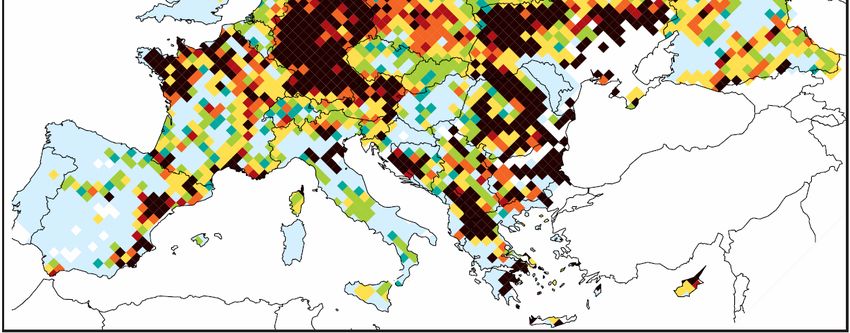
AEAT/ ED48763001/ABC Scenarios. Issue 2

Title                     Cost-benefit analysis of policy option scenarios for the
                          Clean Air for Europe programme for
                          Service Contract for carrying out cost-benefit analysis of air
                          quality related issues, in particular in the clean air for Europe
                          (CAFE) programme

Customer                  European Commission DG Environment

Customer reference        ENV.C.1/SER/2003/0027

Confidentiality,          This document has been prepared by AEA Technology plc in
copyright and             connection with a contract to supply goods and/or services and
reproduction              is submitted only on the basis of strict confidentiality. The
                          contents must not be disclosed to third parties other than in
                          accordance with the terms of the contract.

Validity                  Issue 2

File reference

Reference number          AEAT/ ED48763001/ CBA-CAFE ABC scenarios

                 AEA Technology Environment
                 The Gemini Building, Fermi Avenue
                 Harwell International Business Centre
                 Didcot, OX11 0QR, United Kingdom

                 Telephone +44 (0) 870 190 6592
                 Facsimile +44 (0) 870 190 6318
                 Email: paul.watkiss@aeat.co.uk

                 AEA Technology Environment is a business division of
                 AEA Technology plc

                 AEA Technology Environment is certificated to ISO9001 & ISO 14001

                          Name                                Signature               Date
Authors                   Benefits assessment,
                          uncertainty analysis
                          Mike Holland (EMRC)
                          Paul Watkiss, Steve Pye (AEA
                          Technology)
                          GEM-E3 analysis:
                          Ana de Oliveira, Denise Van
                          Regemorter
Reviewed by               Paul Watkiss

Approved by               Paul Watkiss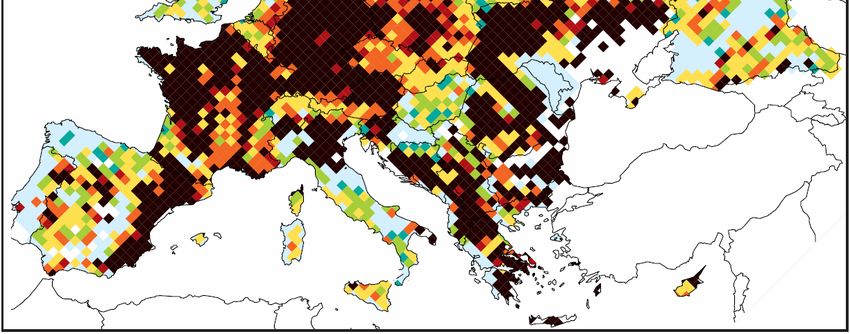
AEAT/ ED48763001/ABC Scenarios. Issue 2

Executive Summary
In May 2001, the European Commission launched the Clean Air for Europe (CAFE)
Programme – a knowledge based approach with technical/scientific analyses and policy
development that will lead to the adoption of a Thematic Strategy on Air Pollution, fulfilling
the requirements of the Sixth Environmental Action Programme. Its aim is to develop a long-
term, strategic and integrated policy advice for ‘achieving levels of air quality that do not give
rise to significant negative impacts on and risks to human health and the environment’;
including ‘no exceedance of critical loads and levels for acidification or eutrophication’.

This report presents the cost-benefit analysis of a series of policy scenarios (labelled A, B and
C) proposed for the CAFE programme. These scenarios define low (A), medium (B) and
high (C) ambition levels for reducing the impacts of ozone and fine particles on health, and
acidification and eutrophication on ecosystems:

Table i) Selected numerical values of the effect indicators for the CAFE scenarios

                                             CLE        A           B           C         MTFR
 Years of life lost due to PM2.5 (EU-wide,   137       110         104         101         96
 million YOLLs)
 Acidification (country-wise gap closure     0%        55%         75%         85%        100%
 on cumulative excess deposition)
 Eutrophication (country-wise gap closure    0%        55%         75%         85%        100%
 on cumulative excess deposition)
 Ozone (country-wise gap closure on          0%        60%         80%         90%        100%
 SOMO35)

The term ‘gap closure’ here relates to the gap between the CLE (baseline) and MTFR
(Maximum Technical Feasible Reduction) scenarios. Residual damage, even under the
MTFR scenario, can be substantial, as reference to the top row of the table, dealing with years
of life lost to fine particle exposure demonstrates.

The analysis takes as its starting point pollution data generated by the EMEP and RAINS
models for the current legislation (CLE), A, B, C and MTFR scenarios. Benefits are assessed
using the CAFE CBA methodology, developed following extensive consultation with CAFE
stakeholders, including WHO and other European expert groups and independent peer review.

Benefits are assessed for the following receptors:
• Health (mortality and morbidity), impacts and monetary equivalent;
• Materials (buildings), impacts and monetised damages;
• Crops, impacts and monetised damages;
• Ecosystems (freshwater and terrestrial, including forests), impacts in terms of critical
   loads and levels exceedance, but without monetisation.

A final section deals with macroeconomic impacts, assessed using the GEM-E3 model.

Health benefits across the EU
Core estimates of health impacts from exposure to ozone and fine particles are shown in
Table ii). These results link ozone exposure to 22,000 deaths in the EU25 in 2020, with a
reduction to around 18,000 cases per year possible. For particles, the numbers are larger, with
2.5 million life years lost in 2020 under current legislation, falling to around 1.8 million under

                                                   i
AEAT/ ED48763001/ABC Scenarios. Issue 2

Scenario C. The table also shows that air pollution is likely to cause many thousands of
hospital admissions each year and many millions of days of ill health across the EU25.

Table ii) Estimated annual health impacts due to air pollution in 2020 in EU25 under
current legislation and under Scenarios A, B, C and MTFR. Units: Thousands.
End Point Name                                            CLE 2020            A          B         C     MTFR
Ozone effects
Acute Mortality (thousand premature deaths)                      22         19         19         18         18
Respiratory Hospital Admissions (thousands)                      20         19         18         18         17
Minor Restricted Activity Days (thousands)                  42,000      39,000     38,000     37,000     36,000
Respiratory medication use (thousand days, children)        13,000      12,000     12,000     12,000     11,000
Respiratory medication use (thousand days, adults)           8,200       7,500      7,300      7,200      7,000
Cough and LRS (thousand days children)                      65,000      60,000     59,000     58,000     56,000
PM effects
Chronic Mortality1) – thousand years of life lost (YOLLs)    2,500       2,000      1,900      1,800      1,700
Chronic Mortality1) – thousand deaths                          270         220        210        200        190
Infant Mortality (0-1yr) – thousand deaths                     0.35       0.28       0.27       0.26       0.25
Chronic Bronchitis (thousand cases, adults)                     128        103         97         94         90
Respiratory Hospital Admissions (thousands)                      42         34         32         31         30
Cardiac Hospital Admissions (thousands)                          26         21         20         19         18
Restricted Activity Days (thousands)                       220,000     180,000    170,000    160,000    160,000
Respiratory medication use (thousand days, children)         2,000       1,600      1,500      1,500      1,400
Respiratory medication use (thousand days, adults)          21,000      17,000     16,000     15,000     15,000
Lower Respiratory Symptom days (thousands, children)        89,000      71,000     67,000     65,000     62,000
Lower Respiratory Symptom days (thousands, adults)         210,000     170,000    160,000    150,000    150,000
Note 1) For chronic mortality (PM), two alternative values are presented, based on quantification using years of
life lost and numbers of premature deaths). The two measures are not additive.

These health effects have been converted to their monetary equivalent, and added to give a
range based on alternative methods for mortality valuation (Table iii).

Table iii) Core estimates of annual health damage and benefits due to air pollution in
2020 in EU25, with different policy scenario levels, and under a MTFR scenario.
                                                             Billion Euro/year
Total Damage                            CLE              A            B           C                  MTFR
Low estimate                            189             152          144         140                   133
High estimate                           609             489          463         449                   427
Benefit over CLE baseline                                A            B           C                  MTFR
Low estimate                                             37           45          49                    56
High estimate                                           120          146         160                   181
                                                     from CLE      from A      from B                from C
Incremental Benefits
                                                        to A         to B        to C              to- MTFR
Low estimate                                             37            8           4                     7
High estimate                                           120           26          13                    22

Table iii) shows that the health benefits of the alternative ambition levels range from €37 to
120 billion/year (scenario A) up to €49 to 160 billion/year (scenario C). The additional
(incremental) benefits fall with successive scenario, i.e. the incremental benefits of moving
from the scenario A to scenario B are greater (at €8 to 26 billion/year) than from scenario B to
C (at €4 to 13 billion/year).

                                                       ii
AEAT/ ED48763001/ABC Scenarios. Issue 2

Non-health impacts
Damage to crops from ozone exposure and to materials from acidic deposition in the year
2020 is estimated here to cause around €2.2 billion of damage a year under the CLE baseline.
Scenarios A to C yield benefits of between €0.5 to 0.8 billion/year.

Damage to ecosystems has not been monetised as there is currently no adequate basis to
perform such analysis. However, information on critical loads exceedance has been generated
by the RAINS model, results are summarised in Table iv).

Table iv) Summary statistics on critical loads and levels, showing % area over which
there is exceedance.
                               2000       CLE          A           B            C      MTFR
                                          2020
Eutrophication Ecosystems      57%        46%         33%        29%        27%         15%
Acidification  Forests         21%        10%         5.7%       5.1%       4.7%        3.1%
Ozone          Forests         61%        56%         52%        50%        48%         28%

The table demonstrates widespread exceedance of the critical load for eutrophication and the
critical level for ozone remaining in 2020. Acidification has been brought under better
control, though there are still a significant number of ecosystems at risk. By summarising
across the EU25, Table iv) does not pick up some important distributional issues, specifically,
that critical levels exceedance for ozone is sharply divided, with little or no exceedance in a
few countries (Estonia, Finland, Latvia, Lithuania and Sweden) but extensive exceedance in
all others.

Comparison of costs and benefits
The information given above on monetised benefits of the different policy scenarios has been
compared against their annualised costs, as estimated by the RAINS model. Results in Table
v) are expressed in terms of net benefits (i.e. the total level of benefit achieved) and the
benefit:cost ratio (essentially the effectiveness of each scenario in achieving benefits) in
relation to the CLE baseline scenario. No account is taken of uncertainty other than in
mortality valuation (which generates the Low-High ranges shown). In all cases, even under
the MTFR scenario, benefits exceed costs.

Table v) Comparison of annualised costs and benefits for the EU25 under the different
scenarios relative to the CLE baseline (€billion/year). No account is taken of damage to
ecosystems, some health impacts, and cultural heritage.
                                                    A           B           C        MTFR
EU Annualised benefits (health, materials and crops) change over base
Low estimate                                       38           46          50         57
High estimate                                     120          147         160         182
EU-25 Annualised Costs - change over base line
Total                                              5.9        10.7         14.9        39.7
NET benefits
Low estimate                                       32           35          35         17
High estimate                                     115          136         145         142
Benefit to Cost Ratio
Low estimate                                       6.3         4.3         3.4         1.4
High estimate                                      20          14          11          4.6

                                              iii
AEAT/ ED48763001/ABC Scenarios. Issue 2

Results in Table vi) show net benefits and benefit:cost ratios for the increments between
adjacent scenarios, again taking no account of uncertainty in the analysis beyond low and
high mortality valuations. The Table reveals the following:
    • Core estimates of incremental benefits (to the extent that they are quantified and
       monetised) exceed costs at least as far as Scenario B.
    • When going from scenario B to scenario C, the costs are broadly equal to the low
       estimate of benefits – though they are lower than the high estimate. This is, naturally,
       reflected in the benefit to cost ratio, which ranges from 0.98 to 3 for the low and high
       estimate of benefits.
    • When going from scenario C to the MTFR, the costs of the additional measures
       outweigh the monetised benefits that have been quantified in monetary terms– this
       applies to the full range of estimates accounting for both low and high estimates. This
       is also reflected in the low benefit:cost ratios, which are all under 1 (i.e. it is not
       possible on these benefits alone to justify the policy intervention).

Table vi) Comparison of annualised costs and benefits for the EU25 for the increments
between successive policy scenarios. No account is taken of damage to ecosystems, some
health impacts, and cultural heritage.

                                               from CLE       from A      from B         from C
                                                  to A          to B        to C        to MTFR
EU incremental annualised benefits (health and crops)
Total with Mortality – VOLY – low (median)         38            8.3         4.1           6.9
Total with Mortality – VSL – high (mean)          120            27          13            22
EU-25 annualised costs in Billion€/year - incremental changes to each scenario
Total                                              5.9           4.8         4.2           25
NET incremental benefits
Total with Mortality – VOLY – low (median)         32            3.5       -0.03           -18
Total with Mortality – VSL – high (mean)          115            22          9.1           -3.0
Benefit to cost ratio
Total with Mortality – VOLY – low (median)         6.3           1.7        0.98           0.3
Total with Mortality – VSL – high (mean)           20            5.6         3.2           0.9

It is stressed that the analysis above does not include all benefits – notably it excludes benefits
to ecosystems, some health impacts (e.g. those of secondary organic aerosols, SOAs) and
impacts on cultural heritage. That these impacts are likely to add significant benefits to those
already quantified is evident from a scoping analysis on SOAs, indicating benefits between
€1.7 and 5.7 billion/year as a result of moving from Baseline to Scenario A, and €2.9 to
9.5 billion/year for moving from Baseline to Scenario C. Addition of SOA related benefits
would be sufficient to transform the net cost for the low estimate of benefits when moving
from scenario B to scenario C to a net benefit. The importance of the un-monetised benefits
is also evident from estimates of the extent of exceedance of critical levels for ozone and
critical loads for acidification and eutrophication shown in Table iv).

Uncertainty analysis
Results of the core cost-benefit comparison shown in Tables v) and vi) have been subject to
an extensive uncertainty analysis. This has considered the following factors in particular:
    • Statistical uncertainty in health benefit inputs for incidence rates, response functions
       and valuation data;

                                                iv
AEAT/ ED48763001/ABC Scenarios. Issue 2
• Sensitivity to the use of alternative approaches to mortality assessment;
• Sensitivity to uncertainty in cost estimates (taking a range from 50% of the RAINS
estimated costs for each scenario to 120%, bearing in mind a tendency observed
elsewhere for abatement cost data ex-ante (before implementation) to be higher than
ex-post (actual));
• Sensitivity to a reduced risk factor for the dominant impact, mortality from chronic
exposure to particles;
• Review of unquantified aspects of the analysis that will bias the results up or down.
Results demonstrate that there is a robust case for moving to Scenario A and Scenario B with
a very high probability of benefits exceeding costs (in most cases >90%). A case is also made
for proceeding to Scenario C, though this is not quite as robust, and is dependent on the views
of decision makers regarding 2 issues:
1. The magnitude of benefits that are not quantified under the core analysis;
2. What constitutes an acceptable probability of deriving a net benefit to justify action
being initiated.
The case for moving to Scenario C becomes much firmer, however, if it is believed that the
core RAINS estimates of costs are likely to be too high, in line with evidence of the
relationship between ex-ante and ex-post cost estimates and also some of the sensitivity
analysis provided in the RAINS report on the A, B, C scenarios. Based on the assumption
that the policy option should be based on marginal costs being smaller than the marginal
benefits there is no case made for moving to the MTFR scenario: costs would need to be
vastly overestimated and benefits substantially underestimated.
Macroeconomic analysis using GEM-E3
The final part of the report deals with the macroeconomic effects of the policies under each
scenario, based on use of the GEM-E3 model (General Equilibrium Model – Energy,
Economy, Environment). The following conclusions are drawn:
• The macroeconomic cost of air pollution reduction is limited compared to the benefits
obtained in terms of air quality, health and ecosystem improvement, though at the
margin (moving from Scenario B to Scenario C) the additional benefits do not
compensate for the additional cost in terms of GDP. Note, however, that the GEM-E3
assessment was performed only for the low benefit estimate using the median value of
life year (VOLY) which is the lowest in the range.
• The benefits of reduced air pollution return mainly to the EU citizens.
• The effect on the competitiveness of the sectors remains small because the price effect is
limited and all EU member states participate in the abatement effort.
• Depending on the policy instrument used the allocation of the burden is different: with a
quantity instrument (allowance or performance standard) the cost burden falls mostly on
the domestic consumers and therefore on the consumer goods industry, while with the
tax instruments (which is analytically the same as an auctioned allowance system) the
burden is more evenly spread through the recycling of the revenues.
There are a few important caveats. First these results hold as long as the allocation of effort
over the sectors and countries is cost-effective. Second no implementation and monitoring
costs have been taken into account because these are likely to be very small compared to the
abatement costs. Third all results are based on the low benefit estimate based on use of the
median VOLY (value of a life year) for mortality valuation.
vAEAT/ ED48763001/ABC Scenarios. Issue 2
It is concluded that the macroeconomic analysis confirms the conclusions drawn from the
core analysis and sensitivity analysis. It is appropriate to choose an ambition level of at least
Scenario B and possibly Scenario C.
Overall conclusions
This report summarises the benefits of the multi-effect policy option scenarios for three
ambition levels for air quality in Europe in 2020. It shows that large benefits are predicted to
occur from these scenarios, with monetised air pollution benefits in the range between €37
billion and €160 billion for the year 2020, depending on the level of ambition and the estimate
(low – high) for mortality.
The cost-benefit analysis shows that the benefits of the three policy scenario levels exceed
costs, significantly so for the high estimate of benefits. These conclusions are confirmed in
the macroeconomic analysis: it is appropriate to choose an ambition level of at least Scenario
B and possibly Scenario C.
It should be emphasized that the above conclusion excludes benefits from effects not included
in the monetary framework – notably benefits because of reduced damage to ecosystems and
cultural heritage. Including these effects would increase the monetised benefits of reduced air
pollution.
viAEAT/ ED48763001/ABC Scenarios. Issue 2
Acknowledgements
The authors want to thank all their colleagues who have contributed to the development of the
CAFE scenario analysis. In particular, we acknowledge the contributions of:
The RAINS team under the leadership of Markus Amann at the International Institute for
Applied Systems Analysis.
The EMEP/MSC-W team providing atmospheric dispersion calculations under the leadership
of Leonor Tarrason at the Norwegian Meteorological Institute
viiAEAT/ ED48763001/ABC Scenarios. Issue 2
Contents
INTRODUCTION.................................................................................................................... 1
BACKGROUND TO THIS REPORT ............................................................................................... 1
SCENARIOS INVESTIGATED ...................................................................................................... 1
METHODS ................................................................................................................................ 2
DATA INPUTS ........................................................................................................................... 4
SUMMARY RESULTS – HEALTH IMPACTS................................................................... 5
HEALTH IMPACT ASSESSMENT - RESULTS ................................................................................ 5
HEALTH IMPACT ASSESSMENT - DISCUSSION ......................................................................... 10
SUMMARY RESULTS – HEALTH VALUATION........................................................... 11
VALUATION - RESULTS .......................................................................................................... 11
NON-HEALTH IMPACTS ................................................................................................... 15
CROPS ................................................................................................................................... 15
MATERIALS ........................................................................................................................... 15
ECOSYSTEMS ......................................................................................................................... 16
INITIAL COMPARISON OF COSTS AND BENEFITS .................................................. 27
BIAS IN THE CBA ................................................................................................................ 31
BIASES IN THE RAINS MODELLING ....................................................................................... 33
BIASES IN THE BENEFITS ANALYSIS ....................................................................................... 36
CONCLUSIONS ON BIASES IN THE CBA .................................................................................. 38
EXTENDED CBA .................................................................................................................. 39
OVERVIEW ............................................................................................................................ 39
OMISSION OF IMPACTS TO ECOSYSTEMS ................................................................................ 40
OMISSION OF SECONDARY ORGANIC AEROSOLS (SOA) ......................................................... 40
CONCLUSIONS ON OMITTED IMPACTS .................................................................................... 42
UNCERTAINTY / SENSITIVITY ANALYSIS .................................................................. 43
METHODS FOR DESCRIBING UNCERTAINTIES ......................................................................... 43
UNCERTAINTIES NOT ADDRESSED IN DETAIL IN THIS REPORT ................................................ 43
STRUCTURE OF THE UNCERTAINTY ANALYSIS ....................................................................... 45
UNCERTAINTY ANALYSIS FOR SCENARIO A........................................................................... 46
UNCERTAINTY ANALYSIS FOR SCENARIO B........................................................................... 49
UNCERTAINTY ANALYSIS FOR SCENARIO C........................................................................... 53
UNCERTAINTY ANALYSIS FOR THE MTFR SCENARIO ............................................................ 58
DISCUSSION ON THE UNCERTAINTY ASSESSMENT .................................................................. 62
ASSESSMENT OF THE MACROECONOMIC IMPACT OF THE CAFE
SCENARIOS WITH GEM-E3.............................................................................................. 65
INTRODUCTION ...................................................................................................................... 65
GEM-E3 AND ITS CALIBRATION TO RAINS .......................................................................... 65
THE POLICY SCENARIOS......................................................................................................... 67
SENSITIVITY ANALYSIS AROUND THE ENVIRONMENTAL END POINTS ..................................... 73
viiiAEAT/ ED48763001/ABC Scenarios. Issue 2
CHOICE OF POLICY INSTRUMENTS ......................................................................................... 74
SUMMARY ............................................................................................................................. 77
OVERALL CONCLUSIONS................................................................................................ 78
REFERENCES ....................................................................................................................... 81
ixAEAT/ ED48763001/ABC Scenarios. Issue 2
Introduction
Background to this report
In May 2001, the European Commission launched the Clean Air for Europe (CAFE)
Programme – a knowledge based approach with technical/scientific analyses and policy
development that will lead to the adoption of a Thematic Strategy on Air Pollution, fulfilling
the requirements of the Sixth Environmental Action Programme. Its aim is to develop a long-
term, strategic and integrated policy advice for ‘achieving levels of air quality that do not give
rise to significant negative impacts on and risks to human health and the environment’;
including ‘no exceedance of critical loads and levels for acidification or eutrophication’.
Using results from the CAFE analysis, the European Commission will present its Thematic
Strategy on Air Pollution during 2005, outlining the environmental objectives for future
European air quality policy and measures to be taken to achieve these objectives. This report
provides the comparison of costs and benefits for a series of scenarios that investigate options
for reducing damage to health from exposure to ozone and fine particles (PM2.5) and to
ecosystems from acidification and eutrophication.
Scenarios investigated
The starting point for the analysis is a scenario that forecasts emissions in the year 2020 under
current legislation (CLE), assuming that countries fulfil their Kyoto obligations and carry on
implementing greenhouse gas reduction policies through to 2020. The legislation considered
in the CLE scenario is summarised in Table 1.
Table 1. Legislation considered in the Current Legislation (CLE) scenario (source:
IIASA/EMEP, 2004).
for SO2 emissions for NOX emissions for VOC emissions for NH3 emissions
Large combustion plant Large combustion plant Stage I directive No EU-wide legislation
directive directive
Directive on the Auto/Oil EURO Directive 91/441 National legislation
sulphur content in standards (carbon canisters)
liquid fuels
Directives on quality of Emission standards for Auto/Oil EURO Current practice
petrol and diesel fuels motorcycles and standards
mopeds
IPPC legislation on Legislation on non- Fuel directive (RVP of
process sources road mobile machinery fuels)
National legislation and Implementation failure Solvents directive
national practices (if of EURO-II and Euro-
stricter) III for heavy duty
vehicles
IPPC legislation for Product directive
industrial processes (paints)
National legislation and National legislation,
national practices (if e.g., Stage II
stricter)
1AEAT/ ED48763001/ABC Scenarios. Issue 2
Earlier analysis quantified the impacts and associated damage that would occur under the
baseline scenario and a series of illustrative scenarios where emissions were varied between
current legislation and the maximum technically feasible reduction (MTFR) according to the
RAINS model1. This allowed identification of a series of low, medium and high policy
scenario (ambition) levels for reducing impacts of ozone and fine particles on health and
acidification and eutrophication on ecosystems. These were then combined to construct three
scenarios, A, B and C.
Table 2. Selected numerical values of the effect indicators for the CAFE scenarios
CLE A B C MTFR
Years of life lost due to PM2.5 137 110 104 101 96
(EU-wide, million YOLLs)
Acidification (country-wise 0% 55% 75% 85% 100%
gap closure on cumulative
excess deposition)
Eutrophication (country-wise 0% 55% 75% 85% 100%
gap closure on cumulative
excess deposition)
Ozone (country-wise gap 0% 60% 80% 90% 100%
closure on SOMO35)
The term ‘gap closure’ here relates to the gap between the CLE and MTFR scenarios.
Residual damage, even under the MTFR scenario, can be substantial, as reference to the top
row of the table, dealing with years of life lost to fine particle exposure demonstrates.
Following from Table 2 it is to be expected that the incremental benefits between scenarios
(i.e. comparing the benefit of moving from CLE to A, with that of moving from A to B and so
on) are not equal.
Methods
The CAFE CBA methodology was described in three volumes (Holland et al, 2005a, b;
Hurley et al, 2005) available from http://www.cafe-cba.org. The development of the CAFE
CBA methodology can be traced back to the start of the EC DG Research ExternE
Programme that started in 1991 and continues to the present day. Further to this, the
methodology used here was the subject of intense consultation in 2003 and 2004 with
stakeholders from the European Union Member States, academic institutes, environment
agencies, industry and non-governmental organisations. It was also subject to formal peer
review by senior experts in the USA and Europe (the peer review report is available at the
above website).
It is important to differentiate the roles of the RAINS and CBA models. RAINS identifies a
cost-effective set of measures for meeting pre-defined health and environmental quality
1
Note that the MTFR scenario does not provide a true maximum reduction in emissions as the RAINS model is
unable to include all possible abatement measures, and does not factor in some potential improvement for
efficiency in the measures that are included.
2AEAT/ ED48763001/ABC Scenarios. Issue 2
targets. The CBA model adds to this analysis by assessing the magnitude of benefits and
assesses whether overall benefits are higher or lower than the estimated costs; in other words,
whether it is worth carrying out the measures identified in the RAINS model.
This approach follows a logical progression through the following stages:
1. Quantification of emissions (in CAFE, covered by the RAINS model);
2. Description of pollutant dispersion and chemistry across Europe (in CAFE, covered by
the RAINS and EMEP models);
3. Quantification of exposure of people, environment and buildings that are affected by
air pollution (linking the pollution concentrations with the ‘stock at risk’ e.g.
population data);
4. Quantification of the impacts of air pollution, using relationships linking pollution
concentrations with physical impacts;
5. Valuation of the impacts where possible; and
6. Assessment of the potential importance of uncertainty with regard to the balance of
the costs of pollution control quantified by the RAINS model and their associated
benefits.
In this report health impacts are quantified first, both in terms of the change in incidence in
mortality and morbidity impacts, and then in terms of monetary equivalent. This is followed
by quantification of the economic impacts of damage to materials and crops, and assessment
of critical loads exceedance for ecosystems. Ecosystem impacts are not monetised.
Following the valuation of impacts at stage 5 in the above list, the core estimates of the
benefits of the different scenarios considered in the report are compared with the costs. At
this stage only limited account is taken of uncertainty, specifically with respect to the use of
different options for valuation of chronic effects on mortality as this impact dominates the
benefit estimates. Accounting for the views of different stakeholders and the peer review we
quantify chronic mortality both in terms of the change in longevity (valued using the value of
a life year or ‘VOLY’ concept) and in terms of deaths brought forward (valued using the
value of statistical life or ‘VSL’ concept). Clearly the results of these two approaches should
be seen as alternatives and are not to be added together. For valuation, the analysis has been
able to take advantage of new research under the EC DG Research NewExt Project. There
has been some debate as to whether it is appropriate to take the mean or median values from
the NewExt analysis of VSL and VOLY. The most relevant measure of society’s willingness
to pay (WTP) is the mean, though this can be affected significantly by a few extreme values.
In contrast the median, though less relevant as an indicator of the average societal WTP, is
more robust. Being pragmatic, we use both. Altogether this gives four alternatives on
valuation as shown in Table 3.
Table 3. Values for use in CAFE CBA: Effects of chronic exposure on mortality.
VSL VOLY Derived from:
Median (NewExt) €980,000 €52,000 Median value
Mean (NewExt) €2,000,000 €120,000 Mean value
The actual difference in mortality damage quantified using VOLY and VSL-based methods is
not as great as the above table might suggest. Much of the difference between VSL and
VOLY is cancelled out by the difference between the number of premature deaths quantified
3AEAT/ ED48763001/ABC Scenarios. Issue 2
compared to the number of life years lost, and there is extensive overlap in the ranges. This
issue is addressed in greater depth in Volume 3 of the CBA Methodology Report. These
uncertainties are considered sufficiently important to be considered throughout the report, not
just in the detailed appraisal of uncertainties towards the end of the report.
A further factor considered for chronic mortality impacts is variation in the risk factor for
impact quantification. Following WHO guidance a risk factor of 6% change in mortality rate
per 10µg.m-3 PM 2.5 is used for the core analysis, whilst for sensitivity analysis a factor of 4%
is used.
For acute mortality from ozone, the analysis quantifies the number of ‘premature deaths’
(deaths brought forward)2. These cases are valued using a VOLY approach, assuming that on
average, each premature deaths leads to the loss of 12 months of life. The range for the
VOLY is therefore applied to these impacts.
Following the initial comparison of core estimates of cost and monetised benefit for each
scenario the analysis continues with a detailed uncertainty analysis that addresses the question
of the probability of benefits exceeding costs for each scenario. This takes account of
statistical variation in inputs, sensitivities to model assumptions and unquantified biases in the
analysis. The latter includes biases linked to the EMEP model (e.g. omission of secondary
organic aerosols, use of a single year’s meteorological data) and to the RAINS model (e.g.
potential for error in cost estimation) as well as biases in the benefits assessment such as the
omission of ecosystem benefits from monetised estimates.
The final part of the report investigates the macroeconomic consequences of the A, B and C
scenarios, based on analysis using the GEM-E3 model.
Data inputs
Most of the data inputs to the CBA relating to stock at risk, exposure-response functions and
valuation are defined in the CBA methodology report. In addition, data on emissions,
abatement costs, concentrations of PM, and some impacts (e.g. critical loads exceedance data
for ecosystems) are taken from the RAINS model. With respect to PM concentration, RAINS
approximates the results of the EMEP model on a grid scale of 50x50 km, supplemented by
results of the CITY-DELTA project to factor in higher urban concentrations of PM in densely
populated areas. For ozone, the study has used results from the EMEP model directly.
Concentration data are estimated using the meteorology of 1997.
2
This is to signify that people whose deaths are brought forward by higher air pollution almost certainly have
serious pre-existing cardio-respiratory disease and so in at least some of these cases, the actual loss of life is
likely to be small – the death might have occurred within the same year and, for some, may only be brought
forward by a few days.
4AEAT/ ED48763001/ABC Scenarios. Issue 2
Summary Results – Health Impacts
The first set of tables shows the totals for each of the ‘core’ set of health impacts for the
EU25.
The analysis presents estimated total health impacts across the EU25 for the year 2020 for the
CAFE Baseline. All are based on 1997 meteorological data. The analysis has also presented
the total health impacts with the three policy scenario levels (A, B, C) and the MTFR in 2020.
As detailed in the previous section, the impacts are split into mortality (i.e. premature deaths)
and morbidity (i.e. illness) by pollutant (PM and ozone). The quantification of health impacts
addresses the impacts related to both long-term (chronic) and short-term (acute) exposures.
The analysis includes impacts on PM2.5 (anthropogenic – excluding PM from natural sources
and for secondary organic aerosols) and ozone (using the metric SOMO35 – the sum of the
daily maximum 8-hour mean ozone concentration with a cut-off at 35 ppb3).
The results show the number of events that happen in each year (i.e. the annual number of
impacts or new cases4), or the change in the number of impacts and cases over time.
As outlined in the previous section, two alternative approaches are used for chronic mortality,
to derive years of life lost and premature deaths. These two estimates should not be added.
Health impact assessment - results
The results are shown in Table 4. This presents the total numbers of impacts with baseline
pollution concentrations in 2020. It also shows the total number of impacts for the three
policy scenario levels and the MTFR scenario. Table 5 shows the change in impacts, i.e. the
benefits, of each scenario over the 2020 baseline.
Table 6 shows the incremental change in impacts, i.e. benefits, between each of the scenarios,
i.e. from the baseline to scenario A, from scenario A to scenario B. etc.
For the analysis here, the analysis has used the RAINS model for PM concentration data, and
the EMEP model for other pollutants (including effects on ecosystems), based on the latest
3
This means that for days with ozone concentration above 35 ppb as maximum 8-hour mean, only the increment
exceeding 35 ppb is used to calculate effects. No effects of ozone on health are calculated on days below 35 ppb
as maximum 8-hour mean. It is likely that the overall effects of ozone on mortality are underestimated by this
approach.
4
For chronic mortality, this involves a different metric to the output from the RAINS model, which works with
the change in years of life lost from sustained pollution levels over 80 years, i.e. it works with a total ‘stock’
concept, rather than an annualised metric.
5AEAT/ ED48763001/ABC Scenarios. Issue 2
model runs (March 2005)5. This modelling is consistent with other information presented on
the scenario analysis under the CAFE programme.
5
A final set of scenarios for the Clean Air for Europe (CAFE) programme. Report number 6. IIASA. April 14th,
2005. Draft Version.
6AEAT/ ED48763001/ABC Scenarios. Issue 2
Table 4. Analysis of Scenarios for the Clean Air for Europe programme: Estimated annual health impacts due to air pollution in 2020 in
EU25, plus the total impacts with each of the policy scenario levels and the MTFR (2020)
End Point Name CORE Functions CLE 2020 A B C MTFR
Acute Mortality Premature deaths O3 20,800 19,200 18,600 18,300 17,759
Respiratory Hospital Admissions (65yr +) Cases O3 20,100 18,500 18,000 17,700 17,160
Minor Restricted Activity Days (MRADs 15-64yr) Days O3 42,415,500 39,191,000 38,119,800 37,477,100 36,484,733
Respiratory medication use (children 5-14yr) Days O3 12,925,900 11,961,000 11,644,900 11,452,900 11,164,595
Respiratory medication use (adults 20yr +) Days O3 8,171,700 7,548,200 7,340,900 7,217,000 7,025,333
Cough and LRS (children 0-14yr) Days O3 65,278,600 60,350,200 58,714,800 57,732,500 56,204,229
Chronic Mortality – YOLL Life years lost PM 2,467,300 1,974,800 1,866,500 1,812,700 1,722,700
Chronic Mortality – deaths Premature deaths PM 271,600 217,800 205,900 200,000 190,200
Infant Mortality (0-1yr) Premature deaths PM 350 280 270 260 250
Chronic Bronchitis (27yr +) Cases PM 128,100 102,600 97,000 94,200 89,600
Respiratory Hospital Admissions (All ages) Cases PM 42,300 33,800 32,000 31,100 29,500
Cardiac Hospital Admissions (All ages) Cases PM 26,100 20,900 19,700 19,200 18,200
Restricted Activity Days (15-64yr) Days PM 221,999,100 177,597,000 167,894,700 163,064,800 154,985,400
Respiratory medication use (children 5-14yr) Days PM 1,987,700 1,589,600 1,497,200 1,453,800 1,379,300
Respiratory medication use (adults 20yr +) Days PM 20,879,800 16,713,200 15,803,300 15,348,900 14,591,600
Lower Respiratory Symptom days (children 5-14) Days PM 88,852,300 71,136,400 67,155,300 65,221,800 61,889,500
LRS among adults (15yr +) with chronic symptoms Days PM 207,562,100 166,139,500 157,056,600 152,532,900 144,995,400
*Note two alternative metrics are used for the presentation of chronic mortality from PM. Firstly in terms of years of life lost and secondly in terms of numbers of premature
deaths. These are not additive.
7AEAT/ ED48763001/ABC Scenarios. Issue 2
Table 5. Analysis of the Scenarios for the Clean Air for Europe programme : Estimated annual health benefits (i.e. the difference
between the CLE baseline and the policy option scenario) in 2020 in EU25, for each of the policy scenario levels and the MTFR (2020)
End Point Name CORE Functions A B C MTFR
Acute Mortality (All ages) Premature deaths O3 1,600 2,200 2,500 3,041
Respiratory Hospital Admissions (65yr +) Cases O3 1,600 2,100 2,400 2,940
Minor Restricted Activity Days (MRADs 15-64yr) Days O3 3,224,500 4,295,700 4,938,400 5,930,767
Respiratory medication use (children 5-14yr) Days O3 964,900 1,281,000 1,473,000 1,761,305
Respiratory medication use (adults 20yr +) Days O3 623,500 830,800 954,700 1,146,367
Cough and LRS (children 0-14yr) Days O3 4,928,400 6,563,800 7,546,100 9,074,371
Chronic Mortality – YOLL Life years lost PM 492,500 600,800 654,600 744,600
Chronic Mortality – deaths Premature deaths PM 53,800 65,700 71,600 81,400
Infant Mortality (0-1yr) Premature deaths PM 70 80 90 100
Chronic Bronchitis (27yr +) Cases PM 25,500 31,100 33,900 38,500
Respiratory Hospital Admissions (All ages) Cases PM 8,500 10,300 11,200 12,800
Cardiac Hospital Admissions (All ages) Cases PM 5,200 6,400 6,900 7,900
Restricted Activity Days (15-64yr) Days PM 44,402,100 54,104,400 58,934,300 67,013,700
Respiratory medication use (children 5-14yr) Days PM 398,100 490,500 533,900 608,400
Respiratory medication use (adults 20yr +) Days PM 4,166,600 5,076,500 5,530,900 6,288,200
Lower Respiratory Symptom (LRS) days (child 5-14yr) Days PM 17,715,900 21,697,000 23,630,500 26,962,800
LRS among adults (15yr +) with chronic symptoms Days PM 41,422,600 50,505,500 55,029,200 62,566,700
*Note two alternative metrics are used for the presentation of chronic mortality from PM. Firstly in terms of years of life lost and secondly in terms of numbers of premature
deaths. These are not additive.
8AEAT/ ED48763001/ABC Scenarios. Issue 2
Table 6. Analysis of the Scenarios for the Clean Air for Europe programme : Estimated incremental annual health benefits due to air
pollution in 2020 in EU25for each step of the policy scenario levels and the MTFR (2020).
End Point Name CORE Functions Baseline - A A-B B-C C - MTFR
Acute Mortality (All ages) Premature deaths O3 1,600 600 300 541
Respiratory Hospital Admissions (65yr +) Cases O3 1,600 500 300 540
Minor Restricted Activity Days (MRADs 15-64yr) Days O3 3,224,500 1,071,200 642,700 992,367
Respiratory medication use (children 5-14yr) Days O3 964,900 316,100 192,000 288,305
Respiratory medication use (adults 20yr +) Days O3 623,500 207,300 123,900 191,667
Cough and LRS (children 0-14yr) Days O3 4,928,400 1,635,400 982,300 1,528,271
Chronic Mortality – YOLL Life years lost PM 492,500 108,300 53,800 90,000
Chronic Mortality – deaths Premature deaths PM 53,800 11,900 5,900 9,800
Infant Mortality (0-1yr) Premature deaths PM 70 10 10 10
Chronic Bronchitis (27yr +) Cases PM 25,500 5,600 2,800 4,600
Respiratory Hospital Admissions (All ages) Cases PM 8,500 1,800 900 1,600
Cardiac Hospital Admissions (All ages) Cases PM 5,200 1,200 500 1,000
Restricted Activity Days (15-64yr) Days PM 44,402,100 9,702,300 4,829,900 8,079,400
Respiratory medication use (children 5-14yr) Days PM 398,100 92,400 43,400 74,500
Respiratory medication use (adults 20yr +) Days PM 4,166,600 909,900 454,400 757,300
Lower Respiratory Symptom (LRS) days (child. 5-14yr) Days PM 17,715,900 3,981,100 1,933,500 3,332,300
LRS among adults (15yr +) with chronic symptoms Days PM 41,422,600 9,082,900 4,523,700 7,537,500
*Note two alternative metrics are used for the presentation of chronic mortality from PM. Firstly in terms of years of life lost and secondly in terms of numbers of premature
deaths. These are not additive.
9AEAT/ ED48763001/ABC Scenarios. Issue 2
Health impact assessment - discussion
Ozone concentrations: Annual impacts across the EU 25 are estimated at some 21 000 deaths
brought forward in the year 2020. However, ozone also leads to much larger numbers of
estimated morbidity health impacts, with tens of millions of minor restricted activity days and
respiratory medication use days each year. These are clearly less serious effects at the level of
the affected individual, but they affect a much greater number of people.
The progressive ambition levels (A, B, C) are estimated to reduce the total impacts from
ozone on health, with some 1600 to 2500 avoided deaths brought forward, depending on the
ambition level. A similar level of benefits is predicted for respiratory hospital admissions.
For other morbidity endpoints, the levels of benefits are greater, for example with the
scenarios estimated to have benefits of 1.5 million to 2.5 million cases of respiratory
medication use, and 3 million to 5 million minor restricted activity days. The incremental
analysis in Table 6 shows that a greater incremental benefit occurs in moving from scenario A
to B, than from scenario B to C.6
PM concentrations: Annual impacts across the EU 25 are estimated at some 2.5 million years
of life lost each year (based on the year 2020) – this can also be expressed as 272 000
estimated premature deaths. These results are consistent with the RAINS model, which
calculates the total (not annual) change in life years. PM also leads to an estimated additional
350 premature deaths each year amongst infants aged between 1 month and 1 year. The
estimated morbidity effects of PM range from around 68 000 cases of hospital admissions (in
the year 2020) to much larger numbers of less serious effects, for example some 20 million
respiratory medication use days, and several hundred million restricted activity days each
year.
The progressive ambition levels (A, B, C) reduce the total impacts from PM on health, with
some 500,000 to 650,000 years of life saved each year – this can also be expressed as 54,000
to 72,000 avoided premature deaths. There is also an additional benefit in avoiding 70 to 90
infant mortality deaths. For other morbidity endpoints, the levels of benefits are greater, for
example with the scenarios estimated to avoid 14,000 to 18,000 hospital admissions, 4.5
million to 6 million cases of respiratory medication use, and tens of millions of restricted
activity days. Again, the incremental analysis in Table 6 shows that a greater incremental
benefit occurs in moving from scenario A to B, than from scenario B to C.6
6
Note that the difference between scenarios A and B is slightly different from the difference between scenarios
B and C.
10AEAT/ ED48763001/ABC Scenarios. Issue 2
Summary Results – Health Valuation
The health impacts and benefits outlined above have been expressed in monetary terms, using
the approach outlined in the CAFE CBA methodology.
Strictly speaking, the CAFE CBA methodology is only applicable for assessing the changes
between scenarios. However, we have estimated the total monetary damage from health
impacts as an illustration of the level of economic importance, as well as the changes in
benefits. The methodology is described in full in Volume 2 of the Methodology reports.
Values are presented for the EU25. The analysis has also considered the benefits of the
ambition levels (A, B, C) and the MTFR.
As outlined in the earlier methodology section, there are two methods that can be used for the
valuation of chronic mortality – the value of statistical life (VSL, applied to the change in
number of deaths) and value of life year (VOLY, applied to changes in life expectancy). For
the CAFE CBA methodology, the independent external peer reviewers and several
stakeholders suggested that both the VSL and the VOLY approaches be used, to show
transparently the variation in results arising from use of these two approaches. It was noted
above that despite major differences in the unit valuations, there is significant overlap in the
ranges of analysis based around use of the VOLY and VSL approaches.
For premature deaths from ozone, two alternative values are presented. This reflects the
range in valuation for a year of life lost from the NewExt study based on the median and
mean reported values. For chronic mortality, four alternative core scenarios are presented.
This reflects the range from the two quantification approaches (years of life lost and VOLYs -
and premature deaths and the VSL) and the range of mean and median values from the
NewExt study for each of these approaches.
Valuation - results
The results are shown in Table 7. All values are for the EU25. This presents the total damage
with baseline pollution concentrations in 2020. It also shows the total damage for the three
ambition levels and the MTFR scenario.
Table 8 shows the change in damage, i.e. the benefits, of each scenario over the 2020
baseline.
Table 9 shows the incremental change in damage, i.e. benefits, between each of the scenarios,
i.e. from the baseline to scenario A, from scenario A to scenario B. etc.
The analysis shows that the health benefits of the alternative ambition levels range from 37 to
€120 billion/year (scenario A), up to €49 to 160 billion/year (scenario C). The additional
(incremental) benefits fall with successive scenario, i.e. the incremental benefits of moving
from the scenario A to scenario B are greater (€8 to 26 billion/year) than from scenario B to C
(€4 to 13 billion/year).
11AEAT/ ED48763001/ABC Scenarios. Issue 2
Table 7. Valuation of the annual health damage in EU25 (€Million/year) due to air pollution in 2020 for the baseline, Analysis of the
scenarios for the Clean Air for Europe programme , and the MTFR
End Point Name Baseline 2020 A B C MTFR
Acute Mortality (VOLY median)* O3 1085 1002 975 958 933
Acute Mortality (VOLY mean*) O3 2435 2250 2188 2151 2093
Respiratory Hospital Admissions (65yr +) O3 40 37 36 36 35
Minor Restricted Activity Days (MRADs 15-64yr) O3 1629 1506 1464 1440 1402
Respiratory medication use (children 5-14yr) O3 12 11 11 11 10
Respiratory medication use (adults 20yr +) O3 8 7 7 7 7
Cough and LRS (children 0-14yr) O3 2508 2318 2256 2218 2159
Chronic Mortality – VOLY – low (median) PM 129,000 103,250 97,588 94,775 90,073
Chronic Mortality – VOLY – high (mean) PM 289,556 231,758 219,048 212,734 202,180
Chronic Mortality – VSL – low (median) PM 265,965 213,239 201,652 195,842 186,285
Chronic Mortality – VSL – high (mean) PM 547,200 438,721 414,881 402,929 383,265
Infant Mortality (0-1yr) – low (median) PM 495 395 374 363 345
Infant Mortality (0-1yr) – high *mean) PM 990 790 747 726 689
Chronic Bronchitis (27yr +) PM 24,011 19,225 18,184 17,662 16,792
Respiratory Hospital Admissions (All ages) PM 85 68 64 62 59
Cardiac Hospital Admissions (All ages) PM 52 42 40 38 37
Restricted Activity Days (RADs 15-64yr) PM 18,515 14,812 14,002 13,600 12,926
Respiratory medication use (children 5-14yr) PM 2 1 1 1 1
Respiratory medication use (adults 20yr +) PM 20 16 15 14 14
LRS symptom days (children 5-14yr) PM 3,413 2,733 2,580 2,506 2,378
LRS among adults (15yr +) with chronic symptoms PM 7,974 6,383 6,034 5,860 5,570
Total with Mortality – VOLY – low (median) 188,849 151,806 143,631 139,551 132,741
Total with Mortality – VOLY – high (mean) 351,250 281,957 266,677 259,066 246,352
Total with Mortality – VSL – low (median) 325,814 261,795 247,695 240,618 228,953
Total with Mortality – VSL – high (mean) 608,894 488,920 462,510 449,261 427,437
Note for acute mortality (O3), two alternative values are presented, based on a range reflecting the median and mean values for VOLY from the NewExt study. For chronic mortality (PM), four
alternative values are presented, based on quantification using years of life lost (using the median and mean YOLL value from NewExt) and numbers of premature deaths (using the median and
mean VSL value from NewExt) . These are not additive
12AEAT/ ED48763001/ABC Scenarios. Issue 2
Table 8. Valuation of the annual health benefits in EU25 (€Million/year) due to air pollution in 2020 above the baseline, Analysis of the
scenarios for the Clean Air for Europe programme , and the MTFR
End Point Name Baseline A B C MTFR
Acute Mortality (VOLY median)* O3 83 110 127 152
Acute Mortality (VOLY mean*) O3 186 248 285 342
Respiratory Hospital Admissions (65yr +) O3 3 4 5 6
Minor Restricted Activity Days (MRADs 15-64yr) O3 124 165 190 228
Respiratory medication use (children 5-14yr) O3 1 1 1 2
Respiratory medication use (adults 20yr +) O3 1 1 1 1
Cough and LRS (children 0-14yr) O3 189 252 290 349
Chronic Mortality – VOLY – low (median) PM 25,750 31,412 34,225 38,927
Chronic Mortality – VOLY – high (mean) PM 57,798 70,508 76,822 87,377
Chronic Mortality – VSL – low (median) PM 52,726 64,313 70,122 79,680
Chronic Mortality – VSL – high (mean) PM 108,479 132,319 144,271 163,935
Infant Mortality (0-1yr) – low (median) PM 100 121 132 150
Infant Mortality (0-1yr) – high *mean) PM 199 242 264 300
Chronic Bronchitis (27yr +) PM 4,786 5,827 6,348 7,219
Respiratory Hospital Admissions (All ages) PM 17 21 23 26
Cardiac Hospital Admissions (All ages) PM 10 13 14 16
Restricted Activity Days (RADs 15-64yr) PM 3,703 4,512 4,915 5,589
Respiratory medication use (children 5-14yr) PM 0 0 1 1
Respiratory medication use (adults 20yr +) PM 4 5 5 6
LRS symptom days (children 5-14yr) PM 681 834 908 1,036
LRS among adults (15yr +) with chronic symptoms PM 1,591 1,940 2,114 2,404
Total with Mortality – VOLY – low (median) 37,043 45,218 49,299 56,112
Total with Mortality – VOLY – high (mean) 69,293 84,573 92,186 104,902
Total with Mortality – VSL – low (median) 64,019 78,119 85,196 96,865
Total with Mortality – VSL – high (mean) 119,974 146,384 159,635 181,460
Note for acute mortality (O3), two alternative values are presented, based on a range reflecting the median and mean values for VOLY from the NewExt study. For chronic mortality (PM), four
alternative values are presented, based on quantification using years of life lost (using the median and mean YOLL value from NewExt) and numbers of premature deaths (using the median and
mean VSL value from NewExt) . These are not additive
13AEAT/ ED48763001/ABC Scenarios. Issue 2
Table 9. Valuation of the incremental annual health benefits in EU25 (€Million/year) for each step of the ambition levels and the
MTFR due to air pollution in 2020
End Point Name Baseline - A A-B B-C C - MTFR
Acute Mortality (VOLY median)* O3 83 28 16 25
Acute Mortality (VOLY mean*) O3 186 62 37 57
Respiratory Hospital Admissions (65yr +) O3 3 1 1 1
Minor Restricted Activity Days (MRADs 15-64yr) O3 124 41 25 38
Respiratory medication use (children 5-14yr) O3 1 0 0 0
Respiratory medication use (adults 20yr +) O3 1 0 0 0
Cough and LRS (children 0-14yr) O3 189 63 38 59
Chronic Mortality – VOLY – low (median) PM 25,750 5,663 2,813 4,702
Chronic Mortality – VOLY – high (mean) PM 57,798 12,710 6,314 10,555
Chronic Mortality – VSL – low (median) PM 52,726 11,587 5,809 9,558
Chronic Mortality – VSL – high (mean) PM 108,479 23,840 11,952 19,665
Infant Mortality (0-1yr) – low (median) PM 100 22 11 18
Infant Mortality (0-1yr) – high *mean) PM 199 43 21 37
Chronic Bronchitis (27yr +) PM 4,786 1,041 521 870
Respiratory Hospital Admissions (All ages) PM 17 4 2 3
Cardiac Hospital Admissions (All ages) PM 10 2 1 2
Restricted Activity Days (RADs 15-64yr) PM 3,703 809 403 674
Respiratory medication use (children 5-14yr) PM 0 0 0 0
Respiratory medication use (adults 20yr +) PM 4 1 0 1
LRS symptom days (children 5-14yr) PM 681 153 74 128
LRS among adults (15yr +) with chronic symptoms PM 1,591 349 174 290
Total with Mortality – VOLY – low (median) 37,043 8,177 4,079 6,811
Total with Mortality – VOLY – high (mean) 69,293 15,279 7,611 12,715
Total with Mortality – VSL – low (median) 64,019 14,101 7,075 11,667
Total with Mortality – VSL – high (mean) 119,974 26,409 13,249 21,825
Note for acute mortality (O3), two alternative values are presented, based on a range reflecting the median and mean values for VOLY from the NewExt study. For chronic mortality (PM), four
alternative values are presented, based on quantification using years of life lost (using the median and mean YOLL value from NewExt) and numbers of premature deaths (using the median and
mean VSL value from NewExt) . These are not additive.
14You can also read