Revealing the Toll of - COVID-19: MAY 2020 - World Health Organization
←
→
Page content transcription
If your browser does not render page correctly, please read the page content below
MAY 2020

Revealing the Toll of
COVID-19:
A Technical Package
for Rapid Mortality
Surveillance and
Epidemic Response

Revealing the Toll of COVID-19:
A Technical Package for Rapid Mortality Surveillance and Epidemic Response

            Contents
i           Acknowledgements
ii          List of Contributors
iii         Preface

1           Why Implement Rapid Mortality Surveillance?
1           Why Total Mortality?
4           The Rapid Mortality Surveillance (RMS) Concept
5           Facility-Based Surveillance
10          Community-Based Surveillance
13          Data Quality
14          Deriving Estimates of Historical Mortality for Community-Based Surveillance
16          Graphing Excess Mortality
16          Analysis and Interpretation
18          Use of Rapid Mortality Surveillance Data
20          Checklist for Establishing Rapid Mortality Surveillance

22          Annex 1: Infection Prevention and Control for Surveillance Workers
23          Annex 2: Including Manner and Cause of Death
23                Grouping mortality by manner of death and suspected COVID-19
24                Using medical certification of cause of death and ICD mortality coding
25                Investigation of suspected cases postmortem through medical autopsy
26                Use of verbal autopsy
28          References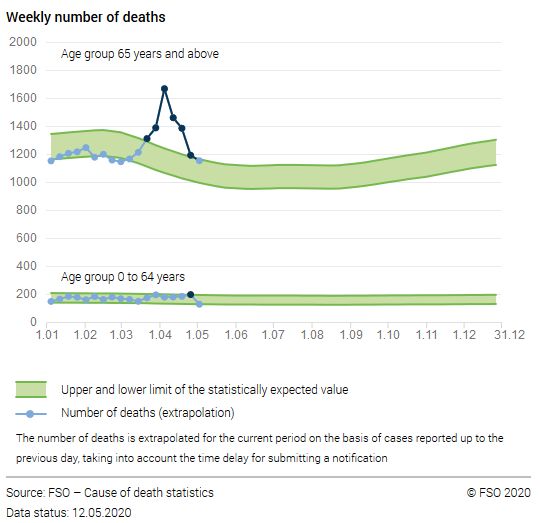
Revealing the Toll of COVID-19:
A Technical Package for Rapid Mortality Surveillance and Epidemic Response

Acknowledgements
This publication is, in part, an output of the Bloomberg Philanthropies Data for Health
Initiative (www.Bloomberg.org).This publication was produced with support from
Resolve to Save Lives, an initiative of Vital Strategies.” Resolve to Save Lives is a five-
year, $225 million initiative funded by Bloomberg Philanthropies, the Bill & Melinda
Gates Foundation, and Gates Philanthropy Partners, which is funded with support
from the Chan Zuckerberg Foundation. Resolve received additional funding from
Bloomberg Philanthropies, CDC Foundation and Stavros Niarchos Foundation for the
COVID-19 response.

The views expressed are not necessarily those of the Philanthropies. The views
expressed in the documents on this platform are solely the responsibility of the
authors and do not necessarily represent the views of the World Health Organization.

You may view and/or print pages from PreventEpidemics.org for your own personal
or professional use and you may download any materials offered on the website for
personal or professional non-commercial use. If you intend to use these materials in
any other way you must first obtain written permission from Vital Strategies.

Suggested citation: Vital Strategies, World Health Organization (2020). Revealing the
Toll of COVID-19: A Technical Package for Rapid Mortality Surveillance and Epidemic
Response. New York: Vital Strategies

© Vital Strategies and World Health Organization 2020 CC BY-NC-SA 3.0 IGO

                                                                                              i
Revealing the Toll of COVID-19:
A Technical Package for Rapid Mortality Surveillance and Epidemic Response
List of Contributors
Africa Centres for Disease Control and Prevention Emily B Atuheire
Mortality Surveillance Programme Akhona Tshangela
African Center for Statistics Oliver Chinganya
United Nations Economic Commission for Africa William Muhwava
US Centers for Disease Control and Prevention Brian Munkombwe
National Center for Health Statistics Erin Nichols
CDC Foundation Emily Cercone
Olga Joos
Department of Sociology Samuel J Clark
The Ohio State University
World Health Organization Carine Alsokhn Robert Jakob
Division of Data, Analytics and Delivery for Impact Samira Asma Doris Ma Fat
Somnath Chatterji WHO Verbal Autopsy Reference
Group
World Health Organization Adrienne Cox Eman Abdelkreem Aly
Regional Offices Monica Alonso Gonzalez Azza Mohamed Badr
Enrique Perez-Gutierrez Arash Rashidian (EMRO)
Nathalie El Omeiri Mark Landry (SEARO)
Andrea Vicari (AMRO/PAHO) Jun Gao (WPRO)
Humphrey Cyprian Karamagi (AFRO)
Statistics Division, United Nations Economic and Petra Nahmias
Social Commission for Asia and the Pacific David Rausis
Tanja Sejersen
Department of Epidemiology and Global Health Peter Byass, Advisor to WHO,
Umeå University Division of Data, Analytics and Delivery for Impact
Swiss Tropical and Public Health Institute Don de Savigny
University of Basel
Nuffield Department of Population Health Ben Lacey
University of Oxford
Vital Strategies Martin Bratschi Anushka Mangharam
Benjamin Clapham Tom Matte
Carlie Congdon Robert Mswia
Cynthia Driver James Mwanza
Ruxana Jina Elizabeth M. Ortiz
Adam Karpati Philip Setel
Farnaz Malik
iiRevealing the Toll of COVID-19:
A Technical Package for Rapid Mortality Surveillance and Epidemic Response
“Know your epidemic, know your
system, know your response.”
— UNAIDS, 2008
“No country is really sure how many people
it has lost in the [COVID-19] pandemic”
— New York Times, 2020
Preface
On Jan. 30, 2020 the World Health Organization (WHO) declared the outbreak
of coronavirus disease 2019 (COVID-19) a Public Health Emergency of
International Concern.A Even before this declaration, counts of deaths and
cases were a primary means of tracking the growth and trajectory of the
pandemic. In particular, graphs depicting excess total mortality by week from
countries around the world have been an increasingly common and powerful
way to capture and present the impact of the COVID-19 pandemic.
The purpose of this document is to provide practical guidance to implement
rapid mortality surveillance (RMS) and measure excess mortality in the
context of the COVID-19 pandemic, with a focus on implementation in low-
resource settings. This includes settings with largely paper-based systems of
data collection.
We define RMS as “a system for generating daily or weekly counts of total
mortality by age, sex, date of death, place of death, and place of usual
residence.” Excess mortality is the degree to which currently measured
mortality exceeds historically established levels. In the context of COVID-19,
increases in total mortality are attributed to direct and indirect effects of the
pandemic.
While this guidance is COVID-19 specific, the basic concept of rapid mortality
surveillance adds to the international architecture of population health
surveillance and civil registration and vital statistics (CRVS) systems.
A https://www.who.int/news-room/detail/30-01-2020-statement-on-the-second-meeting-of-the-international-health-reg-
ulations-(2005)-emergency-committee-regarding-the-outbreak-of-novel-coronavirus-(2019-ncov)
iiiRevealing the Toll of COVID-19:
A Technical Package for Rapid Mortality Surveillance and Epidemic Response
At one end of the spectrum, CRVS systems are fully functional, with digi-
tization speeding up the recording of deaths and causes of death in near
real-time. In these circumstances there is no distinction between RMS and
CRVS. At the other end of the spectrum are settings in which CRVS systems
are fragmented, have low completeness and coverage and are partially dig-
itized, and are not yet able to report weekly mortality in a timely fashion. In
these contexts, RMS can play important functions – particularly where restric-
tions on movement may be depressing death registration during the epidemic.
These functions include: I) providing more timely weekly counts of death than
would overwise be possible; and II) obtaining and retaining the information
sufficient for the later official registration of each death in the CRVS system.
In this document we provide:
• The rationale for and conceptual model of RMS
• Guidance for facility- and community-based surveillance
• Guidance for the analysis, visualization and use of the data
• A checklist for establishing a rapid mortality surveillance system
In addition to data collection for total mortality, we also discuss integration
with other surveillance systems and the inclusion of information on the man-
ner or cause of death. The guiding principles of RMS should be those that
pertain to any system innovation: country ownership and leadership; capacity
building; adaptability; and sustainability. Furthermore, it should be stressed
that RMS should, wherever possible, be integrated into the national CRVS sys-
tem—the essential nature of which, even under pandemic conditions, has been
made clear by the United Nations.B
This Technical Package is one of several global resources developed and sup-
ported by WHO and partners, including those of the Bloomberg Philanthropies
Data for Health Initiative. In addition to this document, these global resources
include:
• A technical note on Medically Certifying, International Classification of
Diseases (ICD) mortality coding, and reporting mortality associated with
COVID-19
• Technical guidance on COVID-19 coding in ICD-10C
• A web portal where countries are being requested by WHO to report
weekly mortality based on aggregate data from official cause-of-death
death certification
According to Article 64 of its constitution, WHO is mandated to request each
Member State to provide statistics on mortality. Furthermore, the WHO No-
menclature Regulations of 1967 affirms the importance of compiling and
publishing statistics of mortality and morbidity in comparable form. Member
States started to report mortality data to WHO since the early fifties and this
reporting activity is continuing until today. Every year WHO issues an annual
call for data on mortality and causes of death and those data have driven ma-
jor global health policies and research.
B https://unstats.un.org/legal-identity-agenda/COVID-19/
C https://www.who.int/classifications/icd/COVID-19-coding-icd10.pdf?ua=1
ivRevealing the Toll of COVID-19:
A Technical Package for Rapid Mortality Surveillance and Epidemic Response
Why Implement Rapid Mortality
Surveillance?
The slogan “Know your epidemic. Know your response” is as relevant today
as it was when first coined to link evidence to action in the face of AIDS [1].
How then do we “know” the epidemic? How do we measure it? In the current
context, two key indicators of impact are the number of COVID-19 cases and
the number of COVID-19 deaths as reported on global dashboards.D Yet these
indicators are challenging to measure and reflect only part of the burden and
distribution of the outbreak. Existing data from routine, and particularly syn-
dromic, surveillance systems may address some of the shortfalls by serving as
an early signal of undiagnosed COVID-19 cases [2]. However, understanding
the true impact of COVID-19 on mortality requires reliable data that are not
always available in a timely manner in many low-resource settings. Rapid mor-
tality surveillance (RMS) can fill this gap where existing civil registration and
vital statistics (CRVS) systems are unable to meet the need.
There are many approaches to mortality surveillance, involving all-cause and
cause-specific mortality systems in the health sector, as well as civil registra-
tion systems and medicolegal death investigation systems. Ideally, countries
have a digitized, unified death notification and registration system with high
levels of coverage and completeness that captures all deaths from all causes
in all settings (e.g. hospitals; care facilities; homes; or prisons) and can, there-
fore, be used to generate all necessary mortality data promptly.
However, in many low- and middle-income countries, the coverage and com-
pleteness of civil registration of deaths is often below below 20%. Hospitals,
as the main source of cause-of-death data, are frequently not integrated into
the civil registration system, and many systems are only partially digitized,
leading to significant lag times in reporting. Furthermore, not all countries use
the international standard form of the medical certificate of cause of death
and hence are unable to apply the International Classification of Diseases
(ICD) rules of mortality coding. This makes it difficult to statistically analyze
cause-of-death data over time and to compare between jurisdictions—even
where deaths are carefully certified.
Perhaps more importantly, a focus on total mortality encourages the measure-
ment of deaths occurring outside of a health facility, which can be the norm
in many low- and middle-income countries. In some countries up to 70% of
deaths may occur in the community, and therefore out of the reach of any like-
ly COVID-19 testing or clinical case detection.
D See e.g. World Health Organization (https://covid19.who.int/); Johns Hopkins (https://coronavirus.jhu.edu/map.html);
Google (https://www.google.com/covid19-map/)
5Revealing the Toll of COVID-19:
A Technical Package for Rapid Mortality Surveillance and Epidemic Response
Why Total Mortality?
Identifying COVID-19-specific mortality is a challenge across the globe. In
many countries, limits on test availability have led to restrictive criteria for
access and use, even for people with symptoms. This makes the generalization
of testing results impossible and counts of COVID-19 “cases” and “deaths”
extremely difficult to interpret.
Without the testing of all suspected cases, health care providers, medical
examiners and coroners are left to rely on evolving knowledge of the signs and
symptoms associated with COVID-19 deaths. Our ability or inability to differen-
tiate these from other causes of death may result in misclassification. Further-
more, due to societal and health system disruptions, the epidemic contributes
to deaths from other causes.
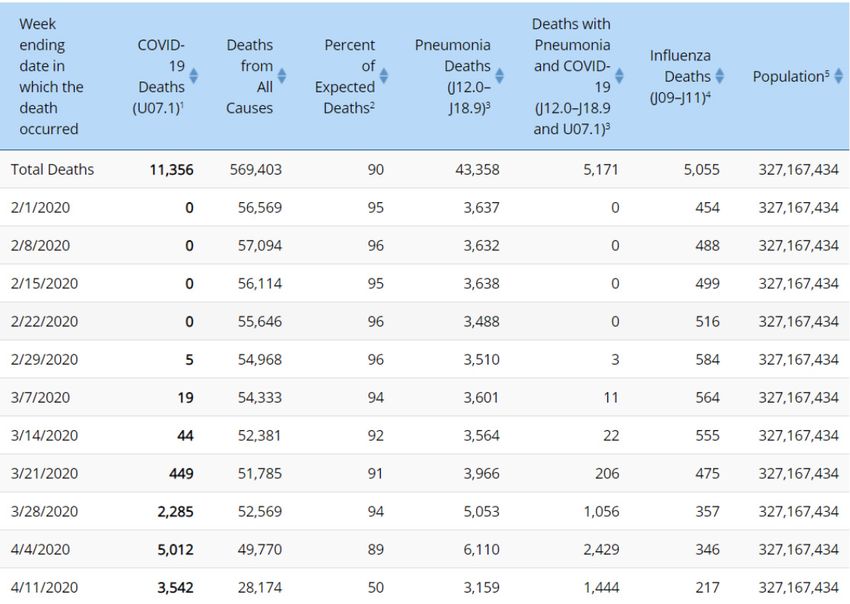
Given these challenges, WHO is calling on all governments to report weekly
total mortality based on registration data. Aggregated data can be uploaded
to WHO via a global portal. Particularly if begun early enough in the epidemic,
visualizations of total mortality even without age and sex disaggregation are
readily interpretable. For example, Figure 1 was produced using publicly avail-
able data for a large city Brazil. It clearly shows the weekly excess mortality in
2020 compared to 2019 starting in week 14. Even without the historical com-
parison, the conclusions would be stark. Figure 2 shows a historically expect-
ed range of deaths by week, a preferred way to display the historical range if
data are available.
FIGURE 1
Weekly deaths Manaus, Brazil 2020 (source: Civil Register COVID Portal/Brazil)A
2019
2020
1000
NUMBER OF TOTAL DEATHS
800
600
400
200
0
1 2 3 4 5 6 7 8 9 10 11 12 13 14 15 16 17
WEEKS
A https://transparencia.registrocivil.org.br/registral-covid
6Revealing the Toll of COVID-19:
A Technical Package for Rapid Mortality Surveillance and Epidemic Response
FIGURE 2
Weekly deaths in 2020 by age group, Switzerland (source [3])
The purpose of rapid mortality surveillance is to inform decision-makers about
the scale and direction of the epidemic with a straightforward focus on excess
mortality. It provides insights into the full magnitude of the health conse-
quences of the epidemic (beyond case counts and mortality counts based on
lab diagnosis), and into disparities in disease burden across geographic and
demographic groups. Also, despite mortality being a lagging indicator of infec-
tions, it provides insight into ongoing population transmission patterns. Never-
theless, countries must also rely on many other indicators for decision-making
during the COVID-19 pandemic.
Weekly counts of total deaths to achieve this purpose have been available
in high-income countries [3-6] but are rarely published from low- and mid-
dle-income countries. At present there are no clear standards and protocols
for reporting on all deaths, regardless of cause [7, 8]. Some middle-income
countries, for example in Latin America, have the data and are analyzing it for
the first time in an epidemic context.E In South Africa, where data are obtained
from a digitized population register, the rapid mortality surveillance system
has provided the timeliness of data production needed [9].
This technical guide addresses how rapid mortality surveillance can be ap-
plied for both facility- and community-based deaths where resources are
constrained. This includes contexts with little or no digitization and connec-
tivity. The guidance provided will enable health authorities to compile data so
they can detect and monitor mortality, which will in turn inform decision-mak-
ing over the course of the epidemic. The guidance has been kept as simple
and fit-for-purpose as possible, bearing in mind that implementation will take
place under challenging conditions.
E See for example: https://transparencia.registrocivil.org.br/registral-covid
7Rapid Mortality Surveillance in Low-Resource Settings:
Data for Epidemic Awareness
The Rapid Mortality Surveillance
(RMS) Concept
The function of rapid mortality surveillance is to generate the data needed
to analyze excess mortality by age and sex on a weekly basis. At its simplest
level, the system should be capable of generating a visualization of mortality
trends or excess mortality similar to the ones in Figures 1 and 2. To do this,
there must be: i) a source of rapidly and routinely reported deaths by age, sex
and location; and ii) some means to establish a baseline of pre-epidemic mor-
tality levels by age and sex against which to compare the current reports.
The RMS concept has two main components—facility-based surveillance and
community-based surveillance—as shown in Figure 3. Community-based sur-
veillance is important where a significant number of deaths are either known
or suspected to be occurring at home or otherwise outside of a health facili-
ty. In countries where a significant proportion of deaths are captured only by
coroners or medical examiners as part of the medicolegal death investigation
system (MLDI), this system should also be included.
FIGURE 3
Rapid Mortality Surveillance System
FACILITY-BASED REPORTING COMMUNITY-BASED REPORTING MEDICOLEGAL DEATH INVESTIGATION
DAILY OR WEEKLY TRANSMISSION
COMPILATION, QUALITY ASSURANCE, ANALYSIS
DECISION-MAKING
8Revealing the Toll of COVID-19:
A Technical Package for Rapid Mortality Surveillance and Epidemic Response
The minimum set of data elements recommended for collection across all the
components of an RMS system (i.e. facility, community, and MLDI where nec-
essary) are as follows:
• Age—decedent’s age at death
• Sex
• Place of usual residence—geographic location (e.g. region or district)
where the deceased usually resided
• Date of occurrence—the date (day, month and year) the death occurred
• Site of occurrence—whether in a health facility, at home or elsewhere
(e.g. roadway)
The system should primarily operate without the need for close physical prox-
imity and interaction between data collectors and respondents, particularly
under the most severe epidemic conditions. That said, to the extent that any
surveillance activity requires field or facility-based work, the guidance con-
tained in Annex 1 may be used to enable protection of surveillance workers
under different epidemiologic scenarios.
Given the strains on the systems under pandemic conditions, existing report-
ing processes are likely the best basis for rapid mortality surveillance–and may
possibly be outside the usual flow of data from CRVS systems. Furthermore,
to allow for the timely dissemination of real-time mortality estimates, surveil-
lance system modifications may be required, including temporarily altering or
reducing the amount of data collected; shortening reporting timelines; simpli-
fying data flow; deploying faster means of data transmission; or abbreviating
validation processes.
Such changes may be needed because of the demands of weekly reporting
and the effect of public health and social measures on the operation of rou-
tine systems. Nevertheless, care should be taken wherever possible to actively
collect and retain the minimum data elements necessary to contact families
and complete an official death notification to the civil registrar. Collecting,
storing and sharing these data with registrars will permit the CRVS system to
complete the death registration process at a later date.
Any rapid mortality surveillance processes established should consider ex-
isting infrastructure and business processes for data collection and trans-
mission, existing human resources and responsibilities, protocols or standard
operating procedures for all stakeholders involved, and communications tech-
nology solutions for the data collection.
For community-based surveillance, a rapid initial assessment should be done
of the existing surveillance or reporting options that may be leveraged for
RMS or into which RMS might be integrated. This review should consider the
coverage or completeness of the system, as well as its timeliness in reporting
and its likely ability to detect all mortality events occurring in a representa-
tive manner. This assessment should lead to one or two candidate systems
for integration. For example, many countries implement syndromic mortality
surveillance on severe acute respiratory infections (SARI) or influenza-like
illness (ILI) [8]. Elsewhere, the integrated disease surveillance and response
(IDSR) strategy is used [10]. Any of these systems may present opportunities
for integration of RMS. Community health workers, particularly if there is full
coverage of a part or whole of a country, are a useful resource to consider as
reporters of deaths.
9Revealing the Toll of COVID-19:
A Technical Package for Rapid Mortality Surveillance and Epidemic Response
Facility-Based Surveillance
Facility-based all-cause mortality surveillance aims to collect information
regarding all deaths occurring at a health facility, with the optional collec-
tion of cause-of-death information where feasible. Many countries will want
to include cause of death—particularly COVID-19-specific mortality—in their
reports. Where manner or cause of death is also collected, cause-specific
mortality fractions—that is, the proportions of all deaths due to broad or spe-
cific causes—can be calculated. The means to do so are addressed in Annex 2:
Including Manner and Cause of Death.
Observed hospital mortality data can be compared to historical deaths from
the same facility. Observed versus baseline facility-level mortality data would
ideally be compared relative to the number of hospital admissions; deaths on
arrival; and deaths occurring between arrival and admission, to account for
changes in facility utilization. Baseline and current hospital admission data
should therefore also be collected. The admissions data is recommended to
assist with the interpretation of trends to account for any change in utilization.
A facility-based all-cause mortality surveillance system can build on existing
networks of sentinel hospitals, or hospitals identified or sampled in some
other manner. Health facilities worldwide collect information on total inpatient
deaths and report this data, typically on a monthly basis, either as aggregat-
ed counts or patient-level records. They may also collect disease-specific
or age-specific death counts through routine health information systems or
program-specific surveillance tools. Some health facilities maintain a mortality
register where all inpatient deaths are documented.
If certain hospitals are to be selected as sentinel sites, they should be cho-
sen to be geographically representative, whether through a formal sampling
exercise or a systematic consultative process with health experts. Given the
dynamics of the COVID-19 pandemic, there should also be an effort to select
health facilities serving areas of high population density, communities with
close living conditions, and high-risk populations (e.g. older people, socially
vulnerable people, people with comorbidities, etc.).
Some countries have established temporary hospitals or isolation camps for
COVID-19. These should be included.
Sites that report only aggregated data can continue to do so, while taking
steps to reduce the reporting time frames and processing times, and moving
to disaggregate data by age and sex. Several countries that rely heavily on
paper-based systems are devising ways of rapidly relaying daily information
from health facilities on several priority indicators (e.g. personal protective
equipment supplies; patient volume; bed capacity; drug supplies, etc.). Due
to the time-sensitive nature of data collection, some are deploying interactive
SMS systems using mobile phones to obtain this data, bypassing routine pa-
per-based processes. Total mortality counts could be added to such systems.
Figure 4 shows a simplified business process map to produce data from fa-
cility-based surveillance (map shown is for total mortality analysis; cause-of-
death analysis can be added as applicable.)
10Revealing the Toll of COVID-19:
A Technical Package for Rapid Mortality Surveillance and Epidemic Response
FIGURE 4
Simplified business process for facility-based surveillance
Rapid Mortality Surveillance
CLINICIAN MEDICAL RECORDS CENTRAL LEVEL EPIDEMIC RESPONSE TEAM
Death
occurs
Produce Death Notification; Create and transmit Compile, analyze Examine levels and
WHO Medical Certificate daily/weekly lists of and graph indicators trends in mortality by
of Cause of Death; or other deaths by age, sex, of total mortality age, sex, and location
form used in country location to inform action
FIGURE 5
Sample weekly listing sheet: health facility
Date for week ending/week number:
Facility name:
Date of completion:
Name of person completing this form:
Death # Patient ID [do not transmit] Sex Age at Death Date of Death
1 XX-XXXXX M 82 15-04-2020
2 XX-XXXXX F 55 15-04-2020
3 XX-XXXXX M 35 16-04-2020
... ... ... ... ...
Figure 5 shows a proposed template for data collection.
Figures 4 and 5 have been kept as simple as possible to account for applica-
tion even in paper-based systems backed up by limited or no connectivity from
the periphery. In such situations, the business process described in Figure
4 should still be applicable. In the facility setting, the RMS reporting routine
may be integrated into the existing pathways for handling medical certificates
of cause of death. Furthermore, it should still be possible to complete weekly
listing sheets in Figure 5 and, if necessary, report them over a phone line to
the central level. The central level authority may be an Epidemiology unit of
the Ministry of Health or a specially created Epidemiology Intelligence Unit.
Aggregation, tabulation, and analysis and graphing of excess mortality for
policy-makers takes place at this level. Data use and interpretation is the re-
sponsibility of the government authority charged with epidemic response. The
degree, trajectory, and slope of excess mortality revealed should be a central
input into the deliberations of this entity.
It is of great importance that even during the pandemic and while running an
RMS system, countries should continue documentation and secure storage
of cases with medical records and an ICD-compliant medical certificate of
11Revealing the Toll of COVID-19:
A Technical Package for Rapid Mortality Surveillance and Epidemic Response
cause of death (MCCD). In addition, it is critically a clear picture of all-cause and cause-specific
important that efforts to register deaths with the mortality in Peru. Death certification in Peru can
civil registry continue. Nevertheless, fact-of-death be done in online electronic formats or the tradi-
reporting should not be delayed by the certifica- tional paper format, where internet access remains
tion and registration process when doing so would a challenge. A total of 70% of all deaths nationally
significantly affect the timeliness of reporting. The are registered online within the first 24 hours.
United Nations Legal Identity Agenda has declared
If there is no existing electronic data collection
that civil registration should be considered an es-
system, a system can be established specifically
sential government service.F However, some public
for the collection of RMS data. Systems such as
health and social measures may make immediate
RapidProH (leveraging interactive SMS messaging)
registration challenging. If immediate civil registra-
or Open Data Kit (ODK)I could be considered. If
tion of deaths is not possible, completed MCCD
required, information can also be shared by tele-
forms and/or other death notification forms can
phone, email or simple messaging services.
be stored until civil registration becomes possible
again. Ultimately, the legal documentation provided Available human resources, required hardware,
by the civil registration system will be essential for and financial resources should be considered
people, so any backlogs in registration that occur closely when deciding on the system to use for the
during the pandemic must be cleared as soon as transmission of data from the health facilities to
practical. the central level. Public-private partnerships with
telecommunications companies may allow for free
During pandemic or public health emergency
or reduced cost services, as is the case in Colom-
conditions, daily reports of COVID-19-related
bia. In all cases, national policies regarding patient
deaths may be required. It may, therefore, be most
privacy and security should be adhered to.
straightforward to report all deaths daily. Compiling
and transmitting data to the central level should be At the central level, the designated unit at the
done by a designated person at each sentinel site— ministry of health should compile reports from the
ideally someone in a non-clinical role such as med- facilities. This central data aggregation unit should
ical records staff. Electronic systems may facilitate also monitor reporting from the facilities and follow
real-time data transmission, while paper-based up with facilities that are not reporting on time.
systems will require processing time. Following aggregation of reports from the facilities,
the central level staff can proceed to analyze the
It is also critical to report the absence of any
deaths recorded for the day (zero reporting), when data (see below).
applicable. This is to distinguish the fact that zero Establishing pre-epidemic levels of mortality is
deaths occurred from a missed reporting cycle. another task related to setting up rapid mortality
surveillance. Specifically, comparison data from
For the transmission of data from the hospitals to
the previous one to five years from the reporting
the central level (likely a unit at the central of-
facilities—ideally with details of deaths by age and
fice of the ministry of health), various options are
sex, cause-of-death information, and total facility
possible. Currently implemented electronic health
admissions for the reporting periods—will need to
information systems such as DHIS-2G and electron-
be compiled for analysis.
ic medical record systems such as Peru’s SINADEF
should be evaluated to determine if the suggested
data about deaths is already being collected or if
data collection systems that are in place can be
easily modified to ensure the rapid collection of
the recommended data. SINADEF is the Peruvian
Ministry of Health’s online cause-of-death system,
which has been functional and operating widely in
Peru since 2016. Capitalizing on its use early in the
COVID-19 pandemic has been critical to providing
F See https://unstats.un.org/legal-identity-agenda/COVID-19/
G https://www.dhis2.org/
H https://rapidpro.io/
I https://opendatakit.org/
12Revealing the Toll of COVID-19:
A Technical Package for Rapid Mortality Surveillance and Epidemic Response
Community-Based Surveillance
Given its purpose of illuminating the impact and trajectory of the epidemic,
rapid community surveillance of total mortality is crucially important in coun-
tries where a significant proportion of deaths occur outside of a formal health
care setting and levels of civil registration of deaths are low. It may also be
important for inclusion of remote geographic locations or marginalized popula-
tions with limited access to health care.
The proportion of deaths occurring outside of health facilities may increase
during an epidemic if hospital capacity is exceeded. As with facility-based sur-
veillance, the focus should be on total, all-cause mortality measurement with
the addition of cause-of-death inquiry only where feasible.
Where CRVS systems are digitized and functioning, as in Peru, Brazil and
South Africa, they may be a ready source of data to display excess mortality
[9]. More commonly in low- and middle-income countries, other surveillance
systems or strategies such as integrated disease surveillance and response
(IDSR), which is designed to accommodate novel pathogens and other unan-
ticipated outbreaks, or the severe acute respiratory infections (SARI) sentinel
surveillance system, may be leveraged to achieve rapid mortality surveillance.
Should this be the case, rapid mortality surveillance activities should be care-
fully integrated with any existing surveillance and reporting frameworks.
To the extent possible, community site selection should provide a represen-
tative picture at a national (or sub-national) level and follow some standards
with regard to sampling [11]. Governments may want to augment representa-
tive samples with sentinel sites reflecting high-risk or vulnerable populations
such as, displaced people, people who reside in slums/informal settlements,
food-insecure people, etc. Existing community systems that monitor deaths
may also be incorporated, such as health and demographic surveillance
systems.J
As discussed below, the sites should be selected as complete administrative
units with available estimated population figures (e.g. sub-districts, wards,
counties), and for which numbers of expected deaths can be generated. This
will enable the calculation of pre-epidemic mortality levels needed to deter-
mine excess mortality. In practice, time and financial resource constraints may
necessitate selection based on other considerations.
Regardless of how sentinel community sites for RMS are selected, certain con-
ditions favor the success of the effort including:
• The presence of a community health or development worker cadre whose
routine duties include identifying and reporting incident births and deaths;
other community actors may be considered for supporting the death re-
porting processes, including faith-based organizations, funeral homes or
mortuaries, private sector, research institutions, or civil society;
• Established or pandemic-related death management processes that in-
volve contact (remote or direct) with the family (e.g., burial teams or regu-
lated burial or mortuary processes);
• Presence of a mobile communications platform that facilitates reliable
remote connectivity to the community for reporting events; and/or
J See http://www.indepth-network.org/
13Revealing the Toll of COVID-19:
A Technical Package for Rapid Mortality Surveillance and Epidemic Response
• Existing alternative health care structures, for example mobile clinics and
outreach, which provide alternative avenues for care seeking, mortality
data capture and reporting.
Figure 6 shows a simplified generic business process for community-based
surveillance. As in the case of facility-based surveillance (Figure 4), the identi-
fication of deaths as part of RMS should serve the purpose of notification for
the civil registration system where possible. This can be ensured by creating—
at the point where the death is detected by the RMS reporting structure—a
notification for each death with unique identification information, which is
then stored safely for eventual civil registration.
FIGURE 6
Simplified business process for community-based surveillance
Rapid Mortality Surveillance
CLINICIAN MEDICAL RECORDS CENTRAL LEVEL EPIDEMIC RESPONSE TEAM
Death
occurs
Community/religious Create and transmit Compile, analyze Examine levels and
leader receives notice daily/weekly lists of and graph indicators trends in mortality by
of death deaths by age, sex, of total mortality age, sex, and location
location to inform action
When a death occurs in the community, the community reporter (often a
frontline health worker) will receive notice from members of the community via
established channels or channels created for the purposes of RMS. The Africa
CDC’s guidance on event-based surveillance may be of assistance with this
[12].
Information on each death should be recorded using a listing form such as
that in Figure 7 below.
FIGURE 7
Sample listing sheet: community-based surveillance
Date for week ending/week number:
Site name:
Date form completed:
Name of person completing form:
DO NOT TRANSMIT
Death Family Contact Telephone or Other Name of Sex Age at Date of Death Died in Health
# Name Contact Information Deceased Death Facility [Y/N]
1 Abdi Michael +(XX) XXX XXXX Baby boy M 0 06-04-2020 N
2 Rahema Machui +(XX) XXX XXXX Pendo Machui F 68 06-04-2020 N
3 Juma Muhammed +(XX) XXX XXXX Aziz Aziz M 81 09-04-2020 Y
... ... ... ... ... ... ... ...
14Revealing the Toll of COVID-19:
A Technical Package for Rapid Mortality Surveillance and Epidemic Response
As in the case of facility-based surveillance, many countries will want to
explore causes in community deaths occurring during the pandemic. Guid-
ance on how to do this is provided in Annex 2: Including Manner and Cause of
Death.
It is recommended that the list of all deaths be completed as reports come
in and be transmitted daily or weekly. Although collected for the purposes
of later follow-up for death registration, the name of the family contact, tele-
phone or other contact information, and the name of the deceased should be
retained confidentially by surveillance system supervisors at each surveillance
site. For the transmission of data from the community to the central level, it is
preferred that data collection is set up using existing infrastructure, ensuring
the proper role of local and sub-national levels to ensure timeliness and qual-
ity of data. If there is no existing electronic data collection system, a system
specifically for the collection of data as part of RMS can be established. To
ensure smooth operation and sustainability, available human resources, re-
quired hardware, and financial resources should be considered carefully when
deciding on the system to use for the transmission of data from the communi-
ty to the central level.
As in the case of facility-based surveillance, the business process described
in Figure 6 and listing sheet shown in Figure 7 should be suitable even where
digitization and connectivity of systems is extremely limited.
At the central level, the designated unit at the ministry of health should com-
pile reports from the community sites. This central data aggregation unit
should also monitor reporting from the different sites and follow up with sites
that are not reporting on time. Following aggregation of reports, the central
level staff can proceed to analyze the data.
Data Quality
For both community- and facility-based collection, continuous monitoring of
the quality of data being collected will need to be established. Quality con-
cerns include: accuracy; completeness; timeliness; consistency; coverage;
smooth flow of data; and data management and processing at the central
level. For example, the number of sites and reporting rates could vary, espe-
cially when the RMS system is being established, and this would need to be
considered when analyzing and interpreting the data. Existing systems should
be evaluated to ensure that data quality strategies are in place and used to
continuously monitor the data.
For aggregated data, each report on numbers of death by age groups and
sex should be checked to ensure that the reports are plausible (for example,
compared to the report from the previous reporting period) and any anomalies
(for example, if the number of reported deaths in one age group or of one sex
suddenly increases or decreases substantially) should be confirmed with the
person who submitted the report. Built-in components in the data collection
workflow (such as skip logic, inconsistency checks, automated calculations,
data validations, and instructional prompts) should be evaluated to ensure
quality of data and to increase the accuracy and completeness in data col-
lection and processing. In countries where the adaptation of existing systems
or addition of data collection systems may be necessary, the adaptations and
additions must be well-designed to include necessary data quality checks and
formatting for simplicity and rapid application.
15Revealing the Toll of COVID-19:
A Technical Package for Rapid Mortality Surveillance and Epidemic Response
It may be necessary for the central level to provide remote data quality as-
sistance to field teams to ensure that RMS is operating effectively and as
intended. Remote support will be necessary where restrictions on movement
and meetings would prevent in-person visits for data quality checks. A tool like
WhatsApp mobile messaging could be used, for example, to facilitate more
real-time communication and feedback among stakeholders, data managers
at central level, and community or facility teams to ensure quality of data, and
as way to send frequent reminders to all implementing teams to follow data
quality and accountability protocols. These could include measures to ensure
deaths are not double counted from either facilities or communities; ensuring
reporting even if there were zero deaths; and taking measures to smooth the
impact of missing reports by averaging where necessary.
Deriving Estimates of Historical
Mortality for Community-Based
Surveillance
The task of establishing historical mortality levels for community surveillance
sites is challenging in settings where CRVS systems have had historically low
levels of death registration completeness and coverage. Accurate data on
population size and expected deaths in sentinel areas are needed to measure
excess mortality.
For many low- and middle-income countries, the challenge will be specifying
the expected numbers of deaths prior to COVID-19, especially for local areas
and settings where large numbers of deaths occur outside health facilities.
To address this issue, we propose using the following crude indirect demo-
graphic methods to estimate the expected number of deaths using coun-
try-specific: I) population estimates and II) mortality data from the U.N. World
Population Prospects 2019.K
The key assumption with this approach is that sentinel site boundaries match
those of administrative units for which there are estimated population figures
(e.g. sub-districts; wards; counties). If this is not the case and the boundaries
of community reporting sites cut across multiple administrative units, the con-
struction of a baseline is particularly challenging. Under these circumstances,
it is recommended to use the early RMS mortality counts as a baseline, and
track levels and trends from that point forward.
It is also assumed the sentinel population structure (in terms of age and sex
distribution) is similar to the national population as estimated in the U.N.
World Population Prospects 2019 data.
The method proposed here involves applying age-specific death rates derived
from the U.N. World Population Prospects to the sentinel population, and ap-
plying them separately for males and females and age categories. We use this
indirect demographic approach because it is easy to implement and because
primary historic data on the number of deaths in the sentinel population and/
or sex- and age-specific death rates from sentinel sites may not otherwise be
available.
K See: https://population.un.org/wpp/Download/Standard/
16Revealing the Toll of COVID-19:
A Technical Package for Rapid Mortality Surveillance and Epidemic Response
Below are the steps to follow:
• From the most recent U.N. World Population Prospects 2019,L obtain pop-
ulation size by age group for males and females for each year from 2015 to
2020M for the country of interest. Use the downloadable spreadsheet files
“Annual Population by Age Groups - Male” and “Annual Population by Age
Groups - Female”.
• For the same country of interest, from the U.N. World Population Prospects
2019, obtain number of deaths by age group for males and females from
2015 to 2020.N Use the downloadable spreadsheet files “Deaths by Age
Groups—Male” and “Deaths by Age Groups—Female.”
• Calculate age-specific mortality rates (ASMR) based on the reference pop-
ulation figures and number of deaths obtained from the U.N. World Pop-
ulation Prospects for males and females for each of the years of interest
(2015-2019). ASMR is obtained by dividing total number of deaths in an age
group for the year of interest (numerator) by the midyear population for the
same age group in that particular year (denominator).
• Obtain population sizes of sentinel sites, by age groups (0-59 years; 60+
years) and sex, from available sources such as the national census projec-
tions.
• Apply the age-specific mortality rates derived from the U.N. World Popu-
lation Prospects 2019 data to the sentinel population to obtain expected
number of deaths in the sentinel sites for each year of interest (2015-2019).
This is done by multiplying the number of people in each age group of the
sentinel population by the age-specific mortality rate in the comparable
age group of the reference population for males and females.
• From the annual expected number of deaths in the sentinel sites by age
group and sex for the years 2015-2019, the average weekly number of
deaths over these years can be calculated, taking note of disasters or
outbreaks with high death tolls in prior years (both to ensure data is not
skewed, and to use those periods as a point of reference). Measures of
deviation around the average in these recent years can also be computed.
The approach described above is relatively easy to implement. With the de-
scribed method, there is no need to know the age-specific mortality rates of
the sentinel population (only the population distribution by age group and sex),
as these rates may be difficult to obtain. This method will not, however, ac-
count for sub-national variation in mortality, which may be substantial in some
settings (for example, urban versus rural). If such variation is known to exist for
the particular country or the selected sentinel sites, more elaborate methodol-
ogies to estimate baseline levels of mortality could be considered. Additional
sources of data on mortality such as, for example, from Demographic and
Health Surveys (DHS) or Multiple Indicator Cluster Surveys (MICS), could be
considered to understand and account for sub-national variations in mortality.
Estimating baseline levels of mortality for the sentinel sites of the RMS system
taking into account these sources of information will be considerably more
complex.
L https://www.un.org/en/development/desa/population/publications/manual/estimate/demographic-estimation.as
M See: https://population.un.org/wpp/Download/Standard/Population/
N See: https://population.un.org/wpp/Download/Standard/Mortality/
17Revealing the Toll of COVID-19:
A Technical Package for Rapid Mortality Surveillance and Epidemic Response
Another option is to use the central age-specific probability of death, column
(nmx) in the abridged life table for the 2015-2020 period, which can also be ob-
tained from the U.N. World Population Prospects 2019. However, doing so will
not permit calculation of annual age-specific mortality rates. Finally, it may be
possible to use census data to derive expected numbers of deaths if data are
considered recent enough.
As noted above, where it is not possible to determine a baseline, it will be
necessary to use the first sets of observations as a contemporary baseline and
track subsequent trends.
Graphing Excess Mortality
With the two data sources (i.e. weekly mortality reports of current mortality
and comparison data), a graph of excess mortality such as that in Figure 1
can be created. This can be achieved by creating a line graph in a spread-
sheet or statistical software program plotting the total number of deaths per
week against the baseline (historical or estimated) data. Where desired, more
detailed analyses of excess mortality can be carried out by age group, sex or
location. As shown in the example from Switzerland in Figure 2, the number
of deaths per week was plotted from January of 2020 against the upper and
lower limit of the statistically expected value for two age groups: 0-64 and
65+. Displaying the data in this manner clearly pinpoints at least one popula-
tion sub-group (those over about age 60) known to be especially vulnerable to
COVID-19.
Accompanying this document is an Excess Mortality Calculator spread–
sheet template, which may be freely downloaded and used to aid in
these visualizations.O
Analysis and Interpretation
Once all-cause mortality data have been collected through either facility- or
community-based surveillance, and historical data has been compiled or esti-
mates of expected deaths have been calculated, the data can be compared to
determine the extent to which observed deaths exceed baseline deaths, as an
indicator of the overall COVID-19 mortality burden. This can be presented as
one of the following measures:
• The absolute number and/or percentage above or below the limit of the
95% confidence interval derived from the historic number of deaths from
at least four years of data; or
• The absolute number and/or percentage above or below the historic aver-
age number of deaths during each of the reporting periods.
O Available from: https://vital.box.com/v/ExcessMortalityCalculator
18Revealing the Toll of COVID-19:
A Technical Package for Rapid Mortality Surveillance and Epidemic Response
The following points need to be considered in interpreting the excess of ob-
Data Source
served mortality:
• BasicWhen
demographic information
it is not possible for alltodeaths registered
calculate on 95%
the the National Populationinterval
confidence Register are provided
due to the
to lim-
SAMRC on a weekly basis. Since the weekly number of deaths has a
ited historical data, the absolute number and percentage above or belowseasonal trend, historical data from 2018 and
2019 have been used to predict the number of deaths that could be expected during 2020.
a baseline from the previous year(s) can be calculated. The latter may also
The be
excelmore understandable
forecast function has been used fortodecision-makers.
predict values for each week of 2020 based on a linear annual trend,
allowing for a seasonal effect over the year. In addition, 95% confidence intervals have been estimated for the
• predicted
For facility-based surveillance,
weekly number of deaths for 2020 to excess mortality
give a basis should preferably be cal-
to assess fluctuations.
culated per 10,000 admissions, if possible, to account for potential chang-
Graphs in this report have been prepared of the weekly number of deaths up till epidemiological week 15 covering
es in from
the period facility admissions
1 January 2020 till 14 over time.
April 2020 Where
based on thehistorical
data receiveddata
on 20 are
April available in date of
2020. The start
eachfacilities, and if estimates
week is represented on the graph. are only available for the year, the annual esti-
mate would need to be divided by 12 to obtain the monthly average or by
Data for the most recent week has been scaled up to account for the lag in registrations. Based on previous data, a
52ofto
factor obtain
1.050 a weekly
has been applied. average to provide a crude baseline.
This information
It must can
be noted that the be compared
National to data
Population Register hasfrom previous
only the registeredyears topersons
deaths of furtherwith a national ID
number and thus does not include unregistered deaths some registered
understand the burden of the pandemic. For example, as Figure 8 shows, the deaths.
weekly
Trends number of deaths in South Africa had not exceeded the expected his-
torical values by April 2020. It should be noted, however, as Figure 9 indicates,
• Thein
declines weekly number
deaths due of deaths up till 14 Aprilcauses
to non-natural 2020 are generally
over the within
same the period
bounds ofmay
expectation
be anbased on
the historical data.
offsetting factor. These figures serve as a reminder that no excess mortality
• The numbers of deaths in the most recent four weeks are lower than predicted as a result of a decline in
may bethe detected: an important finding for policy makers in its own right.
number of deaths from non-natural causes (eg road traffic fatalities and homicide). See graph at end of
report. The decline has been experienced for both males and females.
FIGURE
• 8Deaths from natural causes show no unusual sign of increase by 14 April 2020 among people less than 60
Weeklyyears
deaths inover
or those 2020, Republic of South Africa (source [9])
60 years.
Number for the last week has been adjusted for delayed registrations.
FIGURE 9
Weekly deaths from non-natural causes,1Republic of South Africa (source [9])
Number for the last week has been adjusted for delayed registrations
19Revealing the Toll of COVID-19:
A Technical Package for Rapid Mortality Surveillance and Epidemic Response
If cause-of-death data are available, the excess mortality measures can also
be calculated for specific causes. Based on available cause-of-death data, it
would be possible to determine the percentage of excess deaths related to
COVID-19 using the two emergency ICD-10 codes, U07.1 and U07.2. Cause-
of-death data can also be used to visualize the excess deaths due to influ-
enza-like illness (ILI), severe acute respiratory infections (SARI), pneumonia,
other acute respiratory conditions, or any other cause.
To the extent analyses are based on preliminary or incomplete data, this
should be noted and reports updated accordingly.
Total excess mortality during the epidemic period can also be expressed to
indicate the extent (proportional increase) to which excess deaths would
increase the total expected mortality rate, within a time period, in the relevant
area or country. For later analysis, excess mortality can be calculated using
crude mortality rates per year.
It should be stated, however, that the lag between exposure, infection, death,
reporting, analysis, and publication means that users need to be cautious
about using mortality data to make inferences about the trajectory of the out-
break in real time. Mortality can be used to assess the trajectory, but it must
be acknowledged that it reflects infections that occurred several weeks earlier.
In general, site data should be analyzed discretely. The stastical challenges in
combining data from multiple sentinel sites are significant, and users should
consult an expert demographer or epidemiologist about particular country
situations.
Use of Rapid Mortality
Surveillance Data
Comparing the current number of deaths to historical levels and patterns
(e.g. from prior years, but even with the immediate pre-epidemic period) can
provide understanding of the impact of COVID-19 on the population and on
the health care system. The difference between the historical and current
mortality burden is the excess that is presumed to be related to the COVID-19
pandemic. Further, the data produced by RMS systems can be used to mea-
sure burden and impact of the pandemic with resolution to geographic areas,
demographic groups or vulnerable populations.
Examining excess mortality burden in comparison to laboratory-confirmed
COVID-19 deaths or deaths with a COVID-related cause can provide insights
into gaps in disease surveillance and the performance of other surveillance
systems—for example, by detecting areas or populations where case reporting
is low or absent. Conversely, where robust disease-specific mortality measure-
ment is available, all-cause mortality provides a complementary indication of
the indirect impact of the epidemic, due to societal and health care system
disruptions.
20Revealing the Toll of COVID-19:
A Technical Package for Rapid Mortality Surveillance and Epidemic Response
RMS data can also provide information about the impact of public health and
social measures and trends in community transmission—especially where
health care utilization and testing data are scarce. Because RMS reflects both
direct and indirect effects, it is also is essential to evaluating the impact not
only of COVID-19 itself but of the response and its consequences, such as
social measures and interruptions in essential services. Where location of
residence correlates with the distribution of social disadvantage, examining
all-cause mortality at the local or subnational levels can illuminate disparities
in disease impact.
The insights provided by measuring total mortality, rather than disease-
specific mortality or case counts, will likely present governments with
dismaying and difficult conclusions about the broader scope of the outbreak.
Surveillance staff must be prepared to clearly explain the data and to help
leaders and non-technical audiences understand and communicate the
results. It is a common but difficult problem in public health surveillance,
whereby improvements or enhancements to data collection systems produce
larger estimates of disease burden. It is critical that government leaders be
prepared to receive and integrate these data into their public communication
and internal decision-making processes.
21You can also read