Central Karoo District - District Health Plan 2018/19 to 2020/21 - Department of Health

Page created by Edna Brewer
 
CONTINUE READING
Central Karoo District - District Health Plan 2018/19 to 2020/21 - Department of Health
Central Karoo District

      Western Cape

              District Health Plan
                     2018/19 to 2020/21
Central Karoo District - District Health Plan 2018/19 to 2020/21 - Department of Health
1.        EXECUTIVE SUMMARY BY THE DISTRICT MANAGER
The Central Karoo District Health Service functions in partnership with the other health service
rendering entities in the geographic area. This includes the George Regional Hospital, the
Emergency Medical Services, and the Forensic Pathology Services.

In addition we have close ties to the Environmental Health Team of the Central Karoo District
Municipality, and other key role players in the social cluster: Department of Education and Social
development.

There is also increasingly more interaction with the Local Municipalities (political and officials) and
community participation. The Central Karoo district is committed to collaborate with all
stakeholders to ensure that PSG2 and PSG3 are addressed.

For District Health Services, the focus for the year will be on promoting the development of the
principles of Community Orientated Primary Care. All decision-making will be done to enhance the
progress towards the implementation of this model ensuring that that the focus will be on the needs
of the people served and a shift from illness to wellness. This is a model that starts in the home at the
community level, follows through to PHC facility to District hospital and ultimately to the Regional
Hospital in a seamless way.

As part of this development, it also means that Primary Health Care facilities need special attention
to ensure that they are fully functional.
This means, inter alia:
     1.    Strengthening clinical support
     2.    Ensuring Supply Chain Management efficiencies.
     3.    Interrogating doctor and nurse workload to ensure there is maximum efficiency and
           equity between the sub-districts.
     4.    Improving registry hygiene, by improving patient flow, ensuring electronic appointment
           systems, having competent clerical /data staff, and ensuring the registries are
           functioning efficiently. This should also decrease waiting times, which will improve the
           experience that clients have at our facilities.
     5.    Improving on the quality of data.

From a service priority point of view, there will be emphasis on the 1000 days approach and
ensuring an integrated approach to the management of chronic diseases (HIV/AIDS/TB/Chronic
Diseases of Lifestyle/Mental Health). For the former the focus is on Family Planning, Termination of
Pregnancy, and Basic Antenatal Care. For the latter the focus is on Tuberculosis outcomes and
maximizing efficiencies for processes for Chronic Disease Management, especially with relation to
the alternate sites for collecting chronic medication.

                                                                                                       2
Central Karoo District - District Health Plan 2018/19 to 2020/21 - Department of Health
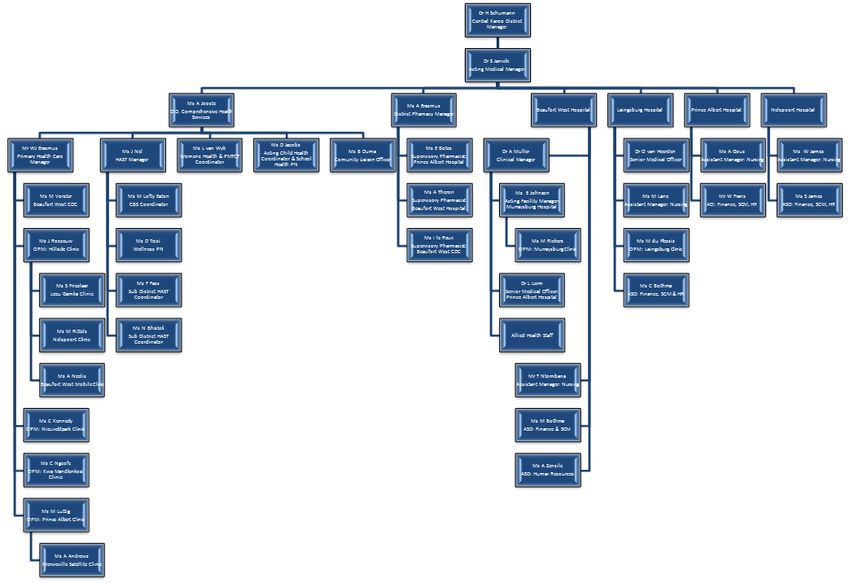
For District Hospitals, the focus will be on the Emergency Centres to ensure that they are functioning
well, have the right staff mix and skills, and have the appropriate functioning equipment. Principles
for the full content of an EC will be developed that will need to be in place for every EC. Other
aspects to focus on are ensuring the completion of the eCCR (discharge note) and ICD-10 coding.

There are also major physical infrastructure projects that will be taking place in hospitals and PHC
facilities.

The above all needs to be done in the bigger context of the province where there is further
significant transformation processes taking place: ‘Management Efficiency and Alignment Project’
and a renewed service design process to take the district towards HC 2030. All this will have to be
done within the context of severe fiscal constraints for the 2018/19 financial year. The Central Karoo
district faces many challenges to ensure that its mandate of moving towards increasing wellness is
attained. It will continue to work with its partners to work towards an integrated approach to health
services and to maximize efficiencies. The systems are in place and with its particular strength, the
resilience of its staff, the implementation of the 2018 plan will be undertaken.

                                                                                                    3
Central Karoo District - District Health Plan 2018/19 to 2020/21 - Department of Health
2.   ACKNOWLEDGEMENTS
     The District Health Plan was developed by the Central Karoo District based on the District
     Health Planning Guidelines provided by the National Department of Health. In particular, the
     District would like to thank the following role-players for their contribution and guidance:

     Chief Directorate: Rural District Health Services
     Dr R. Crous: Chief Director
     Dr D. Pienaar
     Ms L. Grebe

     District Director: Eden and Central Karoo District
     Dr H. Schumann

     Central Karoo District Office:
     Mrs A. Jooste
     Dr S. Janicki
     Mrs B. Goliath

     Central Karoo District Health Council:
     Councillor N. Constable (Executive Mayor, Central Karoo District Municipality)
     Councillor D. Slabbert (Deputy Mayor, Beaufort West Municipality)
     Councillor G. Lottering (Executive Mayor, Prince Albert Municipality)
     Councillor L. Potgieter (Councillor, Laingsburg Municipality)

     Eden District Office:
     Dr T. Marshall

                                                                                                    4
Central Karoo District - District Health Plan 2018/19 to 2020/21 - Department of Health
3.     OFFICIAL SIGN OFF
       It is hereby certified that this District Health Plan:
             Was developed by the district management team of Central Karoo District with the
              technical support from the Chief Directorate: Rural District Health Services and the Strategic
              Planning unit at the provincial head office.
             Was prepared in line with the current Strategic Plan and Annual Performance Plan of the
              Western Cape Department of Health.

Dr H Schumann
District manager: Central Karoo District                                         SIGNATURE

                                                                                    DATE

Executive Mayor N Constable
Chairperson: Central Karoo District Health Council                               SIGNATURE

                                                                                    DATE

Dr R Crous
Chief Director: Rural District Health Services                                   SIGNATURE

                                                                                    DATE

Dr K Cloete
Chief of Operations                                                              SIGNATURE

                                                                                    DATE

Dr B Engelbrecht
Accounting officer (Head of Department)                                          SIGNATURE

                                                                                    DATE

                                                                                                          5
Central Karoo District - District Health Plan 2018/19 to 2020/21 - Department of Health
4.       TABLE OF CONTENTS
1.        EXECUTIVE SUMMARY BY THE DISTRICT MANAGER ............................................................. 2
2.        ACKNOWLEDGEMENTS .......................................................................................................... 4
3.        OFFICIAL SIGN OFF................................................................................................................. 5
4.        TABLE OF CONTENTS ............................................................................................................... 6
5.        LIST OF ACRONYMS ................................................................................................................ 7
6.        EPIDEMIOLOGICAL PROFILE ................................................................................................ 10
6.1       GEOGRAPHIC OVERVIEW .................................................................................................... 10
6.2       DEMOGRAPHIC OVERVIEW ................................................................................................. 10
6.3       SOCIAL DETERMINANTS OF HEALTH .................................................................................... 13
6.4       CAUSES OF MORTALITY ........................................................................................................ 16
6.5       BURDEN OF DISEASE ............................................................................................................. 18
7.        SERVICE DELIVERY PLATFORM AND MANAGEMENT ......................................................... 21
7.1       HEALTH FACILITIES PER SUB-DISTRICT .................................................................................. 21
7.2       HUMAN RESOURCES FOR HEALTH (FILLED POSTS) ............................................................. 24
7.3       BASELINE DATA 2016/17 ...................................................................................................... 25
8.        QUALITY OF CARE ................................................................................................................. 32
9.        ORGANISATIONAL STRUCTURE OF THE DISTRICT MANAGEMENT TEAM .......................... 34
10.       DISTRICT HEALTH EXPENDITURE ............................................................................................ 35
11.       DISTRICT PERFORMANCE INDICATORS ............................................................................... 36
11.1      DISTRICT HEALTH SERVICES .................................................................................................. 37
11.2      DISTRICT HOSPITALS .............................................................................................................. 40
11.3      HIV AND AIDS, STIs AND TB CONTROL (HAST) ................................................................... 43
11.4      MATERNAL, CHILD AND WOMEN’S HEALTH (MCWH) AND NUTRITION............................ 50
11.5      DISEASE PREVENTION AND CONTROL ................................................................................ 63
12.       DISTRICT FOCUS FOR THE YEAR ........................................................................................... 65
13.       ORAL HEALTH PLAN .............................................................................................................. 67
ANNEXURE A: CENTRAL KAROO DISTRICT POPULATION ESTIMATES BY AGE ............................. 70
ANNEXURE B: TARGETS FOR SDG 3 – “GOOD HEALTH AND WELL-BEING” ................................. 71
ANNEXURE C: FACILITY LIST ............................................................................................................. 72
ANNEXURE D: TECHNICAL INDICATOR DESCRIPTIONS ................................................................. 73
ANNEXURE E: COMMUNICATION PLAN FOR DISTRICT HEALTH PLAN.......................................... 89

                                                                      6
Central Karoo District - District Health Plan 2018/19 to 2020/21 - Department of Health
5.   LIST OF ACRONYMS
     AIDS         Acquired immune deficiency syndrome
     ALOS         Average length of stay
     APL          Approved post list
     APP          Annual Performance Plan
     ART          Anti-retroviral treatment
     BANC         Basic antenatal care
     BUR          Bed utilisation rate
     CBS          Community-based services
     CDC          Community day centre
     CDU          Chronic dispensing unit
     CHC          Community health centre
     CHW          Community health worker
     COPC         Community oriented primary care
     COPD         Chronic obstructive pulmonary disease
     DHC          District Health Council
     DHER         District Health Expenditure Review
     DHP          District Health Plan
     DHS          District Health Services/Systems
     DR TB        Drug resistant TB
     EC           Emergency centre
     EDR          Electronic drug-resistant TB register
     EMS          Emergency medical services
     EPWP         Expanded Public Works Programme
     ETR.net      Electronic TB register
     GSA          Geographic service area
     HAST         HIV and AIDS, STIs and TB control
     HCBC         Home and community based care
     HCT          HIV counselling and testing
     HIV          Human immunodeficiency virus
     HPV          Human papillomavirus
     HR           Human resource
     ICD-10       International classification of disease coding
     ICT          Information and communication technology
     ID           Infectious diseases
     JAC          Electronic Pharmacy Management Inventory System
     LG           Local government
     M&E          Monitoring and evaluation
     MDG          Millennium development goal

                                                                    7
Central Karoo District - District Health Plan 2018/19 to 2020/21 - Department of Health
MDR-TB     Multi-drug resistant tuberculosis
MHS        Municipal Health Services
MMC        Medical male circumcision
MOU        Midwife obstetric unit
MTEF       Medium-term expenditure framework
MTSF       Medium-term strategic framework
NCS        National core standards
NDP        National Development Plan
NHLS       National Health Laboratory Services
NIMART     Nurse Initiated Management of Anti-retroviral Therapy
NPO        Non-profit organisation
OPD        Outpatient department
OSD        Occupational specific dispensation
PACK       Practical Approach to Care Kit
PCE        Patient centred experience
PCR        Polymerase chain reaction
PCV        Pneumococcal conjugate vaccine
PDE        Patient day equivalent
PHC        Primary health care
PHCIS      Primary Health Care Information Systems
PMTCT      Prevention of mother-to-child transmission
PPIP       Perinatal problem identification programme
PTB        Pulmonary tuberculosis
QIP        Quality improvement plan
RCS        Rural clinical school
RDHS       Rural District Health Services
RIC        Retention in care
SAM        Severe acute malnutrition
SCM        Supply chain management
SD         Sub-district
SDG        Sustainable development goal
STI        Sexually transmitted infection
TB         Tuberculosis
TIER.net   HIV electronic register
VPUU       Violence Prevention through Urban Upgrading
WCG        Western Cape Government
WCGH       Western Cape Government Health
WCCN       Western Cape College of Nursing
WHO        World Health Organisation

                                                                   8
Central Karoo District - District Health Plan 2018/19 to 2020/21 - Department of Health
WoW      Western Cape on wellness
XDR-TB   Extreme drug resistant tuberculosis
YTD      Year to date

                                               9
6.    EPIDEMIOLOGICAL PROFILE
6.1   GEOGRAPHIC OVERVIEW
      The Central Karoo is one of five rural district municipalities in the Western Cape Province and
      is the largest district in the province, making up a third of its geographical area.

      The district consists of three local municipalities, namely: Beaufort West, Laingsburg and
      Prince Albert. The Central Karoo District Management Area (DMA) was incorporated in the
      Beaufort West Sub-district from 1 April 2013.

      The district office for Western Cape Government: Health (WCG: Health) is situated in
      Beaufort West. There are 18 primary health care (PHC) facilities in the district of which 9 are
      fixed facilities. There are four district hospitals and one intermediate care hospital, Nelspoort,
      which is located in the Beaufort West Sub-district.

      Figure 1: Map of Central Karoo District

      [Source: https://municipalities.co.za/map/144/central-karoo-district-municipality]

6.2   DEMOGRAPHIC OVERVIEW
      The National Department of Health distributed revised population estimates during 2017,
      based on the mid-year population estimates received from Stats SA for 2002 to 2016 and the
      short term projections for 2017 to 2021.

                                                                                                     10
The revised population estimates reflect financial years rather than calendar years as was
previously the case. These estimates will be implemented from 2018/19 going forward and is
reflected in the tables below.

Table 1: Sub-district population size and density 2016/17
Sub-district          Town(s)                        Total                 Geographic area   Population
                                                     population(A)         (per km²)(B)      density
Beaufort West        - Beaufort West
                     - Merweville
                                                          51 904                   21 917          2
                     - Murraysburg
                     - Nelspoort
Laingsburg           - Laingsburg
                                                             9 043                 8 784           1
                     - Matjiesfontein
Prince Albert        - Klaarstroom
                     - Leeu Gamka                         14 391                   8 153           2
                     - Prince Albert
District total                                            75 338                  38 854           2
[Source A: Circular H11/2018: Population data]
[Source B: https://municipalities.co.za/overview/144/central-karoo-district-municipality ]

Central Karoo District is the rural district with the smallest population and the lowest
population density. The sub-districts consist of several towns that are spread out over a large
surface area. Although the number of people who live in this district is small, the vast
geographic area leads to service delivery challenges that are not necessarily experienced
in the other districts.

                                                                                                          11
Figure 2: Sub-district population distribution in Central Karoo District 2016/17

                                Prince Albert
                                    19.1%

                           Laingsburg
                              12.0%                  Beaufort West
                                                        68.9%

[Source: Circular H11/2018: Population data]

Although there is only a 1.5% increase between the total population estimates for 2018/19
(i.e. all age groups) that were release in 2014 and 2017 respectively, there is a 16.7%
increase in the population under 1 year. This will have a significant impact on the district’s
performance for indicators that use the population under 1 year as denominator, e.g. the
immunisation coverage.

For more detailed information on the population breakdown per age group for the district,
refer to Annexure A (page 70).

                                                                                           12
Figure 3: Central Karoo District population pyramid for 2016/17

        80 years and older
               75 - 79 years
               70 - 74 years
               65 - 69 years
               60 - 64 years
               55 - 59 years
               50 - 54 years
               45 - 49 years
               40 - 44 years
               35 - 39 years
               30 - 34 years
               25 - 29 years
               20 - 24 years
               15 - 19 years
               10 - 14 years
                 5 - 9 years
              Under 5 years

                          -4 000     -3 000      -2 000      -1 000        0     1 000      2 000     3 000   4 000

                                                           Male       Female

      [Source: Circular H11/2018: Population data]

6.3   SOCIAL DETERMINANTS OF HEALTH
      Social determinants may have an impact on the health status outcomes of the district
      population.

      Table 3: Household dynamics in the Central Karoo District 2016
      Age groups                              Beaufort West            Laingsburg        Prince Albert        District
      Households                                          14 935               2 862                4 183             21 980
      Average household size                                 3.4                 3.1                  3.4                3.4
      Female headed households                            39.8%                31.8%                50.3%             40.8%
      Formal dwellings                                    99.6%                97.5%                91.8%             97.8%
      Housing owned                                       66.4%                61.0%                78.9%             68.1%
      [Source: https://municipalities.co.za/overview/144/central-karoo-district-municipality ]
      Note: The highest and lowest value for each item is coloured orange and green respectively.

                                                                                                                         13
Figure 4: Central Karoo District education levels 2016

                                                   Education levels by sub-district

                         31.8%
 35.0%

                                                                                                                                                29.5%
                                                                 26.3%
 30.0%

                                                                                                         23.7%
 25.0%

 20.0%

 15.0%

                                                      9.2%
 10.0%

                                                                                                                                     5.8%
               5.4%

                                                                                              4.8%
                                     3.8%

                                                                                                                                                            3.2%
                                                                                                                         2.4%
                                                                                 1.7%
  5.0%

  0.0%
               Beaufort West                            Laingsburg                             Prince Albert                                District

                                                 No schooling                     Matric    Higher education

[Source: https://municipalities.co.za/overview/144/central-karoo-district-municipality ]

Figure 5: Central Karoo District household services 2016

                                                 Household services by sub-district
 120.0%
                                         96.0%

                                                                                                                           95.9%
                                                                                             95.6%

                                                                                                      95.4%
               95.3%

                                                                                                                                                              95.1%
                                                                                                                                   93.7%
                       91.7%

                                                                                                                                            90.8%
                                                                                    88.8%

 100.0%
                                                     82.7%

                                                              79.5%
                                 77.9%

                                                                                                                                                    73.8%
                                                                                                                 70.9%

  80.0%
                                                                         56.5%

  60.0%

  40.0%

  20.0%

    0.0%
                 Beaufort West                               Laingsburg                         Prince Albert                               District

           Flush toilet connected to sewerage                                                        Weekly refuse removal
           Piped water inside dwelling                                                               Electricity for lighting

[Source: https://municipalities.co.za/overview/144/central-karoo-district-municipality ]

Laingsburg Sub District seems to be worst off in terms of service delivery to households.
According to the IDP document for Laingsburg Municipality the number of households
increased from 2408 (2011) to 2862 (2016). The municipality is dependent on ground water of
which the biggest portion has access to piped water inside the dwelling or within the yard.
The biggest portion of households has access to Eskom electricity utilising it for lighting and

                                                                                                                                                                      14
cooking. Alternative energy is also being used within the municipality. The majority of
     households are connected to a sewerage system or chemical toilets but 2.1% of households
     make use of other sources of sanitation. Refuse removal are on done on a weekly basis.
     Over the next five years, the municipality will be investing in a number of major infrastructure
     projects, including upgrade of the electricity Network, provision of new water infrastructure
     and upgrading of current water infrastructure.1

     Figure 6: Main economic sectors in Central Karoo District

                    Construction, 7.0%               Other,
                                                     5.0%

                             Community services,                      Agriculture, 47.0%
                                 19.0%

                                                Finance and
                                              business services,
                                                    22.0%

     [Source: https://municipalities.co.za/overview/144/central-karoo-district-municipality ]

1   Laingsburg Municipality IDP; https://www.laingsburg.gov.za/resource-category/integrated-
    development-plan?category=104

                                                                                                  15
6.4   CAUSES OF MORTALITY
      Table 4: Leading underlying natural causes of death, Western Cape, 2015
                    Cape                                                                                           Western
        Rank                     Central Karoo    Cape Town          Eden          Overberg       West Coast
                  Winelands                                                                                         Cape

                                 Chronic lower                                    Ischaemic
                                                   Diabetes                                                        Diabetes
                  HIV disease     respiratory                    Tuberculosis        heart       Tuberculosis
          1                                         mellitus                                                        mellitus
                     (7.2%)        diseases                         (7.0%)          diseases        (7.9%)
                                                    (7.5%)                                                          (7.2%)
                                    (9.1%)                                           (7.1%)

                 Cerebrovasc                                                     Cerebrovasc       Diabetes
                                 Tuberculosis     HIV disease    HIV disease                                      HIV disease
          2      ular diseases                                                   ular diseases      mellitus
                                    (6.7%)           (6.3%)         (6.7%)                                           (6.1%)
                    (6.9%)                                                          (6.6%)          (7.4%)

                                                                                   Malignant
                                                  Ischaemic                                                       Ischaemic
                   Diabetes      Cerebrovasc                     Cerebrovasc     neoplasms of    Cerebrovasc
                                                     heart                                                           heart
          3         mellitus     ular diseases                   ular diseases       resp &      ular diseases
                                                    diseases                                                        diseases
                    (6.7%)          (6.2%)                          (6.6%)       intrathoracic      (7.2%)
                                                     (5.7%)                                                          (5.8%)
                                                                                 organs (6.5%)

                                                                  Ischaemic                      Chronic lower
                                                 Cerebrovasc                       Diabetes                      Cerebrovasc
                 Tuberculosis     HIV disease                        heart                        respiratory
          4                                      ular diseases                      mellitus                     ular diseases
                    (6.6%)           (5.2%)                         diseases                       diseases
                                                    (4.9%)                          (6.1%)                          (5.6%)
                                                                     (6.4%)                         (6.6%)

                 Chronic lower                                                   Chronic lower    Ischaemic
                                   Diabetes                        Diabetes
                  respiratory                    Tuberculosis                     respiratory        heart       Tuberculosis
          5                         mellitus                        mellitus
                   diseases                         (4.5%)                         diseases         diseases        (5.3%)
                                    (5.2%)                          (6.2%)
                    (6.2%)                                                          (5.6%)           (5.8%)

                  Ischaemic                      Chronic lower Chronic lower                                     Chronic lower
                                 Hypertensive                                                    Hypertensive
                     heart                        respiratory   respiratory      Tuberculosis                     respiratory
          6                        diseases                                                        diseases
                    diseases                       diseases      diseases           (5.0%)                         diseases
                                    (5.2%)                                                          (4.6%)
                     (5.5%)                         (4.4%)        (5.8%)                                            (5.1%)

                                                                   Malignant
                  Malignant       Malignant       Malignant      neoplasms of     Malignant                       Malignant
                                                                                                  HIV disease
          7       neoplasms       neoplasms       neoplasms          resp &       neoplasms                       neoplasms
                                                                                                     (4.6%)
                    (5.0%)          (4.1%)          (4.2%)       intrathoracic      (4.9%)                          (4.5%)
                                                                 organs (4.9%)

                   Malignant       Malignant       Malignant                                                       Malignant
                 neoplasms of    neoplasms of    neoplasms of     Malignant      Hypertensive     Malignant      neoplasms of
          8          resp &          resp &          resp &       neoplasms        diseases       neoplasms          resp &
                 intrathoracic   intrathoracic   intrathoracic      (4.6%)          (4.0%)          (4.4%)       intrathoracic
                 organs (5.0%)   organs (4.0%)   organs (4.2%)                                                   organs (4.5%)

                                                                                                   Malignant
                                  Ischaemic                      Other forms      Other forms
                 Hypertensive                    Hypertensive                                    neoplasms of    Hypertensive
                                     heart                        of heart         of heart
          9        diseases                        diseases                                          resp &        diseases
                                    diseases                      disease          disease
                    (3.3%)                          (4.1%)                                       intrathoracic      (4.0%)
                                     (4.0%)                        (3.7%)           (3.3%)
                                                                                                 organs (3.7%)

                  Other forms     Other forms     Other forms                                     Other forms     Other forms
                                                                 Hypertensive    Influenza and
                   of heart        of heart        of heart                                        of heart        of heart
         10                                                        diseases       pneumonia
                   disease         disease         disease                                         disease         disease
                                                                    (3.4%)            (2.8%)
                    (3.2%)          (3.8%)          (3.1%)                                          (2.5%)          (3.2%)

      [Source: Mortality and causes of death in South Africa, 2015: Findings from death notification, Statistical Release
      P0309.3]

                                                                                                                          16
A sub-district breakdown of the underlying natural causes of death was not included in the
above publication.

Table 5: Institutional maternal mortality rate (iMMR) in Central Karoo District
                                             2011                 2012                  2013             2014
Deaths during pregnancy,                        0                   0                    0                 3
childbirth and puerperium
iMMR                                            0                   0                    0              273.2
[Source: Saving Mothers, 2014]
Note: The source listed above is the latest published Saving Mothers Report.

During the 2014 calendar year, there were 4 maternal deaths in the Central Karoo District. In
2015, 2016 and 2017 there were zero (0) maternal deaths in the district.
The causes for the 2014 maternal deaths were:
            Pulmonary embolism
            Pulmonary tuberculosis
            Preeclampsia
            Asthma

Table 6: Infant and child mortality in Central Karoo District
District                          Infant mortality rate (< 1 year)              Child mortality rate (< 5 years)
                                 2011           2012            2013           2011            2012        2013
Central Karoo                    33.8               29.6        22.6           41.0            32.7        31.1
[Source: Western Cape Mortality Profile 2013]
Note: The source listed above is the latest published Western Cape Mortality Profile.

The most important point to keep in mind is that the Infant & Child Mortality Rates in rural
districts with small populations must be interpreted with extreme caution. Because of the
small population and the low number of births in the district any infant or child death will
have a significant impact in the calculated rate. The Central Karoo District often shows up
as the ‘best’ or the ‘worst’, but this is because of the very small numbers that are implicated,
in comparison to places with higher numbers. From a purely statistical point of view, the
results show one picture, but the detail needs to be interrogated, and the full context
unpacked.

                                                                                                                   17
6.5   BURDEN OF DISEASE
      DISTRICT HIV AND AIDS PROFILE
      Figure 7: Antenatal Survey HIV prevalence: South Africa vs Western Cape; 1990 - 2015

                              35.0

                              30.0

                              25.0
         HIV prevalence (%)

                              20.0

                              15.0

                              10.0

                               5.0

                               0.0
                                     1990
                                            1991
                                                   1992
                                                          1993
                                                                 1994
                                                                        1995
                                                                               1996
                                                                                      1997
                                                                                             1998
                                                                                                    1999
                                                                                                           2000
                                                                                                                  2001
                                                                                                                         2002
                                                                                                                                2003
                                                                                                                                       2004
                                                                                                                                              2005
                                                                                                                                                     2006
                                                                                                                                                            2007
                                                                                                                                                                   2008
                                                                                                                                                                          2009
                                                                                                                                                                                 2010
                                                                                                                                                                                        2011
                                                                                                                                                                                               2012
                                                                                                                                                                                                      2013
                                                                                                                                                                                                             2014
                                                                                                                                                                                                                    2015
                                                                                         Western Cape                                  South Africa

      [Source: National Antenatal Sentinel HIV & Syphilis Survey Report, 2015]

      Figure 8: HIV prevalence among antenatal women, 2010 - 2015

                                                                        HIV prevalence among antenatal women
                              35

                              30

                              25
         HIV prevalence (%)

                              20

                              15

                              10

                               5

                               0
                                            2010                          2011                             2012                         2013                          2014                            2015

                                                                   South Africa                             Western Cape                                Central Karoo

      [Source: National Antenatal Sentinel HIV & Syphilis Survey Report, 2015]

      HIV prevalence in the Central Karoo district is much lower than that of the Western Cape
      and of South Africa.

                                                                                                                                                                                                                           18
DISTRICT TB PROFILE
Management of TB has become complex over the last few years, with HIV that make the
disease more complex to manage. To fulfil this task in managing both diseases, clear
expectations must be set with regards to the specific functions for each level of care, with
clear referral pathways.

Nelspoort Hospital: Ward Garlick: Sensitive TB patients
        This is a 12 bed unit for TB sensitive clients.
        It is mainly for non-compliant TB clients, as well as TB clients that need extra care due
         to social circumstances or illness.
        Patients from all the sub-districts in the Central Karoo can be referred.
        Clinical Support:
              o   Medical Officer from Beaufort West visits Ward Garlick on a weekly basis.
              o   The HAST Coordinator visits Ward Garlick every second week.
              o   The HAST Coordinator is also responsible for initiation on ART for co-infected
                  patients.
              o   The outreach TB specialist from Harry Comay Hospital visits Ward Garlick
                  every second month.

Nelspoort Hospital Garlick ward: MDR patients:
        This is two 4 bed wings at the ends of Ward Garlick for MDR TB patients.
        Clinical support is the same as mentioned above.
        Additional support includes visits from the audiologist (George) every month.

Nelspoort Hospital Eikenhof ward: XDR patients:
        8 Bed Ward used for XDR patients.
        XDR patients are referred via the review committees in either Cape Town or George.
        If there are no XDR palliative patients, MDR patients are moved to this ward.
        The unit is managed by a local NPO.
        Patients are voluntary admitted to the Palliative unit.
        Patients are also seen if necessary by the clinical team mentioned above.

Priorities:

TB Screening:
Early identification and initiation of treatment is crucial element to eradicate TB. Studies
conducted by Desmond Tutu Foundation showed that patients with infectious TB who
attend health facilities for other reasons are not recognised and treated. Therefore the
Western Cape Department of Health adopted the universal symptom screening for all

                                                                                               19
clients entering health facilities. Further to this the department also adopted the 90/90/90
strategy, meaning that 90% of vulnerable people for TB should be identified and treated.
Screening of all contacts exposed to infectious TB has always been one of the priorities of
the TB Control Program and should be maintained. However, monitoring thereof is still
problematic and reporting systems needs to be explored.

Operational managers working in PHC facilities, out-patient and emergency units in
hospitals should ensure that the screening policy is adhered to for all clients entering health
facilities.

TB is a communicable disease which infects contacts in households, work places, schools
and social gatherings. Screening of contacts and high risk groups should be done by
community care workers under the supervision of the CBS coordinators and the NPO’s
contracted to support the program.

Challenges:
        Patients defaulting on treatment
        Difficulty in tracking patients that default on treatment. Patients move between
         facilities, towns, sub district and districts, making it difficult to follow up.
        A system was put in place to address the number of patients defaulting on
         treatment. The results will reflect in the 2018/2019 outcomes.

                                                                                            20
7.    SERVICE DELIVERY PLATFORM AND MANAGEMENT
7.1   HEALTH FACILITIES PER SUB-DISTRICT
      Table 7: Health facilities per sub-district as at 31 March 2017
      Sub-district

                                                                                                                                                     Central/tertiary
                                                                                                       District hospital
                                             outreach team
                                Ward based

                                                                                                                                                                                       TB hospital
                                                                                                                           Regional
                                                                                                                                          hospital

                                                                                                                                                                            hospital
                                                                      Satellite
                                                             Mobile

                                                                                  Clinic

                                                                                           CDC

                                                                                                 CHC
      Beaufort West                          0                 4          1         5       1     0            2                      0                                 0                 0
      Laingsburg                             0                 1          1         1       0     0            1                      0                                 0                 0
      Prince Albert                          0                 1          1         2       0     0            1                      0                                 0                 0
      Central Karoo                          0                 6          3         8       1     0            4                      0                                 0                 0
      [Source: Sinjani]

      Improving the experience of patients in health facilities is one of the departmental goals.
      The focus areas for primary health care services are:
               Improving patient flow in facilities.
               Maximising use of the Primary Health Care Information System (PHCIS).
               Management of minor ailments.
               Improving the system for the management of chronic diseases including clinical
                quality.

      The focus areas for home community-based care are:
               Screening of the population.
               Health promotion.
               Defaulter tracing.

      In terms of the health facilities in the Central Karoo District:
               There are no 24-hour PHC facilities.
               Fixed clinics (8) are open five days a week between 07h30 and 16h15. Services are
                nurse-led with support from visiting doctors.
               The community day centre (CDC) is open five days a week between 07h30 and
                16h15 and has a full-time doctor in addition to the package of care provided by the
                nurse practitioners.
               A Community Day Centre (CDC) renders the same service package as a
                community health centre (CHC) but does not have a maternity obstetric unit (MOU).
                Furthermore, a CDC is only open during office hours, for a maximum of 8 hours per
                day.
               Contract general practitioners (GPs) are classified as independent consulting rooms.

                                                                                                                                                                                            21
Although Beaufort West, Laingsburg and Prince Albert are separate sub-districts, the primary
health care services are managed as one in terms of financial and human resource
management. The district spans a vast geographical area and mobile clinics are a
necessity. The mobile clinics service the following areas:
        Beaufort West Mobile Clinic: One mobile clinic serves two large mobile routes
         surrounding Beaufort West. The mobile operates on a daily basis with a turn-around
         time of 3 months.
        Nelspoort Mobile Clinic: The mobile service at Nelspoort was discontinued in
         November 2015. There is a need to restore the service.
        Merweville Mobile Clinic: One mobile clinic serves a mobile route surrounding
         Merweville. The mobile operates three times a week: Monday, Wednesday and
         Friday, with a turn-around time of 3 months.
        Murraysburg Mobile Clinic: The mobile service at Murraysburg was discontinued in
         October 2014. There is a need to restore the service.
        Prince Albert Mobile Clinic: One mobile clinic serves a mobile route surrounding
         Prince Albert and Leeu Gamka. The mobile operates twice a week, with a turn-
         around time of 2 months.
        Laingsburg Mobile Clinic: One mobile clinic serves a mobile route surrounding
         Laingsburg and Matjiesfontein. The mobile operates twice a week, with a turnaround
         time of 2½ months.

The satellite clinics are open on the following days and times:
        Merweville Satellite Clinic: Open 2 days a week (Tuesdays and Thursdays) between
         07h30 and 16h15.
        Klaarstroom Satellite Clinic: Open on a Wednesday between 09h00 and 15h00.
        Matjiesfontein Satellite Clinic: Open on a Wednesday between 09h00 and 15h00.

As mentioned previously, fixed clinics are open five days a week between 07h30 and 16h15.
Services are nurse-led with support from visiting doctors. The CDC is open five days a week
between 07h30 and 16h15, but has a full-time doctor in addition to the package of care
provided by nurse practitioners.

The Western Cape Government assumed responsibility for personal primary health care
services in all five rural districts since 2006. Therefore there are no longer any local
government facilities in the Central Karoo District.
        The district has multiple mobile vehicles that attend to rural areas, mostly for those on
         farms.
        The population is wide-spread throughout the district and it remains a challenge to
         provide equal access for all.

                                                                                               22
      Laingsburg, Murraysburg and Prince Albert Hospitals are small hospitals with bed
        numbers below 30. Murraysburg and Prince Albert also have low bed utilisation rates
        and average lengths of stay (ALOS). The local situation and context must be taken
        into consideration when the hospitals’ functions and performance are evaluated.
       Beaufort West Hospital, on the other hand, has a high bed utilisation rate and ALOS.

George Regional Hospital provides outreach to Beaufort West Hospital in the following
disciplines:
       Obstetrics and Gynaecology
       Paediatrics
       Family Medicine
       Internal Medicine
       Surgery
       Orthopaedics
       Ophthalmology

This has had a very positive result in terms of medical officer and specialist interaction,
clinical governance and patient-centred experience. Significantly fewer patients have to
travel to George from outlying areas to attend the specialist clinics.

Governance
The overall management of District Health Services in the Central Karoo District is done by
the District Manager. The District Manager reports to the Chief Director: Rural District Health
Services.

Overall clinical governance of the district is led by the general specialist of George Regional
Hospital. At sub-district level, depending on resources available, clinical governance is led
by the clinical manager or the medical manager.

A functional mechanism whereby all the provincial health services role-players meet on a
quarterly basis to plan, implement integrated care, and inter alia, review clinical
governance aspects, is also in place. These role-players, members of the Geographic
Service Area (GSA), come from George Hospital, Eden District and the Central Karoo District
and include representatives from Emergency Medical Services (EMS).

Nelspoort Hospital is classified as an intermediate care facility. It has TB and psychiatric
beds.

For a complete list of health facilities in the district, refer to Annexure C (page 72).

                                                                                            23
7.2    HUMAN RESOURCES FOR HEALTH (FILLED POSTS)
       Table 7: Filled posts as at 31 March 2017

                                                                                                                                                                                           Physiotherapist
                                                                                   Enrolled nurse

                                                                                                                                                            Occupational
                                                      health worker

                                                                                                    Professional
                                          Community

                                                                                                                                                                                                                                      Audiologist
                                                                                                                                     Pharmacist
       Sub-district

                                                                                                                                                                               therapist

                                                                                                                                                                                                                          therapist
                                                                       assistant

                                                                                                                                                                                                             Speech
                                                      Nursing

                                                                                                                            Doctor

                                                                                                                                                  Dentist
                                  Admin

                                                                                                                    nurse
       Beaufort West              1642           49                   41              25                           73        83       144           45                     1                   1                      0                  0
       Laingsburg                  206           10                   4                  5                         10        27         18           0                     0                   0                      0                  0
       Prince Albert               219           17                   9                  2                         11        210      311            0                     0                   0                      0                  0
       Central Karoo              205            77                   54              32                           94        12        18            4                     1                   1                      0                  0
       [Source: PERSAL]

2     Include all administrative posts, including staff working in the workshop (artisans, handyman, grounds
      men, etc.)
3     Includes 3 Community Service Doctors
4     Includes 1 Community Service Pharmacist and 10 pharmacy assistants
5     Includes 1 Dentist (5/8 post) and 2 Dental Assistants
6     Includes 1 Handyman
7     Includes 1 Community Service Doctor
8     Post Basic Pharmacy Assistant
9     Includes 2 Handymen
10    Includes 1 Community Service Doctor
11    Includes 1 Post Basic Pharmacy Assistant

                                                                                                                                                                                                                                        24
7.3    BASELINE DATA 2016/17
Table 9: Performance indicators for District Health Services

                                                                                         District wide                                                            Province wide
       Programme performance indicator                            Data source /   Type                       Beaufort West     Laingsburg       Prince Albert
                                                      Frequency                              value                                                                    value
                                                                   Element ID
                                                                                           2016/17             2016/17          2016/17           2016/17           2016/17
 SECTOR SPECIFIC INDICATORS
 1.     Ideal clinic (IC) status rate                  Annual                      %             33.3%               16.7%          100.0%              50.0%             17.2%
                                          Numerator                    3                                 3                1                 1                1                47
                                        Denominator                    2                                 9                6                 1                2                273
 2.     PHC utilisation rate (annualised)             Quarterly                   No                 2.7                 2.8              2.5               2.3               2.3
                                          Numerator                    6                       199 941             143 590           22 611            33 740         14 413 350
                                        Denominator                    7                        75 338              51 904            9 043            14 391          6 318 281
 3.     Complaint resolution within 25 working        Quarterly                    %             84.0%               80.0%          100.0%              80.0%             95.6%
        days rate (PHC facilities)
                                          Numerator                    10                            21                   8                 5                8             3 175
                                        Denominator                    8                             25                  10                 5               10             3 320

                                                                                   25
Table 10: Performance indicators for District Hospitals

                                                                                           District wide                                                                 Province wide
        Programme performance indicator                             Data source /   Type                       Beaufort West       Laingsburg        Prince Albert
                                                        Frequency                              value                                                                         value
                                                                     Element ID
                                                                                             2016/17             2016/17            2016/17            2016/17             2016/17
 SECTOR SPECIFIC INDICATORS
 1.     Hospital achieved 75% and more on               Quarterly                    %               0.0%               0.0%               0.0%                0.0%               69.7%
        National Core Standards (NCS) self-
        assessment rate (district hospitals)
                                            Numerator                    3                                 0                   0                0                    0                23
                                         Denominator                     4                                 3                   1                1                    1                33
 2.     Average length of stay (district hospitals)     Quarterly                   Days               2.8                 2.8                3.5                2.6                  3.2

                                            Numerator                    7                         30 548              19 516             5 396               5 636             909 893
                                         Denominator                     8                         10 747               7 071             1 546               2 130             280 580
 3.     Inpatient bed utilisation rate (district        Quarterly                    %              69.7%              75.3%              73.9%              53.2%                84.8%
        hospitals)
                                            Numerator                    7                         30 548              19 516             5 396               5 636             909 893
                                         Denominator                     9                         43 805              25 918             7 301              10 586            1 072 731
 4.     Expenditure per PDE (district hospitals)        Quarterly                    R            R 2 273             R 2 423           R 1 938             R 1 981              R 2 139
                                            Numerator                    10                   97 287 724           70 171 591        12 916 458          14 199 675        2 923 677 427
                                         Denominator                     16                        42 799              28 964             6 665               7 169            1 366 831
 5.     Complaint resolution within 25 working          Quarterly                    %              79.7%              71.1%              90.0%             100.0%                90.4%
        days rate (district hospitals)
                                            Numerator                    19                            47                  27                   9                11               1 501
                                         Denominator                     17                            59                  38                   10               11               1 661

                                                                                                                                                                                     26
Table 11: Performance indicators for HIV and AIDS, STIs and TB control (HAST)

                                                                                            District wide                                                           Province wide
        Programme performance indicator                              Data source /   Type                     Beaufort West     Laingsburg        Prince Albert
                                                         Frequency                              value                                                                   value
                                                                      Element ID
                                                                                              2016/17           2016/17          2016/17            2016/17           2016/17
STRATEGIC GOAL: Promote health and wellness.
1.1.1   TB programme success rate                        Quarterly                    %              78.2%            75.9%            80.0%              85.7%              80.4%
                                          Numerator                       1                             467               315                56               96            34 651
                                       Denominator                        2                             597               415                70               112           43 099
2.1.1   ART retention in care after 12 months            Quarterly                    %              61.2%            58.4%            71.4%              64.4%              72.2%
                                          Numerator                       3                             229               143                30               56            33 307
                                       Denominator                        4                             374               245                42               87            46 120
2.1.2   ART retention in care after 48 months            Quarterly                    %              52.1%            50.3%            50.0%              61.1%              60.7%
                                          Numerator                       5                             113               79                 12               22            19 700
                                       Denominator                        6                             217               157                24               36            32 455
SECTOR SPECIFIC INDICATORS
1.      ART client remain on ART end of month -          Quarterly                   No              1 631             1 153               184                294          230 931
        total
                                               Element                    7
2.      TB/HIV co-infected client on ART rate            Quarterly                    %              67.0%            61.4%            89.5%              83.3%              89.6%
                                          Numerator                       8                             126               89                 17               20            14 902
                                       Denominator                        9                             188               145                19               24            16 637
3.      HIV test done – total                            Quarterly                   No             31 892            26 461           2 377               3 054          1 379 375
                                               Element                    10
4.      Male condoms distributed                         Quarterly                   No          2 355 590         1 763 790         229 800             362 000        113 913 868
                                               Element                    12
5.      Medical male circumcision – total                Quarterly                   No                 214               178                15               21            11 687
                                               Element                    16
6.      TB client 5 years and older start on             Quarterly                    %              96.6%            96.0%            86.8%             104.6%              92.9%
        treatment rate
                                          Numerator                       19                            367               266                33               68            21 007
                                       Denominator                        20                            380               277                38               65            22 612

                                                                                                                                                                                27
District wide                                                             Province wide
      Programme performance indicator                            Data source /   Type                     Beaufort West     Laingsburg        Prince Albert
                                                     Frequency                              value                                                                     value
                                                                  Element ID
                                                                                          2016/17           2016/17          2016/17            2016/17             2016/17
7.    TB client treatment success rate               Quarterly                    %              78.2%            75.9%            80.0%              85.7%                80.4%
                                         Numerator                    21                            467               315                56               96              34 651
                                      Denominator                     22                            597               415                70               112             43 099
8.    TB client defaulter / lost to follow up rate   Quarterly                    %              15.4%            18.8%             5.7%                8.9%               10.5%
                                         Numerator                    23                            92                78                 4                10               4 514
                                      Denominator                     22                            597               415                70               112             43 099
9.    TB client death rate                            Annual                      %               3.7%             2.7%            10.0%                3.6%                  3.9%
                                         Numerator                    24                            22                11                 7                    4            1 693
                                      Denominator                     22                            597               415                70               112             43 099
10.   TB MDR treatment success rate                   Annual                      %              64.3%            65.2%           100.0%              50.0%                44.6%
                                         Numerator                    25                            18                15                 1                    2               738
                                      Denominator                     26                            28                23                 1                    4            1 653

                                                                                                                                                                              28
Table 12: Performance indicators for MCWH and Nutrition
                                                                                           District wide                                                                 Province wide
       Programme performance indicator                              Data source /   Type                       Beaufort West       Laingsburg        Prince Albert
                                                        Frequency                              value                                                                         value
                                                                     Element ID
                                                                                             2016/17             2016/17            2016/17            2016/17             2016/17
SECTOR SPECIFIC INDICATORS
1.     Antenatal 1st visit before 20 weeks rate         Quarterly                    %              73.3%              71.2%              82.3%               76.3%              69.6%
                                            Numerator                    1                             891                 605                102                184             63 901
                                       Denominator                       2                          1 215                  850                124                241             91 849
2.     Mother postnatal visit within 6 days rate        Quarterly                    %              47.1%              39.5%              69.8%               79.4%              60.0%
                                            Numerator                    3                             447                 295                  67               85              54 816
                                       Denominator                       4                             949                 746                  96               107             91 322
3.     Antenatal client start on ART rate                Annual                      %              35.4%              23.5%              50.0%               83.3%              90.8%
                                            Numerator                    5                             23                  12                   1                10               7 009
                                       Denominator                       6                             65                  51                   2                12               7 715
4.     Infant 1st PCR test positive around 10 weeks     Quarterly                    %               1.4%                1.8%              0.0%                0.0%               0.8%
       rate
                                            Numerator                    7                                 1                   1                0                    0               95
                                       Denominator                       8                             70                  57                   7                    6           12 013
5.     Immunisation coverage under 1 year               Quarterly                    %              67.7%              64.1%              74.3%               80.0%              75.1%
                                            Numerator                    9                             899                 623                106                170             78 933
                                       Denominator                       10                         1 327                  971                143                213            105 108
6.     Measles 2nd dose coverage                        Quarterly                    %              80.4%              74.0%             104.7%               93.4%              86.3%
                                            Numerator                    11                         1 122                  756                157                209             92 898
                                       Denominator                       12                         1 396               1 022                 150                224            107 596
7.     Diarrhoea case fatality rate                     Quarterly                    %               0.0%                0.0%              0.0%                0.0%               0.2%
                                            Numerator                    16                                0                   0                0                    0               17
                                       Denominator                       17                            162                 95                   26               41               6 992
8.     Pneumonia case fatality rate                     Quarterly                    %               0.0%                0.0%              0.0%                0.0%               0.4%
                                            Numerator                    18                                0                   0                0                    0               29
                                       Denominator                       19                            52                  22                   4                26               7 943
9.     Severe acute malnutrition case fatality rate     Quarterly                    %               0.0%                0.0%                                  0.0%               0.6%

                                            Numerator                    20                                0                   0                0                    0                 5
                                       Denominator                       21                            29                  12                   0                17                  841

                                                                                                                                                                                  29
District wide                                                                  Province wide
      Programme performance indicator                                Data source /      Type                             Beaufort West        Laingsburg        Prince Albert
                                                         Frequency                                       value                                                                          value
                                                                      Element ID
                                                                                                       2016/17              2016/17             2016/17            2016/17             2016/17
10.   School Grade 1 - learners screened                 Quarterly                       No                      978                  823                  12                143            55 171
                                               Element                    22
11.   School Grade 8 - learners screened                 Quarterly                       No                          0                   0                 0                    0            9 364
                                               Element                    24
12.   Delivery in 10 to 19 years in facility rate        Quarterly                        %         Not required to      Not required to     Not required to    Not required to     Not required to
                                                                                                             report               report              report             report              report
                                             Numerator                    26                                         -                   -                  -                   -                   -
                                        Denominator                       4                                      949                  746                  96                107            91 322
13.   Couple year protection rate (Int)                  Quarterly                        %                  116.0%              127.1%               95.7%              89.1%               78.8%
                                             Numerator                    27                                 24 113              18 144               2 381              3 588           1 386 357
                                        Denominator                       28                                 20 793              14 276               2 489              4 028           1 760 154
14.   Cervical cancer screening coverage 30              Quarterly                        %                   75.7%             4251.5%             3147.6%            2321.8%               55.7%
      years and older
                                             Numerator                    29                                  1 304              49 995               7 300              7 320              90 454
                                        Denominator                       30                                  1 723               1 176                   232                315           162 460
15.   HPV 1st dose                                        Annual                         No                      601                  420                  51                130            36 182
                                               Element                    31
16.   HPV 2nd dose                                        Annual                         No                      593                  413                  51                129            34 941
                                               Element                    33
17.   Vitamin A 12 - 59 months coverage                  Quarterly                        %                   48.2%               44.1%               48.0%              67.2%               48.8%
                                             Numerator                    34                                  5 580               3 738                   597            1 245             425 757
                                        Denominator                       35                                 11 572               8 474               1 245              1 854             872 332
18.   Maternal mortality in facility ratio                Annual                       No per                        0                   0                 0                    0                57
                                                                                       100 000
                                             Numerator                    37                                         0                   0                 0                    0                54
                              Denominator / 100 000                       40                                  0.010               0.008               0.001              0.001               0.954
19.   Neonatal death in facility rate                     Annual                     No per 1 000                14                   10                   43                19                    9

                                             Numerator                    43                                     13                      7                 4                    2                783
                                Denominator / 1 000                       38                                  0.931               0.734               0.092              0.105              91.798

                                                                                                                                                                                              30
Table 13: Performance Indicators for District Health Services

                                                                                                 District wide                                                                Province wide
       Programme performance indicator                          Data source /       Type                             Beaufort West       Laingsburg       Prince Albert
                                                    Frequency                                        value                                                                        value
                                                                 Element ID
                                                                                                   2016/17             2016/17            2016/17           2016/17             2016/17
SECTOR SPECIFIC INDICATORS
1.     Cataract surgery rate (in uninsured          Quarterly                   No per million            1 709               2 451                   0                   0            1 692
       population)
                                       Numerator                     1                                       93                  93                   0                   0            8 050
                          Denominator / 1 000 000                    2                                    0.054               0.038             0.006              0.010               4.759
2.     Malaria case fatality rate                   Quarterly                         %                                                                                                   0.7%
                                       Numerator                     3                                           0                   0                0                   0                    1
                                     Denominator                     4                                           0                   0                0                   0               139

                                                                                                                                                                                          31
8.   QUALITY OF CARE
     Table 14: Top 20 worst performing Ideal Clinic elements in PHC facilities 2017/18 YTD
     Nr                                            Worst performing elements
     1.    Patient record content adheres to ICSM prescripts
     2.    Adolescent and youth friendly services are provided
     3.    Staffing needs have been determined in line with WISN
     4.    Staffing is in line with WISN
     5.    The facility has a dedicated budget
     6.    Disinfectant, cleaning materials and equipment are available
     7.    There is a standard security guard room OR the facility has an alarm system linked to armed
           response
     8.    Building is compliant with safety regulations
     9.    There is a functional clinic committee
     10.   Contact details of clinic committee members are visibly displayed
     11.   There is an official memorandum of understanding between the district management and
           Cooperative Governance and Traditional Affairs (CoGTA)
     12.   All external signage in place
     13.   The National Referral Policy is available
     14.   There is an official memorandum of understanding between the PDOH and the Department of
           Social Development
     15.   The National Clinical Audit guideline is available
     16.   Clinic space accommodates all services and staff
     17.   Ante-natal patient initiated on ART rate is at least 96% or has increased by at least 5% from the
           previous year
     18.   Facility refers environmental health related risks to environmental health services
     19.   All staff has received in-service training on infection control standard precautions that is in-line
           with the Standard Operating Procedure in the last two years.
     20.   Annual awareness day on hand hygiene is held
     [Source: Ideal Clinic Quality Improvement Plan 2017/18]

     Table 15: Top 20 worst performing National Core Standards in district hospitals 2017/18 YTD
     Nr                                            Worst performing elements
     1.
     2.
     3.
     4.
     5.
     6.
     7.
     8.
     9.
     10.

                                                        32
Nr                                            Worst performing elements
11.
12.
13.
14.
15.
16.
17.
18.
19.
20.
[Source: WebDHIS National Core Standards]

Table 16: Top 5 challenges reported by patients in patient surveys and patient complaints
2017/18 YTD
Nr                  Challenges reported in patient surveys                Patient complaints (category)
1.     The hospital did not assist me to get a lift home         Waiting times
2.     I had to wait a long time to get my folder                Staff Attitudes
3.     It takes longer than 30 minutes to get to the hospital    Care and Professional Treatment
4.     It costs more than R20 to get to the hospital             Other
5.     I was very bored at the hospital                          Safety and Security
[Source: Sinjani]

                                                                                                          33
9.    ORGANISATIONAL STRUCTURE OF THE DISTRICT MANAGEMENT TEAM

Figure 9: Organogram for Central Karoo as at 31 March 2017

                                                             34
10. DISTRICT HEALTH EXPENDITURE
Table 17: Summary of district health expenditure 2016/17
                                                                                                 TOTAL
                                Budget: Adjusted
Sub-programme                                          Expenditure                                               % Overspent
                                Appropriation                               Budget            Expenditures
                                                                                                                 (Underspent)

2.1    District Management            R 7 914 000.00       R 8 126 524.09    R 7 914 000.00     R 8 126 524.09      6.51%

2.2    Clinics                      R 45 451 000.00       R 46 036 550.81   R 45 451 000.00    R 46 036 550.81      7.48%

       Community Health
2.3                                   R 2 164 000.00       R 2 061 317.85    R 2 164 000.00     R 2 061 317.85      20.94%
       Centres
       Community Services
2.4                                 R 19 708 000.00       R 19 152 748.99   R 19 708 000.00    R 19 152 748.99      1.59%
       (incl. PAH)
       Other Community
2.5
       Services
                                                                                                                    7.33%
2.6    HIV/AIDS                     R 30 520 000.00       R 29 026 155.42   R 30 520 000.00    R 29 026 155.42

2.7    Nutrition                      R 2 767 000.00       R 2 397 348.21    R 2 767 000.00     R 2 397 348.21      -1.27%

2.9    District Hospitals           R 92 978 000.00       R 97 287 723.58   R 92 978 000.00    R 97 287 723.58      6.54%

2.12   Other Donor Funding

TOTAL DISTRICT                     R 201 502 000.00      R 204 088 368.95 R 201 502 000.00 R 204 088 368.95         6.45%

[Source: District Health Expenditure Review (2016/17) or BAS]

                                                                35
11. DISTRICT PERFORMANCE INDICATORS
   The service delivery component is the core business of District Health Services. It covers the
   delivery of the full district health package of services, the management and supervision of
   these services, how well the service performs in terms of health outcomes, and quality
   assurance.

   The District has six main focus areas in the context of service delivery:
        Primary health care (PHC) services.
        Home community based care.
        Acute services in the district hospitals especially with regard to the functioning of the
         emergency centres.
        Infectious diseases (especially HIV, AIDS, tuberculosis (TB) and sexually transmitted
         infections (STIs)).
        Women’s health and child health.
        Improving the experience of patients at health facilities (which is fundamental in the
         process).

   The following are priorities in terms of actions to address the service delivery challenges:
        Addressing the burden of disease by managing patients in an integrated way on all
         platforms of care, e.g. community-based, primary health care and district hospitals.
        Particular emphasis on the management of chronic diseases. This includes
         implementation of the Practical Approach to Care Kit (PACK) programme, an
         algorithm-based diagnosis and medication methodology of managing chronic
         diseases.
        Optimal financial management to maximise health outcomes.
        Ensure equity in distribution of all new posts.
        Maximise recruitment and retention activities to keep personnel with scarce skills.
        Maximise opportunities to improve the capital infrastructure of facilities.
        Ensure all vacant posts are filled as soon as possible.
        Ensure emergency centres are capacitated to be fully functional.
        Consolidate outreach and support services from George Regional Hospital.
        Integration of the anti-retroviral treatment (ART) programme into the mainstream
         chronic disease management programme.
        Ensuring full implementation of the basic antenatal care (BANC) protocols.
        On-going training for staff working in labour wards.
        Maintain improved coverage of fertility planning services.
        Focus on immunisation of children to ensure adequate coverage.
        Improving the experience of clients utilising health services.

                                                                                                  36
11.1 DISTRICT HEALTH SERVICES
Table 18: Performance indicators for District Health Services
                                                                                                                                                                                 Provincial
                                                           Data                                                        Estimated
      Programme performance indicator                                Type     Audited / Actual performance                                  Medium term targets                    actual
                                              Frequency source /                                                      performance
                                                                                                                                                                                performance
                                                        Element ID
                                                                            2014/15       2015/16       2016/17         2017/18       2018/19       2019/20       2020/21         2016/17
 SECTOR SPECIFIC INDICATORS
 1.       Ideal clinic (IC) status rate        Annual                 %         0.0%          0.0%         33.3%           77.8%         88.9%        100.0%        100.0%           17.2%
                                 Numerator                  3                         0             0             3               7             8             9             9           47
                              Denominator                   2                         9             9             9               9             9             9             9          273
 2.       PHC utilisation rate (annualised)   Quarterly              No          2.6           2.6           2.7              2.7          2.7           2.7           2.7              2.3
                                 Numerator                  6                191 490       190 933       199 941          205 337      207 363       209 431       211 527       14 413 350
                              Denominator                   7                 73 981        74 660        75 338           76 061       76 828        77 610        78 402        6 318 281
 3.       Complaint resolution within 25      Quarterly               %        95.7%         81.8%         84.0%           84.8%         86.7%         92.6%         96.0%           95.6%
          working days rate (PHC
          facilities)
                                 Numerator                  10                    22            18            21              28            26            25            24            3 175
                              Denominator                   8                     23            22            25              33            30            27            25            3 320

                                                                                                                                                                                       37
Table 19: Quarterly targets for District Health Services
             Programme performance indicator                 Data source    Frequency   Annual target                              Quarterly targets
                                                             / Element ID                 2018/19           Quarter 1         Quarter 2         Quarter 3         Quarter 4
 SECTOR SPECIFIC INDICATORS
 1.       Ideal clinic (IC) status rate                                      Annual              88.9%                    -                 -                 -          88.9%
                                                 Numerator        3                                     8                 -                 -                 -                8
                                              Denominator         2                                     9                 -                 -                 -                9
 2.       PHC utilisation rate (annualised)                                 Quarterly               2.7                 2.7               2.7               2.6               2.8
                                                 Numerator        6                            207 363            51 263            52 740             49 292           54 068
                                              Denominator         7                             76 828            19 207            19 207             19 207           19 207
 3.       Complaint resolution within 25 working days rate                  Quarterly            86.7%             85.7%             87.5%             85.7%             87.5%
          (PHC facilities)
                                                 Numerator       10                                 26                   6                 7                 6                 7
                                              Denominator         8                                 30                   7                 8                 7                 8

      Aspects to take into consideration for the Central Karoo include:
           The PHC programme is managed centrally from Beaufort West.
      Strategic challenges:
           Equity in distribution of any new posts established.
           Recruitment and retention of professionals with scarce skills.
      Achieve Ideal Clinic Status:
           Four out of the four (4) identified facilities achieved Ideal Clinic status during 2017/18. Three facilities obtained Ideal Clinic status during
            2016/17 and all three facilities maintained their Ideal Clinic status in 2017/18. The two remaining facilities, Kwa Mandlenkosi and Murraysburg
            Clinics will be targeted to obtain Ideal Clinic Status in 2018/19.
           Key Interventions to achieve Ideal Clinic status includes:
              o    Operational Managers to complete status determination early in first quarter, or as soon as the template is finalized and available.
              o    PPTICRM team must complete first audit in July 2018.
              o    If necessary, the PPTICRM audit team must repeat the PPTICRM review at any Ideal Clinic facilities that does not achieve ideal clinic
                   status during the first PPTICRM audit. The PPTICRM team and PHC manager must render continuous support to all facilities.

                                                                                                                                                                              38
o   PPTICRM team must do at least 2 audit reviews at Kwa Mandlenkosi and Murraysburg Clinics in preparation for peer review audits during
    the third quarter.
o   Dedicated and specific attention and support for the operational managers at Kwa Mandlenkosi and Murraysburg Clinics.

                                                                                                                                      39
11.2 DISTRICT HOSPITALS
Table 20: Performance indicators for District Hospitals
                                                                                                                                                                                 Provincial
                                                          Data                                                        Estimated
      Programme performance indicator                               Type     Audited / Actual performance                                   Medium term targets                    actual
                                             Frequency source /                                                      performance
                                                                                                                                                                                performance
                                                       Element ID
                                                                           2014/15       2015/16       2016/17         2017/18        2018/19       2019/20       2020/21         2016/17
 SECTOR SPECIFIC INDICATORS
 1.      Hospital achieved 75% and more      Quarterly               %          0.0%          0.0%          0.0%           25.0%         25.0%         75.0%        100.0%            69.7%
         on National Core Standards
         (NCS) self-assessment rate
         (district hospitals)
                                 Numerator                 3                         0             0             0               1              1             3             4               23
                              Denominator                  4                         3             4             3               4              4             4             4               33
 2.      Average length of stay (district    Quarterly              Days          2.9           3.3           2.8             2.8           2.8           2.8           2.8                 3.2
         hospitals)
                                 Numerator                 7                  30 905        32 227        30 548          30 395         30 716        31 042        31 373         909 893
                              Denominator                  8                  10 507          9 824       10 747          10 769         10 879        10 992        11 107         280 580
 3.      Inpatient bed utilisation rate      Quarterly               %         70.6%         73.6%         69.7%           69.4%         70.1%         70.9%         71.6%            84.8%
         (district hospitals)
                                 Numerator                 7                  30 905        32 227        30 548          30 395         30 716        31 042        31 373         909 893
                              Denominator                  9                  43 805        43 805        43 805          43 805         43 805        43 805        43 805        1 072 731
 4.      Expenditure per PDE (district       Quarterly               R        R 1 814       R 2 007       R 2 273         R 2 532       R 2 616       R 2 711       R 2 840          R 2 139
         hospitals)
                                 Numerator                 10              81 724 110    90 921 997    97 287 724     108 279 000 113 015 000 118 361 000 125 250 000 2 923 677 427
                              Denominator                  16                 45 043        45 312        42 799          42 770         43 207        43 652        44 104        1 366 831
 5.      Complaint resolution within 25      Quarterly               %         57.1%         77.8%         79.7%           81.3%         83.7%         85.7%         89.8%            90.4%
         working days rate (district
         hospitals)
                                 Numerator                 19                     16            42            47                 39         41            42            44            1 501
                              Denominator                  17                     28            54            59                 48         49            49            49            1 661

                                                                                                                                                                                       40
Table 21: Quarterly targets for District Hospitals
               Programme performance indicator                   Data source    Frequency   Annual target                              Quarterly targets
                                                                 / Element ID                 2018/19           Quarter 1         Quarter 2         Quarter 3         Quarter 4
 SECTOR SPECIFIC INDICATORS
 1.       Hospital achieved 75% and more on National                            Quarterly            25.0%                    -                 -                 -          25.0%
          Core Standards (NCS) self-assessment rate (district
          hospitals)
                                                     Numerator        3                                     1                 -                 -                 -                1
                                                   Denominator        4                                     4                 -                 -                 -                4
 2.       Average length of stay (district hospitals)                           Quarterly               2.8                 3.0               2.8               2.8               2.7
                                                     Numerator        7                             30 716             7 980             7 639              7 600            7 497
                                                   Denominator        8                             10 879             2 655             2 725              2 728            2 771
 3.       Inpatient bed utilisation rate (district hospitals)                   Quarterly            70.1%             72.9%             69.8%              69.4%            68.5%
                                                     Numerator        7                             30 716             7 980             7 639              7 600            7 497
                                                   Denominator        9                             43 805            10 951            10 951             10 951           10 952
 4.       Expenditure per PDE (district hospitals)                              Quarterly          R 2 616           R 2 375           R 2 722             R 2 602         R 2 770
                                                     Numerator       10                        113 015 000        26 111 805        29 104 876         28 033 101       29 765 218
                                                   Denominator       16                             43 207            10 996            10 693             10 772           10 746
 5.       Complaint resolution within 25 working days rate                      Quarterly            83.7%             84.6%             83.3%              83.3%            83.3%
          (district hospitals)
                                                     Numerator       19                                 41                  11                10                10                10
                                                   Denominator       17                                 49                  13                12                12                12

Infection control
          Improve/implement infection control principles at district hospitals:
           o       Wearing of masks.
           o       Open windows.
           o       Hand washing with anti-bacterial soap and promoting hand washing practices amongst staff through on-going training and annual
                   hand washing campaigns.
          Annual TB screening of all health care workers.

                                                                                                                                                                                  41
Mental Health Services
       Improve mental health information systems by increasing the percentage of mental health patients who are discharged from the emergency
        centre and the hospital with an ICD-10 code.
Hospital achieved 75% and more on National Core Standards (NCS) self-assessment rate (district hospitals)
       All district hospitals to do a self-assessment during the third quarter of 2018/19.
       Set up a district team to conduct NCS assessments at all district hospitals during the third quarter of 2018/19.
       Ensure all staff understands the criteria for national core standards (NCS).
       Learn from gaps identified during mock assessments conducted by the Office of Health Standards Compliance.
       Monitor progress and maintain extreme and vital measures within the NCS via monthly supervisory visit tool.
       All district hospitals must write and submit a QIP after the NCS assessment was conducted. The report must be submitted before the end of
        the third quarter.
       Progress on the QIP must be monitored and discussed at management meetings.
Complaint resolution rate
       Re-visit system to ensure that all complaints are documented.
       Make sure all sub-districts are using the standardised SOP (Circular H64/2015).
       Discuss complaints and compliments on the monthly nursing managers’ forum.
Average length of stay:
       Improve on ICD-10 coding.
       Conduct triage/waiting time audits twice a year at Beaufort West Hospital and once a year at the other district hospitals.
       Reduce waiting times at all facilities - implement/improve appointment system.
Mortality and morbidity reviews:
       Monthly morbidity and mortality (M & M) meetings. Each district hospital must identify a person who will take responsibility for this e.g. a
        medical officer or the nursing manager.
       Follow up areas of concern or any trends identified during M & M discussions.
       Discuss M & M findings at quarterly extended management meetings.
       Feedback to all staff to improve on previous challenges and skills.

                                                                                                                                                 42
11.3 HIV AND AIDS, STIs AND TB CONTROL (HAST)
Table 22: Performance indicators for HIV and AIDS, STIs and TB control (HAST)
                                                                                                                                                                        Provincial
                                                           Data                                                     Estimated
     Programme performance indicator                                 Type     Audited / Actual performance                              Medium term targets               actual
                                              Frequency source /                                                   performance
                                                                                                                                                                       performance
                                                        Element ID
                                                                            2014/15     2015/16      2016/17         2017/18      2018/19     2019/20     2020/21        2016/17
STRATEGIC GOAL: Promote health and wellness.
1.1.1   TB programme success rate             Quarterly               %        79.2%        79.3%        78.2%           76.5%       83.5%       83.5%        83.6%          80.4%
                                  Numerator                 1                    462          490            467           455         500         502          503         34 651
                                Denominator                 2                    583          618            597           595         599         601          602         43 099
2.1.1   ART retention in care after 12        Quarterly               %        67.9%        57.2%        61.2%           59.5%       59.6%       59.8%        59.9%          72.2%
        months
                                  Numerator                 3                    184          186            229           223         226         229          232         33 307
                                Denominator                 4                    271          325            374           375         379         383          387         46 120
2.1.2   ART retention in care after 48        Quarterly               %        60.6%        51.3%        52.1%           53.7%       53.1%       52.6%        52.0%          60.7%
        months
                                  Numerator                 5                     94           99            113           102         102         102          102         19 700
                                Denominator                 6                    155          193            217           190         192         194          196         32 455
SECTOR SPECIFIC INDICATORS
1.      ART client remain on ART end of       Quarterly              No         1 418       1 416        1 631           1 710        1 970       1 990        2 010       230 931
        month - total
                                    Element                 7
2.      TB/HIV co-infected client on ART      Quarterly               %        66.7%        67.0%        67.0%           75.4%       75.5%       75.7%        75.8%          89.6%
        rate
                                  Numerator                 8                    118          126            126           141         142         143          144         14 902
                                Denominator                 9                    177          188            188           187         188         189          190         16 637
3.      HIV test done – total                 Quarterly              No        17 646      27 543       31 892          35 786       36 098      36 417       36 742      1 379 375
                                    Element                 10
4.      Male condoms distributed              Quarterly              No     1 526 194    1 904 270   2 355 590        2 304 200   2 347 418   2 392 075   2 437 864     113 913 868
                                    Element                 12
5.      Medical male circumcision –           Quarterly              No          518          117            214           250         252         254          256         11 687
        total
                                    Element                 16

                                                                                                                                                                              43
You can also read