Assessment of the Bird or Animal Deformities or Reproductive Problems Beneficial Use Impairment in Michigan's Great Lakes Areas of Concern
←
→
Page content transcription
If your browser does not render page correctly, please read the page content below
MI/DEQ/WRD-12/032

  Assessment of the Bird or Animal Deformities or

Reproductive Problems Beneficial Use Impairment in

     Michigan’s Great Lakes Areas of Concern

                                                             Prepared by:

                      Dennis Bush, Toxicologist, Water Resources Division
                     Joe Bohr, Aquatic Biologist, Water Resources Division

                                                           August 6, 2012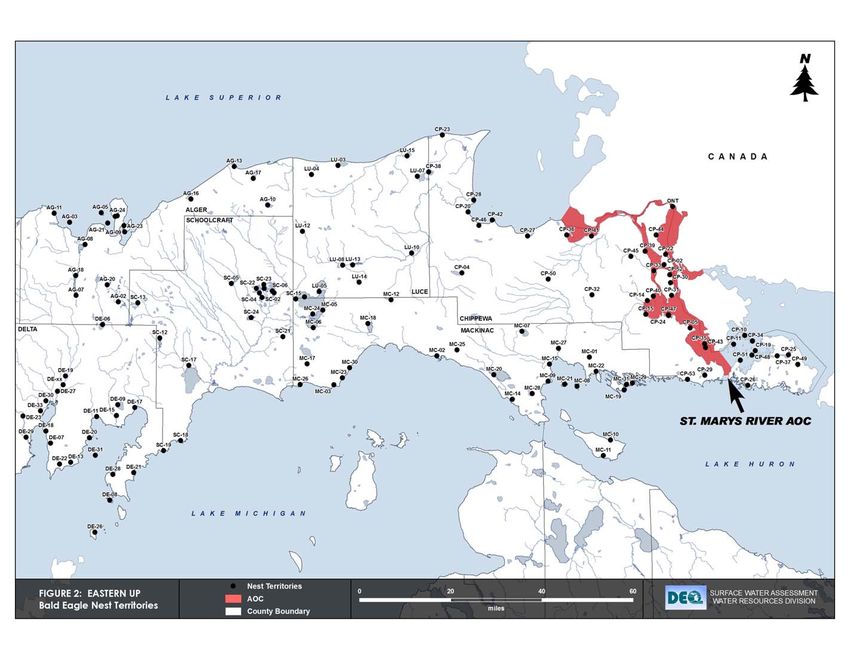
ACKNOWLEDGEMENTS

We would like to thank Julie Sims of the National Oceanic and Atmospheric Administration,
Great Lakes Research Laboratory, for writing the proposal for the grant supporting this project.
We would also like to thank the following Michigan Department of Environmental Quality
(MDEQ) staff: Emily Weingartz for conducting the literature searches for this project, Sharon
Baker for coordinating activities between the United States Fish and Wildlife Service (USFWS)
and the MDEQ, and Denise Page for providing secretarial support. We thank Seth Wright of the
Great Lakes Environmental Center for creating the report maps. We would also like to thank
the Canadian Wildlife Service employees, Dr. Chip Weseloh and Daryl McGoldrick, for providing
information related to colonial nesting birds and fish from Canada. We would also like to thank
Dr. Christine Custer of the United States Geological Survey (USGS) for summarizing the results
of her tree swallow work. We would like to thank Dr. Lisa Williams of the USFWS for obtaining
the funds for this project and providing comments on a draft of the report, and David Best for
providing information on the productivity of bald eagles in Michigan. The bald eagle and herring
gull contaminant data, which were a vital part of this project, were provided by staff of Clemson
University (Lindsay Moore and Latice Fuentes) and the University of Maryland (Dr. William
Bowerman).

Partial funding for this project is supported by a Grant Agreement from the United States
Department of the Interior, Fish and Wildlife Service with funding from the Great Lakes
Restoration Initiative. Mention of trade names or commercial products does not constitute their
endorsement by the United States Government.

Cover photos: Common tern - Katherine Whittemore, USFWS; Bald eagle - Dr. William
Bowerman, University of Maryland; and Mink - Don Breneman, Great Lakes National Program
Office.

                                                i
EXECUTIVE SUMMARY

There are currently six Areas of Concern (AOCs) in Michigan that have a Bird or Animal
Deformities or Reproductive Problems Beneficial Use Impairment (“Wildlife BUI”). The
methodology provided in the document titled, Guidance for Delisting Michigan’s Great Lakes
Areas of Concern (MDEQ, 2006), was used to determine whether sufficient data are available to
remove the Wildlife BUI for these AOCs. To remove a Wildlife BUI there must be evidence that
the reproduction or development of wildlife species within the AOC is no longer being adversely
impacted; if adverse effects are evident the BUI may still be removed if the incidence of these
effects does not exceed levels found in a comparison population.

This review focused on assessing the impacts of p,p’-DDE, polychlorinated biphenyls (PCBs),
and dioxin toxic equivalents (TEQs) in the AOCs on bald eagles, common terns, and mink since
this was the basis for the original BUI for many of the AOCs. In addition, the results of the
recent tree swallow studies conducted by the USGS in the AOCs were included in this review.
Contaminant levels and productivity of bald eagles is currently being monitored by the MDEQ.
Contaminant levels are also being monitored in herring gull eggs by the MDEQ. Since herring
gulls are not very sensitive to the effects of environmental contaminants, it was necessary to
compare concentrations of contaminants found in herring gull eggs to effect levels found in eggs
of more sensitive species. Effect levels of contaminants in mink livers are available in the
literature, but few mink studies have been conducted in the AOCs. Concentrations of
contaminants in fish that would be protective of wildlife were also estimated for bald eagles,
colonial nesting birds, mink, and otters because there are only limited wildlife studies available
for some of the AOCs. The utility of this approach was limited because there were limited whole
fish data available for the AOCs and most of the data that were available were for species
and/or sizes of fish not normally consumed by the wildlife species that were the focus of this
project. The limited forage fish contaminant data required us to base some of our assessments
on rough extrapolations from contaminant levels in carp to levels in forage fish.

Provided below is a brief summary of our recommendations concerning the retention of the
Wildlife BUI for the six AOCs of interest. It may be prudent to seek input from experts
conducting wildlife studies within the AOCs to determine whether they agree with our
recommendations.

   •   The Wildlife BUI for the Detroit River AOC should be retained based on potential effects
       of contaminants on terns, herons, and snapping turtles.

   •   The Wildlife BUI for the Kalamazoo River AOC should be retained based on potential
       effects of contaminants on bald eagles and mink.

   •   The Wildlife BUI for the Saginaw River/Bay AOC should be retained based on potential
       effects of contaminants on colonial nesting birds and other wildlife.

   •   The Wildlife BUI for the River Raisin AOC should be retained based on potential effects
       of contaminants on bald eagles and colonial nesting birds.

   •   Little scientific support was available for the retention of the Wildlife BUI for the St. Marys
       River AOC. However, since the Wildlife BUI for the St. Marys River AOC was originally
       based on effects of TEQs on terns, it is recommended that the Wildlife BUI be retained
       until the completion of a planned study of terns by the Canadian Wildlife Service.

                                                  ii
•   The Wildlife BUI for the St. Clair River AOC was based on an increased incidence of
       deformities in midges. If effects on midges are still considered to be wildlife impacts,
       then the Wildlife BUI for the St. Clair River AOC should be retained. However, we
       recommend that wildlife impacts be based on adverse effects found on vertebrates and
       deformities in midges be used in the assessment of the “Degradation of Benthos” BUI. If
       only vertebrate data are considered for the assessment, then the Wildlife BUI for the
       St. Clair River AOC should be removed.

We recommend that wildlife and fish contaminant monitoring continue so that informed
decisions can be made regarding potential impacts to wildlife in the AOCs. The carp data
collected by the MDEQ were very helpful for this project because they helped us to determine
whether there were elevated contaminant levels in the AOCs and they provided insight into
whether wildlife consuming fish from the AOC might be adversely impacted. It may be useful to
also measure contaminant levels in forage fish from some of the AOCs so that a more accurate
determination of exposure to wildlife can be determined.

REPORT CONTEXT

This review and assessment of existing data for the Wildlife BUI is one in a series of statewide
assessments for BUIs conducted in Michigan’s Great Lakes AOCs. Review of existing data is
the first step in the overall process of applying assessment criteria to a BUI in an affected AOC.
The complete evaluation for any BUI is a public process, conducted by agency staff in
partnership with the local Public Advisory Council and United States Environmental Protection
Agency (USEPA) in each AOC. Per the Guidance for Delisting Michigan’s Great Lakes Areas of
Concern, a BUI-specific team will be convened by the MDEQ Coordinator for each AOC to
evaluate recommendations in this assessment and determine AOC-specific next steps.
Outcomes of each team’s deliberations on recommendations for BUI removal, further
monitoring, or further remedial actions, as warranted by site-specific considerations, will be
documented by the MDEQ Coordinator. If removal of the BUI is recommended by the team for
any of the affected AOCs, documentation will be prepared and processed per procedures in the
Guidance for Delisting Michigan’s Great Lakes Areas of Concern.

                                                iii
INTRODUCTION

There are currently six AOCs in Michigan that have a Bird or Animal Deformities or
Reproductive Problems Beneficial Use Impairment (henceforth referred to as the “Wildlife BUI”).
The purpose of this project is to assess the status of this impairment in the six AOCs listed in
Table 1. Specifically, the objectives of this assessment were to determine whether there are
sufficient data available to remove the Wildlife BUI and to identify additional study needs if
insufficient data were available to make a determination.

Table 1. AOCs with a Wildlife BUI, species impacted, and contaminants determined to be of
concern according to the Remedial Action Plans.
AOC                                         Species                    Contaminant*
Detroit River                  Gulls, ducks                    DDE, HCB, PCBs
Kalamazoo River                Mink, birds                     PCBs
River Raisin                   Eagles                          DDT, PCBs
Saginaw River/Bay              Gulls, terns, herons, eagles    PCBs, Dioxins
St. Clair River                Chironomids                     Organic compounds
St. Marys River                Terns                           PCBs
*DDE = Dichlorodiphenyldichloroethane; HCB = Hexachlorobenzene; PCBs = Polychlorinated biphenyls;
DDT = Dichlorodiphenyltrichloroethane

METHODOLOGY

The methodology provided in the document titled, Guidance for Delisting Michigan’s Great
Lakes Areas of Concern (MDEQ, 2006), was used to determine whether sufficient data are
available to remove the Wildlife BUI for six of the AOCs. To remove a Wildlife BUI there must
be evidence that the reproduction or development of wildlife species within the AOC is no longer
being adversely impacted; if adverse effects are evident the BUI may still be removed if the
incidence of these effects does not exceed levels found in a comparison population. The
following approaches (listed in order of importance) were used to determine whether wildlife
within an AOC is being adversely impacted.

    •   Evaluate observational data on reproductive or developmental effects in wildlife living in
        the AOC.

    •   Compare tissue contaminant levels in egg, young, and/or adult wildlife to benchmarks for
        reproductive or developmental effects.

    •   Assess whether contaminant levels in fish are sufficiently high to cause reproductive or
        developmental effects in piscivorous wildlife.

Toxicity benchmarks were derived for total PCBs (referred to as “PCBs” throughout the
remainder of this report), p,p’-DDE, 2,3,7,8-tetrachloro-p-dioxin TEQs, and mercury because
studies have shown that these contaminants have adversely impacted Michigan wildlife. For
the surrogate species approach, it was also necessary to derive benchmarks based on
total DDT (the summation of the para, para’ and ortho, para’ forms of DDT, DDE, and DDD
(1,1-bis(4-chlorophenyl)-2,2-dichloroethane) because this is what the animals were dosed with
in the laboratory study. After further review, it was considered unnecessary to assess the
impacts of mercury on wildlife within the six AOCs because data from Michigan’s wildlife and
fish contaminant monitoring programs suggest that none of the six AOCs are hotspots for
mercury. Even though HCB is listed as being one of the potential causes of adverse effects on

                                                     1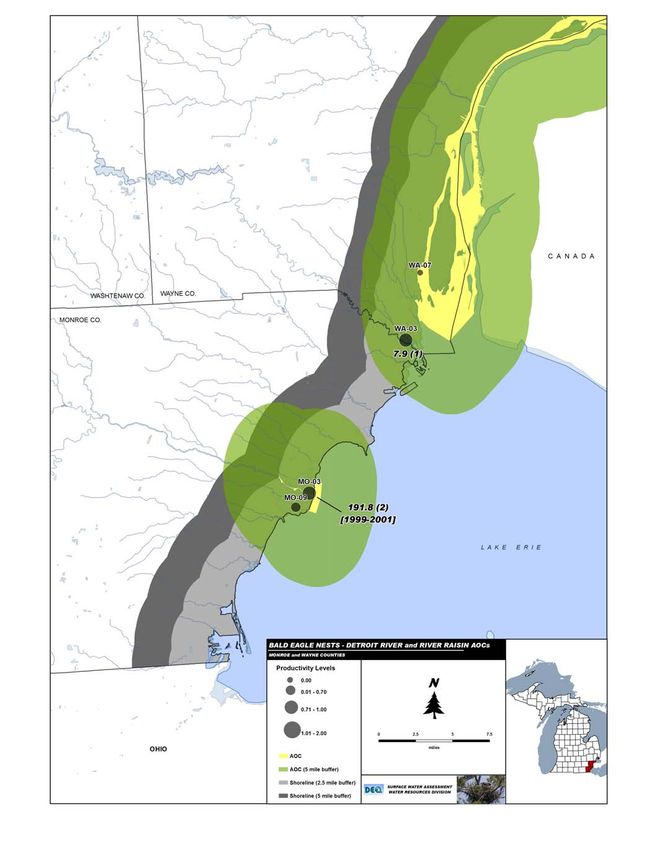
wildlife populations living along the Detroit River, it will not be assessed in this report because
herring gull egg data (Weseloh et al., 2006) and fish contaminant data show that this
contaminant is not elevated in the Detroit River compared to other areas of the state.

A thorough literature search was conducted to locate recent studies of wildlife within the six
AOCs. All studies were reviewed even if they involved a wildlife species that was not the basis
for the original BUI listing. This was considered a prudent approach since it would be illogical to
remove the BUI based on data for one wildlife species when sufficient data are available to
show impacts on another species. For this project, we relied heavily on the bald eagle and
herring gull monitoring data that Michigan has collected since 1999 and 2002, respectively.
Michigan’s fish contaminant monitoring database was the primary source of contaminant data
for fish within the AOC. However, a literature search was conducted to locate any recent fish
contaminant data available for the AOCs.

As mentioned earlier, Wildlife BUIs are recommended to be retained if there are sufficient data
available to conclude that a reproduction or developmental benchmark is exceeded AND the
incidence of these effects (or the concentration of the contaminant of interest in the AOC)
exceeds levels found in the comparison populations. Comparison populations were selected
from areas considered relatively pristine and areas near the AOC. For example, the
Manistee River (relatively pristine area) and the Grand River (similar nearby area) were selected
as comparison populations for the Kalamazoo River AOC. Based on this approach, it is
possible that the removal of a Wildlife BUI will be recommended even if the reproduction or
development of wildlife within the AOC is impacted if comparison populations within the state
are exhibiting similar problems or have similar contaminant concentrations.

Whenever possible, multiple lines of evidence were used to make conclusions about the status
of the Wildlife BUI. Based on the review of wildlife and fish data from the AOC and contaminant
concentrations in comparison populations, one of the following conclusions was made:
(1) sufficient data available to remove the BUI; (2) sufficient data available to retain the BUI; or
(3) insufficient data available to make a determination. If insufficient data were available to
determine whether the BUI should be removed, then recommendations for additional research
were made.

TOXICITY REFERENCE VALUES

Reviews by Bosveld and Van Den Berg (1994), USEPA (1995); Hoffman et al. (1996); Burger
and Gochfeld (1997); Elliott and Harris (2001/2002); Fox and Bowerman (2005); Scheuhammer
et al. (2007); and Blankenship et al. (2008) were used to determine the Toxicity Reference
Values (TRVs) for p,p’-DDE, PCBs, TEQs, and mercury in wildlife species. No effort was made
to update the TEQs reported in the original studies using the more current Toxicity Equivalence
Factors. Whenever possible, the TRVs were based on studies of bald eagles and/or colonial
nesting birds since these types of birds have been shown to be sensitive to p,p’-DDE and PCBs
and they are the basis for many of the Wildlife BUIs. TRVs for other bird species were used
when limited data were available for bald eagles and/or colonial nesting birds. TRVs were also
provided for mink since they are sensitive to the effects of PCBs, TEQs, and mercury. All
concentrations presented in this document are reported as wet weight concentrations.

The concentrations of contaminants in fish that could cause adverse effects in bald eagles and
colonial nesting birds were derived using two methods. The first method extrapolated from
effect levels for contaminants in eggs of bald eagles and colonial nesting birds to fish tissue
levels using relationships derived in the field. The second approach used dietary toxicity studies

                                                  2
on surrogate bird species to extrapolate to a dietary concentration that could cause adverse
effects in bald eagles and colonial nesting birds. Fish tissue concentrations that could adversely
affect mink were derived using studies that either fed mink fish collected from a contaminated
area or diets treated with the chemical of interest. The confidence in the fish tissue levels
estimated to cause adverse effects in mink is high because mink were exposed to the
contaminants in a controlled setting. Because surrogate bird species are normally needed to
assess the effects of contaminants on bald eagles and colonial nesting birds, the protectiveness
of the TRVs are less certain.

We updated the surrogate species approach used by Newell et al. (1987) by incorporating
results from more recent laboratory and field studies. We also used fish consumption rates and
body weights for wildlife based on the review conducted by the USEPA (1995). In addition, our
assessment of laboratory studies focused on endpoints that would impact wildlife populations
(i.e., growth, survival, and reproduction/development) and not just individual animals. Newell
et al. (1987) also estimated the concentration of contaminants that would pose a cancer risk of
1 in 100. Cancer risk was not assessed for this project since the use of
reproduction/developmental endpoints was considered more appropriate for the protection of
wildlife populations than cancer risk and none of the Wildlife BUIs were based on an increased
incidence of cancer in wildlife.

Bald Eagles:

Productivity-

The productivity of a bald eagle population can be quantified by dividing the total number of
fledged young by the number of occupied nests (Postupalsky, 1974). Productivity of a bald
eagle population must be at least 0.7 young per occupied nest for the population to be
considered stable (Sprunt et al., 1973) and 1.0 young per occupied nest for a population to be
considered healthy (Grier et al., 1983 based on data presented in Sprunt et al., 1973). For
these endpoints, productivity was based on a 5-year average so that factors other than
contaminants that may have an impact on productivity would not have as much influence on the
resulting value (Wiemeyer et al., 1984).

Blood Concentration-

The concentration of p,p’-DDE and PCBs in the plasma of eaglets has been correlated with the
productivity of bald eagles (Bowerman et al., 2003). This relationship can be used to determine
mean concentrations of p,p’-DDE and PCBs in eaglet plasma that are associated with stable or
healthy bald eagle populations. Using the productivity and contaminant data for various areas
of the Great Lakes region provided in Bowerman et al. (2003), the following relationships
between productivity and PCB and p,p’-DDE concentrations were determined:

Productivity = -0.00335(µg PCBs/kg plasma concentration) + 1.11866 (R2 = 0.65)
Productivity = -0.018(µg p,p’-DDE/kg plasma concentration) + 1.2060 (R2 = 0.75)

Using the equations presented above, eaglet plasma concentrations of 11 micrograms per
kilogram (µg/kg) and 35 µg/kg for p,p’-DDE and PCBs, respectively, are associated with a
productivity of 1.0 young per occupied nest. Concentrations of PCBs and p,p’-DDE in eaglet
plasma at these levels and below are associated with healthy bald eagle populations. Eaglet
plasma concentrations of 28 µg/kg and 125 µg/kg for p,p’-DDE and PCBs, respectively, are
associated with a productivity of 0.7 young per occupied nest. Concentrations of PCBs and

                                                3
p,p’-DDE in eaglet plasma at these levels and below are associated with stable bald eagle
populations. Elliott and Harris (2001/2002) determined threshold values associated with a
productivity of 0.7 young per active nest for p,p’-DDE and PCBs in eaglet plasma of 28 µg/kg
and 190 µg/kg, respectively, by extrapolating from egg concentrations to blood levels. Since the
concentrations of p,p’-DDE and PCBs are correlated, it is not possible to determine the degree
to which each contaminant affects the bald eagle population. The plasma concentration of
TEQs in eaglets that would not adversely affect bald eagles is unknown.
No studies have related mercury exposure to a decrease in the productivity of bald eagles in the
environment (Scheuhammer et al., 2007). It was therefore not possible to derive TRVs for
mercury in eagle feathers.
Egg Concentration-
Contaminant concentrations in eggs have been associated with various effects on bald eagle
populations. No Observable Adverse Effect Concentrations (NOAECs), Lowest Observable
Adverse Effect Concentrations (LOAECs), and other effect levels in bald eagle eggs are
provided in Table 2. A brief explanation of which values are considered most suitable for risk
assessment purposes is provided below:
• The egg concentration associated with a productivity of 1.0 young/occupied nest was
considered a NOAEL for this project since this is the recovery goal of the Northern
States Bald Eagle Recovery Plan (Grier et al., 1983). The egg concentration associated
with a productivity of 0.7 young/occupied nest was also used for this project since it is
considered the concentration associated with a stable population by Sprunt et al. (1973).
• The p,p’-DDE concentration of 3.5 milligrams per kilogram (mg/kg) (Wiemeyer et al.,
1993) and 6.5 mg/kg (Best et al., 2010) associated with a productivity of 1.0 and 0.7
young/occupied nest, respectively, were used for risk assessment purposes. The results
of the assessment conducted by Wiemeyer et al. (1993) was considered more suitable
than Wiemeyer et al. (1984) because it was based on more data.
• The PCB concentration of 4.0 mg/kg (Wiemeyer, 1990) and 26 mg/kg (Best et al., 2010)
associated with a productivity of 1.0 (“normal reproduction”) and 0.7 young/occupied
nest, respectively, were used for risk assessment purposes. The value of 4.0 mg/kg is
higher than the concentration of < 3.0 mg/kg reported by Wiemeyer et al., (1993)
because it has been corrected for some of the influence that p,p’-DDE has on bald eagle
toxicity (Bowerman et al., 2012). This was considered a valid approach because the
influence of p,p’-DDE on the effects of PCBs on bald eagle productivity has declined
over the years. The NOAEC of 4.0 mg/kg has also been used for ecological risk
assessments in the past (Giesy et al., 1995).
• It was necessary to use enzyme induction as the endpoint for TEQs because no adverse
effects were observed on morphological, physiological, or histological parameters
measured in the bald eagle study by Elliott et al. (1996).
• Wiemeyer et al. (1984) estimated the concentration of mercury in eggs that would be
protective of bald eagle populations to be < 0.5 mg/kg based on the concentration of
mercury in eggs that caused adverse effects on pheasants (Fimreite, 1971). For this
assessment, the egg concentration of 2.0 mg/kg that was associated with a dietary
concentration of 0.3 mg/kg mercury that caused reproductive effects in American
4kestrels (Albers et al., 2007) was used because kestrels were considered better
surrogates for bald eagles than pheasants.
Table 2. Egg NOAEC and Effect Levels for p,p’-DDE, PCBs, TEQs, and mercury in bald eagles.
Egg concentration Endpoint Reference
< 3.0 mg/kg p,p’-DDE 1.0 Young/occupied nest Wiemeyer et al., 1984
3.5 mg/kg p,p’-DDE 1.0 Young/occupied nest Wiemeyer et al., 1993
16 mg/kg p,p’-DDE 15% Eggshell thinning Wiemeyer et al., 1993
6.5 mg/kg p,p’-DDE 0.7 Young/occupied nest Best et al., 2010
< 4.5 mg/kg PCBs 1.0 Young/occupied nest Wiemeyer et al., 1984
< 3.0 mg/kg PCBs 1.0 Young/occupied nest Wiemeyer et al., 1993
4.0 mg/kg PCBs Normal reproduction Wiemeyer et al., 1990
5.5 mg/kg PCBs Successful nests Wiemeyer et al., 1993
8.7 mg/kg PCBs Unsuccessful nests Wiemeyer et al., 1993
20 mg/kg PCBs 0.7 Young/occupied nest Elliott and Harris 2001/2002
26 mg/kg PCBs 0.7 Young/occupied nest Best et al., 2010
20 mg/kg PCBs Increased probability of nest Stratus Consulting Inc., 1999
failure
0.10 µg/kg TEQs Enzyme induction NOAEC Elliott et al., 1996; Elliott and
Harris, 2001/2002
0.21 µg/kg TEQs Enzyme induction Elliott et al., 1996; Elliott and
Harris, 2001/2002
< 0.5 mg/kg Mercury* Reproductive effects Wiemeyer et al., 1984
0.7 mg/kg Mercury** NOAEC Albers et al., 2007
2.0 mg/kg Mercury** Reproductive effects Albers et al., 2007
* Based on data for pheasants.
** Based on data for American kestrels.
Fish Tissue Concentration-
Two approaches were used to estimate the fish tissue concentrations of various contaminants
that may cause adverse effects on bald eagle populations. The first approach used the
field-derived Biomagnification Factors (BMFs) generated by Giesy et al. (1995) and Kubiak and
Best (1991) to extrapolate from effect levels in eggs to fish tissue levels. The study by Giesy
et al. (1995) derived BMFs using multiple species of fish (chinook, pike, walleye, sucker,
steelhead, carp, and perch) from Great Lakes influenced sections of the Au Sable, Manistee,
and Muskegon Rivers, whereas the BMF reported for TEQs by Kubiak and Best (1991) was
based on data for northern pike from Thunder Bay (northwestern Lake Huron). This approach
should be used with caution since data provided by Kubiak and Best (1991) suggest that the
BMF can vary based on the fish species. The second approach used toxicity studies in
surrogate bird species to determine a dietary NOAEC and LOAEC in bald eagles.
BMF Approach
The following equation was used to derive the fish tissue levels provided in Table 3:
Fish Tissue Level = NOAEC or Effect Level in bird egg/BMF
5Table 3. Dietary NOAEC and Effect Levels (mg/kg) for PCBs, p,p’-DDE, TEQs, and Mercury.
PCBs p,p’-DDE TEQs Mercury
NOAEC (mg/kg egg) 4.0 3.5 0.00010 0.7
Effect Level (mg/kg egg) 26 6.5 0.00021 2.0
BMF 28 22 19 1.0
Fish Tissue NOAEC (mg/kg) 0.14 0.16 0.0000053 0.7
Fish Tissue LOAEC (mg/kg) 0.93 0.30 0.000011 2.0
Surrogate Species Approach
As part of the Great Lakes Initiative, surface water criteria protective of avian and mammalian
wildlife were derived for PCBs, DDT, 2,3,7,8-TCDD, and mercury (USEPA, 1995). For the avian
wildlife values, the geometric mean of the water concentration protective of kingfishers, herring
gulls, and bald eagles were used to determine the concentration that would be protective of all
avian wildlife. Since suitable toxicity tests were not available for these three bird species, the
water concentrations were derived by using toxicity tests conducted on surrogate bird species.
The Test Dose (TD) was based on a No Observable Adverse Effect Level (NOAEL) or Lowest
Observable Adverse Effect Level (LOAEL) for growth, reproduction/development, or survival
because these endpoints were considered most appropriate for the protection of wildlife
populations. In some cases, the TD for the surrogate species was divided by uncertainty factors
(UF) to account for LOAEL-to-NOAEL and/or subchronic-to-chronic extrapolations. An
additional uncertainty factor was used to account for possible differences in sensitivity between
the species of interest and the surrogate species. The dose that was determined to be
protective of bald eagles was then multiplied by the bald eagle’s body weight and then divided
by an appropriate fish consumption rate. No correction was made in the calculation of the fish
tissue level to account for the percentage of trophic level 3 and 4 fish that were consumed.
The following equation was used to derive the fish tissue levels provided in Table 4:
Fish Tissue Level = [(TD/UF) x body weight]/fish consumption
Fish Tissue Level = [(TD/UF) x 4.6 kg]/0.4639 kg/d
Where: TD = test dose; UF = uncertainty factor
Table 4. Surrogate species, key study, test dose (mg/kg/d), total uncertainty factor (the
uncertainty factor for LOAEL-to-NOAEL extrapolation is provided in parentheses) and the
resulting fish tissue levels (mg/kg) that are estimated to cause no adverse effects (NOAEC) or
adverse effects (LOAEC) on bald eagle populations.
PCBs DDT 2,3,7,8-TCDD Mercury
Surrogate Species Pheasant Pelican Pheasant Mallard
Key Study Dahlgren et al., Anderson et al., Nosek et al., 1992 Heinz et al., 1974;
1972 1975; 1977 1975; 1976a; 1976b;
and 1979
Test Dose 1.8 0.027 0.000014 0.078
(LOAEL) (LOAEL) (NOAEL)* (LOAEL)
Uncertainty Factors 9 (3) 3 (3) 10 (1) 6 (2)
Fish Tissue NOAEC 2.0 0.089 0.000014 0.13
Fish Tissue LOAEC 3.0 0.27 0.00014 0.26
*LOAEL = 0.00014 mg/kg/d
6Colonial Nesting Birds:
Productivity-
According to a review by Fox and Bowerman (2005), a herring gull population is stable if there
are 0.8-1.0 young/nest, whereas, a common tern population is stable if there are 1.1 young/pair.
Egg Concentration-
Benchmarks in eggs for PCBs, p,p’-DDE, TEQs, and mercury derived from North American field
studies conducted on colonial nesting birds are provided in Table 5. The following observations
were considered noteworthy:
• The NOAEC of 0.22 µg/kg TEQs found by Elliott et al. (2001) in great blue herons
exposed to contaminants from a pulp mill is much higher than the range of
concentrations (>0.005 to 0.020 µg/kg) found to adversely affect wood ducks exposed to
contaminants from a chemical plant (White and Seginak,1994). This disparity could be
due to differences in sensitivity between the two species, exposure to different dioxin
congeners, or exposure to different chemicals (Elliott et al., 2001). The NOAEL of
4.6 µg/kg 2,3,7,8-TCDD found in a wood duck egg injection study (Augspurger et al.,
2008) suggests that wood ducks are not as sensitive to TEQs as great blue herons. The
wood duck data are not included in Table 5 because there are sufficient data available to
determine effect levels for colonial nesting birds.
• Only p,p’-DDE concentrations expected to cause 20% eggshell thinning were included in
the table since this is the amount of thinning expected to cause adverse effects on
populations of colonial nesting birds (Pearce et al., 1979).
• It was not possible to derive effect levels for contaminants in herring gull eggs because
few studies have identified adverse effects on herring gull populations (Weseloh et al.,
1990 and 1994; Ewins et al., 1992). Decreased hatching success was found in herring
gulls from Lake Ontario during the mid-1970s due most likely to very high PCB
concentrations of 142 mg/kg in eggs (Gilman et al., 1977; Peakall and Fox, 1987). This
value was not added to Table 5 because it was an outlier relative to other values in the
table.
• A review of the results of laboratory and field studies on birds conducted by Stratus
Consulting, Inc. (1999) concluded that the toxicity thresholds for reproductive
malfunctions, embryo mortality, and embryo deformities in the eggs of sensitive bird
species ranged from 5 to 10 mg/kg for PCBs and 0.2 to 10 µg/kg for TEQs.
7Table 5. Egg NOAECs and Effect Levels for PCBs, p,p’-DDE, TEQs, and mercury for various
species of colonial nesting birds.
Species NOAEC Effect Level Reference
Herring gull 2-16 mg/kg Mercury Not available Vermeer et al., 1973
Common tern 1.0 mg/kg Mercury 3.65 mg/kg Mercury Fimreite, 1974
(10% fledging success)
Common tern 4.7 mg/kg PCBs 7.6 mg/kg PCBs Hoffman et al., 1993
(60% hatching success)
Forster’s tern 4.5 mg/kg PCBs 22.2 mg/kg PCBs Kubiak et al., 1989
(37% hatching success)
Caspian tern Not available 4.2 mg/kg PCBs Yamashita et al., 1993
(egg lethality and
deformities)
Double-crested 3.6 mg/kg PCBs 7.3 mg/kg PCBs Yamashita et al., 1993
cormorant (2% deformities) (6-7% deformities)
Forster’s tern 0.22 µg/kg TEQs 2.18 µg/kg TEQs Kubiak et al., 1989
(hatching success)
Double-crested 0.35 µg/kg TEQs 1.20 µg/kg TEQs Yamashita et al., 1993
cormorant (2% deformities) (6-7% deformities)
Great blue heron 0.22 µg/kg TEQs 0.36 µg/kg TEQs Elliott et al., 2001
(embryotoxicity)
Double-crested Not available 10 mg/kg p,p’-DDE Pearce et al., 1979
cormorant (20% eggshell thinning)
Great blue heron Not available 19 mg/kg p,p’-DDE Blus, 1996
(20% eggshell thinning)
Fish Tissue Concentration-
Two approaches were used to determine the fish tissue concentrations of contaminants that
could potentially cause adverse effects on colonial nesting birds. The first approach used BMFs
to relate the contaminant concentration in eggs of colonial nesting birds shown to cause
adverse effects to a contaminant concentration in fish. The second approach used toxicity
studies in surrogate bird species to estimate the concentration of contaminants in fish that might
adversely impact herring gull populations.
BMF Approach
The BMFs for PCBs, p,p’-DDE, and 2,3,7,8-TCDD were developed using the concentrations of
contaminants measured in herring gull eggs from a colony in eastern Lake Ontario and alewives
collected from three sites in western Lake Ontario (Braune and Norstrom, 1989). Another
approach was needed to determine the BMF for mercury since the study by Braune and
Norstrom (1989) did not analyze for this substance. The following steps were used to generate
a BMF for mercury:
• Vermeer et al. (1973) measured the concentration of mercury in perch (2.7 mg/kg) and
merganser breast muscle (6.79 mg/kg) from Clay Lake, Ontario.
8• The merganser breast muscle mercury concentration was multiplied by 7.13 to convert it
to a liver concentration of 48.41 mg/kg using the relationship established by Fimreite
(1974).
• Fimreite (1974) determined that common terns from Wabigoon Lake, Ontario, had
9.08 times more mercury in their livers than in their eggs. Dividing the estimated liver
concentration of 48.41 mg/kg by 9.08 results in an estimated egg concentration of
5.33 mg/kg.
• The estimated BMF for common mergansers is therefore 2.0 (5.33 mg/kg divided by
2.7 mg/kg).
The following equation was used to derive the fish tissue levels provided in Table 6:
Fish Tissue Level = NOAEC or LOAEC in bird egg/BMF
Table 6. Dietary NOAECs and LOAECs (mg/kg) for PCBs, p,p’-DDE, TEQs, and mercury.
PCBs p,p’-DDE TEQs Mercury
NOAEC (mg/kg egg) 3.6 Not available 0.00022 1.0
(cormorant) (heron) (tern)
LOAEC (mg/kg egg) 7.3 10 0.00036 3.65
(cormorant) (cormorant) (heron) (tern)
BMF 32 34 21* 2.0
(gull) (gull) (gull) (merganser)
Fish Tissue NOAEC 0.11 Not available 0.000010 0.5
Fish Tissue LOAEC 0.23 0.29 0.000017 1.8
*This is the BMF for 2,3,7,8-TCDD. Using this value results in a conservative value for TEQs since the BMF reported
for other dioxin congeners ranged from 4.5 to 9.7 (Braune and Norstrom, 1989).
Surrogate Species Approach
The second approach uses toxicity studies in surrogate bird species to determine dietary
concentrations that would either be protective or that could potentially cause adverse effects on
colonial nesting bird populations. The fish tissue level was derived using the body weight and
fish consumption rate of herring gulls since this species was the only one of the three avian
species used in the Great Lakes Initiative that was a colonial nesting bird.
The following equation was used to derive the fish tissue levels provided in Table 7:
Fish Tissue Level = [(TD/UF) x body weight]/fish consumption
Fish Tissue Level = [(TD/UF) x 1.1 kg]/0.24 kg/d
9Table 7. Surrogate species, key study, test dose (mg/kg/d), total uncertainty factor (uncertainty
factor for LOAEL-to-NOAEL extrapolation in parentheses) and the resulting fish tissue levels
(mg/kg) estimated to be protective (NOAEC) or cause adverse effects (LOAEC) in herring gull
populations.
PCBs DDT 2,3,7,8-TCDD Mercury Mercury
Surrogate Pheasant Pelican Pheasant Mallard Loon
Species
Key Study Dahlgren et Anderson et al., Nosek et al., 1992 Heinz et al., Evers, 2004
al., 1972 1975; 1977 1974; 1975;
1976a; 1976b;
and 1979
Test Dose 1.8 0.027 0.000014 0.078 Not
(LOAEL) (LOAEL) (NOAEL)* (LOAEL) available
Uncertainty 9 (3) 3 (3) 10 (1) 6 (2) Not
Factors available
Fish Tissue 0.92 0.041 0.0000064 0.06 0.05
NOAEC
Fish Tissue 1.4 0.12 0.000064 0.12 0.15
LOAEC
*LOAEL = 0.00014 mg/kg
Since many recent studies have shown that loons are very sensitive to the effects of mercury, it
was considered reasonable to determine a fish tissue benchmark based on these new data.
Since loons have been shown to be highly sensitive to the effects of mercury, this fish tissue
level would be expected to be protective of colonial nesting birds.
A field study by Barr (1986) found adverse effects (fewer nests, clutches of one egg instead of
two, and no progeny) on loons that consumed fish with mercury concentrations ranging from
0.3 to 0.4 mg/kg, whereas, Burgess and Meyer (2008) determined that loon productivity
dropped 50% when fish mercury levels were 0.21 mg/kg and failed completely when fish
mercury concentrations were 0.41 mg/kg. Based on field data, Evers et al. (2004) considered a
fish tissue concentration of 0.15 mg/kg mercury to be a LOAEC and a concentration of
0.05 mg/kg to be a NOAEC.
In laboratory studies by Kenow et al. (2003, 2007a, 2007b), juvenile loons were fed diets
containing 0.08, 0.4, and 1.2 mg/kg mercury for 105 days. No overt toxicity or reduction in
growth was found in any treatment group. However, decreased immune function and
demyelinization of central nervous system tissue occurred in loons consuming the 0.4 mg/kg
dietary concentration. No effects were observed in loons consuming dietary concentrations of
0.08 mg/kg. Since Kenow et al. (2008) found that blood mercury levels were still increasing at
the end of their study, the dietary concentration of 0.08 mg/kg food is considered a dietary
NOAEC for a less than lifetime exposure.
The dietary NOAEC of 0.05 mg/kg and LOAEC of 0.15 mg/kg for mercury determined by Evers
(2004) were the most appropriate fish tissue level benchmarks for loons. If this NOAEC was
used to determine a dietary concentration protective of colonial nesting birds, there would be no
need to apply uncertainty factors to the assessment since the study was long-term in duration
and loons are considered highly sensitive to the effects of mercury. These values are
consistent with the fish tissue NOAEC of 0.06 mg/kg and LOAEC of 0.12 mg/kg determined
using a TD for mallards. The use of these values is also more defensible because they are
based on field data, which is a more realistic exposure scenario.
10Mink:
The sensitivity of mink to various contaminants, its high trophic status, its ability to accumulate
contaminants, and its relatively small home range make it a good indicator species of
environmental health (Basu et al., 2007). Many toxicity studies have examined the reproductive
effects of feeding mink fish collected from sites contaminated with PCBs, dioxins, and/or furans.
For example, mink have been fed fish from Housatonic River, Massachusetts (Bursian et al.,
2006a and 2006b), Saginaw River, Michigan (Bursian et al., 2006c), Saginaw Bay, Michigan
(Heaton et al., 1995; Restum et al., 1998), Poplar Creek/Clinch River, Tennessee (Halbrook
et al., 1999), and Hudson River, New York (Bursian et al., 2012). The few studies that
examined the toxicity of mercury and p,p’-DDE on mink are based on laboratory studies. The
results of these studies are provided in Tables 8 and 9.
A recent review (Blankenship et al., 2008) of the more than 30 studies that examined the effects
of dioxin-like compounds on mink concluded that Bursian et al. (2006a; 2006b; and 2006c) and
Zwiernik et al. (2009) were the best studies available for the derivation of liver and dietary TRVs
for TEQs. The review recommended that the studies that exposed mink to fish from
Saginaw Bay (Heaton et al., 1995; Restum et al., 1998) should not be used because of
“confounding impacts of other co-contaminants.” For this project, the Heaton et al. (1995) and
Restum et al. (1998) studies will be included in the assessment since they examined the
reproductive effects of mink that were fed fish collected from one of the areas of focus of this
project, they provided a lower bound for reproductive effects in mink, and one of the studies
examined the toxicity of PCBs to mink over multiple generations. The study conducted by
Zwiernik et al. (2009) was not used because it only exposed mink to
2,3,7,8-tetrachlorodibenzofuran and our assessment was focused on studies that exposed mink
to PCBs and TEQs in fish. All of the studies that exposed mink to fish collected from
contaminated sites should be used with caution since the fish will contain contaminants other
than just dioxin-like compounds that could influence the results of the toxicity studies.
Liver Concentration-
Table 8. Liver NOAECs and LOAECs for PCBs, TEQs, and Mercury in mink.
Liver concentration NOAEC LOAEC Reference
3.1 mg/kg PCBs 3.1 mg/kg PCBs Bursian et al., 2006b
4.4 mg/kg PCBs 11 mg/kg PCBs Bursian et al., 2006c
6.0 mg/kg PCBs 7.3 mg/kg PCBs Halbrook et al., 1999
Not available 0.50 mg/kg PCBs Heaton et al., 1995
0.056 µg/kg TEQs 0.22 µg/kg TEQs Bursian et al., 2006b
0.073 µg/kg TEQs 0.15 µg/kg TEQs Bursian et al., 2006c
28 mg/kg Mercury (n=3) 97 mg/kg (n=1) Dansereau et al., 1999
Fish Tissue Concentration-
Sufficient toxicity studies on mink were available to derive dietary NOAECs and LOAECs for
PCBs, TEQs, and mercury (Table 9). The use of a surrogate species was used to derive a fish
tissue level for DDT because no suitable mink studies were available. The limitations of the
mink studies conducted by Gilbert (1969) and Aulerich and Ringer (1970) are provided in
USEPA (1995), and the study by Duby et al. (1971) was not used because it was an injection
11study and only examined the effects of DDT on uterine weights of immature mink. The studies
by Bursian et al. (2006a; 2006c) were particularly suited for the derivation of fish tissue levels for
PCBs and TEQs because mink were exposed to fish (carp and/or goldfish) collected from the
environment.
Table 9. Dietary NOAECs and LOAECs for PCBs, TEQs, DDT, and Mercury in mink.
Fish tissue level NOAEC LOAEC Reference
1.6 mg/kg PCBs 3.7 mg/kg PCBs Bursian et al., 2006a
(kit survival at six weeks)
0.83 mg/kg PCBs 1.1 mg/kg PCBs Bursian et al., 2006c
(jaw lesions)
0.72 mg/kg PCBs 1.5 mg/kg PCBs Bursian et al., 2012
(kit weight at six weeks) (unpublished)
Not available 0.25 mg/kg PCBs Restum et al., 1998
(whelping rate)
Not available 0.72 mg/kg PCBs Heaton et al., 1995
(kit survival and weight at
three and six weeks)
0.016 µg/kg TEQs 0.069 µg/kg TEQs Bursian et al., 2006a
(kit survival at six weeks)
0.028 µg/kg TEQs 0.047 µg/kg TEQs Bursian et al., 2006c
(jaw lesions)
0.0054 µg/kg TEQs 0.010 µg/kg TEQs Bursian et al., 2012
(kit weight at six weeks) (unpublished)
Not available 0.019 µg/kg TEQs Heaton et al., 1995
(kit survival and weight at
three and six weeks)
0.40 mg/kg DDT* 2.0 mg/kg DDT* Fitzhugh, 1948
(survival)
Not Available 1.1 mg/kg Mercury Wobeser et al., 1976
(nervous system lesions)
Not Available 1.0 mg/kg Mercury Wren et al., 1987
(kit growth)
0.5 mg/kg Mercury 1.0 mg/kg Mercury Dansereau et al., 1999
(survival)
*Value based on a two-year study in rats. The dose was modified using the mink fish consumption rate, mink body
weight, and an uncertainty factor of 10x to extrapolate from rats to mink.
Since mink and otters are closely related, the same dietary concentrations determined to cause
adverse effects on mink were used for otters. The default body weights and fish consumption
rates for mink and otters provided in the USEPA (1995) suggest that the dose received by mink
and otters exposed to a dietary concentration of 1.1 mg/kg of mercury would be similar
(0.20 mg/kg body weight/d for mink compared to 0.16 mg/kg body weight/d for otters). The use
of otters has some advantages over the use of mink because otters tend to consume larger fish
than mink and a greater percentage of their diets consist of fish so they would be expected to
have a higher exposure to bioaccumulative compounds.
12SIGNIFICANCE OF FISH CONTAMINANT LEVELS
Fish TRV Summaries:
The concentrations of contaminants in fish estimated to cause adverse effects in bald eagles,
colonial nesting birds, and mink/otter are provided in Table 10. The values considered to be the
most scientifically defensible are highlighted in bold print. Based on a review of all of these
values, a range of effect levels is provided in the last column of Table 10 as a screening tool.
However, it should be kept in mind that a TRV can be species-specific and should be applied to
sizes and species of fish that a particular wildlife species would consume. Since the recovery
goal for a healthy bald eagle population is 1.0 young/occupied nest, it can be argued that any
fish tissue concentration resulting in a lower productivity would be considered adverse. The
lowest end of the range of TRVs for PCBs and p,p’-DDE in bald eagles is therefore set as
greater than the fish tissue concentration associated with a productivity of 1.0 young/occupied
nest.
Table 10. Ranges of fish tissue concentrations (mg/kg) estimated to cause adverse effects in
bald eagle, colonial nesting bird, and mink/otter populations (the most defensible values are
shown in bold print).
Bald Eagles Colonial Nesting Birds Mink/Otter TRV
PCBs > 0.14-0.93 0.23-1.4 0.25-1.1 > 0.14-1.1
TEQs 0.000011-0.00014 0.000017-0.000064 0.000010-0.00024 0.000010
p,p’-DDE > 0.16-0.30 0.12*-0.29 2.0 > 0.16-0.30
Mercury 0.26-2.0 0.15-1.8 1.0-1.1 0.15-1.0
*This value was based on the results of a study that exposed pelicans to anchovies contaminated with DDT (69%
DDE).
The concentrations provided in Table 10 are the concentrations of contaminants in fish
estimated to adversely impact wildlife. A more conservative approach would be to develop fish
tissue concentrations based on NOAELs instead of LOAELs. This approach was not used for
this project because the delisting methodology (MDEQ, 2006) requires the use of effect levels.
Fish tissue NOAECs for the contaminants provided in Table 10 can be found in tables provided
in previous sections of this report. The effects of a contaminant at concentrations between the
NOAEC and LOAEC cannot be determined with certainty.
Justifications:
PCBs-
The fish tissue concentrations of > 0.14 and 0.93 mg/kg PCBs estimated to result in a healthy
and stable bald eagle population, respectively, are defensible because they are based on
comparisons of contaminant data in bald eagle eggs to productivity measures. In addition, the
BMF used to extrapolate from egg concentrations to fish concentrations is based on bald eagle
field data. The value of 0.93 mg/kg PCBs is based on more recent data so may be less
influenced by other contaminants such as p,p’-DDE than the value associated with a
productivity of 1.0 young/occupied nest. With respect to colonial nesting birds, the cormorant
toxicity data used to generate the fish tissue concentration is defensible. However, the BMF
used to extrapolate from the egg concentration in cormorants to a fish tissue concentration is
based on a relationship found for herring gull eggs and alewife so the resulting value is not
considered as defensible as the bald eagle data. The quality of the mink data was considered
high because mink were fed contaminated fish under controlled conditions so the dose was
13accurately measured and potential adverse effects were assessed. The upper end of the range
used for the fish tissue TRV is 1.1 mg/kg which is the effect level found in more recent studies
on mink. Even though the study by Restum et al. (1998) found effects at lower concentrations
than many of the other mink studies, it was not set as the upper end of the TRV range because
it may have been more affected by co-contaminants than more recent studies. However, since
it was a well conducted multi-generation study it is scientifically defensible and is included within
the TRV range.
TEQs-
The fish tissue concentrations estimated to cause adverse effects on mink populations are the
most defensible because they were derived using laboratory studies that fed mink contaminated
fish under controlled conditions so the dose was accurately measured and potential adverse
effects were assessed. The fish tissue concentration estimated to be protective of bald eagles
using the BMF approach is a conservative value because it is based on enzyme induction (not
reproduction or development) and it relied solely on a BMF for 2,3,7,8-TCDD (many of the
dioxin congeners would be expected to have lower BMFs than 2,3,7,8-TCDD). Since the BMF
used in the calculation of a fish tissue level protective of colonial nesting birds was also based
solely on 2,3,7,8-TCDD, the resulting value was considered conservative. Since the lowest
dietary concentration of 0.010 µg/kg found to cause adverse effects in mink is at the low end of
the range of fish tissue values found to be protective of bald eagles and colonial nesting birds, it
will be considered the final TRV.
p,p’-DDE-
The fish tissue concentrations of > 0.16 and 3.0 mg/kg p,p’-DDE estimated to result in a healthy
and stable bald eagle population, respectively, are defensible because they are based on
comparisons of contaminant data in bald eagle eggs to productivity measures. Limited data
suggest that bald eagles and colonial nesting birds are more sensitive to the effects of p,p’-DDE
than mink. Since the fish tissue level estimated to adversely impact mink was based on rat
data, it was not used to derive the final TRV.
Mercury-
Bald eagles appear to be less sensitive to the effects of mercury than other birds studied such
as pheasants and mallards. Since the fish tissue levels estimated to impact bald eagles were
based on either American kestrels (BMF approach) or mallard (surrogate species approach)
data, the results are considered conservative. Since less uncertainty is associated with the loon
data, it was considered appropriate to use the value of 0.15 mg/kg as the low end of the effect
range. The range of mink values are considered very defensible because the studies exposed
mink in a laboratory setting to diets contaminated with mercury. Since the sensitivity of colonial
nesting birds to the effects of mercury relative to loons is unknown and the value based on the
loon data is significantly lower than the value based on the mink data, it was considered
reasonable to present the final fish tissue TRV as a range of 0.15 to 1.0 mg/kg.
Data Used to Compare to Dietary TRVs:
There are many uncertainties associated with the use of fish tissue contaminant concentrations
to assess whether there are reproductive or developmental impacts on wildlife living in an AOC.
For example, the fish collected for contaminant analysis contain mixtures of chemicals that may
differ from the exposure scenario used to derive the fish TRVs. Also, a significant proportion of
14the diets of mink and bald eagles may consist of things other than fish. In addition, the amount
of a chemical ingested by wildlife via the consumption of fish depends on the size, species, and
amount of each species of fish consumed. This information is not available for many species of
wildlife and can vary depending on location. Even if specific information existed on the amount
and size of each species of fish consumed, there are only limited fish contaminant data
available.
The size and species of fish consumed by bald eagles, common terns, mink, and otter were
evaluated below to help determine how to best use the available fish contaminant data provided
later in this assessment. The diets of common terns were examined to assess the fish
consumed by colonial nesting birds because terns appear to be more sensitive to the effects of
contaminants than herring gulls. The diets of mink and otters were assessed because they
have been shown to be sensitive to the effects of environmental contaminants. Otters may also
have a greater potential than mink to be exposed to higher contaminant levels since they tend to
eat larger fish and a greater percentage of their diets consist of fish.
Bald Eagles-
The food remains were examined at bald eagle nest and perch trees near the Wisconsin
shoreline of Lake Superior (Kozie and Anderson, 1991). Suckers (55%), burbot (27%), and
whitefish (8.0%) were the most frequently observed fish remains. The average length of fish
estimated from bones found at the nests was 14 inches. Prey delivery was examined at six bald
eagle nests along the Au Sable and Manistee Rivers in Michigan (Bowerman, 1993). Suckers
(47%), bullhead (3.9%), bass (14%), northern pike (3.9%), and bowfin (2.9%) were the most
frequently observed fish brought to the nests. Most of the fish were between 6.0 and 18 inches
in length. Prey delivery was also monitored at seven bald eagle nests along Green Bay
(Dykstra et al., 2001). Suckers (28%), northern pike (17%), yellow perch/walleye (16%), bass
(11%), bullheads (9%), and carp (8%) were the most frequently observed fish brought to the
nests.
Common Terns-
The diet of common terns at Lake Ontario, Niagara River, and Lake Erie colonies were
evaluated by direct observation of the delivery of fish to nests and by examining fish remains at
the nest (Courtney and Blokpoel, 1980). At the Lake Ontario colony, alewives were the most
frequent species of fish consumed followed by smelt and then emerald shiners. At the
Niagara River colony, smelt was the principal species of fish consumed. Emerald and
common shiners were next in importance during the late May period, but were replaced by
bluntnose minnows and spottail shiners later in the season. At the Lake Erie colony, smelt and
emerald shiners were the principal species of fish consumed during the early season, whereas,
smelt was the principal fish species consumed later in the season. Trout perch and emerald
shiners were also occasional food items at this colony. Alewives were the primary species of
fish consumed by common terns at a southern Lake Michigan colony, followed by spottail
shiners (Ward et al., 2010). Based on an isotope analysis, nest observation, and foraging
behavior, gobies were determined to not be a significant component of a common tern’s diet
(Ward et al., 2010). Common terns typically feed on fish that are 2.4 to 5.9 inches in length
(Cuthbert et al., 2003).
15Mink and Otter-
An examination was made of the stomach contents of 41 mink collected along the North Branch
of the Au Sable River and along Hunt Creek Area streams in Michigan (Alexander, 1977). The
stomach contents of mink collected along the Au Sable River contained brook trout (n=5),
sculpin (n=3), darters (n=3), blacknose dace (n=2), creek chub (n=2), brown trout (n=1), and
suckers (n=1), whereas, the stomach contents of mink collected along Hunt Creek Area streams
contained brook trout (n=10), creek chub (n=3), sculpin (n=1), and redbelly dace (n=1). The
mink consumed fish ranging in size from 1 to 7 inches (the highest numbers of fish were
collected in the 4-inch size range).
The stomach contents of otters from the study sites mentioned above were also examined
(Alexander, 1977). He found that the otter stomachs contained brook trout (n=3), brown trout
(n=1), rainbow trout (n=1), blacknose dace (n=16), creek chub (n=7), common shiners (n=2),
suckers (n=7), and darters (n=5). Based on a limited dataset, it was determined that otters
consume fish that are 3 to 11 inches in length (Alexander, 1977). Studies suggest that otters
tend to feed on slow moving fish like suckers, carp, chubs, dace, shiners, squawfish, bullhead,
and catfish because they are easier to catch (Toweill and Tabor, 1982). Otters consume fish
ranging in size from 1 to 20 inches (Melquist and Dronkert, 1987). A study of the feeding
behavior of captive otters determined that otters normally catch fish ranging in length from 6 to
7 inches because they are the easiest to catch (Erlinge, 1968).
16MONITORING DATA SUMMARY
Bald eagles:
The bald eagle monitoring program in Michigan includes measurements of concentrations of
PCBs and p,p’-DDE in eaglet plasma in five of six AOCs with a Wildlife BUI as well as for other
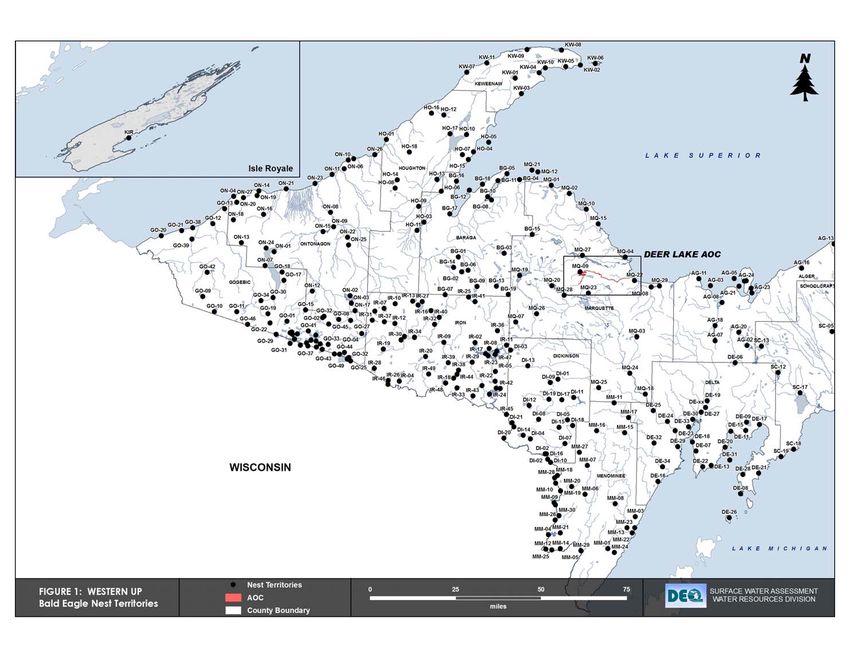
Great Lakes and inland territories that may be used as references (Table 11). Figures 1 and 2
provide a comparison of the ranges of PCBs and p,p’-DDE concentrations, respectively,
measured in each of the regions presented in Table 11. Data for more specific comparison
populations will be provided in the write-ups for the individual AOC assessments. The
concentrations of PCBs and p,p’-DDE in the plasma can be compared directly to benchmarks
associated with stable and healthy bald eagle populations. Bald eagle productivity in Michigan
has been monitored regularly since 1961. Maps of the state showing active and inactive bald
eagle breeding territories are presented in Appendix A.
Table 11. Median bald eagle plasma PCB and p,p’-DDE concentrations (µg/kg) for AOCs and
comparison populations. All medians except for the River Raisin are based on data
collected from 2004 through 2008; River Raisin data were collected in 1999 and 2001.
Median Concentration (μg/kg)
N* PCBs p,p’-DDE
Lake Erie
St. Clair River AOC 0 No data
Detroit River AOC 2 7.9400
300
PCB ug/Kg
200
100
0
ie on an r ed LP
C C
Er
C C io UP
r AO AO e r AO r AO Hur hig
p er bin nd nd
ive sin La
k ve ve e ic
Su m la la
ai Ri Ri ak M Co In In
ti R R y/ s L ke ke
es ra
ll ll
tr o
r
Ba
y La La ra
e iv e ar Lak ve ve
D R w M O O
na St at
a gi G re
S
Figure 1. Boxplots of PCB concentrations measured in serum samples taken from nestling bald
eagles. River Raisin samples were collected between 1999 and 2001, all other
samples were collected between 2004 and 2008.
90
80
70
p,p' DDE (ug/Kg)
60
50
40
30
20
10
0
on an r ed LP
C C
Er
ie C C io UP
r AO AO e r AO r AO Hur hig
p er bin nd nd
ive sin La
k ve ve e ic
Su m
In
la la
ai Ri Ri ak M Co In
ti R R y/
ys
L ke ke
es ra
ll ll
tr o
r
Ba La La ra
e i ve ar Lak ve ve
D R w M O O
na St at
a gi G re
S
Figure 2. Boxplots of p,p’-DDE concentrations measured in serum samples taken from nestling
bald eagles. River Raisin samples were collected between 1999 and 2001, all other
samples were collected between 2004 and 2008.
18Herring gulls:
In the past, the MDEQ monitored bioaccumulative compounds in herring gull eggs from ten
colonies in Michigan waters. The MDEQ study, which currently monitors five colonies annually,
complements similar work being conducted by the Canadian Wildlife Service across much of the
Great Lakes. A map showing locations of colonies monitored by Michigan and Canada is
presented in Appendix B. Table 12 presents a summary of contaminant concentrations
measured in herring gull eggs from 2002 through 2006 as part of the Michigan study.
Table 12. Median concentrations of PCBs, p,p’-DDE, and TEQs in composite samples of
herring gull eggs collected from colonies in Michigan from 2002 to 2006.
Median Concentration
PCB p,p’- DDE TEQ
N†
(mg/kg) (mg/kg) (ng/kg)
Lake Michigan
Grand Traverse Bay (Bellows I.) 5 3.1 2.2 739
Straits of Mackinac (Green I.) 5 3.0 1.6 228
Lake Huron
Thunder Bay (Scarecrow I.) 5 4.1 1.5 183
Saginaw Bay/River AOC* (L. Charity I.) 3 6.0 1.3 739
St. Marys River AOC* (5-Mile I. and W. Twin Pipe I.) 9 3.1 1.0 222
Lake Superior
Whitefish Bay (Tahquamenon I.) 4 3.3 1.5 185
Huron National Wildlife Refuge (Huron I.) 2 3.0 1.5 397
Isle Royale (Net I.) 4 3.6 1.9 217
Lake Erie
River Raisin AOC* (Detroit Edison) 5 10.8 1.1 686
All non-AOC Sites Combined 25 3.4 1.6 210
†
- Number of composite samples analyzed over the five-year period; a composite consisted of
1 egg from each of 13 separate nests from each colony
*- AOC with Wildlife BUI
Monitoring data are available for herring gulls, but only limited data are available for other
colonial nesting birds that are more sensitive to the effects of various contaminants. Since
effect levels are not available for PCBs, p,p’-DDE, and TEQ in herring gull eggs (Table 5), a
method was needed to estimate concentrations of contaminants in the eggs of terns,
cormorants, and herons nesting in the same general area as herring gulls. A cursory review of
the literature was undertaken to find studies that compared the concentrations of contaminants
in herring gull eggs to concentrations measured in the eggs of other birds nesting in the same
general area. The results of this assessment showed that the concentration of contaminants in
herring gull eggs is often higher than the concentration of contaminants in other colonial nesting
19You can also read