The geometry of clinical labs and wellness states from deeply phenotyped humans
←
→
Page content transcription
If your browser does not render page correctly, please read the page content below
ARTICLE
                  https://doi.org/10.1038/s41467-021-23849-8                 OPEN

                  The geometry of clinical labs and wellness states
                  from deeply phenotyped humans
                  Anat Zimmer1, Yael Korem2, Noa Rappaport1, Tomasz Wilmanski1, Priyanka Baloni 1, Kathleen Jade 1,
                  Max Robinson1, Andrew T. Magis 1, Jennifer Lovejoy1, Sean M. Gibbons1, Leroy Hood1,3 ✉ & Nathan D. Price1 ✉
1234567890():,;

                  Longitudinal multi-omics measurements are highly valuable in studying heterogeneity in
                  health and disease phenotypes. For thousands of people, we have collected longitudinal
                  multi-omics data. To analyze, interpret and visualize this extremely high-dimensional data,
                  we use the Pareto Task Inference (ParTI) method. We find that the clinical labs data fall
                  within a tetrahedron. We then use all other data types to characterize the four archetypes.
                  We find that the tetrahedron comprises three wellness states, defining a wellness triangular
                  plane, and one aberrant health state that captures aspects of commonality in movement
                  away from wellness. We reveal the tradeoffs that shape the data and their hierarchy, and use
                  longitudinal data to observe individual trajectories. We then demonstrate how the movement
                  on the tetrahedron can be used for detecting unexpected trajectories, which might indicate
                  transitions from health to disease and reveal abnormal conditions, even when all individual
                  blood measurements are in the norm.

                  1 Institute for Systems Biology, Seattle, WA, USA. 2 Weizmann Institute, Rehovot, Israel. 3 Providence St Joseph Health, Seattle, WA, USA.
                  ✉email: lhood@isbscience.org; nathan.price@isbscience.org

                  NATURE COMMUNICATIONS | (2021)12:3578 | https://doi.org/10.1038/s41467-021-23849-8 | www.nature.com/naturecommunications                     1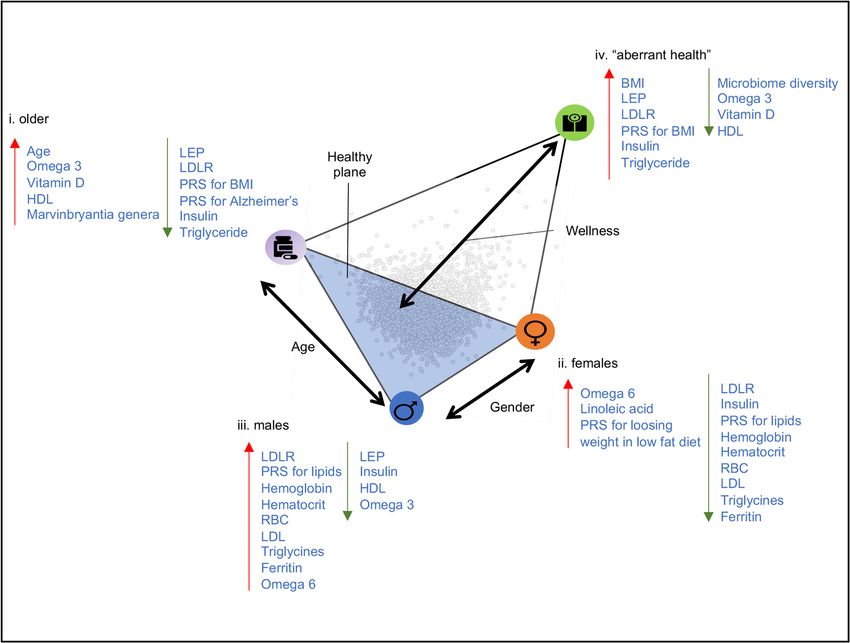
ARTICLE                                                                 NATURE COMMUNICATIONS | https://doi.org/10.1038/s41467-021-23849-8

T
       o make substantial progress in studying human wellness,               Clinical labs fall on a significant and robust tetrahedron. Fol-
       there is a need for systematic and holistic approaches that           lowing data cleaning and normalization (see Methods) we retained
       generate and interpret longitudinal health data1–5. Emer-             67 clinical lab analytes (Supplementary Dataset 1), and 3094 indi-
ging technologies allow for thousands of low-cost measurements               viduals. 42% of the individuals were male and 58% were female
from individual participants over time6–9. Through a partnership             (Supplementary Fig. 1). Age was normally distributed for both
with Arivale (a now-closed spin-off company from our lab) we                 males and females (Supplementary Fig. 2), with a mean age of 48.4
generated such a longitudinal, multi-omics dataset, spanning e.g.            (±12.5) for men and 48.8 (±12.2) for women. We then applied the
genomics, proteomics, metabolomics and microbiome                            ParTI analysis and found that the clinical labs dataset falls within a
quantification10–13. Integrating divergent data types into system-            significant tetrahedron (P-value < 0.001, Figs. 1, 2). We applied the
scale analyses represents a major challenge12,14–16. Commonly                method with a different number of archetypes (n = 2.3), however,
used methods for analyzing high-dimensional data include cor-                we did not get a significant P-value (P-value = 0.51, 0.502 respec-
relation networks, univariate statistical tests with multiple-               tively). For 5 archetypes we received a P-value = 0.001, which was
hypothesis correction, and multivariate machine learning                     not significant after correcting for multiple hypothesis testing. We
models8,9,12–14,17. These common approaches have successfully                applied the analysis with various types of data sampling repeatedly
been used across various studies. Another approach involves                  resulting in significant P-values, showing that the tetrahedron is
different types of grouping such as clustering and t-SNE18–22, and           robust to data selection (see Methods, and Fig. 2).
a framework called Multi‐Omics Factor Analysis (MOFA) was
suggested to integrate multi-omics data23,24. The approach we
                                                                             Characterizing the four archetypes using enrichment analysis
take herein for dimensionality reduction and analyzing broad
                                                                             with all other data types. The clinical lab matrix was used to
features of the high-dimensional data is Pareto Task Inference
                                                                             construct the tetrahedron, and we used all other data-sets (20
(ParTI)25. This approach is based on an evolutionary theory and
                                                                             matrices, 12,848 variables) to characterize the archetypes and
its main concept is that if data points of a high-dimensional
                                                                             reveal biological trade-offs (Fig. 1). We applied the enrichment
dataset fall on a simple shape like a line, a triangle, a tetrahedron,
                                                                             analysis as described in Hart et al. (see Methods)25. In short, we
it is due to tradeoffs in the biological system, rather than by
                                                                             were looking for features that are maximized close to an arche-
chance25,26. This method also computes statistical significance for
                                                                             type and decay as they move away from the archetype to any
the resulting simplex25. If a significant simplex is found, the
                                                                             direction. We tested for enrichment of all the variables at each
vertices are denoted archetypes, that specialize in a certain task,
                                                                             archetype using all data-points in every test (see Methods, Fig. 1).
with tradeoffs among these tasks. Enrichment analysis of any
                                                                             We used the Bonferroni correction to correct for multiple
measurable feature can be used to characterize the archetypes and
                                                                             hypothesis testing. The full table of features and P-values can be
uncover the tradeoffs. The ParTI method has several advantages:
                                                                             found in Supplementary Dataset 2.
it allows the analysis of a dataset as a continuous space rather
than deterministic grouping, it does not require prior knowledge
for characterizing the archetypes and revealing the tradeoffs, and           Enrichment analysis of the self-reported assessments indicates
due to the geometric representation of the data - the visualization          four distinct health states. We first describe the discrete variables
of a high-dimensional dataset and the overlay of different data              (demographic, clinical information, and the self-reports), which
types is straightforward25–27. Multiple studies have successfully            are textual categories that are easy to interpret and provide a brief
used this method to analyze different types of high-dimensional              characterization of every archetype (Table 1). Archetype I was
data, such as tumor mRNA expression data28, and single-cell                  enriched for older ages (mean of 57 in the first bin close to the
data29,30. Here, we apply the ParTI method to analyze the high               archetype vs mean of 48 for the rest of the data), for having a
dimensional dataset of personalized data clouds obtained by                  partner and grandchildren (P-value = 2e−07, 6.9e−07, Table 1),
Arivale. We find that the clinical lab data-points fall on a sig-             but was not enriched for gender (Supplementary Dataset 5).
nificant tetrahedron. We then use all other data types to char-               According to the self-reports, Archetype I was enriched for taking
acterize the phenotypic features of the four archetypes and reveal           supplements, eating cruciferous vegetables daily, experiencing
the fundamental tradeoffs that define these states. We find that               satisfaction from life and being physically active (Table 1).
both the discrete (questionnaire data) and the continuous vari-              Archetype II was enriched for females (Supplementary Dataset 5),
ables (the four ‘omics’ data types) indicate three wellness states           vegetarian diet and an active life-style. Although this archetype
and one aberrant health state. We then show how longitudinal                 was enriched for happiness and satisfaction in general, it was also
data and the movement on the tetrahedron can be used for early               enriched for changes in mood, and experiencing stress (Table 1).
detection of transitions from health to disease state, and for               Archetype III was enriched for males (Supplementary Dataset 5),
identifying abnormal conditions.                                             for not eating fruits or breakfast, for consuming alcoholic drinks
                                                                             daily with a preference for beer, and for good physical and mental
                                                                             feeling. This archetype was also enriched for non-responders
Results                                                                      (individuals who did not respond to a particular question).
The Arivale cohort. Participants provided blood and stool sam-               Archetype IV was not enriched for gender (Supplementary
ples every six months, filled out questionnaires about their health           Dataset 5) or age, but was enriched for high BMI and high weight.
history and lifestyle habits, and used a Fitbit activity tracker.            It was enriched for not drinking alcoholic drinks, and for
From the blood samples, 124 clinical lab tests, 990 metabolites              drinking sugary drinks. Participants adjacent to this vertex were
and 256 proteins were measured (see Methods), and the DNA                    more likely to report aberrant health (diarrhea, reflux, etc.), high
was sequenced (whole genome sequencing for 2876 and SNPchip                  appetite and diabetic diet. They were not satisfied with their
for 1948). Based on these measurements and the participants                  appearance and their physical and mental condition (Table 1).
goals, health coaches guided the participants on how to change               From this analysis we conclude that the bottom triangle of the
their lifestyle to optimize their health. The program was available          tetrahedron comprises three “healthy” archetypes – I. the older
for 5 years and included nearly 5000 participants that had                   archetype II. the female-archetype, and III. the male-archetype.
between 1 to 8 timepoint10,11. Most participants in the Arivale              Archetype IV, at the far edge of the tetrahedron (mean Euclidean
wellness program consented for their deidentified data to be used             distance between archetypes I,II,III is 29.8 (±2.6), and the mean
for research purposes, which are analyzed herein.                            distance between the lower triangle to Archetype IV is 38.5

2                NATURE COMMUNICATIONS | (2021)12:3578 | https://doi.org/10.1038/s41467-021-23849-8 | www.nature.com/naturecommunications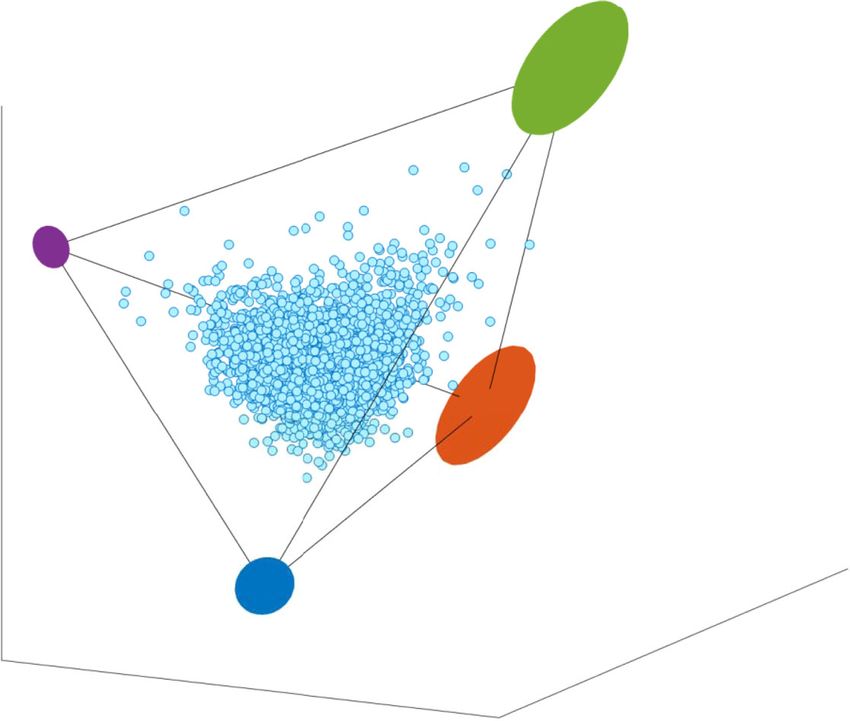
NATURE COMMUNICATIONS | https://doi.org/10.1038/s41467-021-23849-8                                                                         ARTICLE

                                   3,094 participants                    67 blood                          Minimal
                                                                         measurements                      polyhedron
                                                                         ALT
                                                                         AST
                                                                        Chol.
                                                                        WBC
                                                                        RBC
                                                                        HGB
                                                                        HCT
                                                                        MCV
                                                                        MCH
                                                                       MCHC

                                                  Use all other datatypes to characterize the archetypes

                                    Lifestyle,
                               Quantified Self                        Whole Genome
                            FITBIT, ASSESSMENTS                       Sequencing
                                                                      BLOOD

                            Proteomics
                                 BLOOD                                  Gut
                                                                        Microbiome
                                                                        STOOL

                                    Metabolomics
                                            BLOOD

Fig. 1 Pareto task inference of clinical labs—study overview. 67 blood measurements from 3094 individuals were used for the Pareto task inference
analysis to find the minimal significant polyhedron and the position of the archetypes (the vertices). After finding the polyhedron using the clinical labs, all
other data types (lifestyle self-administered questionnaires and Fitbit records, genomics, microbiome, metabolomics and proteomics) were used to find
enriched traits close to every archetype in order to characterize the archetypes and reveal the tradeoffs in the system.

                                                                                                      b.
                a.

                                                                                                      c.

Fig. 2 The clinical labs dataset falls on a significant tetrahedron (t-test P-value < 0.001). a The dataset is composed of n = 3094 participants and 67
blood measurements, displayed on the first 3 PCs space (light blue dots). The colored ellipses designate the archetypes’ possible positions with error after
1000 times of bootstrapping. b, c The tetrahedron is robust to data selection. The participants in the cohort have multiple visits (between 1–8). To test the
robustness of the tetrahedron, we randomly selected one visit per participant and constructed different data sets. Then, for every data selection we ran the
ParTI analysis and found that for different data selections we receive significant tetrahedrons (t-test P-value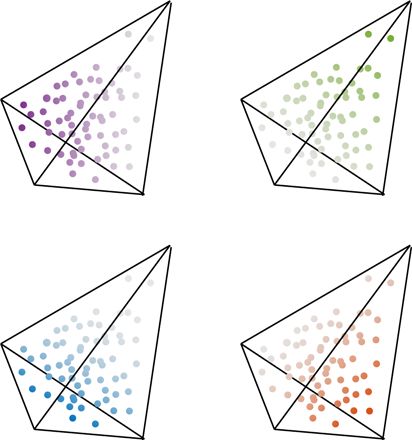
4
Table 1 Enrichment analysis of demographic features and self-reported questionnaires reveals the archetype characteristics.
Archetype 1 Archetype 2 Archetype 3 Archetype 4
Mean first Mean rest P-value Mean first Mean rest P-value Mean first Mean rest P-value Mean first Mean rest P-value
ARTICLE
Continuous Age 58 48 2.6E−19 40 49 8.9E−18 45 49 3.0E−05 49 49 8.3E−01
features BMI 25 28 4.4E−08 25 28 4.4E−10 28 27 5.9E−06 37 27 1.6E−56
Weight 164 180 3.6E−05 152 180 2.7E−19 202 178 1.5E−18 241 176 9.4E−49
Mean arterial blood 98 92 6.6E−11 86 92 9.1E−13 91 92 2.8E−01 102 91 3.0E−23
pressure
Systolic 125 125 8.0E−01 115 126 6.5E−16 130 125 3.2E−06 139 124 4.1E−26
Diastolic 74 76 3.0E−02 71 76 2.0E−08 81 75 8.3E−12 83 75 4.0E−17
Feature name P-value Feature name P-value Feature name P-value Feature name P-value
Discrete Gender — — sex: F 0.0E + 00 sex: M 0.0E + 00 — —
features
Familial status Live with: (2) Spouse/ 2.0E−07 Relationship status: 1.7E−04 — — — —
partner (1) Partnered
grandchildren: (2) Two 6.9E−07 — — — — — —
Diet cruciferous vegetables: 3.4E−04 Lifestyle diet: 1.1E−03 fruits: (0) Zero/less than 1 1.9E−07 diet: (7) Diabetic 8.3E−11
(0) Daily (1) Vegetarian per day
Alcohol alcohol days a week: 4.0E−05 — — alcohol type: (1) Beer 6.3E−07 alcohol days a week: 2.2E−05
consumption (4) Daily (0) I do not drink
alcohol type: (2) Wine 7.9E−03 — — alcohol drinks a day: 1.4E−04 alcohol type: (3) Liquor 1.1E−03
(2) 3-4 drinks
Medication medications: (no 1.5E−11 medications: (4) Not at all 2.7E-03 medications: (2) Several 1.9E−02 medications: (1) Daily 4.1E−07
response) times per week
Supplement uptake supplements: (1) Daily 4.2E−03 supplements: (3) Once 2.8E−03 supplements: 8.5E−03 supplements: (4) Not at all 3.6E−04
per week or less (4) Not at all
Activity moderate activity: (0) At 4.5E−05 moderate activity: (4) 3.9E−03 moderate activity 1.2E−02 vigorous activity: 7.6E−12
least 7 times per week Less than once per week duration: (2) 20 min (5) Rarely or never
vigorous activity duration: 3.5E−03 vigorous activity duration: 4.9E−02 vigorous activity: (2) At 4.8E−02 time seated: (0) Most of 7.5E−10
(2) 20 min (3) 30 min least 3 times a week the time (work + relaxing
12 hours)
Personality easily disturbed: 2.1E−03 stressed easily: 2.8E−04 life of party: (4) Agree 2.1E−04 easily disturbed: 2.6E−02
(4) Disagree (1) Strongly agree (1) Strongly agree
worry: (3) Neither 7.0E−03 feel others emotions: 4.3E−04 relaxed: (5) Strongly agree 1.0E−05 do chores: (1) Strongly 4.3E−05
disagree nor agree (5) Strongly agree disagree
do chores: (4) Agree 1.4E−03 — — — — forget toֿ put things in 3.9E−04
proper place: (2) Agree
General feeling not healthy: (6) Strongly 1.7E−06 — — — — not healthy: (1) 3.6E−07
Disagree Strongly Agree
healthy life: 1.6E−06 — — — — have energy: (1) Strongly 8.3E−12
(5) Strongly agree Disagree
(1) Healthy and older population of the cohort. (2) Healthy and relatively young females. (3) Healthy and relatively young males. (4) Aberrant health—enriched for high BMI, high blood pressure, not enriched for gender specific or age. Selected continuous features are shown in
the upper part of the table. “Mean first” stands for the mean value in the first bin closest to the archetype, “Mean rest” stands for the mean value of the rest of the data. Selected discrete features are shown in the lower table. Different features from the same category were
found to be enriched closest to the archetypes. The blank cells represent no enriched features. Highlighted P-values< 3.4e−06 which are significant after Bonferroni correction. The full table of features per archetype and their P-value can be found in Supplementary Dataset 2.
NATURE COMMUNICATIONS | (2021)12:3578 | https://doi.org/10.1038/s41467-021-23849-8 | www.nature.com/naturecommunications
NATURE COMMUNICATIONS | https://doi.org/10.1038/s41467-021-23849-8NATURE COMMUNICATIONS | https://doi.org/10.1038/s41467-021-23849-8 ARTICLE
Fig. 3 The enrichment analysis revealed one aberrant health state, and three wellness states: (1) the older-archetype (2) the female-archetype (3) the
male-archetype. Written in blue are the traits that are found to be enriched close to every archetype at high (left) or low (right) levels. Also shown are the
major axes of the data variation (also shown and described in Fig. 4, n = 3094).
(±2.8)), is markedly different from the first three, and in general is Microbiome enrichment analysis. Shannon index, observed spe-
enriched for traits associated with poor health- the unhealthy- cies, and Chao1 are metrics that indicate the diversity of the gut
archetype (Table 1, Fig. 3). Importantly, these traits were self- microbiome, and higher diversity is often associated with better
reported and found to be enriched close to the archetypes, and health13,29,31–33. We found that all these three metrics were low near
that the data points were not clustered or grouped together based the unhealthy-archetype. Other archetypes did not show any sig-
on these traits (such as age and gender). The spatial organization nificant relationship with microbiome diversity (Fig. 3). Thirty gut
of the data points was determined by the blood chemistry profiles bacterial genera were significantly enriched in particular archetypes
and plotted in 3D using dimensionality reduction (PCA) for after Bonferroni correction (P-value < 3.89e−06). 29 of these genera
visualization purposes (see Methods, Fig. 2). Additionally, if for were enriched next to the unhealthy-archetype, and 26 of the
example an archetype is enriched for males, it means that close to 29 showed lower abundance next to that archetype (a depletion of
that archetype there is a higher rate of males compared to random 26% of the genera that were tested). Depletion of bacteria species and
sampling (97% are males in the first bin). Next to archetype II low diversity are associated with many disease conditions13,17,31,34.
that was enriched for females, 100% of the individuals in the first Among the depleted genera are Faecalibacterium, Ruminococcaceae
bin were females (Supplementary Dataset 5). UCG-005, Christensenellaceae R-7 group and Lachnospiraceae, which
have been associated with a healthy gut ecosystem35,36 through the
fermentation of dietary fiber and the production of butyrate and
Enrichment analysis of polygenic risk scores (PRS). Next, we other short-chain fatty acids. Three genera showed significant
analyzed the enrichment of the polygenic risk scores (PRS), desig- enrichment with high levels in archetype IV: Bacteroides, Lachno-
nating a continuous measure of risk aggregating the effects of mul- clostridium and Megasphaera. Bacteroides is one of the most com-
tiple SNPs. We found that the PRS for high BMI was increased mon genera in the gut microbiome, and an increase of this genus is
adjacent to the unhealthy-archetype (P-value = 4.8e−11), this associated with several conditions like inflammation, type 1 diabetes,
archetype was also enriched for high BMI. Other traits were enriched and severe diarrhea37–42. Lachnoclostridium showed an increase in
close to the different archetypes, but their P-values did not pass the abundance following cefprozil treatment (antibiotic)43, and Mega-
Bonferroni correction threshold, these include: high risk for high sphaera was enriched in obese compared to lean twins44,45. The
LDL, triglycerides, and HDL close to the male-archetype (P-value = Marvinbryantia genus was significantly enriched in the older-
2.5e−03, 2.7e−02, 3.5e−02). The female-archetype was enriched for archetype (Fig. 3). Increase in Marvinbryantia was linked with low-
lower PRS for HDL and LDL (P-value = 2.9e−03, and 1.9e−02), and ering blood pressure in a rat model of hypertension46.
high PRS for losing weight from a low-fat diet (P-value = 2.3e−04).
The older-archetype was enriched for low PRS of BMI and Alzhei- Metabolomics enrichment analysis. A total of 990 plasma
mer’s disease (P-value = 1.72e−05, and 2.4e−02 respectively, Fig. 3). metabolites were measured for every participant, of which 45%
NATURE COMMUNICATIONS | (2021)12:3578 | https://doi.org/10.1038/s41467-021-23849-8 | www.nature.com/naturecommunications 5ARTICLE NATURE COMMUNICATIONS | https://doi.org/10.1038/s41467-021-23849-8
were lipids, 18% Amino Acids, 8% Xenobiotics, and 18% The clinical labs profiles at the archetypes reveal the main axes
unknown (Supplementary Fig. 3). The four archetypes had dis- of variation and their order: (1) the wellness axis, (2) the age
tinctive signatures of enriched metabolites (Supplementary axis, (3) the gender axis. To better understand which analytes
Fig. 4), with no common metabolites that were shared in all the from the blood-chemistries were the most influential in deter-
four archetypes. The unhealthy-archetype was the most meta- mining the spatial position of the data points, we calculated the
bolically perturbed with 216 enriched metabolites. Some of the correlation between the distances of the data-points to an
most enriched metabolites were lipids containing saturated fatty archetype and the analyte values for every archetype and every
acids (palmitic and stearic), indicative of a poor diet. On the analyte, and ranked the analytes according to the correlation
contrary, the older-archetype was enriched for a variety of coefficients in descending order (Supplementary Figs. 5–7). We
omega-3 fatty acids containing lipid species, while depleted in found that high levels of omega-3 total, DHA, DPA and vitamin-
lipid species containing saturated fat. 9/16 (56%) of the depleted D are correlated with shorter distances to the older-archetype,
metabolites next to the older-archetype were omega-6 fatty acid which is consistent with the enrichment of the self-reported
containing lipids (arachidonic and adrenic acids), which were at supplements uptake, since the richest sources of these nutrients
high abundance close to the unhealthy-archetype. These findings are derived from dietary supplementation. We found that low
indicate better dietary habits and/or supplement use in indivi- levels of triglycerides, insulin, LDL cholesterol, white blood cell
duals close to the older-archetype. The male-archetype had 56 count, and lower insulin resistance scores (lipoprotein insulin
enriched metabolites, of which 10 overlapped with the unhealthy- resistance (LPIR) and HOMA-IR), were correlated with greater
archetype (the biggest overlap). The female and male archetypes distances to this archetype, which supports the conclusion that
showed a tradeoff between the sex hormones, where the this archetype is characterized by better health. In contrast, high
androsterones—the precursor for testosterone, androsterone levels of triglycerides, insulin, LDL cholesterol, and WBC, and
glucuronide and DHEA-S were enriched in the male-archetype, higher LPIR and HOMA-IR scores, were correlated with proxi-
and pregnenediol was enriched in the female-archetype. Other mity to the unhealthy-archetype. This reciprocal image of the
sex related metabolites such as creatinine, which correlates with correlations between the older archetype and the unhealthy-
lean muscle mass and tends to be higher in males than females47, archetype nicely demonstrated the trade-offs between health and
showed a similar trend. Only eight other metabolites were enri- aberrant health states according to the clinical labs (Fig. 4, Sup-
ched in the female-archetype, five of them were Plasmalogens. plementary Fig. 7). Another trade-off can be seen between the
Plasmalogens are found in various human tissues, especially in male and female archetypes, with positive correlation between
the nervous, immune, and cardiovascular system, and have a role hemoglobin, hematocrit, red cell count and creatinine with dis-
in signal transduction, membrane dynamics and in protecting tances from the female-archetype, and anti-correlation of these
cells from reactive oxygen species damage48. All eight metabolites markers and the distances from the male-archetype (Fig. 4). High
that were enriched in the female-archetype, were depleted from levels of LDL were correlated with shorter distances to the male-
the unhealthy-archetype. Branched chain amino acids (BCAA) archetype, which is consistent with high PRS for high levels of
leucine, valine, and isoleucine, were depleted in the female- lipids, and high levels of lipids measured in the metabolomics
archetype, and enriched in the male-archetype. This tradeoff dataset described earlier. However, insulin, glucose, HOMA-IR,
might indicate differences in diet, since BCAAs are high in animal CRP, and white cell count correlated with greater distances to this
products such as meats and eggs, while plant-based diets are archetype, suggesting that this archetype is also characterized
generally characterized by lower BCAA content49. BCAAs were with healthy individuals in opposed to the unhealthy-archetype
also enriched in the unhealthy-archetype. Consistent with this (Fig. 4).
enrichment pattern, elevated circulating BCAA levels have been Another way to reveal the most impactful analytes that
previously associated with increased risk of cardiovascular and determined the spatial spread of the data points is by correlating
metabolic diseases50,51. The shared BCAA metabolic signatures the analytes with the PC coefficients (Table 2). We found that the
among the male- and unhealthy-archetypes highlight potential first PC was highly correlated (R > 0.5) with diabetes markers
similarities between these two archetypes, based on similar diet- such as insulin, LPIR, HOMA IR, and cardiovascular diseases
ary habits, and possible shared physiological perturbations markers such as triglycerides, and LDL, and anti-correlated (R <
(Supplementary Dataset 2). −0.5) with HDL and Adiponectin serum. These results suggest
that the first axis separates the data based on health status
(“healthy” versus “unhealthy”), that is reflected in the clinical labs
Proteomics enrichment analysis. A total of 265 plasma proteins (Table 2, Fig. 5). Diseases that are not reflected in the clinical labs,
were measured from two Cardiovascular Disease (CVD) panels, like mental-illnesses for instance, are most likely not captured by
and one inflammatory panel. Our analysis identified 136 proteins this analysis.
enriched in the unhealthy-archetype, 16 in the male-archetype, 38 The second PC is mostly correlated with omega-3 fatty acids,
in the female-archetype, and only seven for the older-archetype. including total omega-3’s, the individual omega-3’s DHA and
Only 11 proteins were found at significantly lower levels in the DPA, and the omega-6/omega-3 ratio. In a typical western diet,
unhealthy-archetype, while 125/136 (92%) were at significantly the richest source of omega-3 fatty acids often comes from
higher levels. Among the 11 less abundant proteins was Para- supplement use. Additionally, in our cohort supplement uptake is
oxonase 3 (PON3), which is associated with HDL levels. The more prevalent in the older portion of the population, and
most significantly low abundant protein for the older-archetype therefore these findings suggest that the second axis is determined
was leptin (LEP) (P-value = 4.3e−11). LEP was depleted also in by supplement uptake or age. Since both age and supplement
the male-archetype, and enriched in the unhealthy-archetype uptake are associated with this PC and between themselves, we
(Fig. 3). Low-density lipoprotein receptor (LDLR) was in lower cannot infer causality or determine whether one attribute is
abundance adjacent to the older and the female archetypes, and dominant over the other. The third and the fourthth PCs are
more abundant adjecent to the males and the unhealthy- mainly correlated with cholesterol. As higher values of cholesterol
archetypes (Fig. 3). These findings are consistent with the high are more frequent in men52,53, it suggests that the 3rd split of data
LDL levels observed in the clinical labs (Fig. 3), and the meta- is based on gender. The first four PCs explain 33.65% of the
bolomics. Only 2/37 proteins that were enriched close to the variance in the data, and higher PCs were less conclusive. This
female archetype had significantly higher levels. analysis supports the previous characterization of the archetypes
6 NATURE COMMUNICATIONS | (2021)12:3578 | https://doi.org/10.1038/s41467-021-23849-8 | www.nature.com/naturecommunicationsNATURE COMMUNICATIONS | https://doi.org/10.1038/s41467-021-23849-8 ARTICLE
a. Positive correlation (R > 0) Negative correlation (R < 0)
Low levels of analyte close to archetype High levels of analyte close to archetype
Analyte
levels
0
Distance from archetype Distance from archetype
b. c. d.
OMEGA 3 TOTAL HDL CHOL DIRECT INSULIN
OMEGA 3 INDEX LDL SIZE LPIR SCORE
DHA LINOLEIC ACID HOMA IR
EPA OMEGA 6 TOTAL TRIGLYCERIDES
DPA HDL PARTICLE NUMBER WHITE CELL COUNT
VITAMIN D 25 OH TOT GFR MDRD Triglyceride HDL Ratio
HDL CHOL DIRECT GFR MDRD AFRICAN AM TOTAL NEUTROPHILS AB
A G RATIO OMEGA 6 OMEGA 3 RATIO LDL SMALL
MCH CHLORIDE GLUCOSE
MCV PLATELET COUNT THOUSAND GLYCOHEMOGLOBIN A1C
UREA NITROGEN LYMPHOCYTES CRP HIGH SENSITIVITY
CARBON DIOXIDE CO2 ARACHIDONIC ACID GLOBULIN
MONOCYTES BASOPHILS URIC ACID
BASOPHILS MCV MONOCYTES ABSOLUTE
BILIRUBIN TOTAL VITAMIN D 25 OH TOT LDL PARTICLE NUMBER
LDL SIZE BUN CREAT RATIO GGT
EOSINOPHILS BASOPHILS ABSOLUTE ALKALINE PHOSPHATASE
HEMOGLOBIN A G RATIO ALAT SGPT
CREATININE ENZ SER RDW LYMPHOCYTES ABSOLUTE
HDL PARTICLE NUMBER TOTAL NEUTROPHILS TOTAL NEUTROPHILS
HEMATOCRIT EOSINOPHILS RDW
BUN CREAT RATIO GLOBULIN RED CELL COUNT
LYMPHOCYTES MCH OMEGA 6 OMEGA 3 RATIO
MCHC IMMATURE GRANULOCYTES PLATELET COUNT THOUSAND
CALCIUM SODIUM PROTEIN TOTAL SERUM
ALBUMIN CRP HIGH SENSITIVITY EOSINOPHILS ABSOLUTE
SODIUM IMMATURE GRANULOCYTES ABSOLUTE FERRITIN
ASAT SGOT MONOCYTES IMMATURE GRANULOCYTES ABSOLUTE
EOSINOPHILS ABSOLUTE LYMPHOCYTES ABSOLUTE ASAT SGOT
FERRITIN CARBON DIOXIDE CO2 LDL CHOL CALCULATION
POTASSIUM CHOLESTEROL TOTAL HEMATOCRIT
BASOPHILS ABSOLUTE EOSINOPHILS ABSOLUTE IMMATURE GRANULOCYTES
CHLORIDE POTASSIUM HEMOGLOBIN
IMMATURE GRANULOCYTES DHA BASOPHILS ABSOLUTE
ARACHIDONIC ACID TOTAL NEUTROPHILS AB POTASSIUM
RED CELL COUNT BILIRUBIN TOTAL CREATININE ENZ SER
ALAT SGPT ALKALINE PHOSPHATASE CALCIUM
IMMATURE GRANULOCYTES ABSOLUTE PROTEIN TOTAL SERUM UREA NITROGEN
URIC ACID WHITE CELL COUNT CHOLESTEROL TOTAL
CHOLESTEROL TOTAL EPA GFR MDRD AFRICAN AM
MONOCYTES ABSOLUTE ALBUMIN BUN CREAT RATIO
GGT OMEGA 3 TOTAL GFR MDRD
GLYCOHEMOGLOBIN A1C OMEGA 3 INDEX EOSINOPHILS
GLUCOSE LDL CHOL CALCULATION MCHC
LDL CHOL CALCULATION MONOCYTES ABSOLUTE SODIUM
RDW GLYCOHEMOGLOBIN A1C CHLORIDE
ALKALINE PHOSPHATASE DPA ARACHIDONIC ACID
TOTAL NEUTROPHILS MCHC ALBUMIN
PROTEIN TOTAL SERUM CALCIUM MONOCYTES
LYMPHOCYTES ABSOLUTE UREA NITROGEN BILIRUBIN TOTAL
LINOLEIC ACID ASAT SGOT CARBON DIOXIDE CO2
LDL PARTICLE NUMBER GLUCOSE BASOPHILS
PLATELET COUNT THOUSAND GGT HDL PARTICLE NUMBER
GFR MDRD AFRICAN AM CREATININE ENZ SER OMEGA 6 TOTAL
GFR MDRD INSULIN LYMPHOCYTES
LDL SMALL LDL PARTICLE NUMBER DPA
CRP HIGH SENSITIVITY HOMA IR VITAMIN D 25 OH TOT
GLOBULIN FERRITIN MCH
TOTAL NEUTROPHILS AB ALAT SGPT EPA
WHITE CELL COUNT TRIGLYCERIDES LINOLEIC ACID
OMEGA 6 TOTAL Triglyceride HDL Ratio MCV
HOMA IR RED CELL COUNT DHA
INSULIN LDL SMALL OMEGA 3 INDEX
TRIGLYCERIDES URIC ACID OMEGA 3 TOTAL
Triglyceride HDL Ratio HEMATOCRIT A G RATIO
LPIR SCORE LPIR SCORE LDL SIZE
OMEGA 6 OMEGA 3 RATIO HEMOGLOBIN HDL CHOL DIRECT
-1 -0.5 0 0.5 1 -1 -0.5 0 0.5 1 -1 -0.5 0 0.5 1
Fig. 4 Correlations between the distances from the archetypes and analyte levels reveal the principal analytes next to every archetype, and the trade-
offs in the data. a Schematic view: the distances between the data-points and the archetypes were correlated with the levels of each analyte. Positive
correlation (R > 0) means that low levels of the analyte correlate with shorter distance from the archetype, negative correlation (R < 0) means that higher
levels of the analyte correlate with shorter distances from the archetype. b The correlation coefficients of analyte levels with distance from Archetype I
were ordered and presented in the horizontal bar plot (purple), and compared to the correlation coefficients of the analytes with distances from Archetype
IV (green bars). c The same as b for Archetype II (orange bars) and Archetype III (blue bars), analytes were ordered according to the correlation
coefficients of Archetype II. d The same as b for Archetype IV (green bars) and Archetype III (blue bars), analytes were ordered according to the
correlation coefficients of Archetype IV. The full table of the correlation coefficients can be found in Supplementary Figs. 5–7.
using the enrichment analysis, and provides hierarchy to the rules Moving towards the unhealthy-archetype is associated with
that shape the data. The data first splits according to wellness higher levels of diabetes, obesity, and cardiovascular disease
state, then supplement uptake/age, and lastly—by gender (Fig. 5). markers including insulin, glucose, LPIR, triglycerides, LDL.
Interestingly, sex differences diminish with age and sickness. Therefore, advancing towards this archetype indicates possible
deteriorating health. In contrast—moving away from the
unhealthy-archetype towards the healthy plane suggests
Utilizing longitudinal data and the movement on the tetra- improvement in wellness. Indeed, when we correlated the dis-
hedron for early detection of transitions from health to disease tances between the archetypes and health markers such as weight
state. After finding the tetrahedron and characterizing the and BMI, we obtained positive correlation with the older-arche-
archetypes and the tradeoffs in the system, we used longitudinal type, and anti-correlation with the unhealthy-archetype (Sup-
data to study how individuals move on the tetrahedron over time. plementary Fig. 8).
NATURE COMMUNICATIONS | (2021)12:3578 | https://doi.org/10.1038/s41467-021-23849-8 | www.nature.com/naturecommunications 78
Table 2 Correlation between the PCs and the analytes reveals the dominant analytes that shape the data and demonstrate their hierarchy.
PC 1 PC 2 PC 3 PC 4
LPIR SCORE 0.78 OMEGA 6 OMEGA 3 0.70 EPA 0.47 CHOLESTEROL TOTAL 0.70
ARTICLE
RATIO
Triglyceride HDL Ratio 0.71 OMEGA 6 TOTAL 0.45 OMEGA 3 TOTAL 0.45 LDL CHOL 0.65
CALCULATION
TRIGLYCERIDES 0.71 LINOLEIC ACID 0.39 OMEGA 3 INDEX 0.45 LDL PARTICLE NUMBER 0.60
INSULIN 0.67 GFR MDRD 0.37 TOTAL NEUTROPHILS AB 0.41 LYMPHOCYTES 0.51
LDL SMALL 0.66 GFR MDRD 0.37 WHITE CELL COUNT 0.41 LDL SMALL 0.32
AFRICAN AM
HOMA IR 0.66 PLATELET COUNT 0.31 DHA 0.40 TRIGLYCERIDES 0.29
THOUSAND
WHITE CELL COUNT 0.56 LDL SIZE 0.23 GLYCOHEMOGLOBIN A1C 0.33 BASOPHILS 0.23
TOTAL NEUTROPHILS 0.52 CRP HIGH SENSITIVITY 0.20 CRP HIGH SENSITIVITY 0.32 LYMPHOCYTES 0.20
AB ABSOLUTE
URIC ACID 0.50 GLOBULIN 0.18 HOMA IR 0.30 EPA 0.19
LDL 0.47 TOTAL 0.16 RDW 0.30 Triglyceride HDL Ratio 0.19
PARTICLE NUMBER NEUTROPHILS AB
DPA −0.31 URIC ACID −0.40 RED CELL COUNT −0.29 DPA −0.19
HDL −0.32 RED CELL COUNT −0.42 A G RATIO −0.30 RED CELL COUNT −0.23
PARTICLE NUMBER
MCV −0.33 CREATININE ENZ SER −0.42 LINOLEIC ACID −0.31 MONOCYTES −0.24
ABSOLUTE
VITAMIN D 25 OH TOT −0.37 HEMATOCRIT −0.57 LDL CHOL CALCULATION −0.33 WHITE CELL COUNT −0.25
EPA −0.42 HEMOGLOBIN −0.61 MCHC −0.36 HEMATOCRIT −0.26
DHA −0.48 DHA −0.61 HEMATOCRIT −0.41 HEMOGLOBIN −0.28
OMEGA 3 INDEX −0.48 EPA −0.62 ALBUMIN −0.41 BILIRUBIN TOTAL −0.28
OMEGA 3 TOTAL −0.48 DPA −0.66 OMEGA 6 TOTAL −0.43 ARACHIDONIC ACID −0.37
LDL SIZE −0.50 OMEGA 3 TOTAL −0.69 OMEGA 6 OMEGA 3 RATIO −0.44 TOTAL −0.40
NEUTROPHILS AB
HDL CHOL DIREC −0.63 OMEGA 3 INDEX −0.69 HEMOGLOBIN −0.47 TOTAL NEUTROPHILS −0.51
The table contains the top 10 positively correlated analytes (upper part of the table) and the top 10 negatively correlated analytes (bottom part) for every archetype. Presented are the analyte names next to the correlation coefficient (r). Highlighted |r| >=0.5.
NATURE COMMUNICATIONS | (2021)12:3578 | https://doi.org/10.1038/s41467-021-23849-8 | www.nature.com/naturecommunications
NATURE COMMUNICATIONS | https://doi.org/10.1038/s41467-021-23849-8NATURE COMMUNICATIONS | https://doi.org/10.1038/s41467-021-23849-8 ARTICLE
horizontally away from the female-archetype toward the point
All between the male and the older archetypes, with no vertical
movement towards the unhealthy- archetype (Fig. 6). Between
her 6th and 7th visits she was diagnosed with gallstones and fatty
liver disease. Unlike the first example, the movement on the
“Healthy” “Sick” tetrahedron was gradual.
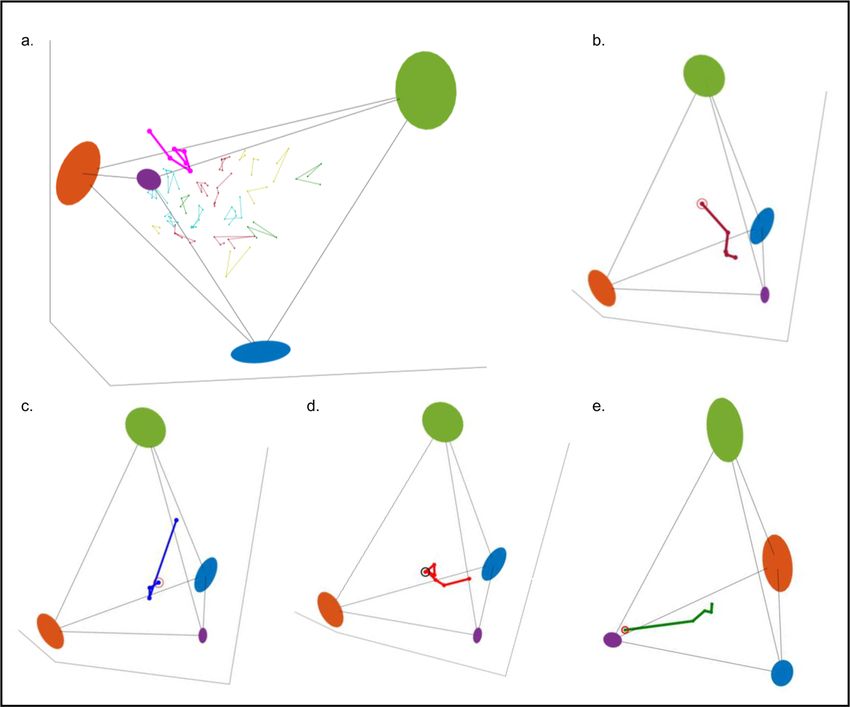
The second movement towards the unhealthy-archetype was
observed for a 56 years old man whose initial position is very
close to the older-archetype, and in all of his four following
Older Young
timepoints he consistently moved away from this archetype and
toward the center of the tetrahedron (total change in Euclidean
distance = 12.8). The participant’s measurements fall in the
Females Males middle of the population distributions, and there is no record
of diagnosis of any pathology, however many analytes are
gradually changing in a consistent way, including insulin (from
Fig. 5 The hierarchy of the principles that shape the spatial organization 3.9 to 6.2) and LDL small (from 90 to 143), which might indicate
of the data-points. The first PC is correlated to markers of disease state an evolving underlying condition. This trajectory was ranked 3rd
like LPIR, insulin, HOMA IR (diabetes), triglyceride, LDL, (Cardio-vascular in length.
disease), white cell count, neutrophils (inflammation). And therefore, the The third case of such a movement, ranked 1st in length and
first split of the data is according to wellness state. The second PC is belongs to a 54-year-old man, where three of his five timepoints
correlated with omega 3 in different forms. High levels of omega 3 are crossed the tetrahedron boundaries, however there was no report
achieved from supplement uptake, which characterize older individuals and of adverse events for this participant. Crossing the tetrahedron
therefore the second split is based on supplement uptake / or age. The boundary and moving away from it means that the individual has
third and 4th PC’s are correlated with lipids and markers like: Hemoglobin, an atypical set of values that are very different from the
Hematocrit, Red cell count, that separate the males and females and background distribution that was used to construct the
therefore the last split is according to sex (Table 2). tetrahedron, which can be due to error in the measurement, or
may indicate an abnormal physiological condition.
The current dataset does not include electronic health records. Overall, 30 trajectories (2.5%) had a time-point that exceeded
Clinical information was obtained by self-reports, which included the tetrahedron boundaries, but there was only one trajectory that
113 adverse events of which 80 were unique events. The most had 3 time-points that were out of the convex hull (described
common event was “kidney stones” that was reported by five above) and another one that had 5 of 6 timepoints outside the
participants (0.16% of the cohort, Supplementary Dataset 4), and simplex. This trajectory belongs to a 64 years old woman who was
therefore there are not many replicate trajectories for any specific diagnosed with stage III bladder cancer, prior to these measure-
disease in the current study as there are for common drug usage ments (Fig. 6). Most cancers are undetectable through typical
(e.g., statins) or for out-of-range values on risk biomarkers (e.g., clinical lab tests. The measurement of specific proteins is usually
LDL cholesterol, HbA1c). However, comparing the longitudinal used as biomarkers for different types of cancers54–58. Interest-
measurements of individuals to their initial position allows ingly, all clinical labs measurements for this participant fall in the
detecting consistent change over time in a personalized (N of 1) center of the distribution for all analytes in all visits (Supple-
manner”. mentary Fig. 12). However, using longitudinal data and drawing
There are 1186 individual trajectories of three or more time- her personal trajectory on the tetrahedron revealed unusual
points (Supplementary Fig. 13), and participants move in all movement, which might indicate an underlying condition.
directions. The maximal Euclidian distance between two time- Despite the limitation of the dataset, these few examples
points is 19.4 (min: 0.1, mean: 2.5, Supplementary Fig. 9). Most demonstrate how personal trajectories and the movement on
participants tumble around their initial position, such that the the tetrahedron can be used to detect transitions from health to
mean Euclidean distance between the first and last visit is 3, (min: disease states, and vice versa, even when other computational and
0.3, max: 13.5, median: 2.7 std: 1.7, Supplementary Fig. 10, Fig. 6), statistical tools show no indication of such a transition.
however some participants significantly changed their position on
the tetrahedron. Out of the top 2% of participants that
significantly changed their position, 87% (20/23) were getting Discussion
closer to the healthy and the older-archetype, and were moving In this study we applied ParTI to high-dimensional human
away from the unhealthy-archetype as expected from a wellness wellness data to aid in analyzing and visualizing the most
program. dominant tradeoffs that shape the clinical labs data. The key
Three participants demonstrated a different pattern: a 56 years findings are as follows: (1) ParTI analysis revealed that the clinical
old woman who moved on her 4th visit from the center of the labs data fall on a statistically significant tetrahedron, with four
tetrahedron towards the unhealthy-archetype (Euclidean dis- archetypes. (2) Enrichment analysis of associated multi-omics
tance: 13.2, Fig. 6). Three days after her 4th blood draw she was and lifestyle data revealed characteristics of each of the arche-
diagnosed with enlarged liver, gallbladder and pancreas. Inter- types: (i) the older and healthy archetype, (ii) the young and
estingly, she also moved closer to the male-archetype, showing healthy females, (iii) the young and healthy males (iv) the
that in abnormal situations a female can move toward the male- unhealthy-archetype. (3) We then describe the clinical lab profiles
archetype, and that this unexpected movement might indicate an at the archetypes, and found the major axes of variation and their
abnormal health status. This trajectory was ranked second in the hierarchy: (i) the wellness, (ii) the age, and (iii) the gender axis.
length of the movement. (4) We found that the male-archetype shares more enriched
A similar case was detected for a woman in her 60 s that had features with the unhealthy-archetype than did the female or the
seven timepoints, and was ranked 6th in trajectory length. In the older archetypes, which appeared to be due to generally less
first three time points she is tumbling in the middle of the healthy lifestyle and dietary habits. (5) We found that sex dif-
tetrahedron and from the 4th time-point onwards she is moving ferences diminished with age and in an aberrant health state. (6)
NATURE COMMUNICATIONS | (2021)12:3578 | https://doi.org/10.1038/s41467-021-23849-8 | www.nature.com/naturecommunications 9ARTICLE NATURE COMMUNICATIONS | https://doi.org/10.1038/s41467-021-23849-8 Fig. 6 Trajectories of individuals and the movement on the tetrahedron can be used for early detection of transitions from health to disease state. a most individuals tumble around their initial position on the tetrahedron. Shown in the Figure are a few examples of trajectories, colored according to the number of timepoints: yellow- 3, green-4, red-5 and 6, and turquoise- 7 timepoints, the initial position is marked with a black circle. The pink trajectory belongs to a 64-year-old woman who was diagnosed with stage 3 bladder cancer prior to her blood measurements, her trajectory exceeds the boundaries of the tetrahedron. b Most of the trajectories are moving away from the unhealthy- archetype (green) towards the older and the healthy archetype (purple), as expected from a wellness program. Shown in the Figure an example of such a trajectory. c The trajectory of a 56-year-old woman that significantly progressed in her 4th time-point (Euclidean distance: 13.2) towards the unhealthy-archetype (green) and closer to the male-archetype (blue), 3 days prior to a diagnosis of enlarged liver, gallbladder and pancreas. d The 7 timepoints trajectory of a 61-year-old woman, tumbling in the middle of the tetrahedra in the first 3 timepoints, and starting from the 4th time-point, gradually moving horizontally away from the female-archetype (orange) towards a point between archetype 1 and 3. Between her 6th and 7th visits she was diagnosed with Gallstones and Fatty liver disease. e A gradual trajectory of a 56- year-old man, who was not diagnosed with any disease, but consistently moves away from the healthy and the older archetype (purple) towards the center of the tetrahedron, and closer to the unhealthy archetype. Lastly, we characterized the movement of individual participants there were three wellness states and only one aberrant health on the tetrahedron over time and found that most participants state. In a different cohort (e.g., the clinical labs of breast cancer tumble around their initial position, and that the vast majority of participants) there might be a different set of archetypes, axes of the participants that showed a significant change in their trajec- variation and different hierarchy of the tradeoffs, though the axes tory, moved towards the healthy and older archetype, and away of variation that come out of this analysis are generally well from the unhealthy archetype, as might be expected from a known to have significant effects (sex, age, general health). wellness program. (7) We then detected all the cases of partici- Moreover, one might ask why the clinical labs matrix was used to pants that showed a different type of movement, and demon- construct the simplex and not the metabolomics or proteomics strated how the movement on the tetrahedron might be utilized data. We chose the clinical labs because it was the data type for for monitoring individual participants and detecting signs of which we had the largest number of observations, with standardized health transitions. Taken together, these findings demonstrated and commonly used measurements that have known interpreta- the power of geometry and dimensionality reduction in analyzing tions. We also found that the simplex signal was the strongest for and visualizing high-dimensional datasets in a continuous trait the clinical labs. Additionally, the clinical labs are the only dataset space, and their capacity to be leveraged for monitoring indivi- that is currently being measured in the clinic, and therefore the dual’s health through blood measurements. most relevant and applicable for the longitudinal analysis of an The four identified archetypes were strongly reflective of major individual’s health trajectory in the resulting tetrahedron. aspects of physiology: females, males, older and unhealthy, as well The enrichment analysis using different data types allowed us as the tradeoffs and the major axes of variation. Interestingly, to characterize the four archetypes across multiple aspects, which 10 NATURE COMMUNICATIONS | (2021)12:3578 | https://doi.org/10.1038/s41467-021-23849-8 | www.nature.com/naturecommunications
NATURE COMMUNICATIONS | https://doi.org/10.1038/s41467-021-23849-8                                                                                  ARTICLE

were generally concordant and provided a unified view. For                       characterizing disease transitions, and their reflection in the
example, the unhealthy-archetype was enriched for high BMI, its                 blood, and perhaps suggest a unique way to interpret blood tests.
corresponding PRS, high levels of the protein leptin, and various
other traits like high blood pressure, low levels of physical
activity, and poor dietary habits. Similar cohesion was seen for the            Methods
                                                                                Data collection. The de-identified data for consenting individuals was collected by
other archetypes as well. Such traits represent sets that make                  Arivale incorporation as part of a scientific wellness program between 2015–2019.
sense and are fairly well understood to be interconnected, but                  Participants in the program gave blood and stool samples and based on the
others emerge that are not as known, such as the depletion and                  measurements and their personal goals were guided by professional coaches how to
                                                                                change their lifestyle (dietary, exercise, sleep, supplement taking and stress man-
the enrichment of specific gut microbial genera associated with                  agement) in order to improve their health. There were 3,558 participants in the
each archetype. Additionally, we provided an overview of the                    program, and samples were collected approximately every 6 months. The number
most apparent tradeoffs between archetypes that were significant                 of time-points per participant vary between 1 to 8 time points. The distribution of
after correcting for multiple hypothesis testing. The full enrich-              the time points and the demographic description of the cohort is described in the
ment tables contain distinct signatures for every archetype                     SI. The study was approved by the Western Institutional Review Board (WIRB)
                                                                                with Institutional Review Board (IRB) study number 20170658 at the Institute for
(Supplementary Dataset 2).                                                      Systems Biology.
   We analyzed the individual trajectories of participants, and
demonstrated how it can be used for detecting unexpected
motions. There are various ways to analyze the trajectories and                 Clinical laboratory tests. Blood draws for all assays (metabolomics, proteomics
                                                                                and clinical labs) were performed at LabCorp service centers. At every blood draw,
define what is a significant movement, while excluding outliers                   weight and height were measured and BMI was calculated using the formula:
and errors in measurements. For that purpose, we considered                     (weight(kg))/(height(m))2. Participants were requested to avoid alcohol, vigorous
only trajectories that had at least three timepoints, and calculated            exercise, aspartame and monosodium glutamate 24 h prior the blood draw, and fast
the Euclidean distance between the initial and the end position.                12 h in advance. Participants were asked to declare if they were fasting as directed,
                                                                                and negative answers were used as exclusion criteria. Another exclusion criterion
This analysis revealed three trajectories that had a significant                 was based on ethnicity. Different ethnicities have different ranges of clinical labs,
change, and moved closer to the unhealthy archetype, and were                   however, there was no good representation of ethnicities other than white (82%),
described in detail in the Results. The second criterion for                    and to avoid the natural grouping by race (which happened prior to the inclusion
“abnormal” trajectory was the number of timepoints in a trajec-                 criteria with the 2% of Asians that were clustered next to a specific archetype), only
                                                                                participants that declared one of the following: white, Ashkenazi Jewish, Sephardic
tory that were outside the tetrahedron boundaries. This analysis                Jewish, Hispanic Latino or Spanish origin were included in this study. No further
revealed only two trajectories that had more than one time point                genetic validation was done to confirm these statements. Excluded also participants
outside the tetrahedron (a single time point may indicate an error              and analytes that had more than 10% missing values, resulting in a dataset of 3094
in the measurement or a transient state). Three out of the total                individuals and 67 analytes.
five examples that had a unique trajectory according to these two
criteria, self-reported an adverse event. Interestingly, the two                Data selection and normalization. To avoid skewed results due to data multi-
women that moved away from the female-archetype, and closer                     plication (multiple visits per participant), one visit was randomly selected for each
to the male-archetype, both reported an adverse event that                      individual using the “randi” function in MATLAB. The data selection process was
included the liver and the gallbladder, which fit the notion that                repeated 7 times, and every time the randomly selected data was used to find a
                                                                                tetrahedron. In 5 out of 7 repetitions a significant tetrahedron was found (P-value <
young healthy males have a distinctive signature from females of                0.05), as shown in Fig. 2. The significance test was done as described in Hart et al.25.
lipids and markers of kidney function. Since the Arivale dataset                One of the data selections that had a P-value < 0.001 was then used for all further
does not contain the participant’s clinical records, valuable                   analysis, such that for every participant there was a key of participant internal ID and
information for this kind of analysis might be missing. This might              visit, and that key was used to match samples in all other datasets—proteomics,
                                                                                metabolomics etc. Missing values were imputed by the analyte mean and the clinical
explain the two unique trajectories that do not have information                labs dataset was Z-normalized following the data selection and prior to subsequent
about a specific diagnosed clinical condition. These two trajec-                 data analysis steps.
tories belong to male participants and the male-archetype was
also enriched for missing information in the self-reported ques-
                                                                                Polygenic risk scores (PRS). 52 polygenic risk scores (PRS) were calculated as a
tionnaires. However, this analysis revealed the distinct trajectory             continuous measure of risk aggregating the effects of multiple SNPs, as described in
of the participant that was subsequently diagnosed with bladder                 Zubair et al.11. Briefly, each of these polygenic scores was constructed using
cancer. This example is noteworthy because it is the only example               publicly available summary statistics from published Genome-Wide Association
of a trajectory where 5/6 timepoints exceeded the boundaries of                 Studies (GWAS)59–61. After FDR correction and filtering correlated SNPs, the PRS
                                                                                for each individual was calculated by summing up the published effect size for each
the tetrahedron. This is even more exceptional considering that                 selected SNP multiplied by the number of effect alleles the individual carried for
this participant’s blood measurements individually fell within the              that SNP, across all of the selected SNPs. The PRS were used for enrichment
distribution of the cohort, such that in outlier analysis, none of              analysis and no imputation for missing values was carried out.
the individual measurements would have been abnormal. More-
over, usually cancers (other than leukemia) are not detected in
                                                                                Proteomics. Plasma protein levels were measured by Olink Biosciences in 3 panels:
standard clinical lab measurements. In the Arivale cohort there                 Cardiovascular II, Cardiovascular III and Inflammation, the data was processed
were several other cases of participants that were diagnosed with               and batch corrected as described in Wilmanski et al. 201913. The proteomics
cancer or other diseases, but the transition was not captured by                dataset was matched to the clinical lab dataset and included the same 3094 par-
this analysis. This might be because of missing data, because the               ticipants and visits, and 265 proteins that were measured from the same blood
                                                                                draws as the clinical labs. The proteins dataset was used for enrichment analysis
transition occurred before the participant joined the program,                  and no imputation for missing values was carried out.
because the transition is not reflected in the clinical labs, or
because of lack of sensitivity in the method. To determine to what
extent this analysis could be further developed for detecting                   Metabolomics. Metabolites from plasma samples were assayed by Metabolon
                                                                                (North Carolina). Untargeted metabolomics analysis was performed on plasma
transitions, for calculating its sensitivity and specificity, as well as         extracted from whole blood using Metabolon’s ultra-high-performance liquid
for correlating the archetypes with long-term health outcomes, a                chromatography/tandem mass spectrometry (UHPLC/MS/MS) Global Platform
larger and more longitudinal dataset would be needed.                           (Ryals et al. 2007). Sample handling, quality control, and data extraction, along
   Taken together, this study implements a high order data                      with biochemical identification, data curation, quantification, and data normal-
                                                                                izations have been previously described13. A total of 990 different plasma meta-
representation of multi-omics measurements. Despite its limita-                 bolites were measured for each individual and matched to the same blood draws as
tions, it provides insights into the interplay between wellness and             in the clinical labs dataset. This dataset was used in the enrichment analysis and no
disease in deeply phenotyped data clouds. This work can help in                 imputation was carried out.

NATURE COMMUNICATIONS | (2021)12:3578 | https://doi.org/10.1038/s41467-021-23849-8 | www.nature.com/naturecommunications                                             11
You can also read