NeuroLines: A Subway Map Metaphor for Visualizing Nanoscale Neuronal Connectivity
←
→
Page content transcription
If your browser does not render page correctly, please read the page content below
NeuroLines: A Subway Map Metaphor for
Visualizing Nanoscale Neuronal Connectivity
Ali K. Al-Awami, Johanna Beyer, Hendrik Strobelt, Narayanan Kasthuri,
Jeff W. Lichtman, Hanspeter Pfister, and Markus Hadwiger
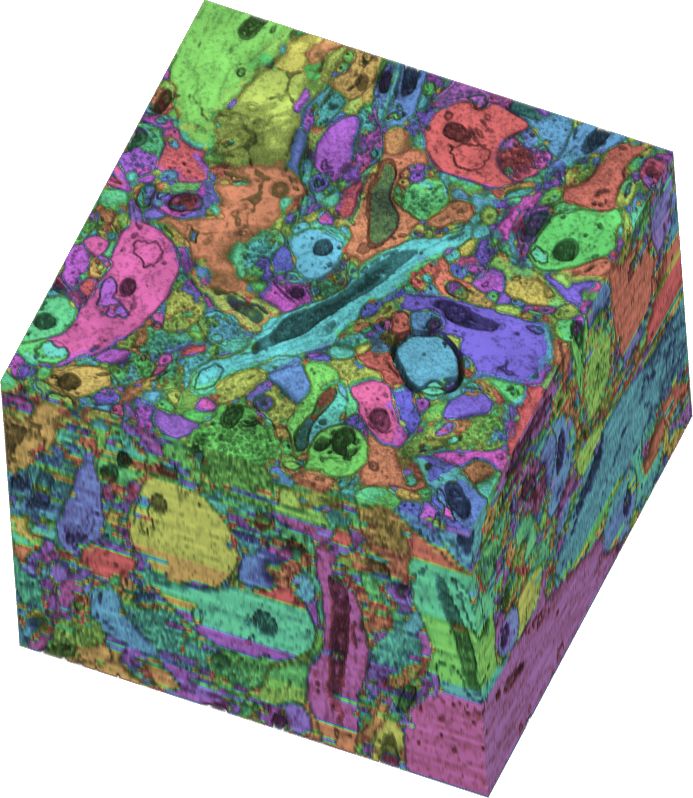
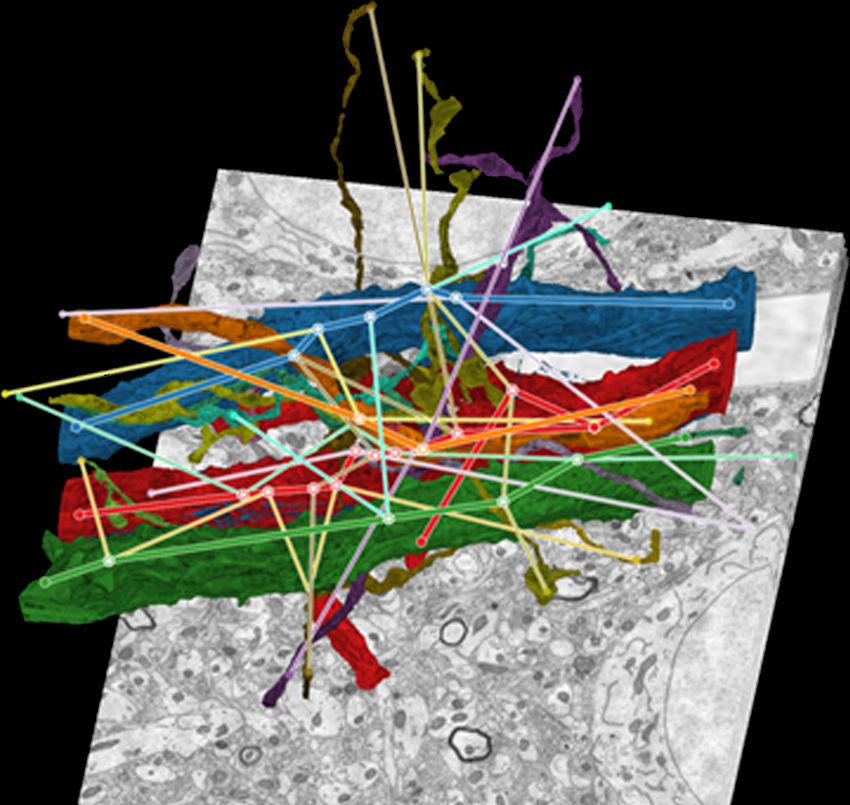
Fig. 1: NeuroLines neurite visualization. We abstract the original 3D structure and topology of neurites segmented in nanoscale
brain tissue data into a 2D subway map visualization that preserves topology and relative distances. Left: Volume rendering of a
dendrite (red) and connected axons (blue). Right: NeuroLines abstraction of the same data, represented as subway lines to more
clearly show branches, clusters of adjacent synapses, individual synapses, and the actual connections (shown on demand).
Abstract—We present NeuroLines, a novel visualization technique designed for scalable detailed analysis of neuronal connectivity
at the nanoscale level. The topology of 3D brain tissue data is abstracted into a multi-scale, relative distance-preserving subway
map visualization that allows domain scientists to conduct an interactive analysis of neurons and their connectivity. Nanoscale
connectomics aims at reverse-engineering the wiring of the brain. Reconstructing and analyzing the detailed connectivity of neurons
and neurites (axons, dendrites) will be crucial for understanding the brain and its development and diseases. However, the enormous
scale and complexity of nanoscale neuronal connectivity pose big challenges to existing visualization techniques in terms of scalability.
NeuroLines offers a scalable visualization framework that can interactively render thousands of neurites, and that supports the detailed
analysis of neuronal structures and their connectivity. We describe and analyze the design of NeuroLines based on two real-world
use-cases of our collaborators in developmental neuroscience, and investigate its scalability to large-scale neuronal connectivity data.
Index Terms—Connectomics, Neuroscience, Data Abstraction, Multi-Trees, Focus+Context.
1 I NTRODUCTION
Neuroscientists in the field of connectomics seek to reconstruct the full tion [12], segmentation [21, 24], synapse identification, and the recon-
anatomical and functional connectivity of the brain at the resolution struction of connectivity [9, 43]. The next logical step—the detailed
of individual connections (synapses) between nerve cells (neurons). analysis of reconstructed neurons, using knowledge of their morphol-
Determining—and ultimately decoding—this wiring diagram, called ogy and structure as well as connectivity—is still a cumbersome, and
the connectome, is one of the main scientific endeavors of the 21st mostly manual, process. This is further complicated by a lack of suf-
century and will allow scientists to better understand how the brain ficiently powerful visualization and analysis tools, and by the inher-
develops and functions, and how memories are formed and recalled. ent complexity and huge scale of connectomics data. Most previous
However, even a single cubic millimeter of a mouse brain already con- methods for visualization and analysis in connectomics focus either on
sists of around 100,000 neurons and 700 million synapses, making visualizing a completely abstract connectivity graph, or on rendering
brain connectivity exceptionally difficult to analyze and understand. the raw electron microscopy (EM) data. A common problem for visu-
Only recent advances in connectomics have made it possible to ac- alization is the complex structure of EM data. For example, a single
quire data at the speed and quality necessary to be able to reconstruct neuron in the mouse cortex makes up to ten thousand synapses with
the brain’s connectivity at the level of individual synapses. Until now, other neurons, which easily leads to cluttered visualizations. Further-
most of the effort has focused on developing novel methods for high- more, in order to gain insight, the synaptic connectivity between neu-
throughput and high-resolution image acquisition [30], data registra- ral structures and the anatomical information present in the raw data
should be linked together, to enable scientists to jointly analyze these
two aspects and their relationship. Therefore, it is necessary to design
• Ali K. Al-Awami and Markus Hadwiger are with King Abdullah University and develop new scalable visualization and analysis techniques that
of Science and Technology (KAUST). enable scientists to efficiently form and investigate new hypotheses
E-mail: {ali.awami, markus.hadwiger}@kaust.edu.sa. about the interplay between neuron form, connectivity, and function.
• Johanna Beyer, Hendrik Strobelt and Hanspeter Pfister are with the School
of Engineering and Applied Sciences at Harvard University. In this paper, we present NeuroLines, a novel multi-scale visual-
E-mail: {jbeyer, hstrobelt, pfister}@seas.harvard.edu. ization technique to analyze neurites (i.e., axons and dendrites, which
• Narayanan Kasthuri and Jeff W. Lichtman are with the Center for Brain are structural sub-parts of neurons), and their connections. We use the
Science at Harvard University. underlying anatomical tree structure of neurites to create an intuitive
E-mail: bobby.kasthuri@gmail.com, jeff@mcb.harvard.edu. visualization. Therefore, our first contribution is an abstraction for vi-
Manuscript received 31 Mar. 2014; accepted 1 Aug. 2014; date of sualizing neurites in an uncluttered 2D representation. Each neurite
publication xx xxx 2014; date of current version xx xxx 2014. is represented as a tree structure based on its real, but adaptively sim-
For information on obtaining reprints of this article, please send plified, anatomy, and its branches. The goal of our visualization is to
e-mail to: tvcg@computer.org. present neurites in an uncluttered fashion, while still preserving the
topological structure and connectivity information. Fig. 1 shows the
original 3D structure of a dendrite with several connected axons, and
the corresponding representation in NeuroLines. Our second contri-
bution is a multi-scale visualization and navigation scheme that makes
our approach scalable to thousands of neurites by automatically com-
puting the correct level of abstraction for the current view. Users can
zoom in on regions while still maintaining a contextual overview of
nearby neurites. Our third contribution is the NeuroLines application,
based on the topology-preserving visual abstraction of neurites to sup-
port the analysis of neurite connectivity. It is integrated into Con-
nectomeExplorer [5], a visualization and visual analysis framework
for petascale connectomics data. Finally, our fourth contribution is a
demonstration of the utility of NeuroLines, based on two case studies
performed by domain experts on real-world connectomics data.

2   R ELATED W ORK
Connectomics. There are several excellent introductions to the main           Fig. 2: Neuron and synapse structure. Neurons receive input through
research challenges in connectomics [30, 40]. In computer science,            dendrites, and transmit signals over their axon and the synapses that it
connectomics has stimulated a lot of research in image processing,            makes with other neurons’ dendrites. Vesicles carry neurotransmitters
vision, and visualization. Most software for connectomics focuses             on the pre-synaptic side, at so-called axon terminals (boutons).
on manual annotation [2, 19, 38] and (semi-)automatic segmenta-
tion [1, 21, 24] of neuronal structures as well as proof-reading auto-        that highlight the mutation distance between two nodes. TreeJuxta-
matic segmentation results [18, 37]. However, all of these approaches         poser [34] focuses on the structural comparison of large trees. It uses
do not support advanced exploration or visual analysis of features.           a similarity measure to compute the best corresponding nodes between
Visualization for connectomics. There are two main categories for             trees and guarantees the visibility of these nodes on screen. Bremm et
visualization in connectomics: (1) displaying the original large-scale        al. [8] compare multiple phylogenetic trees based on global as well
microscopy data, and (2) visualizing higher-level connectivity infor-         as local tree structure. Tree comparison approaches are very useful to
mation [36]. Margulies et al. [32] give an overview of different frame-       highlight differences between individual trees. Our primary focus in
works for visualizing the human connectome. Hadwiger et al. [17]              NeuroLines, however, is the analysis of how individual trees (i.e., neu-
present a system for volume exploration of petavoxel EM data, which           rites) are connected to each other, and to identify appropriate attributes
was later extended to handle segmented neurites [6]. Several appli-           that can be used for automatic neurite comparison in the future. EVE-
cations have proposed interactive or visual queries to explore these          Vis [33] visualizes large evolutionary tree data. It uses a multi-scale
typically very large data sets [10, 31, 41]. None of them, however,           method that transitions from a high-level stack graph visualization to
focus on exploring the connectivity between neurites at the level of          a node-link tree layout for showing individual cells. In the medical
individual synapses. More recently, we have presented Connectome-             field, tree structures often have a direct spatial correspondence. CPR
Explorer [5], which supports fully dynamic visual queries, volume vi-         (curved planar reformation) [23] allows tubular structures such as ves-
sualization of EM and segmentation data, as well as labeled meta-data         sels to be displayed in a 2D visualization with minimal loss of infor-
such as synapse locations. However, in contrast to NeuroLines, Con-           mation. More recently, Borkin et al. [7] proposed a 2D visualization of
nectomeExplorer does not focus on detailed neural connectivity analy-         artery trees for the diagnosis of heart disease. Both methods focus on
sis and does not offer visual abstractions of neurites and their synapses.    anatomical structures represented as a single tree, and therefore do not
Neuronal connectivity visualization. The analysis and visualization           have to deal with multi-trees and connected multi-trees. The metro
of the intricate connectivity of brain networks typically focuses on          map metaphor, originally used to show transit lines and connecting
either the regional or the cell level. On the regional level, Irimia et       stops, can also be used to visualize networks and abstract graphs. Ex-
al. [20] use connectograms or radial network layouts to show the con-         amples include project plans [44] or visualizing trains of thought [35].
nectivity between regions in the human cortex. Jianu et al. [22] project      Multi-scale navigation. Hierarchical navigation metaphors and
3D tractography data of white matter fibers onto 2D planes to produce         focus-and-context techniques [42] are very useful for exploring a large
2D neural maps of fiber tracts. Li et al. [29] propose a toolkit for visual   number of entities or data points. NeuroLines uses the “search, show
analysis of brain networks based on DTI data. Connected brain regions         context, expand on demand” metaphor for exploring large graphs [46],
are displayed in a 3D graph structure based on the region’s spatial loca-     and additionally employs a multi-tier focus-and-context visualization
tion in the brain. Similarly, the Connectome Viewer Toolkit [15] sup-         to navigate neurites at different levels of abstraction and also allows
ports the analysis of macroscopic neuronal structures and brain region        multi-criteria sorting. Multi-tier focus-and-context techniques have
connectivity. All of these techniques focus on the high-level connec-         also been used for visualizing large heat maps of genomics data [28].
tivity of entire brain regions and do not operate on the level of individ-    Telea [45] uses extended table lenses and treemaps to display large tab-
ual synapses, which is required for nanoscale connectomics. On a cell         ular data. The system supports multi-column sorting and visually en-
level, the Viking Viewer [2] displays an abstract connectivity graph,         hances the sorting result to allow easily distinguishing different clus-
representing each neuron as a single node. ConnectomeExplorer [5]             ters when the number of sorted elements is high.
also displays connectivity information in an abstract graph, with one
node representing a single neurite. More recently, neuroMap [43] has          3 B IOLOGICAL BACKGROUND
employed circuit wiring diagrams to represent all possible connections        This section introduces the biological background and terminology,
of neurons. All of these methods display neuron connectivity as an ab-        and the data acquisition and processing workflow of our collaborators.
stract network or graph. While this simplifies the visual representation,
it also removes the inherent anatomical and topological information of        3.1 Neuroscience Terminology
neurites, such as their branches, branch positions, or synapse distribu-      The mammalian brain consists of hundreds of billions of intercon-
tion, and does not support the analysis of individual synapses.               nected nerve cells—the neurons. Each neuron processes and transmits
Trees and multi-trees. Neurons and neurites can be represented as             information, mostly as electrical signals, by forming synaptic connec-
topological trees. Consequently, a collection of neurites can be thought      tions with other neurons. A single neuron typically consists of a cell
of as multi-trees or a forest. Synapses between these neurites result         body, several dendrites, and one axon (see Fig. 2). A dendrite is a tree-
in trees that are connected on a synaptic level. A good introduction          like branching structure that receives signals from neighboring cells,
to trees is given in surveys on visualization of trees [39] and multi-        while an axon is a long and narrow tubular structure that transmits
trees [16]. Fitch and Margoliash [14] construct phylogenetic trees            signals away from the cell body towards other neurons. Axons and
Electron
                                                    Segmentation         Skeletonization                        Visual Analysis
                               Microscope

          Mouse Brain

                      Microtome          Registration         Synapse Labeling

Fig. 3: Data processing workflow. After slicing and imaging a block of brain tissue, registration, segmentation, and synapse labeling are
performed. The segmented neurites are then skeletonized, forming the basis for subsequent interactive visualization and analysis in NeuroLines.

dendrites are collectively called neurites. A synapse consists of a pre-      2D to reduce visual clutter, while preserving branching patterns and
synaptic terminal (a bouton) on the side of the axon that releases neu-       relative synapse locations, and to facilitate following synaptic chains.
rotransmitters when activated, a post-synaptic terminal at the side of        Fig. 5 shows an overview of the NeuroLines system.
the dendrite, and the synaptic cleft between dendrite and axon.
   A synapse can either be excitatory or inhibitory, depending on             4.1 Design Considerations
whether a spike on the axon increases or decreases the chance of pro-         The idea of NeuroLines originated in initial meetings with our collab-
voking a spike in the receiving dendrite. Synapses have further dis-          orators where they voiced their dissatisfaction with the lack of neu-
criminating features, such as the position of the post-synaptic termi-        rite visualization approaches that focus on connectivity instead of on
nal (i.e., either on a dendrite’s shaft or on a small extension called a      a complete 3D reconstruction of the segmented structures. Our first
dendritic spine), or the number of vesicles (cell organelles containing       prototype depicted neurite connectivity as an abstract 2D node-link di-
neurotransmitters) in the bouton. However, little is known about what         agram (Fig. 4 (c)). It was included in the ConnectomeExplorer frame-
influences or causes the variability of these attributes, and how they        work [5]. This view allowed our collaborators for the first time to see
impact the function of a neuronal network. Scientists are interested          the connectivity of their data. However, this approach loses spatial
in trends and correlations, and in looking at individual neuronal struc-      relations and knowledge of the branching morphology. Next, our col-
tures, their synapses, and attributes. For example, they want to look at      laborators wanted a combined visualization of the original 3D data and
detailed synapse characteristics to find patterns depending on specific       a simplified 3D graph structure, which they called a “3D subway map.”
axon/dendrite constellations: If an axon makes several connections to         However, after several iterations of such a design (Fig. 4 (b,d)), it be-
the same dendrite, do all their shared synapses look the same? Do             came clear that a 3D approach does not scale to the expected data sizes,
synaptic pathways follow certain excitatory/inhbitory patterns?               and that it leads to nonintuitive and cluttered visualizations, ultimately
                                                                              motivating a novel 2D representation. This 2D abstraction simplifies
3.2    Neuroscience Workflow                                                  the original 3D structure and removes anatomical details. However, it
The data acquisition and processing workflow of our collaborators             retains the most important features for subsequent analysis: topologi-
consists of several steps (see Fig. 3): Starting with a solidified block of   cal structure, connectivity information, and synapse sequence along a
brain tissue (a tiny sample of a mouse or rat brain), they use an ultra-      neurite. Additionally, we always allow users to go back to the original
microtome to cut it into slices of 25-30 nm thickness, which are then         3D volume view from any point in the 2D representation.
scanned with a scanning electron microscope (SEM) to capture image
tiles with a pixel resolution of 3-5 nm. Next, the individual tiles are
stitched and registered to form a single 3D volume with slice resolu-
tions of 20,000 to 100,000 pixels, and thousands to tens of thousands
of slices. In the next step, our collaborators segment and label this
3D volume, using both manual and automatic segmentation tools [24].
Mojo [25] and Dojo [18] are used for proof-reading automatically gen-
erated segmentations. All additional data, such as the locations and
properties of synapses, are currently annotated manually and stored as                                 (a)                         (c)
meta data. The necessary processing steps for importing these initial
data into NeuroLines for further analysis are explained in Sec. 8.1.1.
    Currently our collaborators use several different tools for data anal-
ysis. To support their workflow, we have integrated NeuroLines as a
plug-in into ConnectomeExplorer [5], which is a system for visualiza-
tion and visual analysis of large-scale neuroscience data that supports
interactive visual queries to dynamically explore data. It supports 3D
volume rendering, and offers an abstract node-link diagram to depict
neurite connectivity. For detailed statistical analysis of regions of in-
                                                                                                       (b)                                    (d)
terest in the volume, our collaborators mainly use Matlab.
                                                                              Fig. 4: NeuroLines design prototypes. a) 3D volume rendering of a
4     N EURO L INES D ESIGN                                                   cylindrical region of interest of the segmented data; b) First visualiza-
The main idea of our design is to abstract the complex branching              tion approach in 3D for directly displaying neurite skeletons; c) Ab-
and connectivity pattern of neurites into a simplified representation         stract 2D graph visualization showing the connectivity between neu-
inspired by 2D subway maps. We transform the problem from 3D into             rites, without spatial information; d) First 3D subway map prototype.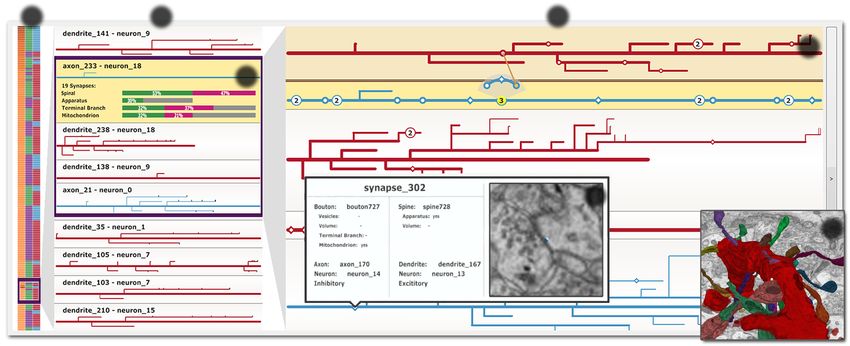
a                    b                                                                      c
                                                                                                                                                 e
                                          d

                                                                                                         f
                                                                                                                                                     g

Fig. 5: NeuroLines overview. We visualize neurites using a multi-scale approach with three tiers of linked views (a,b,c), which provide overview
as well as details. The navigation bar (a) shows individual neurites as lines color-coded according to selected neurite attributes and sorting
criteria. The neurite overview (b) allows inspecting all neurites at a medium level of abstraction. The workspace view (c) allows the inspection
of neurites at a detailed level of abstraction. The neurite analysis (d) shows statistics for a selected neurite. Pinning (e) a neurite to the workspace
allows keeping a specific neurite in focus while exploring others. The synapse analysis (f) shows synapse details and its neighborhood in the
original EM volume. (g) NeuroLines is also coupled with a 3D volume renderer for additional visualization and exploration in 3D.

4.2     Task Analysis                                                        subset of the data. For example, it is interesting to consider only neu-
This section discusses our overall domain goals and present the cor-         rites inside a specific spatial region of interest, or start with only exci-
responding detailed task analysis. These analyses have guided most           tatory axons that were sorted according to their number of synapses.
design aspects of NeuroLines.                                                    T2–Single-neurite analysis. Typically, after selecting a structure
                                                                             of interest, i.e., a neurite, it is explored in more detail before continuing
4.2.1     Domain Goals                                                       with further analysis of connected or nearby structures. This detailed
                                                                             analysis includes examining the neurite’s attributes such as branching
The main objective of our collaborators is to quickly form, test, and        complexity and length, as well as synapse distribution and statistics
accept or reject new hypotheses regarding neuron connectivity. This          over all synapses of a neurite.
includes discovering patterns, exploring a region of interest or subset          T3–Multi-neurite analysis. When analyzing neurites, it is impor-
of the data, and to quickly identify segmentation or labeling errors.        tant to be able to determine relationships with other neurites. Looking
NeuroLines supports the overall goals of neuroscientists to (a) explore      at different neurites concurrently and in the same view allows users to
and identify patterns in synaptic connections; (b) explore and identify      quickly extract patterns like branching structure, connectivity, function
patterns in branching structures; and (c) explore synaptic pathways.         or length, and to compare individual neurites to each other.
   An example of (a) is the analysis of multiple-hit axons and the dis-          T4–Synapse analysis. Synapses are the basic elements that create
tribution of their synapse locations on the post-synaptic dendrite. Sci-     neuronal connections and pathways. Before analyzing the connectivity
entists want to explore the connectivity pattern of where a single axon      on a larger scale, individual synapses have to be analyzed and classi-
connects to the same dendrite multiple times, and see the locations of       fied. For example, the combination of different synapse attributes is
these synapses on the dendrite—and in relation to other synapses of          correlated with the strength of a synapse. It is crucial for the scien-
the dendrite. An example of (b) is the analysis of dendritic synapse         tists to be able to examine individual synapse attributes, to look at the
strength with respect to their distance from the cell body. Synapses         original synapse location, and to navigate to this location in a 3D view.
further away from the cell body are assumed to be bigger, so that the            T5–Connectivity analysis. Following synaptic connections from
signal they send towards the cell body is stronger. Our collaborators        one neurite to another is crucial for further understanding of the under-
also want to analyze the effect of branching on synapse strength. An         lying data. For example, being able to explore a specific axon and all
example of (c) is the identification of recurring connectivity motifs.       its connections to a specific dendrite allows analyzing multiple-hit ax-
Our collaborators look for certain recurring connectivity patterns in        ons and extracting related properties, such as the synapse distribution
the data, such as “inhibitory neuron → excitatory neuron → excitatory        along a neurite, or the strength of synapses on all first-level branches
neuron → inhibitory neuron”. In order to do this, they have to follow        (i.e., the branches directly off of the trunk of the neurite).
synaptic pathways and identify neurons as excitatory or inhibitory.              The mapping of domain goals to tasks is as follows: exploring
                                                                             synaptic connections (a) is supported by tasks T1, T4, and T5; ex-
4.2.2     Domain-Driven Tasks                                                ploring branching structures (b) is supported by T1, T2, and T3; and
We now map our high-level domain goals to analysis tasks that need           exploring synaptic pathways (c) is supported by T1, T3, T4, T5.
to be supported by NeuroLines. We identified these tasks over sev-
eral months of meetings with our domain scientists through semi-             4.3 Scalability Challenges
structured interviews and informal feedback sessions. Initial meetings       Our collaborators are constantly working on increasing the size (i.e.,
were held in bigger groups of several neuroscientists and scientific         the physical extent as well as the resolution) of their data. Therefore,
staff, while detailed discussions were done with individual scientists.      one of our main design goals was to develop a scalable visualization
We have identified the following main tasks:                                 that enables hierarchical navigation through a large set of neurites. To
    T1–Selecting a neurite subset. In addition to a typical “overview        test the scalability of our system, we have implemented a parameter-
first, details on demand” visual exploration scenario, our collaborators     ized neuron simulator (Sec. 8.1.2) that allows us to create synthetic
want the possibility to start their exploratory process with a specific      data for stress testing each of the following scalability challenges: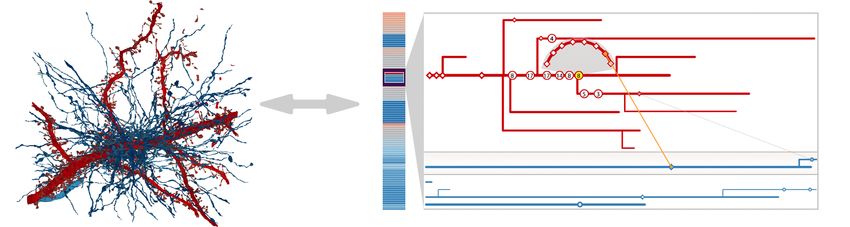
S1–Many neurons. The current data set our collaborators have
scanned is too “small” in physical extent to figure out neuron/neurite
relationships (i.e., which neuron a specific neurite belongs to). The
high resolution of EM results in teravoxel datasets for a tissue block
of only several cubic micrometers. Axons, however, can extend over a
distance of milli- and centimeters. With the rapidly increasing amount
of scanned data, however, we will have access to hundreds if not thou-
sands of segmented neurons over the next few years.
   S2–Many neurites. As the number of segmented neurons in-
creases, the number of neurites will increase even more (by 1-100x).
It will become difficult to navigate through large lists of neurites, and
find structures of interest while still seeing their immediate context.       Fig. 6: Neurite abstraction. We employ different abstraction levels
   S3–Many branches. A neurite can consist of dozens to hundreds              to visualize neurites at different levels of detail. (a) Medium-level ab-
of branches, resulting in very big individual neurites with a potentially     straction showing an overview with collapsed branches. (b) Detailed
confusing branching structure.                                                view (low-level abstraction) with individual synapses shown as dia-
   S4–Many synapses. A neurite can have hundreds of labeled                   monds (spinal) or circles (non-spinal). (c) Synapses overlapping in
synapses, producing a lot of clutter if not reduced by the visualization.     screen space are automatically clustered. Clusters show the number
   S5–Many connections between neurites. As the number of la-                 of contained synapses and can be fanned out to show them in sequence.
beled synapses increases, showing visual links between all connected
neurites becomes infeasible. Moreover, since a neurite can have hun-          attributes (e.g., function, number of synapses), or by the color that was
dreds of synapses, they might connect to neurites that are currently          used for the initial segmentation in the EM volume (Fig. 7). For auto-
outside the subset of the data that is visible on screen.                     matic color-coding, we use sequential and qualitative color schemes.
                                                                              The colors that were chosen manually by the scientists during segmen-
5 V ISUAL E LEMENTS
                                                                              tation are arbitrary. However, the scientists often identify individual
This section gives a high-level overview of the major visual elements         structures via certain colors, and therefore want to be able to use the
of NeuroLines, from the main view comprising a multi-scale view with          same colors in NeuroLines. The navigation bar supports multi-criteria
three different tiers (Fig. 5 (a,b,c)), to the different abstraction levels   sorting of neurites, which is explained in more detail in Sec. 6.1.
of neurites (Fig. 6). We use neurites as our main visual representation
instead of neurons because (a) this is the level of detail for connectivity   5.1.2 Neurite Overview
analysis (i.e., axons connect to dendrites), and (b) currently many of        This view (Fig. 5 (b)) depicts neurites at a medium level of detail in
the neuron-neurite relationships are still unknown in our data.               order to give an overview of neurites, i.e., it shows neurites without
                                                                              the full detail of their branches or individual synapses. Each neurite in
5.1 Multi-Scale, Three-Tier Main View
                                                                              this view is shown with its textual name. Additionally, neurites can be
Fig. 5 depicts the main view of NeuroLines, which consists of a multi-        selected to see summary statistics of their attributes (Fig. 8), which is
scale, three-tier focus-and-context neurite visualization. It comprises       explained in Sec. 7.1.
the following three tiers, which are arranged from left to right:
                                                                              5.1.3 Workspace View
  1. The navigation bar for a high-level overview of the neurite work-        This view (Fig. 5 (c)) acts as the main workspace in NeuroLines, for
     ing set, and for dynamic sorting and navigation.                         detailed analysis of neurites, their branching patterns, synapses and
  2. The neurite overview to get an overview of a subset of neurites,         connections, and for comparing multiple neurites.
     and for inspecting high-level neurite information.                           Each neurite is represented as a horizontal tree that depicts the neu-
                                                                              rite’s complete branching structure and all of its synapses, depending
  3. The workspace view for inspecting individual neurites, branch-           on the zoom level. The view can be zoomed and panned both verti-
     ing patterns, synapses, and synaptic chains in detail.                   cally and horizontally. By default, each neurite is scaled horizontally
                                                                              such that it fills up the available space, while preserving the relative
These views allow simultaneously navigating the data at different ab-         distances of branches and synapses within the neurite. When zooming
straction levels, from overview to detail. Using a three-tier focus-and-      out, the neurite tree visualization is gradually simplified by collapsing
context scheme enables the exploration and analysis of multiple neu-          branches and merging individual synapses into synapse clusters based
rites at the same time, at different scales (T3–multi-neurite analysis,       on the current resolution level and zoom factor.
S2–scalable to many neurites).
    The zoom levels in all views are set automatically, but can be ad-        5.1.4 On-Demand Electron Microscopy Views
justed dynamically by the user. Changing the zoom level adjusts all           A main requirement of our collaborators is that they want to be able
contained elements, and updates the amount of branch collapsing,              to go back to the original 3D data to explore the detailed anatomy of
synapse clustering, and text overlays accordingly. All three views are        the area around a synapse. Therefore, we have integrated on-demand
linked by sliding focus windows that allow drilling down into the data        2D and 3D volume views of the original and segmented EM data that
from left to right (Fig. 5 (a,b,c)).                                          can be activated by clicking on a synapse (Fig. 5 (f,g)). We display a
    We use the concept of a working set to denote the current total set of    small z-aligned 2D slice view that is centered at the x,y,z location of
neurons and neurites that are of interest to the user. The initial working    the synapse in the original EM volume showing the immediate synapse
set is the entire data set, but the embedded visual query language [5]        neighborhood (T4–single synapse analysis). Furthermore, we can au-
can be used to dynamically restrict the working set to the objects re-        tomatically navigate to the synapse in a 3D volume rendering view that
sulting from an interactive query. In this way, NeuroLines supports the       shows the synapse and the segmented axon and dendrite it connects,
“search, show context, expand on demand” interaction metaphor [46].           and interactively explore the entire EM volume in the 3D view.
5.1.1 Navigation Bar                                                          5.2 Neurite Abstraction Levels
This view (Fig. 5 (a)) represents neurites as horizontal, color-coded         To support exploration and analysis at different levels of detail, Neuro-
lines. Users can navigate all neurites vertically, visually identify pat-     Lines employs neurite visualizations with different abstraction levels.
terns, and navigate and drill down into areas of interest.                    The highest abstraction level is used in the navigation bar, where each
   The design and color-coding of this view is inspired by heatmaps           neurite is represented as a single horizontal, color-coded line. Fig. 6
where neurites are color-coded either according to user-chosen neurite        shows the medium and low-level abstraction levels that we provide.
The medium-level neurite abstraction shows an overview of the
neurite in which all but the most prominent branches are collapsed.
This abstraction is used for visualizing neurites in the neurite overview
(Fig. 5 (b)). Additionally, a neurite can be augmented by statistical in-
formation about its synapses (Fig. 5 (d)).
   The low-level abstraction of a neurite retains most details and is
used for visualizing neurites in the workspace view (Fig. 5 (c)). The
specific amount of detail shown depends on the used zoom level.

5.2.1   Computing Abstracted Neurites
To draw an abstracted neurite, we map its 3D skeleton structure to
a simplified, but topologically correct, 2D representation inspired by
subway maps. We preserve all relative distance relations within a neu-       Fig. 7: Neurite sorting and high-level navigation. The current sort-
rite (i.e., distances between synapses/branches, lengths of branches),       ing of neurites is depicted in the navigation bar by color-coding the
but straighten branches to obtain a visualization with clear and straight    sorting criteria according to neurite attributes. (a) Multi-critera sort-
lines (T2–single neurite analysis). We offset branches at right angles,      ing order from left to right: neuron id, function (excitatory/inhibitory),
allowing a direct comparison of horizontal positions between paral-          type (axon/dendrite), no. synapses, assigned neurite color. (b,c) Multi-
lel branches and synapses. Neurites are scaled horizontally to either        critera sorting and color map (left to right: neuron id, type, function).
maximize use of available screen space, or scaled in relation to a se-       (d) Tool tip for a single neurite showing its attributes. (e) Neurites can
lected neurite (Fig. 3, right). We use relative instead of absolute scal-    also be color-coded with a single attribute (no. synapses) regardless
ing because individual neurites can differ in length by several orders       of the sorting criteria. (f) The navigation bar also displays a slidable
of magnitude. This makes an absolute scale useless in most cases.            focus window, which is linked to the neurite overview for navigation.
    Branching. We use a greedy approach to draw the branching struc-
ture of neurites: After drawing the trunk, we iteratively add branches
from right to left, aiming for a compact visual representation. We           workspace (c), pinning neurites of interest (e), selection of individual
avoid screen space intersections of different branches by alternating        synapses (e,f), and joint 2D/3D data exploration (f,g).
the vertical position at which branches are added (either at the top or at
                                                                             6.1   Sorting and Filtering
the bottom). If this does not resolve conflicts, we increase the distance
of branches from the trunk. The current branching level is visually          To deal with a large set of neurons and neurites (S1, S2–scalable to
encoded via thickness and vertical distance to neighboring branches.         many neurons and neurites), we support filtering and sorting opera-
    To prevent neurites with many branches from dominating screen            tions to dynamically find and define subsets of the data.
space, we automatically collapse branches vertically if the height of a         Filtering. For powerful filtering operations, we use the concept of
neurite exceeds the allowed maximum height for the current resolution        a working set, which is determined using the integrated dynamic query
level and zoom factor (S3–scalable to many branches). More specif-           language [5]. By default, the working set is the entire data set. How-
ically, the allowed maximum vertical distance between branches is            ever, dynamic queries allow the user the on-the-fly specification of a
set differently for each resolution level (i.e., overview and workspace      set of objects of interest, such as a specific set of neurites or synapses,
view) and is automatically decreased for each additional branching           that should be analyzed together. This helps narrowing down the anal-
level. If we detect that a branch would exceed the allowed vertical          ysis to the subset of the data that is needed for a specific analysis task
distance, it is automatically collapsed starting with its sub-branches.      (T1–select neurite subset). For example, to examine a specific den-
    Synapses. Synapses are not part of the initial neurite segmenta-         drite, our collaborators specify queries to extract this dendrite, all its
tion skeleton. Therefore, we project their labeled 3D position onto          connected axons, and all dendrites that connect to these axons. This
the corresponding skeleton element and display them as small nodes           significantly reduces the amount of data that needs to be displayed.
on the neurites. This implies that each synapse is displayed twice:             Multi-criteria sorting. The working set can be sorted according
once on the axon, and once on the dendrite. We encode the post-              to multiple criteria or user-specified categorical and quantitative at-
synaptic morphology by displaying spinal synapses as diamonds and            tributes (e.g., neurite function, number of synapses), to facilitate the
non-spinal synapses on a dendrite’s shaft as circles. For scalability to     discovery of high-level patterns in the data. The current sorting is dis-
a large number of synapses (S4–scalable to many synapses) we use             played in the navigation bar and uses a heatmap approach to display
mean-shift clustering to group synapses that overlap in screen space         all sorting criteria in a condensed form where each sorting attribute
into clusters and display each cluster as a single node, displaying the      is shown as its own vertical column (Fig. 7). The individual columns
number of contained synapses. Clustering is based on the horizontal          are arranged from left to right depending on their sorting sequence,
position of synapses and is done for each branch separately. Synapses        with left being the first sorting attribute. Sorting attributes and their
retain their spatial order inside a cluster and can be explored individu-    sequence can be defined in a GUI widget which also shows the color
ally by fanning out the cluster’s elements upon selection.                   map for each attribute. Furthermore, we allow hovering over individ-
    Synapse links. To reduce the amount of visual clutter, we draw           ual entries in the navigation bar to inspect their values in more detail.
visual links (i.e., synaptic connections) between neurites only on-
demand, when hovering over a synapse (S5–scalable to many connec-            6.2   Workspace, Pinning, and Pivoting
tions between neurites). Displaying stubs instead of lines [27] would        To allow users to track their progress and to compare neurites, we use
be a viable alternative to reduce clutter while still indicating connec-     the concept of a workspace, where neurites can be saved and stored
tions. However, in our case a synapse node on a neurite already in-          even when the user goes on to explore different parts of the data set
dicates the presence of a connection. In addition to showing the vi-         (T3–multi-neurite analysis, S2–scalable to many neurites).
sual link of the selected (i.e., hovered) synapse, we also highlight all        Pinning. By pinning a neurite to the workspace (Fig. 5 (e)), it is
synapses between the same two structures. This allows the user to            guaranteed that it stays visible even when the remainder of the view
quickly identify not only the number of shared connections between           changes, thereby allowing comparisons between different neurites.
two structures, but also to examine each synapse in more detail.                Pivoting. By selecting individual neurites in the workspace, we
                                                                             can sort and scale neurites based on this item (i.e., pivot element), and
6   I NTERACTION                                                             easily explore a neurite’s neighbors (T5–connectivity analysis). We
In this section we focus on the interaction features of NeuroLines.          support re-ordering the neurites depending on features such as con-
The overview in Fig. 5 depicts many of the interaction possibilities         nectivity strength, where neurites with many synapses to the selected
that we provide, including multi-criteria sorting (a), the concept of a      neurite are arranged more closely than neurites with fewer synapses.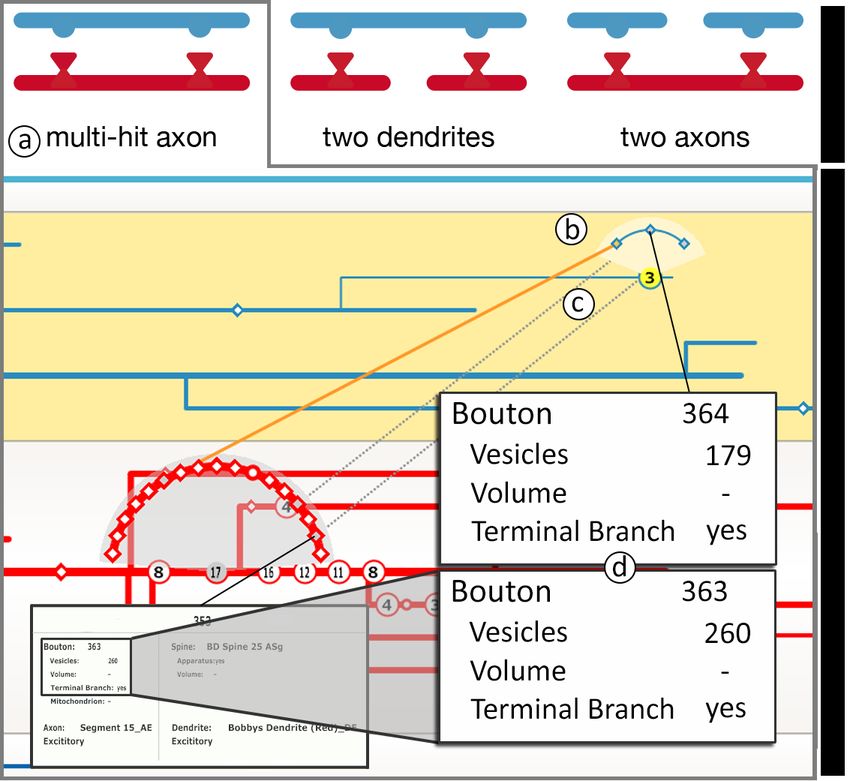
8 I MPLEMENTATION AND E VALUATION
                                                                             NeuroLines is implemented as a plug-in in the ConnectomeExplorer
                                                                             framework. It is written in C++ and OpenGL, and uses Qt for basic
                                                                             GUI and window elements. The application runs on a standard Win-
                                                                             dows PC and requires a recent NVIDIA GPU (Kepler architecture or
                                                                             better) to run the 3D volume renderer. The neuron generator for syn-
                                                                             thesizing data is implemented in Python.
                                                                             8.1 Data
                                                                             In this section, we describe the real-world domain data our scientists
                                                                             have acquired and discuss our neuron generator for simulating large
Fig. 8: Neurite overview and analysis. This view combines a medium-          neuronal networks that can be displayed in NeuroLines.
level abstraction of a neurite with detailed statistics over all of the
neurite’s synapses, e.g., percentage of spinal vs. non-spinal synapses.      8.1.1 Real-World Domain Data
                                                                             The data our domain scientists want to analyze and that serves as input
   Scaling to pivot. In the same manner, we can scale the length of          to our system consists of a collection of segmented and annotated elec-
neurites (the horizontal axis) according to the length of the pivot ele-     tron microscopy slices of brain tissue (e.g., the mouse cortex), forming
ment, to better compare the size, branching pattern, and synapse loca-       a single large 3D volume. Currently, synapses are labeled manually by
tions between multiple neurites (T3–multi-neurite analysis).                 the neuroscientists, but in the future synapses will be labeled automat-
                                                                             ically. In a pre-process, we extract curve skeletons of the segmented
6.3    Connectivity Exploration                                              neurites using 3D medial axis thinning [26] before converting the ex-
One of the main goals of NeuroLines is connectivity exploration and          tracted skeletons into a forest of trees, each tree representing a single
the discovery of connectivity patterns. Ultimately, our collaborators        neurite. Additionally, in this step we also deal with incomplete or in-
want to identify connectivity motifs in their data (e.g., neuronal feed-     correct data, such as wrong segmentations and labeling. An example
back loops). NeuroLines supports this task by allowing scientists to         of this are “island segmentations,” where a segmented structure with
quickly explore the connectivity between neurites manually, but in the       the same ID has several unconnected components, which is biolog-
future we also want to integrate (semi-)automatic motif detection.           ically not possible. However, due to manual segmentation errors or
   Once the user hovers over a synapse, it is displayed as a visual          incorrect automatic segmentation these cases can happen, and there-
link (i.e., connecting line) between the respective synapse locations        fore we represent them as unconnected branches of the same tree.
on both the axon and the dendrite. In addition to highlighting the              In the final pre-processing step we add the labeled synapses to the
currently selected synapse and its connecting line, all other synapses       skeletons by finding the two corresponding skeletons (i.e., the axon
between the same two neurites are displayed as visual links for con-         and the dendrite) and inserting the synapse by orthogonally project-
textual information (Fig. 10 (c)). This allows users to quickly see how      ing the synapse location onto to the nearest skeleton element. Then
many synapses are shared between two neurites and to follow synaptic         we store the generated skeletons as an XML file. When starting up
chains throughout the dataset. Connected structures outside the cur-         NeuroLines, we therefore are able to load the original EM and seg-
rent viewing window can be fetched and moved next to the originating         mentation data with the extracted skeletons and connectivity data.
neurite in a smooth animation. This keeps the current synapse in fo-
                                                                             8.1.2 Synthesized Data for Scalability Analysis
cus, but allows the user to explore the connected structure at the same
time (T5–connectivity analysis, S2, S5–scalable to many neurites and         After discussions with our domain experts we decided that in order
many connections between neurites) . Optionally, the viewport can be         to support future, much larger data, we wanted to be able to evaluate
moved to the neurite in question in a smooth transition.                     the scalability of NeuroLines by using simulated data. Therefore, over
                                                                             the course of several weeks and in close collaboration with our scien-
7     A NALYSIS TOOLS                                                        tists, we developed a simple parameterized neuron simulator that uses
                                                                             domain knowledge to create neuron skeleton structures and synapses.
This section focuses on the analysis features of NeuroLines that sup-
                                                                                 Macro structure: neurons and neuron connectivity. Generat-
port scientists in exploring and validating their hypotheses.
                                                                             ing neurons is triggered by specifying the mean number of neurons
7.1    Neurite Analysis                                                      to be created, using a normal distribution to account for variability be-
                                                                             tween different brains. The neuronal network is generated based on the
The neurite analysis view depicts detailed statistics over all of the neu-   Watts-Strogatz model [47] to create a small-world graph that exhibits
rite’s synapses in an easy to read color-coded stack chart (Fig. 8).         local clustering and the formation of hubs, which has been shown to
This view is integrated into the neurite overview and shown only on-         be useful for simulating biological neural networks [4, 11]. Next, we
demand for the currently selected neurite in the workspace, as depicted      convert the resulting undirected graph into a directed graph by replac-
in Fig. 5 (d). This view allows scientists to see the most important         ing undirected edges with directed edges in a stochastic approach that
statistics of a neurite at a single glance, allowing them to quickly iden-   incorporates our collaborators’ knowledge of neuronal connectivity.
tify trends and patterns. For example, if the function of a neurite              Micro structure: neurites and branching patterns. The num-
(i.e., excitatory or inhibitory) is unknown, scientists can try to infer     ber of axons and dendrites per neuron as well as the neuron’s function
the function based on the percentage of spinal synapses.                     is guided by a stochastic process with underlying domain knowledge.
                                                                             Usually a neuron contains one axon (disregarding segmentation errors)
7.2    Synapse Analysis                                                      and several dendrites, depending on the neuron’s function and type.
To inspect individual synapses in detail, NeuroLines offers a synapse        The individual neurite’s branching pattern is generated by a context-
analysis view that is displayed on-demand. This is triggered by click-       sensitive, stochastic L-system, that is parameterized based on feedback
ing on a synapse in the workspace view. This view displays all at-           from the neuroscientists and knowledge of different branching patterns
tributes of the synapse, including information about the pre-synaptic        in different neurites (e.g, excitatory axons are longer but exhibit less
bouton and the post-synaptic terminal. Additionally, it offers a 2D          branching than inhibitory axons). Other systems have already success-
slice view and a linked 3D volume view centered around the synapse,          fully used L-systems to simulate artificial neural structures [3, 13].
which are shown in Figs. 5 (f,g). This allows scientists to confirm              Connectivity: Synapse generation. Synapses are generated based
synapse attributes and look for additional distinguishing features. The      on several factors, most importantly neuron function, the number of
case study in Sec. 9.1 is one example of how synapse analysis can help       simulated connected neurons, the size and branching pattern of the
answer domain-specific questions.                                            current neurite, and a user-set parameter to specify synapse density.
Fig. 9: Performance and scalability evaluation. We have measured              Fig. 10: Case study 1: Synapse variations. Our collaborators focused
frame rates for different data sets and different kinds of user interac-      on multiple-hit axons (a) as neurite connectivity pattern. Subsequent
tions. Data sets 1-4 were generated for testing our system against            exploration of the red dendrite D1 and one of its synapses (b) shows
the scalability challenges (DS1: S1,S2–many neurons, many neu-                that it makes three synapses with the blue axon, displayed as visual
rites; DS2: S5–many connections between neurites; DS3: S3–many                links between the neurites (c). Looking at the detailed synapse at-
branches; DS4: S4–many synapses per neurite). Frame rates are for             tributes (d) allowed our collaborators to form initial hypotheses about
user idle, workspace interaction (inter.), horizontal scaling (horiz. S.),    the connectivity of multiple-hit axons.
stress horizontal scaling test (SHST), multi-tier navigation (nav.), and
stress navigation test (SNT). Standard interaction is always interac-         sented here were performed by a developmental neuroscientist with
tive (28-140 fps). During multi-tier navigation, frame rates are lower        several years of experience in connectomics research and are typical
(17-110 fps) due to the dynamic layout computation and synapse clus-          examples of exploratory data analysis, where the scientists adjust and
tering. However, even during very fast multi-tier navigation (SNT)            modify their original hypotheses as they advance in their analysis.
frame rates are still interactive (5-107 fps).                                   The main data set of our primary collaborators used in these cases
                                                                              is an electron microscopy volume of roughly one teravoxel in size (8-
8.2    Scalability Evaluation                                                 bit voxels; 955 GB). The binary segmentation volume, from which
We have evaluated the scalability of our system by using synthetic data       we computed the neurite skeletons, was given in a volume of half the
with different numbers of generated neurons, neurites, branches, and          resolution in x and y (24-bit voxels; 716 GB), and contains roughly
synapses. Generating a data set with thousands of neurites takes sev-         4,000 segmented objects (i.e., axons, dendrites, and individually la-
eral seconds. The rendering of NeuroLines remains interactive, even           beled dendritic spines). In addition to this, the scientists have labeled
with more than 50,000 neurites, because we only draw elements inside          943 synapses with roughly a dozen detailed attributes such as the num-
the viewing window. The high-level navigation bar uses a mipmap-              ber of vesicles at the synapse or the spine/shaft location.
based approach for rendering, reducing the resolution of the data be-
fore drawing, when necessary. Detailed frame rates are displayed in           9.1   Case Study 1: Relating Variations in Synapse Struc-
Fig. 9. Feedback from the scientists tells us that this number is suffi-            ture to Neuron Connectivity
cient, because for larger data they will always filter the data to a subset
of interest, using the query algebra, or start with a single object of in-    This case study was driven by a research question one of our collab-
terest and continue from there. This filtering step is crucial for system     orators is working on: “How much of the variance in the structure of
usability because it ensures that user interaction maintains effective by     synapses can be explained by the connectivity of neurons?” Neuronal
limiting the amount of data that needs to be displayed.                       connectivity can be thought of in two different ways: a) Who does a
   We tested branching scalability by generating neurites with up to          neuron speak to (i.e., to which other neurons does it connect)? b) How
1,000 branches. Automatic collapsing and expanding of branches                loud does it speak (i.e., how often does a synapse fire, and how strong
works fine up to ten levels of sub-branching. If that number is ex-           is its electrical signal)? With today’s high-resolution EM data sets it
ceeded, sub-branches are often collapsed in the detail view which led         is possible to look at both of these attributes at the same time. While
users to manually expand sub-branches for exploring them in high-             the first attribute can be analyzed by looking at the topological con-
est detail. In the future, we want to allow detaching sub-branches of         nectivity graph, the second part (i.e., how loud a neuron speaks) is not
interest from the main neurite, to explore them in more detail with-          as easy to evaluate. Several attributes influence the strength of neural
out cluttering the view with unimportant branches of the same neurite.        connections, such as the number of vesicles near a synapse, the area or
The maximum number of synapses is currently only limited by the               length over which two neurites touch, whether a neurite is excitatory
clustering mechanism. If more than 25 synapses are combined into a            or inhibitory, as well as the neurite’s circumference and the spacing
single cluster, synapses within this cluster should again be partitioned      of synapses along a neurite. In this case, the neuroscientist analyzed
into sub-clusters to avoid visual clutter.                                    the variance of specific synapse attributes of different connectivity pat-
                                                                              terns or motifs. He compared synapse attributes of multiple-hit axons
                                                                              (e.g., axon A that makes several synapses with the same dendrite B)
9     C ASE S TUDIES                                                          to attributes of single-hit axons (e.g., different axons that connect to
We demonstrate the utility of NeuroLines based on two evaluation              dendrite B) to attributes of all non-multiple-hit synapses of axon A
cases taken from user sessions of our collaborating neuroscientists           and/or dendrite B. Fig. 10 shows a screenshot of the on-going analysis
where they wanted to explore specific research questions. During the          of neurite connectivity patterns. This initial exploration led our col-
entire development and evaluation phase we regularly held meetings            laborators to discover new rules in synapse connectivity, which they
with junior and senior level neuroscientists and scientific staff. Two        subsequently statistically analyzed. Here we give a general overview
of them are also co-authors of this paper. Both evaluation cases pre-         of how the scientist used NeuroLines to reach his particular goal.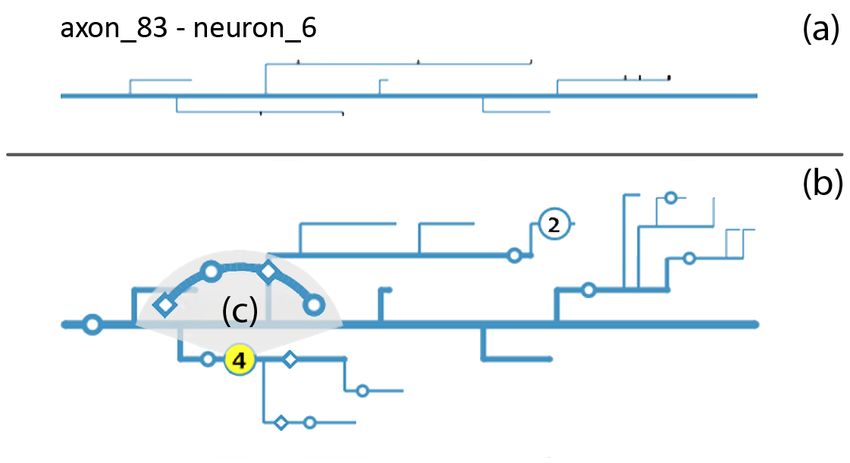
First, he explored the entire data set, sorted all neurites depending    10    D ISCUSSION
on neurite type and the number of synapses, to narrow down on a first        The main qualitative feedback that we received from our collaborators
structure of interest (i.e., dendrite D1). Using a visual query, the data    matches our initial intuition: Abstracting the complex and cluttered
set was reduced to only include dendrite D1, all its connected axons,        3D connectivity patterns into an easy-to-navigate 2D metaphor makes
and all dendrites these axons connect to. Next, the scientist analyzed       it easier to find patterns in the data, but the link to the original 3D data
the detailed connectivity patterns, starting from dendrite D1. An initial    is still crucial for the scientists. Overall, the scientists felt that their
analysis of the attributes of all synapses of this dendrite did not reveal   analysis tasks were well supported, and they specifically underlined
any apparent patterns. Therefore, the scientist first identified several     the added utility of integrating NeuroLines into a larger framework for
multi-hit axons connected to dendrite D1 (Fig. 10), and then analyzed        visual analysis of connectomics data. The best proof of the usefulness
only the synapses between these axons and dendrite D1. Some of the           of NeuroLines we got by observing our main collaborator. Whenever
attributes that the scientist looked at were given as scalar values (e.g.,   we showed him a new version of the software he would get an abun-
spine volume), while for other attributes (e.g.,“closeness” of both neu-     dance of new hypotheses that he then wanted to verify or refute. He
rites around the area of the synapse) the integrated 2D and 3D views         often started with an initial hypothesis but then discovered another in-
of the original EM data were used. This allowed the scientist to further     teresting pattern that he went on to investigate. This quick turnaround
narrow down his analysis process and to slightly adjust and refine his       time of forming and evaluating hypotheses was not possible in our col-
hypothesis. When he was sufficiently sure of his findings he handed          laborators’ previous workflow and is exactly what we wanted to enable
the data over to a statistician to conclude the analysis. Our collabora-     with NeuroLines. One initially unforeseen, but very useful, feature of
tor was able to perform this analysis in NeuroLines within 2–3 hours,        NeuroLines is proof-reading segmentation data. Immediately when
after having received two introductory sessions to our system that both      using the tool, our collaborators would spot and identify segmentation
took roughly thirty minutes. Individual analysis steps usually took him      and annotation errors in their data that they had missed before.
between several seconds (for quickly rejecting initial hypotheses) up            The main limitation of NeuroLines with respect to analyzing
to 30 minutes (for narrowing in on an hypothesis, using the dynamic          nanoscale neuronal connectivity is the relatively limited amount of
queries and then methodically working through the resulting neurites         data our collaborators have acquired until now. Although they have
to check the validity of his hypothesis).                                    acquired terabytes of electron microscopy data, their current segmen-
                                                                             tation and synapse labeling process is at best semi-automatic and needs
9.2   Case Study 2: Relating Variance in Synapse Structure                   a lot of manual input. Therefore, we have evaluated NeuroLines with
      to the Branching Structure of Excitatory Dendrites                     large synthesized data, and asked our collaborators to navigate within
                                                                             the data set, and to try to find patterns as they would do it in real data.
In this case study, our collaborator evaluated the branching structure       However, this form of scalability testing is still only an approximation
of excitatory dendrites and how this branching structure influences the      of the actual visual analysis of larger data sets in the future.
attributes of synapses along the neurite. A neurite usually gets smaller         We believe that NeuroLines successfully addresses the scalability
and narrower at every branching level, meaning that the main trunk of        issues present in today’s large-scale connectomics data sets, and that
a neurite has a diameter that is significantly larger than the diameter      our work will also be useful for designing future frameworks for visual
of, for example, a sub-branch of a branch of the trunk. The main             connectomics. The combination of abstract information visualization
question of the scientist was how much of the variance in the structure      views geared towards analyzing data in an efficient and intuitive way,
of synapses could be explained by (a) their absolute distance from           and traditional volume visualization techniques for exploring the orig-
the cell, and (b) the branching level from the cell. The fundamental         inal electron microscope volume and its segmentations, creates a pow-
scientific question behind this is related to how neurons regulate when      erful visualization suite that supports different but equally important
a cell fires and when not. Does every vote (i.e., every synapse on the       needs of domain scientists that want to explore large, complex data.
dendrite) have the same influence, even though some synapses have a
much larger distance to the cell body than others?                           11    C ONCLUSIONS      AND   F UTURE W ORK
   To analyze synapse attributes in relation to the branching pattern        NeuroLines significantly improves the current workflow of neurosci-
of excitatory neurites, our collaborator started by identifying excita-      entists by allowing them to quickly form and test hypotheses in their
tory neurites. When the function of a neurite is unknown, analyzing          overall goal of finding out how the brain works. It enables scientists to
the number of spine/shaft synapses gives an intuition for whether the        focus on the connectivity of individual neurites by representing neu-
neurite is excitatory or not. The scientist evaluated synapse properties     rites in a subway map-inspired 2D visualization that removes the clut-
close to the cell body in comparison to synapses far away from the cell      ter and complexity of the detailed spatial representations of neurites,
body (but on the main trunk), and to synapses on far away branches.          while keeping the topology and important spatial cues intact.
In this particular case, the study was inconclusive and led him to ac-           We think that the design decisions made while developing Neuro-
quire a bigger data set that will allow him to repeat this analysis with     Lines will be useful to developers of future visual connectomics or
synapses spread out over a longer distance along a dendrite.                 large-scale visualization applications and, furthermore, argue that our
   Prior to using NeuroLines, the above analysis would have taken our        neurite visualization metaphor could be applied in more general cases
collaborator several hours, if not days to accomplish. He would have         of visualizing interconnected topological trees.
started by looking at 2D slices of the segmented EM data set and man-            In the future, with the arrival of larger data sets, we would like to
ually navigate to the locations of synapses, as they were listed in a        incorporate an additional level of abstraction into our visualization,
separate .csv file, to form an initial hypothesis. This step alone is te-    making it possible to analyze the connectivity patterns between entire
dious, error-prone, and very frustrating. He would then explain his          brain regions. Another interesting path for the future is the compara-
hypotheses to statisticians working in the same lab, who would pro-          tive analysis of several data sets in a single visualization. For example,
gram Matlab scripts to try to extract all the necessary information from     our collaborators would like to compare the detailed connectivity pat-
the data to confirm or refute the theory. In many cases, however, the        terns of the brain not only between different specimen of the same
statistician would find some suspicious outliers or errors in the data.      species, but also between different species, such as a mouse and a
For the scientist this means going back to the 2D slice visualization,       monkey. Devising new visualization methodologies that allow scien-
manually navigating to the area the statistician had identified and fix-     tists to quickly see the differences and similarities in the connectomes
ing the labeling or meta data, before starting the entire process again.     of different species would enable interesting new research directions.
Using NeuroLines, this previous workflow is significantly sped up and
simplified. Scientists can directly test and adjust their hypotheses in      ACKNOWLEDGMENTS
a single integrated system that allows them to identify errors directly      This work was partially supported by King Abdullah University of
during their analysis. Only once the scientist is sufficiently sure about    Science and Technology, NSF grant OIA-1125087, the NIMH Silvio
the hypothesis, the data is given to statisticians for detailed analysis.    Conte Center (P50MH094271) and NIH grant 5R01NS076467-04.
You can also read