How can social media analytics assist authorities in pandemic-related policy decisions? Insights from Australian states and territories - Research ...
←
→
Page content transcription
If your browser does not render page correctly, please read the page content below
How can social media analytics assist authorities in pandemic-related
policy decisions? Insights from Australian states and territories
Tan Yigitcanlar ( tan.yigitcanlar@qut.edu.au )
Queensland University of Technology https://orcid.org/0000-0001-7262-7118
Nayomi Kankanamge
Queensland University of Technology https://orcid.org/0000-0002-4529-7042
Alexander Preston
Queensland University of Technology
Palvinderjit Singh Gill
Queensland University of Technology
Maqsood Rezayee
Nangarhar University
Mahsan Ostandnia
Islamic Azad University
Bo Xia
Queensland University of Technology https://orcid.org/0000-0001-7694-4743
Giuseppe Ioppolo
University of Messina https://orcid.org/0000-0003-0262-8435
Research Article
Keywords: COVID-19, pandemic-related policy, social media analytics, crowdsources data, urban informatics, Australia
DOI: https://doi.org/10.21203/rs.3.rs-45845/v1
License: This work is licensed under a Creative Commons Attribution 4.0 International License. Read Full License
Page 1/19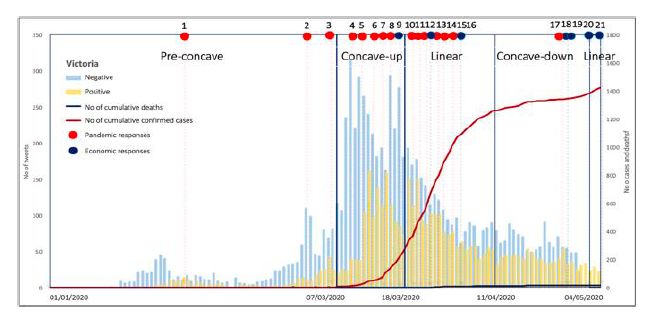
Abstract
Background and objectives: Due to COVID-19, various countries introduced lockdowns and limited citizen movements. These restrictions triggered
an increased use of digital technologies and platforms by the public. This provides an opportunity for the authorities to capture public perceptions
on COVID-19 from social media channels to make informed decisions. The use of social media analytics during pandemics for decision-making,
however, is an understudied area of research. Thus, this study aims to generate insights into how social media analytics can assist authorities in
pandemic-related policy decisions.

Methods: This study involved a social media analysis approach—i.e., systematic geo-Twitter analysis—that contains descriptive, content,
sentiment, and spatial analyses. Australian states and territories are selected as the case study context for the empirical investigation. This study
collected 96,666 geotagged tweets (originated from Australia between 1 January and 4 May 2020), and analysed 35,969 of them after data
cleaning.

Results: The ndings disclose that: (a) Social media analytics is an e cient approach to capture the attitudes and perceptions of the public during
a pandemic; (b) Crowdsourced social media data can guide interventions and decisions of the authorities during a pandemic, and; (c) Effective use
of government social media channels can help the public to follow the introduced measures/restrictions.

Conclusion: The ndings are invaluable for authorities to understand community perceptions and identify communities in needs and demands in a
pandemic situation, where authorities are not in a position to conduct direct and lengthily public consultations.

Introduction
Human-beings have witnessed many pandemic events with catastrophic impacts on the health and socioeconomic wellbeing (Qiu et al., 2017;
Reshadat et al., 2019a). Yellow fever outbreak, cholera, plague, tuberculosis, Spanish u, Ebola, AIDS, in uenza, and West Nile disease are among
some notable examples of pandemics (Saunders-Hastings & Krewski, 2016).

Since the 80s, the globalisation process of the world has increased the threat of diseases as well as accelerated the spread of novel viruses
(Tumpey, et al., 2005). The latest one, the novel coronavirus (SARS-CoV-2) has been spreading globally since its outbreak and rapid transmission in
late 2019 in Wuhan, China. World Health Organization (WHO) termed the infection as COVID-19, and declared the outbreak as a pandemic in March
2020 (WHO, 2020).

As of 1 July 2020, the global COVID-19 cases have reached to 10,574,637 infected people, and 513,144 deaths (Worldometer, 2020). Besides the
global health implications (Zhang et al., 2020), the COVID-19 outbreak has also had global socioeconomic and behavioural impacts. The pandemic
has in uenced human behaviours in a way that resulting in panic and over buying, and non-compliance with government restrictions (Ling &
Chyong Ho, 2020). On the other hand, the economic impact of COVID-19 is also immense as many national economies are in recession, and this
will likely lead to a global nancial crisis down the track (Daneshpour, 2020).

In efforts to curb the pandemic, numerous scienti c clinical trials and medical research have been undertaken, including the development of
vaccines to treat the disease. Non-clinical measures—mainly the government interventions, e.g., social distancing policies, self-isolation,
quarantines, movement control, travel restrictions, and lockdowns—are also adopted to control the further spread of COVID-19 (Honey-Roses et al.,
2020).

The outbreak of COVID-19 has had a profound impact on the transport and mobility, where restrictions on travel and social gatherings have been
announced to limit the spread. For instance, as of 21 April 2020, the average mobility via public transit, on-foot, bike, and personal vehicles
decreased to less than 10% in Vienna, London, New York, Madrid, Moscow, Singapore, and Milan (Statista, 2020). In addition, home-based o ce
and online education became other salient features of the global pandemic period (Jones et al., 2020). This has turned our homes into a mixed-use
place with home schooling space for the kids and work from home space for adults (Shenker, 2020).

Meanwhile, the lockdown also exhibited an extraordinary demand for e-commerce for daily necessities and activities—e.g., groceries, medicines,
clothes, ready foods. This has triggered an increased use of digital technologies and platforms, including social media, by the public. The
increased data, via social media channels, generates an opportunity for authorities to bene t from such crowdsourced information to capture
public perceptions to make well-informed decisions.

Especially over the past decade, social media has become one of the major data sources for academic research (Alzahrani, 2016; Brooker et al.,
2016), government departments, private and not-for-pro t organisations, and individuals (Sebei et al., 2018). Besides, social media analytics can
also bene t government authorities by capturing public opinions on and extracting relevant messages regarding the COVID-19 pandemic.

This paper aims to generate insights into how social media analytics can assist authorities in pandemic-related policy decisions that are needed to
ease or control pandemics. To achieve the research purpose, the study undertakes a social media analysis of geotagged tweets originated from
Australian states and territories between 1 January and 4 May 2020.

                                                                     Page 2/19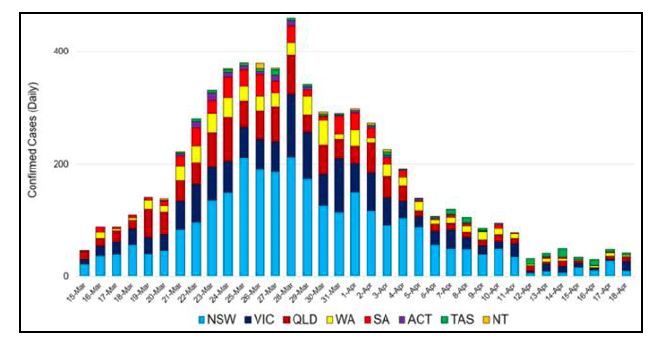
Literature Background
Epidemic and pandemic

An epidemic is an outbreak of a disease that is not anticipated but spreads quickly and affects many people. It may particularly have a bigger toll
on the underprivileged populations (Reshadat et al., 2019b). An example of epidemic would be the 2013-2016 Western African Ebola virus epidemic
that took about 11,310 lives (Chowell et al., 2015). An outbreak can occur in a community, geographical area or several countries. In an epidemic,
symptomatic cases are the predominant focus of treatment and usually represent the bulk of reported cases. Nonetheless, infected individuals who
are asymptomatic yet infectious can be a critical factor in the spread of some pathogens (Fraser et al., 2004).

A pandemic is a type of epidemic that relates to geographic spread and describes a disease—e.g., COVID-19—that affects an entire country,
continent or most parts of the world. An epidemic becomes a pandemic when it spreads over signi cant geographical areas and affects a large
proportion of the population. A pandemic: (a) Affects a wider geographical area, and often worldwide; (b) Infects a larger number of people; (c) Is
often caused by a new virus or a new strain of virus that has not circulated within people for a long time; (d) Is where people have little to no
immunity against the virus and it spreads quickly; (e) Causes more deaths, and; (f) Often creates social disruption and economic loss. Examples of
past pandemics include the Flu pandemic of 1968, HIV/AIDS pandemic, and Bubonic plague. The terms pandemic and epidemic are not used to
indicate the severity of the disease, they only indicate the degree at which the disease is spreading (Rochester Regional Health, 2020).

Stages of a pandemic spread

Pre-concave

The rst stage (Stage 1) of the spread of a pandemic disease, e.g., COVID-19, is the pre-concave stage. This is when infected people travelled from
affected countries into other countries. In Stage 1, only those who have travelled abroad test positive for the disease. The disease does not spread
locally at this stage (Bharat, 2020).

Some of the interventions at this stage, in the case of COVID-19, include: (a) Activating border measures; (b) Contact racing; (c) Cancel mass
gatherings of people; (d) Staying at home if sick and have the symptoms; (e) Intensive testing for the virus, and; (e) Physical distancing
encouragement (Wade, 2020).

Concave-up

The second stage (Stage 2) of the spread of a pandemic disease is the concave-up stage. This is the stage when local transmission occurs and its
sources—e.g., originally infected patients who possibly had travel history to other already affected countries, are known and can be located. They
would have come in close contact with the patients in situations such as family get-togethers, or occasions, where many people gather like in
weddings and parties (Bharat, 2020). At this stage the virus might be contained, but the risk of community transmission still grows, and the number
of new cases show increase.

Some of the interventions at this stage, in the case of COVID-19, include: (a) Maximising entry border measures; (b) Further restrictions on mass
gatherings; (c) Physical distancing on public transport; (d) Limiting non-essential travels around the country; (e) Employer begin alternative ways of
working—e.g., working from home, shifts, and so on; (f) Activating business contingency plans, and; (g) Remaining at home for people—particularly
high risk groups (Wade, 2020).

Linear

The third stage (Stage 3) of the spread of a pandemic disease is the linear stage. At this stage, transmission rate of the disease has become stable
—in other words, the number of new cases stay the same or change in a smaller variation in the linear stage.

Some of the interventions at this stage, in the case of COVID-19, include: (a) Traveling in areas of community transmission is limited; (b) Affected
educational facilities closed; (c) Mass ways of working required and non-essential businesses are closed; (d) Non-face-to-face primary
consultations; (e) Elective surgeries and procedures deferred, and; (f) Healthcare staff are reprioritised (Wade, 2020).

Concave-down

The fourth stage (Stage 4) of the spread of a pandemic disease is the concave-down stage. At this stage, the transmission rate of the disease
shows a decline—in other words, the number of new cases decrease.

Some of the interventions at this stage, in the case of COVID-19, include: (a) Staying at home; (b) Closing educational facilities; (c) Closing all non-
essential businesses; (d) Rationing of supplies and requisitioning of facilities; (e) Severe travel restrictions, and; (f) Major reprioritisation of
healthcare services (Wade, 2020).

                                                                      Page 3/19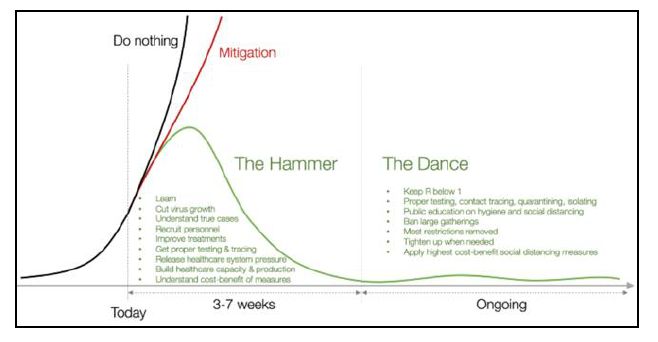
Global suppression measures

Flattening the curve

During a pandemic situation, a tall and skinny curve of infected people to date is highly undesired (Fig. 1). This means a lot of people will get
infected at once in a short period of time, because inadequate actions have been undertaken to prevent the disease from spreading. While most
people might not get sick enough to be hospitalised, those who do could easily overwhelm the number of beds, equipment and healthcare staff
available (Gavin, 2020).

For instance, in the case of COVID-19, to this point, Australia has been highly successful in attening the curve. The number of daily new COVID-19
cases in Australia is comparatively low (Fig. 2). This means, thus far, the spread of COVID-19 has been slowed down and Australian has built a
capacity in the health system to manage the impact of SARS-CoV-2. Nevertheless, the ultimate success depends on following government
directives and maintaining the new community norm—e.g., social distancing, good hygiene practices, and using the COVIDSafe app (Hu, 2020). As
for the businesses, this also means taking the time to prepare and develop a plan to operate in a COVID-19 safe way to protect customers and
employees (Department of Health, 2020a).

Hammer and dance

The hammer: In a pandemic situation, it is crucial to act quickly and aggressively. Hammering a pandemic, e.g., COVID-19, within a few weeks
means it is controlled, and authorities are in much better shape to address its disruption. Applying a heavy hammer with strict social distancing
measures can help immensely in controlling the outbreak within weeks (Pueyo, 2020).

The dance: According to Pueyo’s (2020) graph, during the dance and in the case of COVID-19, it is crucial to go through the isolation and social
distancing, ban large gatherings, test people properly, and also tighten up restrictions when needed.

The dance R: Some countries/cities/regions can experience outbreaks again, others may not for long periods of time. Depending on how cases
evolve, it is needed to tighten up or relax social distancing measures. That is called the ‘Dance of R’, which is a dance of measures between getting
our lives back on track and spreading the disease—e.g., balancing economic and health measures and outcomes (Fig. 3). During the hammer, the
goal is to get R as close to zero, as fast as possible, to quench the pandemic. Once it moves into the dance, it is not need to be done anymore. The
goal is to bring down the R value below 1 (Pueyo, 2020).

Social media analytics

Social media analytics are started to be used in the health sector these days. During the past decades, social media has redesigned the
relationships in communities without any commercial objectives (Kankanamge et al., 2019). People become more expressive in social media than
face to face direct discussions. Hence, the use of social media data for opinion mining, topic modelling, and sentiment analysis could bene t
policy- and decision-makers to understand true public interest about health-related issues.

For instance, social media analytics were used to increase the e ciency of the health sector in different ways (Paul & Dredze, 2014). Some of the
examples include: (a) Predictions-related to non-contagious diseases, e.g., heart disease mortality using psychological language used in tweets
(Eichstaedt et al., 2014); (b) Predictions-related to contagious diseases, e.g., the use of tweets to evaluate the disease activity and the US public
perceptions during the in uenza H1N1 pandemic (Signorini et al., 2011); (c) Governance in health, e.g., adapting social media in local health
departments (Harris et al., 2013); (d) Awareness raising, e.g., health information dissemination through social networks (Scanfeld et al., 2010); (e)
Study on non-healthy addictions, e.g., college student’s addiction to alcohol using Facebook and Twitter posts (Moreno et al., 2016); (f) Student
education in the health sector, e.g., importance in introducing social media analytics to nursing curriculum (Jones et al., 2016), and; (g) Healthcare
professionals-related issues, e.g., women in the health sector (Devi, 2015). Nevertheless, the use of social media analytics to increase the e ciency
of community centric policy decisions during a pandemic is still an understudied area of research.

Research Design
An empirical investigation is undertaken to answer the research question—How can social media analytics assist authorities in pandemic-related
policy decisions? The investigation will help in understanding the behavioural tendencies of Australia’s states and territories during the COVID-19
pandemic. The research steps include determining the case study, identifying the methodological approach, collection of data and execution of the
analysis.

Case study

Australia is a suitable country to investigate the research question empirically for the following reasons. Australia is an advanced nation with a
diverse culture that adapts the technological trends of the world, with the largest being, social media (Cowling, 2020). In 2018, 79% of Australian’s
used social media and the average number of internet-enabled devices owned is 3.5 (Sensis, 2018). Like the rest of the world, Australia has been

                                                                      Page 4/19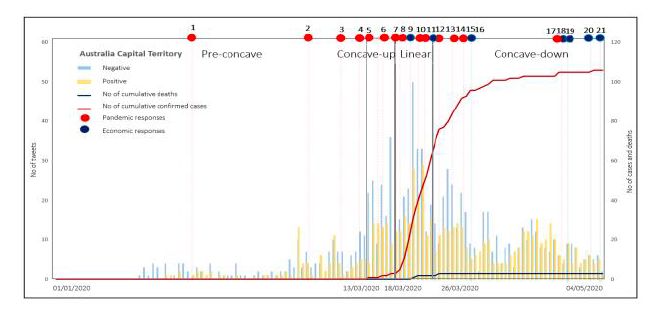
facing the COVID-19 disruption across all states and territories, adapting to social distancing restrictions, and altered ways of life to stop the
spread. Between 1 January and 4 May 2020, Australia had a total of 6,849 con rmed cases of COVID-19 and 96 related deaths (Australian
Government, 2020a)—as of 1 July 2020 these gures have reached to 7,836 and 104 respectively. The states and territories with the most
infections are coherent with population numbers, descending from NSW to VIC, QLD, WA, SA, TAS, ACT and NT. Outbreaks have occurred in each
state and territory in different ways, mostly relating to overseas travel/visitors. The largest outbreak occurred on the Ruby Princess cruise ship,
which docked in Sydney allowing its passengers to leave (NSW Government, 2020).

Methodological approach

In the digital age, that is upon us, local community perceptions and suggestions about the changes happen in and around their environment are
well re ected through social media messages (Faasse & Newby, 2020). A thorough analysis of such social media data will help to understand the
community demands, issues, and re ections (Kankanamge et al., 2019; Yigitcanlar et al., 2020a). Accordingly, this study analysed geotagged
Twitter social media messages circulated by the general public related to COVID-19 in Australia. Twitter has become the fastest growing social
media platform source in the world. It also offers an Application Programming Interface (API) to researchers and practitioners to conduct analysis
—such as the one undertaken in this study.

Data and tools

An ethical approval was obtained to obtain and analyse the social media posts of the Australian public. The rst step, after the ethics clearance, in
the methodology was a document survey to identify the actions taken by the Australian Governments (federal and state/territory) in response to
the COVID-19 pandemic. This involved a collection of o cial government health department documents on COVID-19 in Australia—e.g., Pandemic
Health Intelligence Plan at the federal level, and the Queensland Whole-of-Government Pandemic Plan at the state level. Such o cial documents
were screened to identify 128 keywords to obtain/download related Twitter posts (a.k.a. tweets).

The second stage of the data collection involved the extraction of relevant Twitter information in the form of tweets. This is considered ‘open data’
and is publicly available to anyone. Tweets were extracted from the Digital Observatory of the Queensland University of Technology (QUT)
(www.qut.edu.au/institute-for-future-environments/facilities/digital-observatory). Only the geotagged tweets were obtained as the locations of
these posts were important for the analysis/study. Initially 96,666 geotagged tweets were collected using over pre-identi ed keywords related to
COVID-19 symptoms, behaviours, precautions, and services. Some of the examples of symptom-related keywords include the text such as fever, u,
fatigue, cough and temperature. Examples of behaviour-related keywords include the text such as social distancing, isolation, quarantine, bored
and working from home. Examples of precaution-related keywords include the text such as facemask, hand sanitiser and cover mouth. Examples
of service-related keywords include the text such as health workers, salute and real heroes.

The third step is to clean the data. This procedure began with a data pre-processing stage, involving the removal of automated messages,
irrelevant messages and URLs. The removal of these items was conducted using Arthur et al.’s (2018) process. The rst of these was to remove
automated messages with bot ltering, which discarded automated Twitter accounts that produced a high volume of tweets, affecting the data.
The second step was relevance ltering, removing irrelevant tweets that contained keywords from the word bag (e.g., “the temperature is very high
today”). The last was to remove URLs, which separated the URLs from the tweets so that a further analysis on the content of the URLs could be
conducted. Excel software was used for the data cleaning processes. After ltering 35,969 geotagged tweets were selected to conduct the
sentiment analysis. For this analysis an open access software for machine learning and data mining, known as WEKA, was employed—a software
with a collection of visualisation tools and algorithms for data analysis and predictive modelling.

The fourth step in this process was to create a word bag to identify the community sentiments based on the ltered tweets. Accordingly, words
such as dying, dead were classi ed as negative and the words, which express positive emotions such as enjoy, and happy were classi ed as
positive sentiments. In total, 1,183 words were used for this analysis; 588 of them with positive, and 595 with negative sentiments. Examples of the
word bags developed based on the analysed tweets are given in Table 1.

Table 1 Word bag examples
 Word       Example
 bag
 Positive   Adapt, best, better, cure, defeat, distance, discharge, exercise, facemask, fight, fun, handwash, healing, help, homedelivery, good, glad, great, hope, immunity, informative, joy, love, prepare,
            productive, protect, recover, release, safe, safety-first, stable, save, security, stay-home, support, survive, saving, treat, thank, vaccine, wash, well, welfare, win, wish, wonderful.
 Negative   Abuse, apocalypse, angry, anxiety, bad, catastrophic, contract, cough, crisis, danger, dead, death, delay, die, disgusted, disease, ebola, emergency, fail, fever, fighting, fired, hazard, homeless,
            hurt, infect, kill, outbreak, pain, problem, recession, respiratory, resist, regret, scare, sick, stress, stupid, violence, victim, vulnerable, waste, worry, wtf.

The nal step is to identify the frequently used words in each sentiment category. Accordingly, the frequently used words were identi ed by each
state by each sentiment category. For this NVivo software was utilised—a qualitative data analysis software package.

Results
                                                                                                  Page 5/19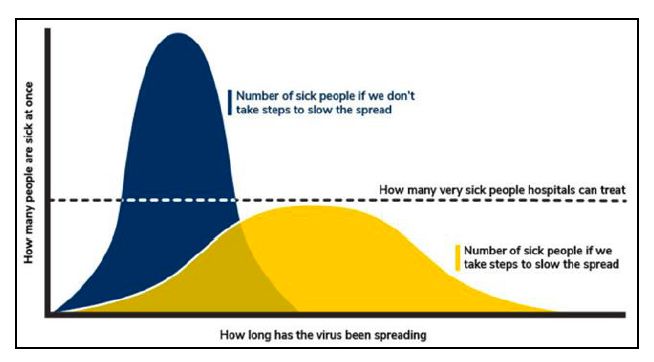
General observations
Out of 35,969 geotagged tweets analysed, about 63% were negatively classi ed, and almost 37% were positively classi ed. Most of the negatively
classi ed tweets were posted during the pre-concave stage (70%). About 63% of the tweets circulated within the concave-up and linear stages
carried negative sentiments. The concave-down stage had the least percentage of negatively classi ed tweets (62%). Majority of the negatively
classi ed tweets were tweeted from NSW, VIC, WA, and ACT people. Accordingly, in these states and territories, there were 9,885 more negatively
classi ed tweets than the positively classi ed tweets.
The concave-up stage is the most critical period of a pandemic curve. During this period the number of con rmed cases rapidly increase within a
shorter time period. Nonetheless, the Australian government developed 14 major responses to control the dispersion of COVID-19. Accordingly, on
average, the concave-up stage of Australia lasted only for around 16 days and 29% of the total tweets were circulated within this shorter time
period.
Suppression measures
Transmission of COVID-19 can be categorised into (a) Small chains of transmission, and; (b) Large chains resulting in extensive spread. Countries
such as Taiwan and New Zealand took strong measures at the earliest, and ended up in small chains of transmission. The countries that have not
taken strong measures at the earliest ended up in large chains of transmission such as USA and Brazil (Anderson et al., 2020).
Australia took strong actions to ght with this new pandemic. On 25th January 2020, the rst COVID-19 patient was con rmed, who had own to
Melbourne from Guangdong Province of China on 19 January 2020 (Department of Health, 2020b). On 1 February 2020, Australian government
blocked China arrivals to the country. Since then, until 4 May 2020, Australian government has developed 14 major responses—so-called pandemic
responses—to control spreading the COVID-19 in Australia, and another 7 major responses—so-called economic responses—to address the
economic downturn (Australian Government, 2020b). These 21 major governmental responses are listed in Table 2, and also marked in Fig. 5 to 12.
Table 2 Major responses undertaken by the Australian government to combat COVID-19
No Date Response
1 01/02/2020 Blocked China arrivals*
2 29/02/2020 Blocked Iran arrivals*
3 05/03/2020 Blocked South Korea arrivals*
4 11/03/2020 Blocked Italy arrivals*
5 13/03/2020 Outdoor gatherings limited to 500 persons*
6 16/032020 Self-isolation for overseas travellers, cruise ships blocked for 30 days*
7 18/03/2020 Indoor gatherings limited to 100 persons*
8 19/03/2020 Borders closed to non-citizens and residents*
9 20/03/2020 Started to pay JobSeeker payments**
10 23/03/2020 Pubs/clubs closed, restaurants take-away only*
11 24/03/2020 Ban on Australians travelling overseas*
12 25/03/2020 Temporarily reduced minimum drawdown rated for superannuation**
13 26/03/2020 Expanded testing criteria*
14 28/03/2020 Mandatory isolation in hotels for all travellers*
15 30/03/2020 Outdoor/indoor gatherings two persons only*
16 31/03/2020 Provided payments of $750 to social security, veteran and other income support recipients**
17 26/04/2020 The COVIDSafe App is released*
18 27/04/2020 Expanded eligibility to income support payments **
19 27/04/2020 Paid the time restricted COVID-19 supplement of $500 which paid per fortnight**
20 01/05/2020 Increased transfer payments from reduced deeming rates**
21 04/05/2020 Started to pay JobKeeper payments**
Note: *Health response; **Economic response
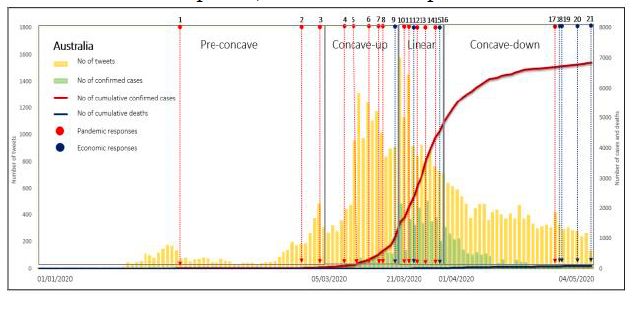
Fig. 4 shows the dispersion of con rmed COVID-19 cases, deaths, the tweets circulated in Australia and the responses undertaken by the Australian
government to stop the spreading of COVID-19. As shown in Fig. 4, the number of tweets and the number of con rmed cases have a positive
relationship with a statistical correlation of 0.72 at 0.05 signi cance level. This shows that the number of tweets changed according to the number
of con rmed cases. Furthermore, Fig. 4 emphasised that 21 major governmental responses (14 health and 7 economic) to the pandemic
undoubtedly have led to the attening of the COVID-19 pandemic curve of Australia.
When governments respond to a pandemic, their economy also get affected. Hence, taking strong economic responses simultaneously with
pandemic responses is important to battle a pandemic effectively (Australian Government, 2020b). Among such responses, community welfare
needs to be given priority as people go out of jobs due to unprecedented pandemic responses such as social distancing, self-isolation, and
restriction to mass gatherings. As listed Table 2, Australian government introduced 7 major economic responses within the study period. They were
oriented towards delivering funds to the nancially struggling people, and unemployed. Additionally, the federal government decided to reduce
Page 6/19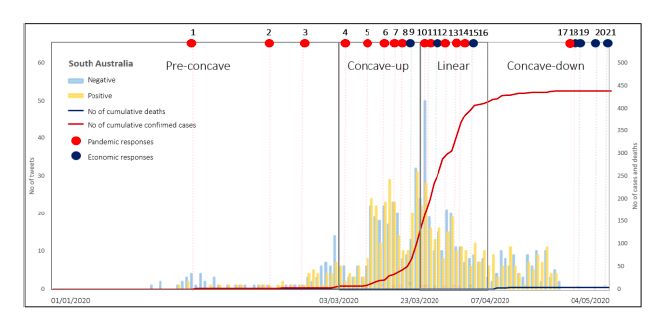
social security deeming rates. Accordingly, on 1 May 2020, the upper and lower deeming rates were 2.25% and 0.25% respectively. These
reductions created a low interest environment, which bene tted around 900,000 income support recipients, and around 565,000 pensioners.

Albeit, the community perceptions towards such ‘radical’ and ‘unprecedented’ measures need to be reviewed closely and thoroughly. Most
signi cantly, during pandemic situations, where social distancing is a must, social media analytics can help policy- and decision-makers to screen
community behaviours without reaching the community directly. Fig. 5 to 12 illustrate the distribution of positively and negatively classi ed tweets
in all Australian states and territories—along with the number of infection cases and deaths. In Australia, the only state/territory that did not
experienced the COVID-19 concave-up stage was NT (Fig. 12). This is due to successful execution of health responses in line with the hammer and
dance approach (presented in the literature background section). In the case of VIC, the last week of the analysis (27 April to 04 May 2020) has
shown an increase in the con rmed cases. Hence, that week was registered as the second linear stage (Fig. 5). This is an example of pandemics
not having a consistent pattern. Without the right responses and interventions, a second wave could be experienced.

In all gures presented, there was a small twitter peak in the pre-concave stage, when there was no signi cant number of con rmed cases. Such
unusual twitter peaks provide an indication of a possible disaster, an unusual behaviour in the environment, or a special community demand
(Castilo et al., 2012; Feng & Sester, 2018; Kankanamge et al., 2020a). Thus, mining the perceptions of the general public via social media platforms
during a pandemic is essential for policy- and decision-makers to take people-centric decisions, while adhering to the regulations of social
distancing and so on.

Positive Community Perceptions

Pre-concave

Only 30% of the total tweets circulated within this stage carried positive perceptions. In NT, the number of positive tweets (n=105) in this stage was
high compared to the number of negative tweets (n=65). By contrast, TAS, SA, and QLD had more negative tweets than positive ones, though their
difference is comparatively small.

Among the tweets circulated in NT, the words of people (0.73%), health (0.55%), good (0.55%), family, government (0.45%), and learn (0.41%) were
popular among the positively classi ed tweets. People from TAS used the words of people (2.09%), response (1.26%), masks (0.84%), save (0.84%),
toilet (0.84%), paper (0.84%), care (0.42%), resources (0.42%) frequently in tweets with positive sentiments. In SA people used testing (1.09%),
management (0.9%), health (0.81%), shutdown (0.98%), people (0.65%), toilet (0.58%), and help (0.45%) often to express their positive attitudes.
People from QLD frequently used health (0.91%), good (0.88%), quarantine (0.84%), test (0.7%) and reaction (0.46%) words to express their positive
ideas. Table 3 shows the example tweets circulated related to the abovementioned words.

Table 3 Example tweets with positive sentiments circulated within pre-concave stage

     Date and time       State   Keyword       Exemplar tweet
     26/02/2020 21:12    SA      Health        Australian health comes before the studies of coronavirus in Australia #auspol
     30/03/2020 13:27    NT      Family        Coronavirus wedding, Melbourne family allowed to celebrate!
     16/03/2020 08:07    SA      Shutdown      The Australian arts and events sector MUST be supported during the coronavirus shutdown
     23/01/2020 22:46    QLD     Tests         Here in Queensland to date we’ve already tested 4 people all 4 came back negative 2 waiting on results
     07/03/2020 14:27    TAS     Resources     At work we’ve put together some coronavirus info & resources to support people living with disability. Please feel free to share with anyone it may help

NSW, VIC, WA and ACT had comparatively less positive tweets. Nevertheless, in general the words such as survive, health, good, young, support,
protect, care, and family were frequent among the positively classi ed tweets circulated within the aforesaid states/territories.

Concave-up

Around 37% of the total tweets circulated within this stage carried positive sentiments. TAS, SA, and QLD had more positive tweets compared to
other states and territories. NT did not go through the concave-up stage due to the low number of con rmed COVID-19 cases mainly because NT
practiced the hammer and dance successfully, where the identi ed small COVID-19 patient clusters were strictly hammered by the enacted
measures.

People from TAS repeatedly used the words of positive sentiments such as good (0.92%), block (0.74%), immediate (0.65%), health (0.63%), care
(0.56%), ban (0.51%), support (0.42%), and prepare (0.41%). The tweets circulated within SA with positive sentiments mostly carried the words of
health (0.99%), shutdown (0.98%), people (0.65%), expect (0.57%), distance (0.57%), enjoy (0.53%), isolate (0.45%), and help (0.45%). The words
such as people (0.78%), practice (0.75%), health (0.57%), care (0.41%), stay (0.41), and expect (0.4%) were popular among the tweets with positive
sentiments circulated in QLD. Table 4 shows the example tweets circulated related to the abovementioned words.

Table 4 Example tweets with positive sentiments circulated within concave-up stage

                                                                                             Page 7/19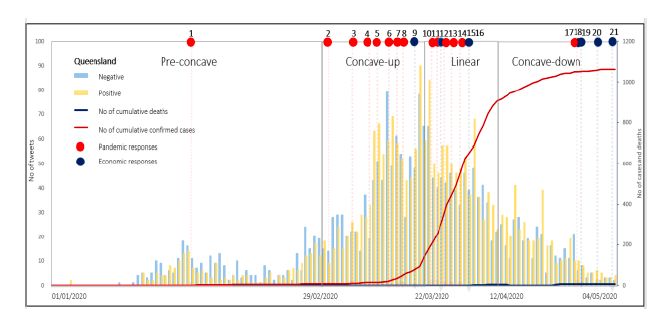
Date and time     State     Keyword     Exemplar tweet
 17/03/2020        TAS       Shut        PM lockdowns the country Australian shut turn weeks actions managed essential services supply chains protected coronavirus impact for months #auspol
 04:47
 05/04/2020        SA        Distance    Day thirteen covid isolation keeping distance. casual Thursday catch covid19 create with every breath custom we make it #supportsmallbusiness
 07:16                                   #sunstatejewellers #sunstate# jewellers
 09/02/2020        QLD       Enjoy       Enjoying Netflix series pandemic moment interesting watch reiterated fact antivaxxers insane #quickdetector
 06:46
 14/03/2020        TAS       Practice    Support promoting positive mental health wellbeing practices pandemic news climate greatly appreciated
 12:09
 21/03/2020        SA        Health      Patients declared, corona virus south Australia declared safe released #hospital #happy #response #senseurgency #australian #healthcare #industry
 21:44

NSW, VIC, WA, and ACT had lesser tweets with positive sentiments during this stage compare to the other states/territories. Nevertheless, the words
such as people, health, good, motivate, care and help were plural in the limited number of positively classi ed tweets in the abovementioned
states/territories.

Linear

About 37% of the total tweets circulated in this stage were classi ed as tweets with positive sentiments. This is the period, when the number of
daily reported cases gradually increase at an equal/slower rate than in the concave-up stage. Consequently, more positive tweets can be expected
from this stage. Similarly, QLD, SA, TAS, and NT had more tweets with positive sentiments than other regions.

The most frequently used words in QLD were, lives (0.95%), prevent (0.72%), online (0.72%), distance (0.6%), support (0.54%), advice (0.48%), and
family (0.48%). Tweets with positive sentiment values circulated in SA included more words such as people (1.1%), lives (0.79%), advantage
(0.71%), health (0.65%), government (0.52%), stay (0.46%), quarantine (0.43%), family (0.42%), and care (0.4%). People form TAS had more tweets
in this phase related to the words of people (0.78%), health (0.59%), check (0.44%). NT community used the words of crisis (0.95%), days (0.72%),
distance (0.6%), government (0.48%), and people (0.48%). Table 5 displays the example tweets related to the abovementioned words.

Table 5 Example tweets with positive sentiments circulated within linear stage
 Date and time       State     Keyword        Exemplar tweet
 29/02/2020          QLD       Online         Social media teachers deliver classes online, countries covid focus appears delivery content students demonstrating evidence learning keen hear thoughts
 21:19
 28/03/2020          SA        Family         Kind positive happy message family quarantine #stayhome positive kind happy documentary covid19 coronavirus #SA australia #adelaide #adelaide
 09:20                                        #australia
 15/03/2020          QLD       Prevent        Maths extensive social distancing read quarantine preventative purposes waiting sick effective strategy flatten covid19 curve
 00:01
 14/04/2020          NT        Government     Australian government launches coronavirus publicity blitz country runs testing kits
 01:00
 27/03/2020          TAS       Check          Remember folks, libraries closed free ebooks library check library’s website
 08:20

Although NSW, VIC, WA and ACT had more negative tweets in this stage, the words such as help, good, safe, family, global, study, and health were
popular among the positively classi ed tweets.

Concave-down

About 38% of the total tweets circulated within this stage carried positive sentiment values. QLD, NT, TAS, and SA had a few more tweets with
positive sentiment values than those with negative sentiment values. People (0.74%), safe (0.71%), test (0.66%), fund (0.64%), support (0.64%), app
(0.43%), invest (0.41%), care (0.4%), and isolate (0.4%) were the mostly used words in the positively classi ed word category in QLD. Positively
classi ed tweets circulated within this period in NT carried words such as approach (4.76%), good (4.76%), herd (4.76%), and immunity (2%).
People from TAS used government (0.86%), attitude (0.74%), app (0.72%), family (0.58%), distance (0.43%), vaccine (0.43%), and safe (0.41%). SA
people used the words such as good (0.92%), app (0.61%), track (0.6%), normal (0.57%), vaccine (0.54%), claim (0.5%), and days (0.46%) often in
the tweets with positive sentiments. Sample tweets circulated related to the frequently used words are given in Table 6.

Table 6 Example tweets with positive sentiments circulated within concave-down stage
 Date and time    State      Keyword     Exemplar tweet
 24/04/2020       TAS        App         Fully understand downloading covidsafe app doesn’t automatically prevent virus, but it’s a good initiative
 06:36
 12/04/2020       SA         Normal      Covid19 permanently normalise virtual technologies judging zoom meetings
 14:40
 23/04/2020       TAS        Vaccine     AAMRIS members projects progress relating covid19 covering vaccines drug trials diagnostics screening tests mental health indigenous health
 22:41
 11/04/2020       QLD        Fund        Scott Morrison pressed abc730 virgin australia’s request 14b loan bailout pm suggests industry superannuation funds to super fund step fed govt #abcnews #twuaus
 15:46                                   #coronavirus #virginaustralia
 29/04/2020       NT         Immunity    Pretty great idea herd immunity approach controlling spread virus
 04:48

                                                                                                 Page 8/19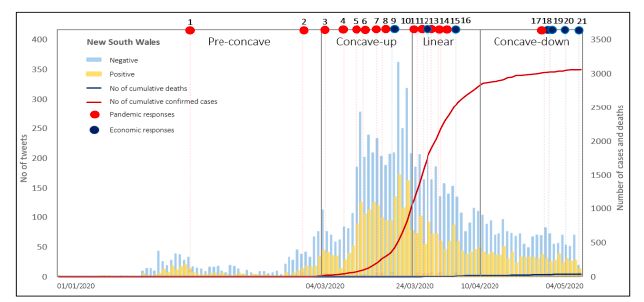
NSW, VIC, WA, and ACT also had comparatively a low number of positively classi ed tweets related to this stage. Among them, the words such as
tests, stay, support, health, learn, people, help, good and school were popular.

Negative community perceptions

Pre-concave

Almost 70% of the total tweets circulated within this stage carried negative sentiments. VIC, NSW, ACT, and WA had more negative tweets than
positive ones (Fig. 7). VIC con rmed the rst Australian COVID-19 patient on 25 January 2020 (Department of Health, 2020c). Since then,
con rmed cases emerged across the state. The words such as arrival (1.16%), immediate (0.72%), cases (0.67%), paper (0.62%), catch (0.5%), toilet
(0.5%), commodities (0.5%), dead (0.8%), and spread (0.43%) were plural among the negatively classi ed tweets in VIC. NSW community used the
words related to suffer (0.94%), fail (0.73%), cases (0.67%), and death (0.47%) frequently in the tweets shared. Tweets classi ed as negative in ACT
included words such as die (1.06%), cases (0.81%), arrive (0.69%), and days (0.52%). The words such as hard (1.56%), contract (1.51%), die
(0.93%), buy (0.67%), work (0.59%), affect (0.46%), panic (0.4%) were often used in WA.

Table 7 Example tweets with negative sentiments circulated within pre-concave stage
 Date and        State      Keyword    Exemplar tweet
 time
 02/03/2020      VIC        Fail       Making sickening joke of Morrisons plan he has on potential carriers of coronavirus looking tends be part of widespread failure of LNP While AFP are looking all
 02:12                                 wrong places auspol
 29/01/2020      NSW        Suffer     Interesting. Last heard some people had virus were reinfected afterwards Apparently did not develop an immunity 2 virus Inoculate supposed trigger the effect yet
 08:58                                 hears sufferers developed any type immunity reinfect may wrong
 30/03/2020      VIC        Arrival    Need to assure that the community evacuees from diamond princess cruise be heavily screened before their arrival
 00:06
 28/02/2020      ACT        Dead/die   Media bull shit Corona Get Common cold die FFS peoples together think percentages not raw numbers wealthy worry does homelessness poverty pure desperation
 02:45                                 fellow countrymen not move more
 25/01/2020      WA         Hard       Moneys come hard during pandemic
 05:53

Although QLD, SA, TAS, and NT had more positive tweets than negative ones in this stage, the words such as spread, risk, infect, u, work, China,
business, death, and panic were common among the negatively classi ed tweets.

Concave-up

During this phase the number of tweets with negative sentiments (63%) were signi cantly high compared to the number of positive tweets. For
instance, the number of negatively classi ed tweets in NSW and VIC were almost the twice of the positively classi ed tweets. Besides, both ACT
and WA had more negative tweets than positively classi ed tweets circulated within this stage.

Most of the negatively classi ed tweets circulated within NSW carried the words such as cause (1.26%), work (1%), fail (0.76%), travel (0.76%),
immediate (0.68%), hard (0.64%), cases (0.57%), control (0.48%), collapse (0.42%), and death (0.4%). Within the tweets from VIC, arrival (1.41%),
travel (0.87%), immediate (0.7%), cases (0.49%), and lives (0.41%) were the most popular. People from ACT used more words such as die (1.39%),
affect (0.51%), mortgage (0.43%), and suffer (0.42%). The words such as die (1.18%), work (0.77%), hard (0.72%), check (0.65%), suffer (0.5%) and
cases (0.42%) were used frequently in the tweets circulated within WA. Table 8 lists the example tweets circulated related to the abovementioned
words. These tweets showed economic challenges experienced by the local community such as unemployment and di culty in paying mortgages.

Table 8 Example tweets with negative sentiments circulated within concave-up stage
         Date and time         State   Keyword    Exemplar tweets
         06/03/2020 14:28      WA      Die        15 MILL people will die best-case coronavirus scenario
         15/03/2020 04:12      VIC     Arrival    Advice on how self-isolate on arrival Australia please see their Dept of Health’s guide COVID which covers this. Don’t create take risk

         03/03/2020 08:20      NSW     Work       Can’t stop COVID19 without protecting our health workers he said prices surgical masks increased sixfold while cost ventilators had tripled he added

         17/03/2020 21:06      ACT     Mortgage   Wouldn’t nice Aussie government absorb rent mortgages during hard times COVID-au

         4/03/2020 07:46       NSW     Cause      Who think coronavirus would cause toilet paper apocalypse

The negatively classi ed tweets circulated within QLD, SA, and TAS included the words such as employment, spread, panic, con rm, business, risk,
fear, anxious and cuts frequently.

Linear

Similar to the concave-up stage, 63% of total tweets circulated within this stage were negative. NSW, VIC, WA, and ACT had more tweets with
negative sentiments.

The words such as lives (0.97%), national (0.53%), contract (0.48%), o ces (0.44%), stop (0.43%), positive (0.44%), prevent (0.42%) and employer
(0.4%) were popular among the tweets circulated in NSW in this phase. Tweets circulated within VIC carried more words such as arrival (1.18%),

                                                                                                Page 9/19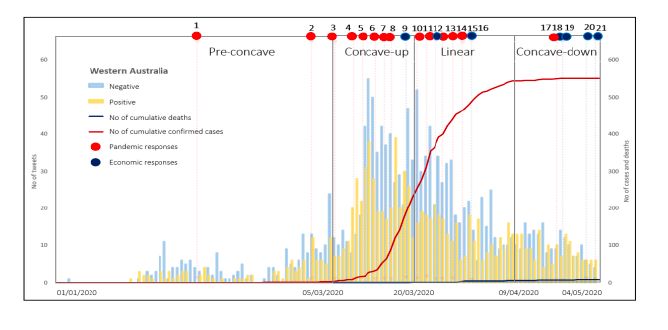
immediate (0.89%), employment (0.73%), die (0.6%), check (0.56%), positive (0.5%), cases (0.45%), and days (0.44%). The words such as suffer
(1.2%), arrival (1%), hard (0.71%), work (0.66%), and dead (0.47%) were frequently used in the tweets circulated within WA. Tweets collected from
ACT had more words such as work (0.96%), causes (0.84%), cases (0.57%), government (0.42%), and spread (0.41%). Example tweets related to the
abovementioned words are given in Table 9.

Table 9 Example tweets with negative sentiments circulated within linear stage
 Date and        State    Keyword       Exemplar tweet
 time
 27/03/2020      NSW      Arrival       Face masked ship crew arrive Sydney amid coronavirus warnings
 02:33
 19/03/2020      VIC      Employment    Really You don’t think shutting down schools and keeping kids home won’t make them stressed How about when there’s mass unemployment and Great Depression
 09:53                                  kids be stressed then There’s longer game here then just virus
 20/03/2020      WA       Suffer        Watching Simpsons ep Bart tricks everyone cruise ship the world suffering virus they stay quarantined How often they predict future
 07:25
 18/03/2020      ACT      Work          People own business works themselves markets shows losing job no help coronavirus
 08:25
 11/03/2020      NSW      Lives         Scott Morrison MP Greg Hunt MP please before become China/Italy stop mass gatherings lock down few weeks could make huge difference how many Aussies
 07:03                                  become ill coronavirusaustralia you will be saving lives pandemic

Although QLD, SA, TAS and NT did not have more negatively classi ed tweets related to this stage, the words such as employment, death, issue,
work, cuts, and businesses were popular among the negatively classi ed tweets.

Concave-down

Australia did not experience high infection cases and resulting deaths compared to other countries such as USA, Brazil, UK, and Italy. Within a
shorter time period Australia was able to control the pandemic situation. Soon after, the gap between negatively and positively classi ed tweets
was narrowed down. However, still, 62% of the total tweets circulated within this phase were negative. NSW, VIC, ACT and WA had more negative
tweets than positive ones. The tweets generated from the aforementioned states and territories in this stage either showed the re ections of the
community about the life they experienced during the past days or the issues and problems they have to face in the upcoming new normal era.

Most of the tweets from NSW were generated around the words of employment (0.84%), dead (0.55%), cases (0.53%), contract (0.53%), days
(0.51%), novel (0.48%), direction (0.46%), experience (0.46%), and cautious (0.4%). Tweets from VIC had more words related to suffer (1.28%), die
(0.66%), positive (0.53%), cases (0.53%), care (0.5%) and days (0.47%). Tweets from ACT mostly carried the words such as days (0.62%), check
(0.54%), die (0.5%), and cases (0.4%). The words such as employment (0.7%), days (0.59%), check (0.57%), people (0.55%), backward (0.53%),
cases (0.48%), hard (0.47%), and miss (0.45%) were the most popular in WA. Sample tweets circulated related to the frequently used words are
given in Table 10.

Table 10 Example of tweets with negative sentiments circulated within concave-down stage

 Date and time    State    Keyword       Exemplar tweets
 22/03/2020       WA       Employment    Surely you can better your employees Armguard COVID19 NO masks NO gloves NO antibacterial wipes ATMs would hive spreading germs well notes
 23:54                                   misinformation too responsibility the project
 24/04/2020       VIC      Suffer        Proud Daniel Andrews MP not giving populist attitude demands sticking restrictions coronavirus crisis Another week doesn’t hurt anyone even though suffer
 06:45                                   financially etc
 27/03/2020       ACT      Days          Australia records highest single day increase coronavirus cases
 04:33
 03/04/2020       NSW      Employment    Impact vast International student’s university school employment Coronavirus COVID-AU
 20:35
 18/04/2020       NSW      Dead          Nearly lost Two people laughed me told couldn’t use fitting rooms virus exactly funny deadly virus killing people over world
 02:23

Compared to other states and territories, the numbers of negatively classi ed tweets were slightly low in QLD, SA, TAS. Nevertheless, the words
such as employment, business, people, cases, spread, suffer, and industry were popular among the negatively classi ed tweets in QLD, SA, TAS and
NT.

Discussion
The use of general public knowledge for public health policy and decision-making is becoming an important part of good governance practice
(Baum et al., 2010; Gudes et al., 2010; Yigitcanlar et al., 2020c). Community juries (Degeling et al., 2017), stakeholder meetings, community-based
organisations (Israel et al., 2010), and non-government organisation feedbacks (Smith, 1977) were often used by governments to aid the decision-
making process. Nonetheless, these cannot be used in pandemic situations, where social distancing is a compulsory rule. With the challenges of
social distancing and travel restrictions, appropriate and community centric decisions need to be taken at the right time to tackle a pandemic
situation successfully.

                                                                                             Page 10/19
In the digital age, the use of social media data can help governments to capture community perceptions within a shorter time period without
reaching the people directly/physically (Kankanamge et al., 2020b). This attribute of social media analytics make it quali ed to be used to make
community friendly decisions during pandemic situations. For instance, the ndings of this study can assist policy- and decision-makers in two
ways: (a) To review community perceptions about the pandemic situation, and; (b) To identify the key requirements of the community to cope up
with the pandemic situation.
The analysis has shown that Australian public was not happy at the early stage of the pandemic curve—i.e., pre-concave stage—as they seemed to
believe that the Australian government was not responding to this global disaster appropriately. Accordingly, people were in a panic mode, and tried
to prepare to face the pandemic at their capacity. The words, toilet/paper were very common in Twitter in all states/territories during the pre-
concave stage. This was because consumer panic buying patterns took place in Australia, where people tried to stock toilet papers, hand sanitisers,
food and other commodities. This indicated how Australian people act when the government does not provide con dence.
From February 2020 onwards, the Australian government started to add travel restrictions to combat COVID-19. This made people started to build
trust in the government. The popular words among positively classi ed tweets showed that the people were generally happy about the actions
taken by the government to combat the virus dispersion in Australia. Frequently used words, such as testing, resources, shutdown, and reaction,
showed the awareness level of the community to face an upcoming disaster. For instance, the tweets circulated in QLD emphasised the
signi cance of expending the number of testing per day at the early stage to stop spreading the virus rapidly. Furthermore, most of the tweets
discussed about the importance of wearing masks.
Especially, people looked satis ed about the decisions made to expand the testing to reduce spreading SARS-CoV-2. For instance, the Australian
government conducted more than two million tests in Australia by the end of May 2020. The majority of these tests were conducted in the
following states: NSW (n=725,817), VIC (n=660,801), QLD (n=274,688), and SA (n=137,290) (Department of Health, 2020d). The action of
expanding the testing was taken during the late March 2020. Yet, it was also well demanded in the tweets circulated during the beginning of March
2020.
Most of the tweets re ected positive sentiments about the policy decisions to limit travelling such as closing state borders to non-citizens and
residents, blocking Iran, South Korea and Italy arrivals, contract tracing and limiting outdoor and indoor gatherings. Furthermore, the Australian
government introduced two mobile applications: (a) Coronavirus Australia App, and; (b) COVIDSafe App. They were ranked over four out of ve
points in both Apple and Android app stores. While such apps are immensely useful, effective use of government social media channels are also
required to help the public follow the introduced measures/restrictions. Previous studies have shown the limitations of the government agencies in
effective use of social media channels in Australia (Yigitcanlar et al., 2020b).
These applications provided timely demanded information package to the people such as the reported cases by state, advices, symptom checker,
location information related to general practitioner respiratory clinics, register to self-isolate, mental health advices, special advices to the age care
sector, health information contact number and so on. The COVIDSafe app is designed to help the Australian government to nd close contacts of
COVID-19 infected people. This app allows state and territory health o cials to quickly contact people that may have been infected with the virus.
Factually, people looked satis ed and happy about the decisions took by the Australian government to slow down the spread of the virus. While
people were sending tweets related to the policies taken, there were more words related to the economy in the negatively classi ed tweets. The
tweets shared related to nancial issues got three forms: (a) Panic buying-related issues; (b) Mortgage-related issues, and; (c) Employment-related
issues.
The very rst economy-related issue faced by Australians was the stock outrage due to the consumer ‘panic buying’. As a result, the supply of toilet
papers and other commodities were signi cantly low in NSW, VIC and WA. This situation made supermarkets to limit the number of items per
transaction/per customer. Some supermarkets announced plans to give priority to elderly and disabled people when selling their goods. As COVID-
19 started to hit Australia after the bush re, the situation become dire with the consumer panic buying patterns. Moreover, the discussions about
the positive relationship between elderly population and the fatality rates increased the death fear of Australians from COVID-19 (Holt et al, 2020).
The words such as businesses, employments, salary cuts, investments, and industries were the rst plural cluster of words among the tweets with
negative sentiments. Especially, these words were very popular among the tweets generated from NSW, VIC, and ACT. It was estimated that around
one million Australians lost their jobs due to the pandemic. This was more signi cant in VIC, TAS and SA (ABC, 2020a). Although SA had more
positive perceptions, the word of employment (1.54%) was common among the negatively classi ed tweets. These facts showed the nancial
stress of the community during the pandemic, to which government needs to respond immediately.
The second issue was related to the ‘mortgage’ payments, which was the second popular word cluster within the negatively classi ed tweets. The
COVID-19 pandemic left 1.4 million Australian in mortgage stress (ABC, 2020b). According to Australian Bureau of Statistics (2018), NSW
($462,100), VIC ($400,400), and ACT ($404,200) owned the highest average mortgage sizes among the other states/territories. Thus, people from
these states/territories undergo severe nancial issues at a time, when they may not be engaging in paid work/employment.
Page 11/19The third issue was related to ‘employment’. While the Australian government’s JobSeeker and JobKeeper programs are helpful to a degree
(Cassells & Duncan, 2020), the uncertainty of these programs generates an anxiety among the people who either lost or might be losing their jobs.
It highlights the fact that after controlling the pandemic in a successful way the next challenge waiting for the Australian government is to
stimulate the downturn economy of Australia—that is already in recession—due to the COVID-19 pandemic. Along with this, the post-COVID-19 era
might subject to a prolonged state of psychological fear, worries, and confusion against any small to large scale physical gathering (Ho et al.,
2020). A timely and sound government response, hence, is needed.
Conclusion
The unpredictable, sudden and rapid emergence and transmission of COVID-19, during the last few months, has triggered signi cant public health
emergencies and concern across both national as well as the global nature. Considering limited availability of clinically proven interventions and
the infectious nature of the SARS-CoV-2’s transmission, there created a global emergency in the form of a pandemic, resulting in implementations
of lockdowns and restrictions in movement for citizens throughout the world. The resultant limitations have, thus, sparked a surge in the usage of
online resources by the public, such as the usage of social media as well as the public’s reliance on e-commerce services for the purpose of
obtaining essential commodities.
Considering the increasing in uence of social media across the public, especially during the time of restricted movement like the existing lockdown,
this paper examined the potential role of crowdsourced data drawn from social media in informing the government policy- and decision-making
process during a pandemic. The dearth of existing evidence, implemented speci cally in the Australian context, further prompted the execution of
this research. Accordingly, for the purpose of expounding upon the role of social media analytics in in uencing governmental policy- and decision-
making during a pandemic, a social media analysis approach was adopted by this research, comprising of a systematic and geographical analysis
of 35,969 geotagged tweets of individuals residing in Australian states/territories.
The ndings revealed the prevalence of negatively classi ed tweets (63%), compared with positively classi ed ones (37%). The highest prevalence
of negatively classi ed tweets was reported during the pre-concave stage, while the lowest prevalence of 62% was observed during the concave-
down stage. The highest prevalence of negatively classi ed tweets was observed from such territories and states as NSW, VIC, WA, and ACT, where
additional 9,885 negative tweets, re ecting the prevalence of concerns regarding a pandemic from the public during stages before transmission of
the virus.
Indeed, the concave-up stage or the period of rapid disease transmission was characterised as a relatively short period in Australia, along with the
implementation of 21 major governmental responses (14 health and 7 economic responses) to mitigate the impacts of COVID-19. Such data on
governmental actions can be well correlated with the reporting of the smallest number of negative tweets during this period by the public.
Additionally, the ndings also demonstrated the prevalent nancial issues faced by the public during the pandemic. Issues related to nancial crisis
were observed in the negative tweets where the public primarily shared concerns related to: (a) Bulk purchasing due to panic; (b) Inability or
di culty to pay mortgages, and; (c) Loss or risk of employment. Such ndings, thus, depicted the nancial issues faced by the public during
national emergency situations like a pandemic, which the government must act upon immediately along with disease prevention.
The overall study ndings reveal that: (a) Social media analytics is an e cient approach to capture the attitudes and perceptions of the public
during a pandemic; (b) Crowdsourced social media data can guide interventions and decisions of the authorities during a pandemic, and; (c)
Effective use of government social media channels can help the public to follow the introduced measures/restrictions.
These ndings, thus, demonstrate the effectiveness of social media analytics in depicting the public’s expectations in response to a national
emergency or crisis situation, especially when the governments cannot reach the general public directly/physically. The ndings of this research,
thus, proved to be useful in recommending and evaluating the potential effectiveness of crowdsourced data from the public’s social media
activities in informing governmental authorities on possible strategies to implement during a pandemic. To conclude, the ndings of this research,
hence, recommend governmental authorities to: (a) Conduct social media analytics to capture public perceptions and act accordingly, and; (b)
Actively utilise social media channels to enhance public health education and awareness concerning social distancing restrictions to be
maintained during COVID-19 or other future pandemics.
Lastly, the following limitations of the study should be considered when interpreting the ndings. First, the study only covered the period between 1
January and 4 May 2020, when the COVID-19 pandemic still prevailed in Australia at different degrees after this period. Second, as the case of VIC
indicated, the four stages of pandemic may repeat again with the identi cation of newly infected clusters—this was the case for Melbourne on the
rst week of July 2020 (i.e., Victorian government’s lockdown of nine public housing towers in Melbourne, and the lockdown was expanded to the
Melbourne metropolitan area in the next days). Third, this study only analysed Twitter data, while other social media channels were not considered.
Finally, there might be bias involved in the selection of the word bags and also when supervising the machine learning tool in the used software—
i.e., WEKA.
Declarations
Page 12/19You can also read