GAS PRODUCTION AND EARTHQUAKES IN GRONINGEN - REFLECTION ON ECONOMIC AND SOCIAL CONSEQUENCES - RUG
←
→
Page content transcription
If your browser does not render page correctly, please read the page content below
Gas production
and earthquakes
in Groningen
reflection on economic
and social consequences

Machiel Mulder and Peter Perey (ed.)

Centre for Energy Economics Research (CEER)
Policy Papers | No. 3 | June 2018
Gas production and
earthquakes in Groningen
 reflection on economic and social
             consequences

   Machiel Mulder and Peter Perey (ed.)

      CEER - Policy Papers | no. 3 | June 2018
Mulder, M. and P. Perey (ed.)
Gas production and earthquakes in Groningen; reflection on economic
and social consequences, Centre for Energy Economics Research , CEER
Policy Papers 3 - University of Groningen, The Netherlands – June 2018

Keywords:
Natural gas, natural resource policy, earthquakes, economics, housing
market, psychological impacts

This publication has been made for the occasion of the 41st International
conference of the International Association for Energy Economics (IAEE),
Groningen, The Netherlands, 10-13 June 2018.

© Mulder & Perey
ISBN: 978-94-034-0774-6 (print)
ISBN: 978-94-034-0773-9 (pdf)

Centre for Energy Economics Research (CEER); http://www.rug.nl/ceer/
Department of Economics and Business, University of Groningen;
http://www.rug.nl/feb/
Nettelbosje 2, 9747 AE Groningen

2
Contents

1. Introduction
  Machiel Mulder & Peter Perey

2. Groningen gas field in the European gas market
  Machiel Mulder & Peter Perey

3. The Janus Face of natural gas resources in the Netherlands
  Bert Scholtens

4. Taking it home: impact of earthquakes on the regional
  housing market
  George de Kam

5. Public risk perceptions and emotions towards the

  earthquakes caused by gas production

  Goda Perlaviciute

6. Concluding remarks
  Machiel Mulder & Peter Perey

                                                                3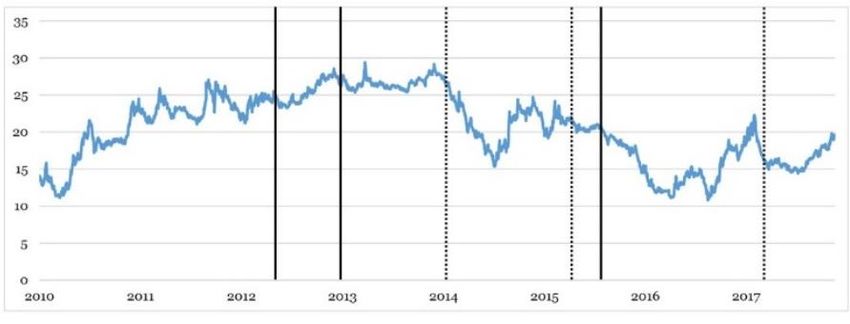
4

1. Introduction
Machiel Mulder & Peter Perey
1.1 Background
In the evening of 16 August 2012, an earthquake with a magnitude of 3.6
on the scale of Richter occurred near the village of Huizinge, in the
northern part of the Netherlands. Immediately after the incident,
numerous complaints about damage to houses were reported. The
operator of the field, the Nederlandse Aardolie Maatschappij (NAM),
received over 1,000 damage reports in the week following this earthquake.
It appeared that the earthquake was indeed induced by gas extraction
from the Groningen gas field (Dost & Kraaijpoel, 2013).
The relation between gas extraction from the Groningen field and
seismic activity in the region is not a new phenomenon. In the past
decades, several studies have showed this relationship. BOA (1993)
concluded that gas extraction has an influence on the robustness of the gas
reservoir and the direct surroundings. This report also concluded that
earthquakes can be induced by gas extraction. Although this relation has
been confirmed by the latest incidents, the initial assessment of the
magnitude of the problem was not correct. BOA (1993) predicted that even
in the worst case, there would be a small chance of minor damage around
the epicentre. With the information which is currently available it is
evident that this prediction was too optimistic. The province of Groningen
has been struck by earthquakes numerous times over the past 25 years.
Since the earthquake of Huizinge, over 100 earthquakes with a magnitude
of 1.5 or more have been registered (Figure 1.1). After the Huizinge
earthquake, there was a steep increase in the number of inhabitants
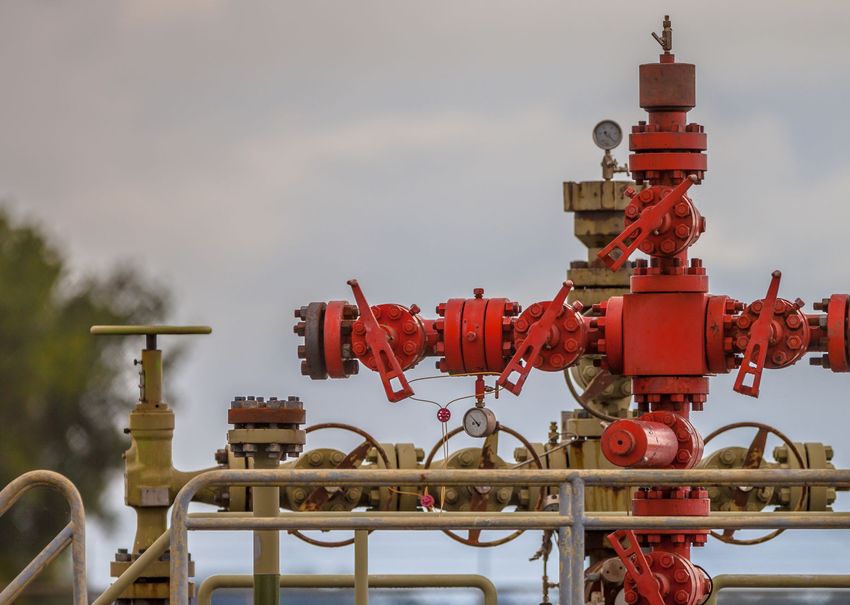
reporting damage to their houses. In international comparison, the level
of damage in Groningen is higher than would be expected given the
5
magnitude of the earthquakes (see Box 1.1). Until the beginning of 2018,
over 85,000 damage claims have been filed (NCG, 2017).

Figure 1.1. Total number of earthquakes with a magnitude >
            1.5 per year, categorised by magnitude, 1991-2018

Source: NAM

1.2 The Groningen gas field and its revenues
The operator of the Groningen gas field has been a major player in North-
West European gas market. Since the discovery of this gas field, the
importance of natural gas as energy source grew immensely in the
Netherlands and its neighbouring countries. Natural gas became the
primary energy source for households, for example for cooking and
heating. The role of the gas production from Groningen changed in the
following decades as the field got a more strategic function. Other small
gas fields produced continuously over time, where the Groningen field was
increasingly used in times of high demand. This so-called swing function
of the Groningen field was meant to secure the supply of natural gas in
Northwest Europe as well as to maximize the revenues. The revenues
coming from this huge reservoir of natural resource had a major

6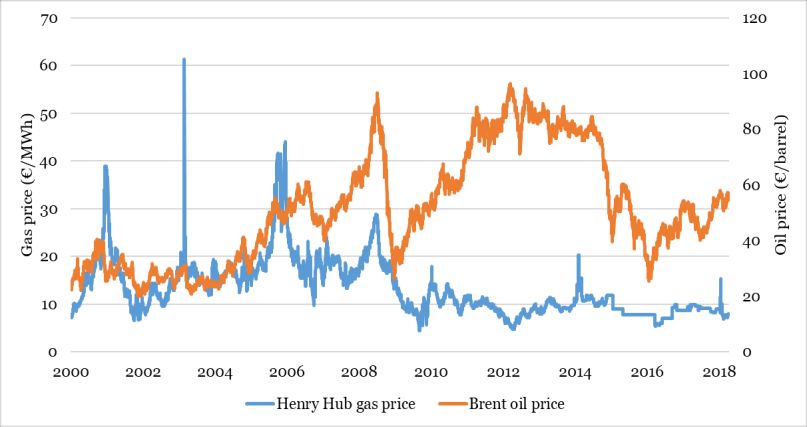
contribution to the economic welfare of the Netherlands in the second half
of the 20th century (CBS, various years). In the 1980s the share of the gas
revenues in total government income peaked at 15%, but this contribution
gradually decreased to about 2% currently.

 Box 1.1: Geology – what causes the earthquakes?

 The natural gas of Groningen is located at 3 km deep, in a sandstone
 layer. Sandstone consists of sand that is pressed against each other
 under high pressure. When gas is pumped out of the sandstone layer, the
 pressure in this layer decreases. As the decreased pressure cannot
 support the weight of the layers on top, it results in soil subsidence that
 compresses the layers. When this compression occurs in an irregular
 way, the soil subsidence causes an earthquake. Gas-induced earthquakes
 in the sandstone layer occur at a shallow depth, compared to natural
 earthquakes that occur at 20-100 kilometres deep. As a result, the
 earthquakes induced by the gas production have a higher impact on
 buildings than natural ones. On top of that, ground movements are
 intensified because the seismic energy is transmitted by a subsoil of clay,
 sand and peat. Also, the predominant traditional construction in brick
 adds to the vulnerability of buildings (Koster & van Ommeren, 2015;
 McGarr, 1984; van Eck et al., 2006).

1.3 Policy debate
The damage caused by earthquakes was initially settled between property
owners and the NAM. In January 2014, the Dutch government stepped in
with a set of additional compensating measures as well as the institution
of a National Coordinator. One of the tasks of this coordinator was to
manage the processes of damage repair and structural reinforcement of
buildings. However, the NAM continued to have a large say in the handling
of damage claims and this double role of the operator caused much
discontent in the area. This led to the decision to transfer the management
and financial compensation of damage claims to a government agency,
which charges its costs to the NAM. However, the severity and magnitude

                                                                          7
of the problem complicated the setup of a damage protocol. After the
implementation of a protocol, different problems became apparent. These
problems were related to the difficulty of the assessment of damage and
often conflicting assessments by different experts. To tackle the problems,
the government implicated a new damage protocol. Starting from March
19 2018, inhabitants can report their damage claim by the Commissie
Mijnbouwschade Groningen. This replaced the old structure and has as
purpose to accelerate the process.
In addition, the government policy was directed at reducing the risks
of earthquakes in the future as much as possible. In order to do so, the
government further restricted the annual level of production from the
Groningen field. The initial cap, which was introduced in 2006, of 425
billion m3 (bcm) for a period of 10 years was introduced because of
security of supply concerns. In order to reduce the risk of earthquakes, the
Dutch government reduced this cap to an annual level of 27 bcm in 2015.
Because of the persistent earthquakes, the cap has been lowered several
times since then. In the case of an abnormal cold year, however, the
production is allowed to be somewhat higher, to secure domestic supply
and to prevent a shortage for the inhabitants of the Netherlands. In March
2018, the Dutch government decided that the Groningen gas production
will completely come to an end in 2030 (EZK, 2018).
1.4 Responses in society
The increasing intensity and frequency of the earthquakes led to a fierce
debate among Dutch population, adding to the debate on the need to
reduce the use of fossil energy. The debate on gas production basically
boils down to the trade-off between the national revenues of gas
production and the importance of the Groningen gas field for the Dutch
security of gas supply on the one hand and the risks and costs for the
8inhabitants of the affected region. The latter group demanded immediate
action of the government to prevent future quakes. Furthermore, over the
past five years anger and frustration have grown regarding the
compensation for the damage and value loss of their houses (KAW, 2018).
Although a government agency has taken over the lead, the slow process
of developing the new protocol on how to assess all the damage claims
added to the dissatisfaction of the inhabitants.
Several citizen interest groups have been established, including the
Groninger Bodem Beweging and Schokkend Groningen. Another active
interest group is the WAG Foundation, representing over 4.500 owners of
houses, which won a court claim for compensation of the devaluation of
their properties. These groups protested against gas production, by
occupying buildings and protesting in front of the headquarter of the
NAM. On January 19 2018, inhabitants of the earthquake affected region
organised a torchlight procession as a protest towards the in their view
passive attitude of the government and the operator. The dissatisfaction
among the population after more than 5 years of uncertainty about how
the problems caused by gas extraction would be solved appeared to be
huge. Over 10,000 people were present and another 53,000 signed an
online protest petition.
The earthquakes did not only affect the overall wellbeing of the
inhabitants of the region, it also affected the housing market. The
uncertainty concerning the earthquakes makes the region less attractive
and valuable. Furthermore, the inhabitants of the region are more likely
to move away from the area, adding up to other factors negatively
influencing the housing market in the rural and less wealthy regions of
Groningen.
91.5 Structure of the paper In this paper, we want to give an overview of the economic and social consequences of both the gas production and the resulting earthquakes. Section 2 describes the role of the Groningen gas field in the gas market, while Section 3 goes into the historical economic importance of the Groningen gas production for the Dutch state revenues and economy. In the following sections, the effect of the earthquakes on the inhabitants of the Province in Groningen is discussed. Section 4 discusses the effect of the earthquakes on the housing market, while Section 5 treats the social- psychological aspects in detail. Finally, Section 6 presents some lessons learned and discusses how to go forward. References Begeleidingscommissie Onderzoek Aardbevingen (BOA) (1993). Eindrapport multidisciplinair onderzoek naar de relatie tussen gaswinning en aardbevingen in Noord-Nederland. Centraal Bureau voor de Statistiek (CBS) (various years). De Nederlandse economie. Dost, B., & Kraaijpoel, D. (2013). The August 16, 2012 earthquake near Huizinge (Groningen). KNMI Scientific Report. Royal Netherlands Meteorological Institute (KNMI), Utrecht, The Netherlands. Van Eck, T., Goutbeek, F., Haak, H., & Dost, B. (2006). Seismic hazard due to small-magnitude, shallow-source, induced earthquakes in The Netherlands. Engineering Geology, 87(1-2), 105-121. KAW (2018) Woningmarkt- en bewonersonderzoek Noord- en Midden- Groningen. Overkoepelende rapportage. Groningen, KAW. Koster, H. R., & van Ommeren, J. (2015). A shaky business: Natural gas extraction, earthquakes and house prices. European Economic Review, 80, 120-139. McGarr, A. (1984). Scaling of ground motion parameters, state of stress, and focal depth. Journal of geophysical research: Solid earth, 89(B8), 6969-6979. Nationaal Coördinator Groningen. (2017). Kwartaalrapportage juli tot en met september 2017. Minister of Economic Affairs and Climate (EZK) (2018). Kamerbrief over gaswinning Groningen [letter of government on gas production Groningen], The Hague, 29 March. 10
2. Role of Groningen gas field in the gas market
   Machiel Mulder and Peter Perey

2.1 Characteristics of the Groningen gas field
Natural gas is a natural product, which means that its characteristics vary
from field to field. Different gas fields contain different types of natural
gas that have different specifications and composures. The natural gas that
is produced from the Groningen gas field is qualified as L-gas, referring to
low-calorific gas. The qualification of natural gas, either low-calorific or
high-calorific, depends on the Wobbe-Index of the gas. The Wobbe-index
indicates the thermic value of a gas (Klimstra, 1986). Gas with a low-
calorific value contains a higher percentage nitrogen and lower percentage
of methane than high-calorific gas, resulting in a lower Wobbe-index.
Therefore, the amount of thermal energy stored in a unit low-calorific gas
is lower than in the same unit of high-calorific gas. The Groningen field
has a higher nitrogen (14,2%) content compared to other European gas
sources, such as Russian or Norwegian gas (ca. 2%).
    The energetic quality of the natural gas is not the only key
characteristic for a gas field. Another characteristic is how complicated the
extraction of natural gas from the field is. This difficulty of extraction is
reflected in the so called marginal production costs. If the price which will
be received for the natural gas is lower than these marginal-extraction
costs the producer will not produce at all. Looking at this characteristic,
Groningen has a huge advantage compared to other fields. Its marginal
costs belong to the lowest in Europe. In addition, the production level from
Groningen can be adjusted from hour to hour relatively cheaply and
quickly. This gives the operator of the field the advantage to vary the
output level according to market circumstances. In other words, the
operator can increase output when demand (and price) is high and

                                                                          11
decrease output if output falls. Therefore, the Groningen field is often
referred to as a swing supplier. That this option of being a swing supplier
is exploited in the past becomes apparent when looking at the detailed
production data. It appears that the supply from Groningen peaks in
winter periods and is relatively low in the summer. So, the Groningen gas
is primarily used to meat peak demand during winter time when the gas
price is higher (see Figure 2.3).
2.2 Dutch gas-market policies
Since the discovery of the Groningen gas field near the village Slochteren,
the Dutch gas policy changed multiple times. At the time of discovery, gas
markets did not play an important role, and the overall belief was that in
the future, all energy would be retrieved from nuclear power (see Correljé
& Verbong, 2004). Therefore, in the 1960’s, the objective was to deplete
the Groningen gas field as fast as possible. An additional objective of the
Dutch government was to secure gas supply for at least 25 years.
In the following decade, the view on the domestic natural resources
changed drastically. The oil crisis showed the strategic importance of
natural resources. This change in view led to a transformation of the
Western energy policies. In the Netherlands, the Groningen gas field was
suddenly a huge strategic storage worth to preserve. In terms of policy,
this was translated into the introduction of the Kleineveldenbeleid, an
offtake guarantee for small fields, in 1974. The incumbent operator of the
Dutch gas system, Gasunie, was required to buy gas from small fields in
favour of gas from the Groningen field (GasTerra, 2017). This resulted into
higher returns for these fields, enabling the preservation of the Groningen
gas field to be used for flexibility purposes (EZ, 2004). As could be
expected, the offtake guarantee led to lower production levels from the
Groningen gas field (Figure 2.1). As a result, the pace of depleting the
12Groningen field reduced as well. The current magnitude of gas reserves in
this field is estimated at about 500 bcm, which is still about 1/5 of the size
more than 50 years ago (Figure 2.2).
Figure 2.1. Gas extraction in the Netherlands, 1963-2016
Source: NAM, CBS
Figure 2.2. Gas reserves in the Groningen gas field, 1963-2018
Source: NAM, CBS
13Until begin 2000’s, Groningen production was regulated by a maximum
allowed production of all Dutch gas fields of 80 billion m3 (see Table 2.1).
The maximum allowed production of Groningen was thus determined by
the difference between this maximum and the actual production of smaller
fields (Mulder & Zwart, 2006).
Table 2.1. Production cap on the Groningen gas field per gas
year
Announcement date Valid gas Maximum Objective
year(s)1 annual
production
(bcm)
2000 Until 2005 80 minus Using
production small Groningen gas
fields as strategic
reserve
December 22, 2005 2006 42.5 (425 in
period of 10
years)
December 18, 2015 2015-2016 27 Reduce
earthquake
risks and
damage
June 24, 2016 2016-2017 24
April 18, 2017 2017-2018 21.6
March 29, 2018 2022 12
2023-2029 Gradual
reduction
2030 0
Source: Ministry of Economic Affairs (EZ)
However, the production of small-fields was expected to decline quickly.
Therefore, to prevent the rapid depletion of the Groningen gas field and to
maintain the flexibility of this field, a cap on the production of Groningen
was imposed (EZ, 2005). The policy implementation consisted of a cap on
1A gas year runs from October till September, so the cold-weather period with
high demand is in the beginning of the year. This is done to minimalize the chance
of a constraint with the cap.
14the production level of the Groningen field over a longer period of time.
For the period 2006-2015, the cap was set on 425 bcm without an annual
restriction. So, the producer could choose any yearly production level,
provided that the production over 10 years did not exceed 425 bcm. For
the period of 2010-2020, the same cap of 425 bcm was imposed.
Box 2.1: Dutch natural resources law
In contrast to other countries, the Dutch State is owner of all natural
resources and minerals from a depth of 100 metres. According to the
mijnbouwwet the Dutch government is allowed to outsource the mining
to a so-called concession holder. This concession holder has a monopoly
on the resources and minerals and their revenues (Art. 143.2
Mijnbouwwet). Under normal circumstances, the concession holder can
choose his production plan autonomously. The Dutch State is only
allowed to interfere under special conditions. These conditions include:
changed insights in the planned use or management of minerals, safety
considerations and prevention of damage to properties.
Furthermore, the license holder has to take all measures that can
reasonably be required to prevent that the mining activities cause
damage. The Minister may stipulate that security must be provided to
cover the liability for the damage that is caused by the movement of the
earth as a result of the extraction of minerals.
It is established that there has to be a Technische commissie
bodembeweging, which has to advise and inform the Minister and
potential affected inhabitants about damage caused by mining activities.
Finally, it is determined that there has to be a Waarborgfonds
mijnbouwschade. From this fund, damages can be paid whenever the
concession holder in unable to pay for it.
Next to compensation for damage to properties, the Dutch
Government established other measures to compensate for the damage
in Groningen. These measures include risk reduction, buy out,
compensation for property loss and subsidies. A more detailed review of
these measures is given in chapter 4.
In the 1990’s, the European energy markets were liberalised. The goal was
to foster competition which should lead to lower energy prices. A
15consequence of the restructuring of the gas market was that the gas system
was no longer controllable by a single party. Despite the liberalisation of
the gas market, the Dutch government remained involved in the
production of Dutch gas, based on the legal framework of the natural
resources law (see Box 2.1).
Although the regulation of the production volume from the
Groningen field is not a new phenomenon, the reason behind the
regulation from the government has changed. Where historical policies
regarding the gas market where focused on future security of supply, the
latest policy change has a new cause. After the earthquake of 2012 near
Huizinge, the main reason for the change in policy was the risk following
from gas-extraction induced earthquakes. The Dutch government
announced that the cap of 425 bcm on a 10-year basis would be replaced
by an annual cap of 27 bcm in 2015. This cap is now gradually lowered
several years. The current production cap for the Groningen gas field is
21.6 bcm. On March 29 2018, the Dutch government announced the end
of gas production in Groningen2. The maximum production from
Groningen will decline gradually in the period 2022 and 2030. In 2030 no
gas will be produced anymore from the Groningen gas field.
2.3 Groningen gas field in the European gas market
To be able to identify the role of the Groningen gas field in the gas market,
it is necessary to know which components make up this market. In other
words, who are the agents on the supply and demand side of the market?
As told before, the quality of natural gas differs between different sources.
The different types of natural gas have both different consumers and
producers.
2https://www.rijksoverheid.nl/onderwerpen/gaswinning-in-
groningen/nieuws/2018/03/29/kabinet-einde-aan-gaswinning-in-groningen
16Looking at the demand profile of natural gas in the Netherlands, some
clear distinctions can be seen. Industrial demand is relatively flat over
time, as demand is not seasonally bounded. Industrial usage of natural gas
is for the purpose of large scale heat generation or feedstock in industrial
processes. Given this usage of the natural gas, the type of gas with a higher
Wobbe-index is preferred by this type of user. Therefore, the natural gas
that goes to industrial demand is high-calorific gas. Consumer demand
and exports, which are mainly meant for foreign residential consumers,
have high seasonal flexibility. This follows from the fact that the natural
gas demanded by these groups is mainly used for heating. Both demand
categories with high seasonal flexibility, are supplied by natural gas with
a low calorific value. As a result, the demand in winter times is
significantly higher than during summer time. This seasonal component
of gas demand results in a seasonal fluctuations in the gas price (Mu,
2007: Hulshof et al., 2016).
Figure 2.3. Monthly production from the Groningen gas field,
January 2011 – November 2017
Source: Bloomberg
Looking at the supply side of the market for natural gas, both the
imports and the production by small fields are relatively flat over time.
17Both these types of supply contain natural gas with a high calorific value.
The other two types of supply show large variability over time. These are
the Groningen field, acting as a swing supplier, and the storages (see
Figures 2.3 and 2.4). As can be seen, the storages are historically used only
in times of peak demand. These peak demands are reached on extreme
cold winter days. Note that these storages are filled up again in summer
times. Both the gas from the Groningen field and (most of) the storages
have a low calorific value. These storages are meant to support the
Groningen gas field to deliver flexibility to the market. The supporting role
of the storages has increased over time as Groningen is increasingly less
able to act as swing supplier (see also Hulshof et al., 2016).
Figure 2.4. Daily net injection from storages, January 2011 –
November 2017
Source: Bloomberg
Concluding, the different origins of supply serve different end-users. The
high-calorific gas demand by the industry is supplied by the small-fields
and imports from countries like Russia and Norway as well as the import
of LNG. The low-calorific gas demanded by domestic and foreign
consumers originated from the Groningen field. In summer times,
storages are filled to meet excessive peak demand in winter periods. Due
18to the nature of their usage, the high-calorific gas has a rather flat
production and consumption path, where the low-calorific gas is highly
volatile.
2.4 Impact of lower production cap on gas market and consumption
As explained above, the gas-induced earthquakes were the reason for the
Dutch government to lower the cap on the annual production from
Groningen. Given the importance of the Groningen field one may expect
that this policy change has an effect to the gas market. One can argue that
the limitation of production on Groningen makes the availability of
natural gas more difficult. This in turn might lead to higher prices for
natural gas.
This relation of the limited availability of Groningen gas and the
natural gas price is investigated by Perey (2018).3 It was found, however,
that there is no significant evidence of an effect of the lowering of the cap
on the Dutch gas price (Figure 2.5). This lack of effect on the price can be
explained by the existence of substitution in supply. In other words, the
supply of Groningen that is gone due to the lowering of the cap is likely
replaced by another source. This mechanism shows the well-functioning
of the integrated European gas markets. This is in line with earlier findings
of Kuper et al. (2016) of a more integrated European gas market.
Because the residential sector depends on L-gas, a reduced
availability of the Groningen gas implies that H-gas has to be used in
combination with quality conversion. Quality conversion is the conversion
of H-gas to L-gas, which is done by adding nitrogen to H-gas to obtain a
similar level of thermic value as L-gas. The problem with conversion is that
3The investigation consisted of an empirical analysis of the influence of the lower
cap on the gas price of the Title Transfer Facility (TTF), a virtual gas trading hub
in the Netherlands. To be able to identify the sole effect of the production cap,
control variables were added to the regression.
19the amount of H-gas converted to L-gas is limited to the maximal output
of conversion facilities. According to Thackrah (2018), the quality
conversion facilities already reached their maximum capacity at times in
December 2017. This was caused by excessive demand, driven by cold
weather, which could not be met by Groningen production. At the same
time, around 1 billion cubicle metres (bcm) was withdrawn from the Norg
storage.
Figure 2.5. Daily gas price at TTF (in €/MWh), 2010-2018
Note: Bold lines: dates of major earthquakes; dotted lines: dates of government
announcement of lower production cap.
Sources: Bloomberg L.P., NAM, EZ
Given the new cap and announcement of further lowering of that cap,
it becomes clear that Groningen can no longer serve as a swing supplier.
To be able to meet the higher demand in times of cold weather, storages
and quality conversion have to play an increasing role. Since both sources
are constraint to a maximum, future investments have to be made to take
over the role of Groningen. Indeed, in the announcement of the end of
production in Groningen, the government also announced an investment
of 500 million euro in a new quality conversion station.4
4https://www.rijksoverheid.nl/onderwerpen/gaswinning-in-
groningen/nieuws/2018/03/29/kabinet-einde-aan-gaswinning-in-groningen
202.5 Energy transition
The policy measures to reduce and ultimately stop the gas production
from Groningen fit within the policy objectives to realize an energy
transition in which fossil energy is being replaced by renewable energy.
Reducing the supply of gas from one source (i.e. the Groningen field) does
in itself, however, not bring this energy transition. As we have seen in the
previous section, the cap on Groningen has hardly affected the
international price of gas, which means that the market parties expect that
the Groningen gas can be easily replaced by gas from other sources
because of the international integration of gas markets. Therefore,
measures to reduce the gas consumption are required. The Dutch
governments wants to reduce the gas use in the residential sector
(housing) by electrification (e.g. heat pumps) and extending district-heat
systems. Electrification means that the demand for electricity increases,
on top of the autonomous increase in electricity demand.
In a scenario analysis of the Dutch energy system, Moraga and Mulder
(2018) conclude that the total electricity demand will be 50% higher in
2050 compared to the current level, which is mainly due to the increased
demand resulting from electrification of housing and the transport sector.
Although the supply of renewable energy (in particular wind and solar)
will increase strongly according to current policy objectives, this increase
will not be sufficient to displace natural gas from the electricity sector. In
a scenario where the current gas demand in the residential sector is
gradually fully replaced by a mixture of electrification and district heating,
while the transport sector is also almost fully electrified, the domestic
demand for natural gas remains at about the current levels. In
combination with the declining supply from both the Groningen gas field
and the small fields, the import of gas has to grow strongly.
21Figure 2.6. Supply of gas to meet Dutch gas demand, in case of
electrification of heating and transport and strong
increase of renewables, 2016-2050
Source: Moraga and Mulder (2018)
Even if the supply of renewable energy were 3 times as large as the
current policy objectives, the import of natural gas would still be
significant in the long term in order to meet the demand within the Dutch
economy (Figure 2.6). In this scenario, the electricity sector would be fully
based on renewable energy. The total supply of electricity would exceed
the total demand (on an annual basis) which would make it possible to
produce synthetic gas for industry usage, though the supply would not be
sufficient to meet all demand. From this scenario analysis, it appears that
while the Groningen gas production will stop at some point not far in the
future, the gas sector will likely remain necessary to supply gas to the
electricity sector, residential sector and industry in the Dutch economy for
many years to come.
22References
Correljé, A., & Verbong, G. (2004). The transition from coal to gas: radical
change of the Dutch gas system. System innovation and the transition
to sustainability: theory, evidence and policy, 114-134.
GasTerra. (2017). https://www.gasterra.nl/producten-diensten/de-
markt-van-nu/kleineveldenbeleid-2.
Hulshof, D., van der Maat, J. P., & Mulder, M. (2016). Market
fundamentals, competition and natural-gas prices. Energy Policy, 94,
480-491.
Klimstra, J. (1986). Interchangeability of Gaseous Fuels—the Importance
of the WOBBE-INDEX (No. 861578). SAE Technical Paper.
Kuper, G. H., & Mulder, M. (2016). Cross-border constraints, institutional
changes and integration of the Dutch-German gas market. Energy
Economics, 53, 182-192.
Mijnbouwwet. (2002, October 31). Consulted on April 11, 2018. Retrieved
from: http://wetten.overheid.nl/BWBR0014168/
Ministry of Economic Affairs (EZ), 2004, Gas production in the
Netherlands; importance and policy, Publication code 04ME18.
Ministry of Economic Affairs (EZ), 2005, Voorzienings- en
leveringszekerheid energie, Tweede Kamer der Staten Generaal, 2005-
2006, 29 023, nr. 21, 22 december.
Mu, X. (2007). Weather, storage, and natural gas price dynamics:
Fundamentals and volatility. Energy Economics, 29(1), 46-63.
Mulder, M., & Zwart, G. (2006). Government involvement in liberalised
gas markets; a welfare-economic analysis of Dutch gas-depletion policy
(No. 110). CPB Netherlands Bureau for Economic Policy Analysis.
Moraga, J.L. & Mulder, M. (2018). Electrification in heating and
transport; a scenario analysis for the Netherlands up to 2050.
University of Groningen, CEER Policy Papers, 2, May.
Perey, P. (2018). Shake now or extract later; a cost-benefit analysis of
lowering the cap on the Groningen gas field, with special attention to
earthquakes. MSc thesis, University of Groningen.
Thackrah, A. (2018). Going, Going, Groningen… ICIS Market Insight,
January.
2324
3. The Janus Face of Natural Gas Resources in the
   Netherlands
   Bert Scholtens

3.1 Introduction
This chapter argues that the exploitation of the natural gas field in
Groningen has both positive and negative effects on the Dutch economy.
These effects are hard to balance due to their incommensurable nature.
The chapter reflects on the role of gas in the Dutch economy, discusses the
economic implications of the exploitation of natural gas as well as the
externalities, and reflects on the economic impact of phasing out the
exploitation of the Groningen field.
    The organization of this chapter is as follows. Section 3.2 goes into gas
revenues in the Netherlands. Section 3.3 highlights how to assess the
revenues from natural resources from an economic perspective and
reflects on the conventional wisdom that abundant natural resources are
a blessing for society. Section 3.4 discusses key features of the impact of
reducing the exploitation of gas from the Groningen field. A brief
conclusion is in 3.5.

3.2 Gas revenues
The proceeds from natural gas exploitation go into the government budget
(90%) and to the mining companies (10%). Since its discovery in 1959, the
Groningen gas field has yielded about 288 billion Euros for the
government’s finances, whereas the mining companies (ExxonMobil and
Royal Dutch Shell) earned 29 billion Euros (Algemene Rekenkamer, 2014;
CBS, 2017). Figure 3.1 provides an overview of the nominal revenues and
the role of these revenues in the government budget. In most years, gas
revenues made up between 3 and 6% of the government’s revenues.

                                                                          25
Especially in the late 1970s and early 1980s, the contribution of gas to the
government budget was relatively high. At that time, the gas revenues
were a very welcome source of expenditure for the respective Dutch
governments. Due to falling prices and societal pressure to reduce the
exploitation, the contribution in the last few years has been low from an
historical perspective.
Figure 3.1. Total natural gas revenues for Dutch state and its
share in the total government revenues per year
Source: CBS
One needs to realize that it is both the volume of gas exploited and the
international gas prices that make up the revenues. According to the Dutch
Committee on Safety (Onderzoeksraad voor Veiligheid, 2015), the desire
to maximize gas revenues drives the former. In the early 1960s, there was
great anxiety with the government that nuclear power would become the
main energy source and would impair the value of the gas reserves. Hence,
they set up long-term contracts to fix the export of gas. The gas prices
relate to developments in international gas and oil markets, which have
shown substantial volatility (see figure 3.2 for gas prices in the 21 st
century).
26Figure 3.2. Natural gas price at Henry Hub and Brent oil price,
January 2000 – March 2018
Source: Bloomberg
As to the externalities of the exploitation of natural gas, it is important
to realize that the main agents (See Box 3.1) were fully informed about
these but did not engage with either mitigation or adaptation (Malm,
2016; Supron and Oreskes, 2017). Further, the first earthquakes in
relation to the exploitation of natural gas were already occurring in the
1960s and brought to the attention of the authorities (Van der Sluis, 1989;
Reijnders and Van der Sluis, 1997). These externalities were left unpriced
and hence did not influence the revenues until the 21st century.
The exploration and exploitation of gas is capital intense, but
operational costs are quite limited. Gas exploration and exploitation
currently involves about 7000 jobs (and Box 3.1 show the governance structure of gas exploitation in the
Netherlands.
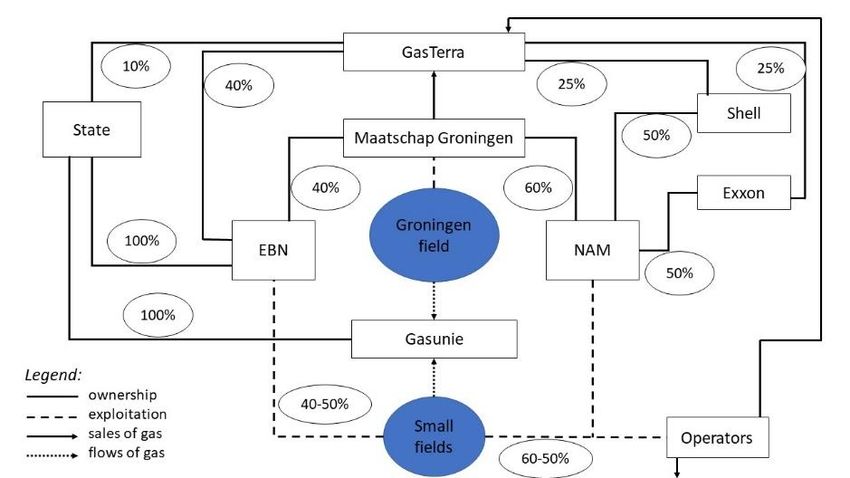
Figure 3.3. Organisation of the Dutch natural gas system
Source: updated version of Mulder and Zwart (2006)
The gas revenues fund the general government’s expenses and
support the Dutch welfare system. During a 17-year period, part of the gas
revenues funded specific projects that aimed at improving the economic
structure. These projects previously had been on the regular government
budget. In total, these projects amounted to € 17 billion of investments.
Examples are a high-speed railway track between Amsterdam and the
Belgian border, the extension of the Rotterdam harbour, a freight-carrier
railway track to the German border, and applied scientific research.
Although an ex ante cost-benefit analysis was being used (Mulder and
Zwart, 2006), there was no systematic reporting about the economic
impact of these projects, and there is no proof they actually improved the
28economic structure and earning capacity. The investments did not occur
in the region were the exploitation of gas was located; less than 1% of the
investments materialized there, which was generally perceived as unfair
(IOO, 2006).
Box 3.1: Governance of Dutch natural gas system
The Dutch government participates in gas mining activities via its fully
owned company Energie Beheer Nederland (EBN). Together with the
Nederlandse Aardolie Maatschappij (subsidiary of Royal Dutch Shell and
ExxonMobil), it has set up the Maatschap Groningen to manage the
exploitation of the Groningen field. The Maatschap Groningen sells to
GasTerra, which is a joint venture of EBN, the Dutch State, Royal Dutch
Shell and ExxonMobil. Gasunie is responsible for transport and fully
owned by the Dutch State.
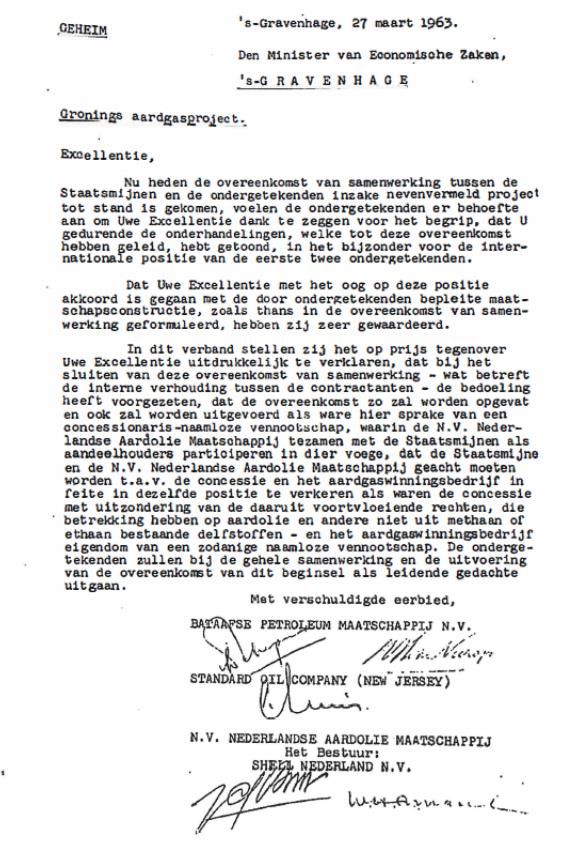
The Maatschap Groningen does not need to register with the Chamber of
Commerce, and does not need to disclose its operations and organization.
Officially, the concession for exploitation is exclusively to NAM. However,
in a side-letter it reads that the concession to Maatschap Groningen is a
limited company with two shareholders (the Dutch State and NAM).
Appendix 3.A shows this letter (in Dutch). The side-letter may become
crucial in the debate about the role of the Dutch State in the settlement of
the claims regarding the impact of the exploitation of gas on climatic
changes and of the earthquake damage and as such may have an impact
on the gas revenues as it reveals that the State is a shareholder and is
committed to the exploitation.
Alternatively, one might want to investigate the international impact
of investments in Dutch gas infrastructure (Bouwmeester and Scholtens,
2017). To this extent, they estimated the cost-side impact of investments
29in gas transmission by quantifying the direct and indirect, national and
international impacts based on a multi-regional input-output model. They
estimated the value of investment projects included in the EU’s Ten Year
Network Development Plans. The overall budgets for these plans translate
into gross fixed capital formation by the industries that manufacture the
pipelines, compressor station elements, storage facilities, and
interconnectors. It appears that two-thirds of employment compensation
and four-fifths of the gross operating surplus of gas projects in the
Netherlands lands abroad (Bouwmeester and Scholtens, 2017, p.376).
This clearly shows the openness of the Dutch economy.
The gas revenues make up part of the central government’s revenues
and as such contribute to general government spending. Most of it
supported the design and maintenance of the social welfare system, the
health system, and the education system. This has been helpful for the
social and economic development of the Netherlands. However, we lack a
proper metric to assess the use of the gas revenues, especially in relation
to externalities such as climate change and earthquakes.
3.2 How to assess resource use?
A conventional approach to assess the use of revenues from natural
resources is the Hartwick (1977) rule (see also Asheim et al., 2003). This
rule holds that countries need to invest the proceeds from their natural
resources in reproducible capital that yields enough to keep per capita
wealth intact. Of course, in practice, it is hard to specify which part of
natural resources revenues should be invested in which type of capital.
Important is to realize though that from an economic point of view the
investments should allow for the sustainability of the aggregated stock of
capital. Future generations are entitled to at least the same stock of capital
as current ones. In the case of the natural gas resources, one might
30imagine that part of the funds are used to allow for the development of
alternative sources of energy generation. There is no compelling evidence
that the consecutive Dutch cabinets explicitly accounted for this
intergenerational perspective when they decided about spending the
proceeds.
Until the 1990s, natural resources usually were regarded as a blessing
for the domestic economy. The rents would accrue to the Dutch State,
which would have additional financial resources that could help
strengthen the country’s economic structure. However, the new economic
growth theory and the accompanying empirical research came up with a
very different perspective. Sachs and Warner (1997) established that
countries highly reliant on primary exports did underperform in relation
to countries that relied less on natural resources. This finding appeared to
be robust after controlling for various factors, such as initial GNP,
openness, legal system, institutions, endowment of all kinds of capital,
price shocks, etc. (Gylfason, 2001; Mehlum et al., 2006). Please realize
that there are contrasting views (see Alexeev et al., 2009), and that the
heterogeneity between countries and natural resources is substantial
(Torvik, 2009). This means that it is not possible to arrive at general
statements about the exact impact of the availability of particular natural
resources on wealth in a specific country. Therefore, it seems relevant to
have a closer look at the transmission mechanisms that might be at work
regarding the impact of resource endowment on economic performance.
Several factors might play a role regarding the impact of resource
abundance on economic development. The most famous one probably is
the Dutch disease. The Economist coined this qualification to describe the
effect of gas revenues on the Dutch economy. It relates to the effect of an
increase in export revenues of a natural resource on the exchange rate.
This might result in a real appreciation of the exchange rate. Appreciation
31implies that the exports become relative expensive and therefore less
attractive for international markets. This has a negative impact on the
competitive position of those industries that are not highly reliant on the
abundant natural resource. Consequently, there is a (relative) reduction in
the role of the industry in the economy and there will be less economic
diversification (Sachs and Warner, 1995). In the Netherlands during the
1970s, the high revenue generated by the natural gas discovery led to a
sharp decline in the competitiveness of its other, non-booming tradable
sector (Corden, 1984). Despite the revenue windfall, the Netherlands
experienced a drastic relative decline in economic growth. When the
Netherlands swapped the national currency for the Euro, the impact of the
Dutch disease watered down considerably. When gas revenues make up a
smaller part of total revenues, this of course too has a dampening effect.
Other adverse factors that play a role in the relationship between
natural resources and the economy are price volatility, education and
research, and rent-seeking. Van der Ploeg and Poelhekke (2009) show
that the volatility of oil prices, which usually anchored natural gas prices
until a couple of years ago, has a negative impact on growth. Revenues
fluctuate and this makes it difficult to project the returns on investments
within the economy. Further, Gylfason (2001) highlights that in resource-
rich countries, the opportunity costs to accumulating human capital are
very high. Due to myopic policies, there is too little investment in human
capital. This too depresses the growth potential. A fourth factor is rent-
seeking. The existence of natural resources attracts firms and institutions
that try to benefit from their abundance. They tend to focus more on
keeping a privileged position than on productive activities. Such rent-
seeking is reflected in lobbying and results in suboptimal government
spending (Papyrakis and Gerlagh, 1997).
32It is not possible to pinpoint at a detailed and exact level how each of
these factors has affected the Dutch economy in relation to its natural gas
resources. They highlight that next to benefits from the presence of these
resources, there also is a cost. This also signals that the use of the revenues
might have been not highly efficient and that the behavioural changes that
resulted from having the gas may have led to a welfare loss. These effects
occur next to the negative externalities of exploiting fossil resources. The
greenhouse gas emissions from using natural gas contribute to the
concentration of these gases in the atmosphere and, as such, to climate
change. The fossil mining companies have been staunch supporters of
denying any such relationship (see Supron and Oreskes, 2017), and most
Dutch consumers have been keen to use their services. The increasing
damage of the earthquakes resulting from the mining of gas in the
northern regions of the Netherlands also adds to the costs of natural
resources. Until recently, ExxonMobil and Royal Dutch qualified
allegations of the earthquakes resulting from mining gas as ‘nonsense’
(van der Sluis, 1989; Reijnders and Van der Sluis, 1997). This showed that
next to the positive side (the revenues), the exploitation of the gas
resources also had a negative side (growth distortion and externalities.
Maximizing the exploitation is in the interest of the government (on
behalf of society as a whole) and the mining companies, but also has the
largest negative impact on the communities living in the areas where the
gas is exploited. Thus, there is a conflict. How much and how fast should
gas fields be exploited? From a pure economic point of view, according to
the Hotelling rule, one should decide this based by comparing the returns
from the risk-free investment of the net revenues (i.e. revenues after
deducting the exploration, development and exploitation costs, and the
compensation of the negative externalities) and the result of non-mining
the natural resource. If fuels become scarcer, it might be attractive to
33postpone gas mining, as the future prices may be even higher. The same
holds if the negative externalities increase. Further, in a situation of
almost zero or even negative interest rates, it is attractive to postpone
mining. There is no evidence that government and mining companies
accounted for these considerations when making decisions to mine the gas
and to maximize the revenues from exploitation (Algemene Rekenkamer,
2014; Onderzoeksraad voor Veiligheid, 2015).
3.3 Impact of reducing gas exploitation
In March 2018, the Dutch government announced that the exploitation of
the Groningen gas field will be gradually phased out and should end in
2030. Details are not available yet, but the expectation is that the revenues
may be halved (i.e., be 50 billion Euros). It is not clear how this phasing
out relates to the already foreseen end of the exploitation of the field.
Would slowing down the exploitation of gas affect the future wealth of the
Netherlands? This is not very likely as the exhaustion of the Groningen
field is well-known and any gas remaining in the gas fields is an asset.
Reducing the speed of exploitation implies that revenues will be lower
now, but they may be higher in the future, given the price of natural gas
and the volume that can be safely mined. Implicitly, the government
seems to have made a trade-off between maximizing the revenues from
exploitation and facing the increasing burden of climate change and
earthquake claims.
An issue might be that the partners in the exploitation of the
Groningen gas field, i.e. ExxonMobil and Royal Dutch Shell, put a claim
with the Dutch government due to income lost. However, this is unlikely,
as the contract reads that both the commercial parties and the government
are in it together (see Appendix 3.A). The government will ‘lose out’ much
more than the two companies, as it gains much more from exploitation
34than the commercial parties. Further, all three are liable for the repairs
(and probably compensation) of the damage done and any damages that
might occur in the future. Both the tapering off of the exploitation of the
Groningen field as well as the increasing costs regarding the reparations
from earthquake damage will have a negative impact on the Dutch
government budget. In part, this was already projected in the past. But
what differs is that the speed of the tapering is higher, as are the reparation
costs.
The negative externalities from exploiting the gas fields (i.e. higher
probability of flooding, lowering of the underground, earthquakes) require
adaptation and mitigation and, hence, expenditures. Here, it is quite
straightforward that this will reduce the revenues from owning the gas
resource as this is the cause of the negative externalities and the
government is committed to its exploitation (see Appendix 3.A). For the
mining companies, it might translate in the stranding of part of their
assets.5 Stranded assets are investments that have already been made but
which, at some time prior to the end of their economic life (as assumed at
the investment decision point), are no longer able to earn an economic
return. The extent of strandedness of the gas reserves relates to the advent
of new technologies and/or regulation (see also Van der Ploeg and
Withagen, 2015). In this respect, it is frequently mentioned that it would
have been welcome to set aside part of the gas revenues (as in the case of
Norway). Nevertheless, the problems regarding fiscal policy and the
strandedness of assets could have been substantially mitigated in case the
externalities had been properly accounted for. From an economic point of
view, this is the first best solution.
5Royal Dutch Shell (2018) claims that she expects none of her assets will become
stranded.
35In all, it should be clear that phasing out the exploitation of the Groningen gas field will reduce government revenues. The expected revenues (of about 50 billion euros) should be able to compensate for the costs in relation to earthquake damage in the region. Here, one needs to keep in mind that the effects of mining for gas are likely to have an impact on the underground that will last for at least several decades (Bourne et al., 2014). What is ‘left’ after the reparations of the earthquake damage, could be considered to help support the transformation of the energy system. In the future energy system, electricity is supposed to come to play a far more dominant role. This may diminish the influence of the fossil fuel trade, reduce the choke points that have made fossils a source of global tension, put energy production into local hands and make power more accessible to the poor. It will also make the world cleaner and safer. However, the transition process is unlikely to be very smooth, given the vested interests and the costs of transiting to a new energy system. Hence, it is clear that the energy system will remain to have an effect on the government budget. 3.4 Conclusion I studied the economics of the revenues of natural gas resources in the Netherlands. These revenues show to have a Janus face. So far, the Groningen gas field has yielded almost 290 billion Euros in government revenues. However, the Dutch policy of maximizing revenues from the exploitation of the gas fields paid insufficient attention to negative externalities. More specifically, appropriate performance and risk assessment and management never were in place regarding social and environmental externalities. As a result, there are ‘nasty surprises’ for all stakeholders, namely earthquake damage, environmental pollution, loss of business, loss of income, and stranded assets. The Groningen gas field 36
will remain to play a role in Dutch government revenues, even when the
exploitation is phased out. In the past 60 years, it was a profit center, but
the realization of the externalities has turned it into a cost center, which is
probably here to stay for several decades.

References
Alexeev, M, Conrad, R., 2009. The elusive curse of oil, Review of
  Economics and Statistics, 91, 586-598.
Algemene Rekenkamer, 2014. Besteding van aardgasbaten: feiten, cijfers
  en scenario's. Den Haag.
Asheim, G.B., Buchholz, W., Withagen, C., 2003. Hartwick's rule: Myths
  and facts. Environmental and Resource Economics, 25, 129-150.
Bourne, S.J., Oates, S.J., Elk, J. van, Doornhof, D., 2014. A seismological
  model for earthquakes induced by fluid extraction from a subsurface
  reservoir, Journal of Geophysical Research: Solid Earth, 119, 8991-
  9015.
Bouwmeester, M., Scholtens, B., 2017. Cross-border investment
  expenditure spillovers in European gas infrastructure. Energy Policy,
  107, 371-380.
Centraal Bureau voor de Statistiek (CBS), various years. De Nederlandse
  economie various years.
Corden, W.M., 1984. Booming sector and Dutch disease economics:
  Survey and consolidation. Oxford Economic Papers, 36, 359–380.
Gylfason, T., 2001. Natural resources, education, and economic
  development, European Economic Review, 45, 847-859.
Hartwick, J.M., 1977. Intergenerational equity and the investment of rents
  from exhaustible resources, American Economic Review, 67, 972-974.
Instituut voor Onderzoek van Overheidsuitgaven (IOO), 2006. Quick scan
  regionale verdeling FES-toezeggingen. Leiden.
Malm, A., 2016. Fossil Capital. Verso.
Mehlum, H., Moene, K., Torvik, R., 2006. Institutions and the resource
  curse, Economic Journal, 116, 1-20.
Mulder, M., Zwart, G.T.J., 2006. Government involvement in liberalized
  gas markets. Den Haag.
Onderzoeksraad voor Veiligheid, 2015. Aardbevingsrisico’s in Groningen.
  Den Haag.
Papyrakis, E., Gerlagh, R., 2007. Resource abundance and economic
  growth in the United States, European Economic Review, 51, 1011-1039.
Reijnders, L., M. van der Sluis, 1997. Dutch drowning syndrome.
  Groningen.
Royal Dutch Shell. Shell Energy Transition Report. Den Haag.

                                                                           37
Sachs, J.D., Warner, A.M., 1995. Natural Abundance and Economic Growth, NBER Working Paper 5398. Sachs, J.D., Warner, A.M., 1997. Fundamental sources of long-run growth, American Economic Review, 87, 184-188. Sluis, M. van der, 1989. Aardbevingen in Noord-Nederland. Hoogezand. Supron, G., Oreskes, N., 2017. Assessing ExxonMobil’s climate change communications (1977-2014). Environmental Research Letters 12, 084019. Torvik, R., 2009. Why do some resource-abundant countries succeed while others do not? Oxford Review of Economic Policy, 25, 241-256. Van der Ploeg, R., Poelhekke, S., 2009. Volatility and the natural resource curse, Oxford Economic Papers, 61, 727-760. Van der Ploeg, R., C. Withagen, 2015. Global warming and the green paradox: A review of adverse effects of climate policies, Review of Environmental Economics and Policy, 9, 285–303. 38
Appendix 3.A Side-letter gas exploitation

                                            39
40
4. Taking it home: impact of earthquakes on the regional
  housing market
  George de Kam

4.1. Introduction
The strongest seismic activity caused by gas extraction is observed in the
rural part of the province of Groningen, which is located in the Northern
periphery of the Netherlands. Light earthquakes and damages to
buildings, however, have also been felt in the provincial capital city of
Groningen. Until now, 170.000 persons have been confronted with
damage, half of them twice or more times (Postmes, Stroebe et al., 2018).
Two-third of the province’s housing stock is located in areas where
damages have been reported (De Kam, 2016). In the area with the highest
seismic risk, 22.000 houses will have to be checked for their compliance
with ‘near collapse’ building standards.
   Housing is probably the most important linkage between seismic
activity caused by gas extraction and the daily life of people living on top
of the gas field. Because of the stress caused by damage to properties and
perceived seismic risk, an increasing number of people want to move out
of the affected area. At the same time, less people want to move in. Both
processes have a negative effect on the housing market. In recent years
several policy measures have been implemented to compensate and to
mitigate the earthquake impacts on housing. In spite of these measures
evidence shows that the housing market is struggling, and that the
(perceived risk of) earthquakes does have a negative effect on transaction
prices in the affected area. This chapter gives an overview of the effect of
the earthquake risks on the regional housing market. We conclude with
some suggestions for policy measures that can improve the functioning of
the regional housing market.

                                                                         41
You can also read