Falling Short Shale Development in West Virginia Fails to Deliver on Economic Promises - ieefa
←
→
Page content transcription
If your browser does not render page correctly, please read the page content below
1

Cathy Kunkel, Energy Analyst, IEEFA
Sean O’Leary, Senior Policy Analyst, WV Center on Budget and Policy
Ted Boettner, Executive Director, WV Center on Budget and Policy
February 2019

Falling Short
Shale Development in West Virginia Fails to
Deliver on Economic Promises
Executive Summary
Natural gas production in West Virginia has increased by nearly a factor of six over
the past decade. When shale drilling first took off in West Virginia, the industry was
projected to deliver not only production increases, but also significant economic
development gains for the state.

This report reviews the actual economic and financial performance of the shale
industry in West Virginia over the past decade. Key findings include:

   •   The economic development gains of the shale industry have
       underperformed initial projections. This partly reflects the exaggerated
       early claims made by the industry and industry-funded studies. It also
       reflects the failure of these initial studies to anticipate the significant and
       sustained collapse in natural gas prices resulting from the large increase in
       production.

   •   Initial studies projected a sustained growth in natural gas severance tax
       revenues. In reality, severance tax revenues grew through Fiscal Year 2015
       and then fell off. Fiscal Year 2018 natural gas severance tax revenues were
       only 15% higher than FY 2008 revenues, adjusted for inflation.

   •   Job gains in the natural gas industry have also been lower than projected a
       decade ago. The natural gas industry added 2,600 net new jobs from 2008 to
       2017, as compared to gains of up to 5,700 new jobs by 2015 projected by
       early studies. The only reason that there has been any growth in
       employment at all from 2008 to 2017 is the increase in employment due to
       natural gas pipeline construction, which are largely temporary jobs; jobs in
       drilling and related support activities have actually declined. About 40% of
       pipeline construction jobs are held by out-of-state workers.

   •   Natural gas production is concentrated. Six of the state’s 55 counties
       produced 80% of West Virginia’s natural gas in 2017. Shale development has
       had a mixed impact on economic development at the county level in the top-
       producing counties. While there have been some gains in household income
       and educational attainment, overall these counties continue to decline in
       population and poverty levels remain comparable to a decade ago. Key
Falling Short: Shale Development in West Virginia
Fails to Deliver on Economic Promises                                                     2

       economic development indicators in these counties appear to follow a
       boom-and-bust pattern, tracking the price of natural gas.

   •   Early studies also failed to anticipate the negative economic and fiscal
       impacts of shale drilling on the state, including the economic collapse of coal
       mining, driven in large part by the glut of inexpensive shale gas. Initial
       studies also ignored the long-term liabilities that the expansion of drilling is
       creating for the state, in the form of hundreds of millions of dollars of
       orphaned well remediation costs.

   •   Today the natural gas industry is again promising significant economic
       development benefits from what it sees as the next big opportunity:
       Appalachian petrochemical development. We find that such claims are likely
       to be overstated, given the significant challenges stemming from domestic
       and international competition, as well as the financial weakness of the shale
       drilling industry itself.

West Virginia has a long history of economic boom-and-bust tied to coal extraction.
Despite its vast natural resource wealth, the state has consistently ranked among
the poorest in the nation. This report looks at whether the state can avoid repeating
its past mistakes with the coal industry and use its natural gas resources to
contribute to lasting in-state wealth.

Given the uncertain future outlook for the natural gas industry in West Virginia, we
recommend that the state’s economic development strategy take advantage of the
near-term potential for continued production growth, but not count on the natural
gas industry’s rosy long-term economic development forecasts proving any more
reliable than its projections a decade ago. Specifically, we recommend that the state
raise the current natural gas severance tax rate to compensate for the current low-
price environment (which has resulted in lower than anticipated severance tax
collections) and use this money to finance the state’s Future Fund to provide
resources for diversified economic development less dependent on resource
extraction and the vagaries of energy markets.

This paper starts with a review of the natural gas industry’s performance in West
Virginia, followed by a comparison of the actual state-level economic development
impacts to what was promised a decade ago. We then explore in more detail the
economic impact that shale drilling has had in the six top-producing counties. We
conclude by reviewing the outlook for the industry in West Virginia and make
recommendations for the state to minimize a potential “resource curse” by investing
in the state’s Future Fund.
Falling Short: Shale Development in West Virginia
Fails to Deliver on Economic Promises                                                                                                          3

 Table of Contents
 Executive Summary .............................................................................................................. 1
 A Decade of Shale Industry Development .................................................................... 4
 The Promised State-Level Economic Impact of Shale Development in West
 Virginia Has Largely Failed to Materialize ................................................................ 11
 The Economic Development from Shale Drilling Has Largely Followed a
 Boom-and-Bust Pattern in the Largest Shale-Producing Counties ................. 21
 Shale Industry in West Virginia Faces Uncertain Outlook .................................. 30
 Can West Virginia Avoid a Resource Curse in Shale Development? ............... 37
 A Softer Landing from Shale Development ............................................................... 41
 Conclusion ............................................................................................................................. 48
Falling Short: Shale Development in West Virginia
Fails to Deliver on Economic Promises                                                           4

A Decade of Shale Industry Development
Rapid Production Growth, Falling Prices and Concentration
of a Few Top Producers
The total amount of natural gas produced in West Virginia increased by nearly a
factor of six from 2009 to 2017, as shown in Figure 1. Increasingly, this natural gas
was produced from shale drilling, predominantly in the Marcellus share formation
(but also in the Utica). Shale drilling grew from 18% of the state’s total natural gas
withdrawals in 2007 to 84% in 2017.

Conventional natural gas production has fallen over the period, as low natural gas
prices resulting from the glut of Marcellus shale production have forced many
conventional drilling operations out of business.

Figure 1: Gross Withdrawals of Natural Gas from Shale Resources in West
Virginia Have Increased Dramatically in the Last Decade
                       1800
                       1600
                       1400
                       1200
  Billion cubic feet

                       1000
                        800
                        600
                        400
                        200
                          0
                           2007 2008 2009 2010 2011 2012 2013 2014 2015 2016 2017
                                            Non-Shale   Shale
Source: Energy Information Administration, "West Virginia Natural Gas Gross Withdrawals," Dec
31, 2018. And Energy Information Administration, “West Virginia Natural Gas Gross Withdrawals
from Shale Gas,” Dec 31, 2018.

This explosion in natural gas production mirrors the national trend. The following
two graphs show U.S. total natural gas production and U.S. natural gas production
from shale, illustrating the dramatic take-off of shale gas production, particularly in
the Marcellus Shale, since around 2009-2010.
Falling Short: Shale Development in West Virginia Fails to Deliver on Economic Promises 5 Figure 2: United States Gross Withdrawals of Natural Gas and Natural Gas Liquids Show Rapid Growth from Shale in the Last Decade Source: Energy Information Administration, "Natural Gas Gross Withdrawals and Production," Dec 31, 2018. Figure 3: Marcellus Shale Has Dominated U.S. Dry Shale Gas Production Source: Energy Information Administration, Natural Gas Weekly Update, January 17, 2019.
Falling Short: Shale Development in West Virginia
Fails to Deliver on Economic Promises                                                               6

Natural gas production in West Virginia is heavily concentrated in a few northern
counties. In 2017, the top six counties (Doddridge, Wetzel, Tyler, Ritchie, Marshall
and Harrison) together accounted for 1,187 bcf of natural gas production, or 80% of
the state’s total production.1 Only two of these counties— Ritchie and Harrison—
were significant natural gas producers prior to the shale boom. These six counties
collectively produced 28 times more gas in 2016 than they did in 2007, as shown in
Figure 4.

Figure 4: Natural Gas Production Has Sharply Increased in the Top Six
Counties

Source: WV Geological and Economic Survey database.

Alongside the growth in natural gas production, West Virginia has also seen a sharp
increase in natural gas liquids (NGLs) production. Natural gas liquids are heavier
hydrocarbons (ethane, propane, butane and heavier compounds) that are produced
alongside natural gas; “wet gas” contains a significant fraction of NGLs that can be
separated and sold if economic conditions are favorable. The core Marcellus acreage
in West Virginia is wet gas.2

1 P. Dinterman, “2017 Marcellus Shale and Utica-Point Pleasant Production Summary,” West
Virginia Department of Commerce Geological & Economic Survey, August 24, 2018.
2 In August 2017, the CEO of Southwestern Energy, which produces natural gas from both the wet

gas-rich Marcellus acreage of southwestern PA and western WV and from the dry gas-rich
Marcellus acreage of northeastern PA explained that those two areas “compete back and forth
and the liquid side of that business, the realizations from NGLs … is really the lever that moves
that [investment] decision back and forth.” (Southwestern Energy, 2nd Quarter 2017 earnings call,
August 4, 2017).
Falling Short: Shale Development in West Virginia
Fails to Deliver on Economic Promises                                                                 7

Figure 5: West Virginia Natural Gas Liquids Production Has Surged Since
2012

Source: Energy Information Administration, "West Virginia Natural Gas Plant Liquids Production,"
Dec 31, 2018.

Not surprisingly, this dramatic increase in production resulted in a crash in
domestic natural gas prices.3 Even the rush by the electric power sector to take
advantage of cheap gas did not significantly drive up natural gas prices. The
following figure shows natural gas prices at the Henry Hub (the national benchmark
for U.S. gas prices) and at the Dominion South Hub, located in southeastern
Pennsylvania, in constant (2017) dollars. Starting around 2014, prices at the
Dominion South Hub decoupled from the Henry Hub because of the glut of natural
gas produced from the Marcellus.

3Similarly, the increase of NGL production has also driven a decline in prices for ethane, propane,
butane and natural gasoline.
Falling Short: Shale Development in West Virginia
Fails to Deliver on Economic Promises                                                         8

Figure 6: Natural Gas Prices at the Dominion South Hub Decoupled from
Henry Hub Prices Starting Around 2013

Source: S&P Global Market Intelligence day-ahead prices.

As a result of this crash in natural gas prices, the
total value of natural gas produced in West
Virginia has not mirrored the exponential growth
in production. The following graphs show an
estimate of the total value of natural gas, adjusted
                                                              From 2008 to 2017,
for inflation, produced in West Virginia and in the              West Virginia
top producing counties (assuming that all gas is            produced $21 billion in
sold at Dominion South Hub prices). In the past
decade, from 2008 to 2017, West Virginia
                                                            natural gas, almost all
produced $21 billion in natural gas, almost all of          of which was exported
which was exported from the state.4 Doddridge                   from the state.
County, the state’s top-producing county, alone
produced $3.6 billion of natural gas from 2007 to
2017, virtually all of which was exported from the
county.

4In-state natural gas consumption data from: Energy Information Administration, Natural Gas
Consumption by End Use, Dec 31, 2018; Dominion Energy West Virginia, 2017 Purchased Gas
Application, WV PSC Case No. 17-1053-G-30C; Mountaineer Gas Company, 2017 Tariff Rule 30C
Application, WV PSC Case No. 17-1065-G-30C.
Falling Short: Shale Development in West Virginia Fails to Deliver on Economic Promises 9 Figure 7: The Value of West Virginia Dry Gas Production, Estimated Based on Dominion South Hub Natural Gas Prices, Has Been Highly Volatile Source: Production numbers from EIA, "West Virginia Dry Gas Production," Dec 31, 2018; Dominion South Hub prices from S&P Global Market Intelligence day-ahead prices. Figure 8: The Value of Natural Gas Produced by the Top Six Counties Has Mirrored Overall Volatility Source: Production data from WV Geological and Economic Survey, Dominion South Hub pricing data from S&P Global Market Intelligence.
Falling Short: Shale Development in West Virginia
Fails to Deliver on Economic Promises                                                           10

In addition, we estimate that West Virginia has produced nearly $1.5 billion in
natural gas liquids over the past decade.5

Over the past decade, natural gas production
has become concentrated in the hands of fewer
and fewer producers, as part of a national trend
of consolidation in the sector driven by weak
financial performance. In late 2014, global oil
and natural gas liquids prices collapsed.
Starting in 2015, that collapse, coupled with
already low natural gas prices, drove 167 North             In 2017, just the top
American oil and gas producers to file for
                                                           three producers— all
bankruptcy.6 Table 1 shows a snapshot of
natural gas production by the top ten largest             headquartered out-of-
companies in the state in 2004, 2012 and 2017.             state— accounted for
The top ten companies’ share of production has               66% of the state’s
grown from 68% to 85% over that time period.
In 2017, just the top three producers— all                natural gas production.
headquartered out-of-state— accounted for
66% of the state’s natural gas production. Table
1 also indicates the rapid changes in the sector,
as many of the early natural gas producers have
gone bankrupt, been absorbed into larger
companies, or sold their Marcellus acreage to
concentrate on other U.S. shale plays.

5 Estimated based on severance tax revenues, assuming that “other” severance tax revenues are
derived primarily from natural gas liquids. (Source: WV State Tax Department, “Severance Tax
History and Data: FY 2008 through FY 2018.”).
6 Haynes and Boone, LLP, “Oil Patch Bankruptcy Monitor,” January 7, 2019.
Falling Short: Shale Development in West Virginia
Fails to Deliver on Economic Promises 11
Table 1: Production Has Been Increasingly Concentrated Among Top
Producers
2004 2012 2017
Company Production Company Production Company Production
(bcf) (bcf) (bcf)
Companies in bold were/are headquartered in West Virginia.
Equitable Production 33.4 Antero 105.7 Antero 543.6
Company
Columbia Natural 25.6 Chesapeake 73.6 EQT 292.9
Resources LLC
Cabot Oil & Gas 22.1 EQT 42.2 Southwestern 149.9
Production
Dominion Exploration 18.3 XTO 13 HG Energy 82.9
& Production
Eastern American 10.1 Stone Energy 8.9 Northeast 39.5
Energy Natural Energy
Penn Virginia Oil & 6.3 Grandier Energy 8.1 Jay-Bee Oil & 38.8
Gas Partners Gas
North Coast Energy 5.8 PDC 6.9 Arsenal 33.8
Eastern Mountaineer Resources
CDX Gas LLC 5.1 CNX Gas / Consol 6.5 Ascent Resources 31.5
Gas
Key Oil Company 3.7 Trans Energy 5.9 CNX Gas 28.2
Exploration Partners 3.4 Triad Energy 5.8 XTO Energy 21.4
LLC
Total WV gas 197.2 345 1486
production
% from top 10 68% 80% 85%
Source: G. Hammond, “Consensus Oil & Gas Forecast for West Virginia 2006,” West Virginia
University, November 2006; J. Pierson Moore, “2012 Marcellus Shale Production Summary,” West
Virginia Department of Commerce Geological & Economic Survey, July 29, 2013; P. Dinterman,
“2017 Marcellus Shale and Utica-Point Pleasant Production Summary,” West Virginia Department
of Commerce Geological & Economic Survey, August 24,2018
The Promised State-Level Economic Impact of Shale
Development in West Virginia Has Largely Failed to
Materialize
The rapid growth in Marcellus shale production described in the previous section
has contributed less to the state’s economy than industry boosters projected a
decade ago. In this section, we review some of the claims and projections made in
the early days of Marcellus shale drilling in West Virginia and compare those
projections to what actually occurred.Falling Short: Shale Development in West Virginia
Fails to Deliver on Economic Promises 12
The following table summarizes the predictions of three studies from West Virginia
University (WVU), the National Energy Technology Laboratory (NETL), and IHS
Global Insight (IHS).7 The NETL study in particular emphasized throughout that its
analysis represented a “conservative” estimate of the economic benefits of shale
development to the state.8
Table 2: Early Studies Predicted Significant Growth in Production, Tax
Revenue and Jobs
2009 2012 2015 2020
WVU NETL IHS WVU NETL IHS NETL IHS
Shale production Approx Approx
(bcf) 2,900 5,000
Severance taxes $68 $52 $141 $142 $235 $239
(nominal $)
Direct jobs (a) 3,600 3,169 3,615 3,130- 7,310 10,172
9,300
(a) Note that the 2009 and 2012 numbers are lower than the employment numbers presented in
previous sections because our analysis looked at employment across the entire natural gas sector
in West Virginia, whereas these studies attempted to isolate the job impact specifically from shale
drilling.
Production Numbers Have Been Lower Than Forecast
The NETL study, the only one which provided a forecast of production, was wildly
optimistic in its forecast. Despite the rapid growth in shale production over the past
decade, actual 2015 production was less than half projected by the NETL study.
Severance Tax Revenues Increased Rapidly but Levelled
Off, Underperforming Expectations
The following chart shows West Virginia severance tax collections from coal, natural
gas and “other” minerals (predominantly natural gas liquids). Over the past decade,
the severance tax has contributed between 8 and 14% of state revenues.9 While
natural gas severance tax revenues steadily increased from FY 2010 through FY
2014, tax revenues subsequently declined and have never regained their 2014 peak.
7 A. Higginbotham, A. Pellilo, T. Gurley-Calvez and T. Witt, “The Economic Impact of the Natural
Gas Industry and the Marcellus Shale Development in West Virginia in 2009”, West Virginia
University Bureau of Business and Economic Research, December 2010; A. Zammerilli,
“Projecting the Economic Impact of Marcellus Shale Gas Development in West Virginia: A
Preliminary Analysis Using Publicly Available Data,” National Energy Technology Laboratory,
March 2010; and “America’s New Energy Future: The unconventional oil and gas revolution and
the U.S. economy, Volume 2: State Economic Contributions,” IHS Global Insight, December 2012.
8 See NETL study at p. 29-30.
9 Charleston Gazette-Mail, State Budget Browser, March 2017.Falling Short: Shale Development in West Virginia Fails to Deliver on Economic Promises 13 In FY 2018, natural gas severance tax revenues were only 15% higher than FY 2008 natural gas severance tax revenues (in constant 2018 dollars). Figure 9: West Virginia Severance Tax Collections Fell Sharply After FY2015, Reflecting a Fall in Coal and Natural Gas Severance Tax Revenues Source: WV State Tax Department, “Severance Tax History and Data: FY 2008 through FY 2018.” Figure 10 compares actual natural gas severance tax collections (translated from fiscal year to calendar year) to the projection of the NETL study.
Falling Short: Shale Development in West Virginia
Fails to Deliver on Economic Promises                                                              14

Figure 10: Predicted Growth in Natural Gas Severance Tax Revenue from
2015-2020 Is Not Materializing

Source: WV State Tax Department, “Severance Tax History and Data: FY 2008 through FY 2018”;
and NETL, 2010.

The initial studies by NETL and IHS fared better at predicting 2015 severance tax
revenues, which were $159 million that year. But the continued growth in severance
tax revenues projected by the studies has failed to materialize, as shown in Figure
10 above. Part of the reason for the fall in the severance tax was the elimination of
the 4.7 cents/mcf flat tax on natural gas production in FY 2016; this portion of the
severance tax had generated $58 million in FY 2015.10 Severance tax revenues have
also been impaired by the persistently low price of natural gas, which had
apparently not been contemplated by either study.11

Early Studies Did Not Consider Financial Liabilities to the
State
While initial studies forecasting the benefits of shale gas development highlighted
the predictions of greater tax revenues, they failed to consider the possibility that
shale development would leave the state with greater unfunded liabilities.

However, Marcellus shale drilling is adding to the state’s already large abandoned
well liability. West Virginia state code defines a well as “abandoned” if it is out of
production for more than twelve months and has not been proven to have a bona
fide future use.12 We refer to such abandoned wells as “orphaned” if there is no
known operator for the well, meaning that the liability for plugging the well reverts
to the state. Currently the West Virginia Department of Environmental Protection’s

10 WV State Tax Department, “Severance Taxes: Tax Data, Fiscal Years 2015-2018.”
11 Specifically, the NETL study forecast the value of natural gas extracted would approach $22
billion by 2015, implying a wellhead price of approximately $7-$8 per mcf. (See Exhibit 23 on p.
40).
12 West Virginia Code §22-6-19
Falling Short: Shale Development in West Virginia
Fails to Deliver on Economic Promises                                                            15

well database lists 4,560 orphaned wells.13 In its entire history, the DEP has plugged
only 349 orphaned wells.14 According to recent annual reports, DEP plugged six
wells in fiscal year 2017 and three in fiscal year 2018.15

According to the DEP, the average cost of plugging a well is $25,000.16 However
orphaned wells are often more difficult to plug because of their age and condition,
and the DEP’s average cost is between $45,000 and $65,000 per well.17 An industry
estimate puts the cost of well plugging at $45,000 per well.18 At that cost, the state
has an outstanding liability of $205 million in unplugged wells. As of June 2018, the
DEP’s “Oil and Gas Reclamation Trust Fund” (the fund specifically dedicated to
reclaiming and plugging abandoned wells19) has a balance of $374,986, or 0.2% of
the outstanding liability.20

The DEP funds its well plugging work through bond forfeitures and permit fees.21
The revenue collected through permit fees has declined in recent years. The overall
expenditures out of the fund have also declined. Expenditures averaged $331,000
per year for FY 2004 through FY 2010 and only $105,000 per year for FY 2011
through 2018. In short, the boom in Marcellus shale drilling has not benefited the
abandoned well reclamation fund.

13 Search of West Virginia Department of Environmental Protection Office of Oil & Gas well
database on 7/22/18 for “abandoned well” “operator unknown”
14 Ibid., search for “plugged well”, “unknown – DEP paid plugging contract”
15 WV Department of Environmental Protection, Annual Reports for Fiscal Year 2016-17 and

Fiscal Year 2017-18.
16 West Virginia Legislative Auditor, “Agency Review: Office of Oil and Gas, Department of

Environmental Protection,” PE 12-10-523, September 2012, p. 8
17 Personal communication, David McMahon, WV Surface Owners’ Rights Organization, January

29, 2019.
18 Diversified Gas & Oil, Admission Document: Acquisition, Placing and Readmission to Trading,

June 29, 2018 at p. 151.
19 West Virginia Code §Code 22-6-29(b)
20 WV Department of Environmental Protection, Annual Report for Fiscal Year 2017-18.
21 West Virginia Code §22-6-29(b)
Falling Short: Shale Development in West Virginia
Fails to Deliver on Economic Promises                                                                16

Figure 11: Revenues and Expenditures from the WV Department of
Environmental Protection’s Oil and Gas Reclamation Trust Fund Have
Fallen in the Past Decade

Source: Data for FY 2011 through FY 2018 from WV Department of Environmental Protection
annual reports. Prior years' data tabulated by WV Surface Owners Rights' Organization from DEP
reports.

The vast majority (80%) of the orphaned wells were permitted more than 50 years
ago. It is impossible to estimate how many of the 4,700 Marcellus shale wells
permitted between January 2010 and January 2019 will ultimately become the
financial responsibility of the state to plug.22

At the same time, many Marcellus drilling companies, including EQT23, are selling
their declining conventional wells to a company called Diversified Gas & Oil.
Diversified currently has 17,000 wells in West Virginia (including some non-
producing wells), or about 15% of the total wells drilled in the state. Yet a recent
consent decree with the West Virginia Department of Environmental Protection
requires Diversified to plug only 300 wells from 2020 to 2034.24 With Diversified
estimating that its producing wells will reach the end of their economic lives in

22 West Virginia Department of Environmental Protection Office of Oil & Gas well database search
for target formation “Marcellus Shale” on 1/20/19.
23 EQT sold 12,000 wells to Diversified in 2018, of which 4,386 are in West Virginia. (Diversified

Gas & Oil, Admission Document: Acquisition, Placing and Readmission to Trading, June 29, 2018
at p. 150)
24 The decree requires at least 50 non-producing wells per year to be placed into production or

plugged, at least 20 of which must be plugged. (WV Department of Environmental Protection,
Consent Order issued under WV Code Chapter 22, Article 6, November 19, 2018).
Falling Short: Shale Development in West Virginia
Fails to Deliver on Economic Promises                                                               17

204725, it is likely that thousands of these wells will be abandoned and ultimately
become liabilities of the state.

In short, due to shale companies both developing new Marcellus wells and shedding
existing conventional well liabilities, West Virginia will likely face hundreds of
millions, perhaps billions, of dollars in unplugged well liabilities in the coming
decades, on top of the existing unfunded orphaned well liability. This liability was
not captured in early projections of economic benefits to the state.

Employment Growth Has Underperformed Expectations
Between 2001 and 2008, before shale drilling took off in West Virginia, employment
in the industry increased from 5,623 to 9,172. The growth in natural gas jobs
appeared to be only temporarily slowed by the 2007 recession. After growing
steadily pre-recession, jobs growth stopped from 2007 to 2010, as the state and
nation weathered the depths of the recession. Job growth accelerated starting in
2010, booming along with production, reaching 14,013 jobs in 2014. Employment
fell from 2014 to 2016 and grew slightly in 2017.

Figure 12: Total Natural Gas Industry Employment in WV

Source: Workforce WV.26

25 Diversified Gas & Oil, Admission Document: Acquisition, Placing and Readmission to Trading,
June 29, 2018 at p. 76.
26 Includes jobs in the following North American Industry Classification System (NAICS codes):

211 (Oil and gas extraction), 213111 (Drilling oil and gas wells), 213112 (Support activities for
oil and gas operations), 221210 (Natural gas distribution), 237120 (Oil and gas pipeline and
related structures construction), 333132 (Oil and gas field machinery and equipment
manufacturing) and 486210 (Pipeline transportation of natural gas). These NAICS categories
capture all aspects of the natural gas extraction, processing and transportation system.
Falling Short: Shale Development in West Virginia
Fails to Deliver on Economic Promises                                                     18

In 2017, nearly one in three natural gas jobs were in pipeline construction, with
nearly a quarter in support activities. Less than 10 percent of jobs were in the actual
drilling of gas wells, while there were only a handful of jobs in manufacturing oil and
gas machinery and equipment (Figure 13). It is also worth noting that in 2015 (the
only year for which data is available), 25% of jobs in natural gas drilling, pipeline
construction and related support activities were held by out-of-state workers.27
Pipeline construction is the sector with the largest concentration of out-of-state
workers (40.6% in 2015) and it is the only natural gas-related sector that has
boasted significant employment gains since 2015; therefore, the percentage of out-
of-state workers in the natural gas industry today could well be more than 25%.

Figure 13: One in three Natural Gas Jobs Were in Pipeline Construction in
2017

Source: WVCBP analysis of Workforce WV data.

Even at its peak, employment in the natural gas industry was a relatively small share
of total employment in the state, never topping more than 2 percent of total jobs in
the state.

27   Workforce WV, West Virginia Oil and Gas Study: Residency Status.
Falling Short: Shale Development in West Virginia
Fails to Deliver on Economic Promises                                                          19

Figure 14: Natural Gas Industry Comprises Less Than 2% of WV Jobs

Source: WVCBP analysis of Workforce WV data.

In terms of employment, the WVU study projected
a range of up to 5,700 new shale jobs by 2015, and
the IHS study projected approximately 3,700 new
jobs between 2012 and 2015. These studies
implied that these jobs would be additional jobs,
on top of already existing natural gas jobs in the
state. However, what actually occurred was a 25%
increase in natural gas industry employment from
2008 to 2017, or 2,600 net new jobs. This is                   Jobs in drilling and
smaller than the increase in Marcellus shale jobs
predicted by initial studies. Part of the reason for
                                                                 related support
this discrepancy is that the growth in shale                      activities have
production has cannibalized the pre-existing                    actually declined.
conventional natural gas industry, reducing
production and employment from conventional
drilling.28 Indeed, the only reason that there has
been any growth in employment at all from 2008
to 2017 is the increase in employment due to
natural gas pipeline construction, which are
largely temporary jobs; jobs in drilling and related
support activities have actually declined.

The poor performance of shale drilling as a driver of new employment opportunities
is connected to the low-price environment created by the expansion of shale

28Natural gas production from conventional wells in West Virginia declined 40% from 2008 to
2016. (C. Burd, “Current state of the natural gas industry from the West Virginia producer’s
perspective,” presentation at Governor’s Energy Summit, October 18, 2017).
Falling Short: Shale Development in West Virginia Fails to Deliver on Economic Promises 20 drilling, a consequence that was not anticipated in initial studies. Low prices have forced the industry to become more technologically innovative, in order to lower the cost structure of the industry. This means that the number of jobs in shale drilling per unit of natural gas extracted has declined dramatically. The number of exploration and production jobs per billion feet of natural gas extracted in West Virginia plummeted from 29 jobs per bcf in 2008 to 9 jobs per bcf in 2014 to 4 jobs per bcf in 2017.29 Figure 15: West Virginia Natural Gas Exploration and Production Has Become Significantly Less Labor-Intensive Source: Employment data from Workforce WV, dry gas production data from Energy Information Administration. Impact of Shale on WV Coal Industry Not Considered Early industry reports also failed to consider shale development’s negative impact on the coal industry. Nationally, the glut of natural gas and the low price environment drove wholesale power market prices to sustained low levels that made it difficult for coal-fired electricity generation to compete. Since 2010, the share of U.S. electricity generation produced by coal has fallen from 45% in 2010 to 30% in 201730, which translates into 330 million tons of coal per year no longer burned for power generation.31 The driving factor in this transformation of the 29 Jobs in NAICS sectors 211 (“oil and gas extraction”), 213111 (“drilling oil and gas wells”) and 213112 (“support activities for oil and gas operations”) were divided by West Virginia total dry gas production. 30 Energy Information Administration, Electricity Data Browser, last accessed January 2019. 31 Energy Information Administration, Coal Data Browser, last accessed January 2019.
Falling Short: Shale Development in West Virginia
Fails to Deliver on Economic Promises                                                                 21

power sector, far more than environmental regulations, has been low wholesale
electricity market prices, driven by natural gas.32

In West Virginia, the production of steam coal for power generation has fallen 32%
since 2010, with extremely negative consequences for West Virginia’s top coal-
producing counties.33 Because of the declining market for coal, coal severance tax
collections have fallen even more sharply, generating half as much revenue in 2017
as in 2010, as shown in Figure 9 above. In Boone County, formerly the state’s largest
coal-producing county, employment fell 58 percent from 2011-2015.34 It would be
incorrect to blame all of West Virginia’s coal decline on natural gas. Competition
with cheaper coal from other U.S. basins has also reduced the market for West
Virginia coal. But the pressure from cheap shale gas has certainly contributed
substantially to the collapse of the West Virginia coal industry.

In short, the economic impact of the shale industry in West Virginia— in terms of
employment and tax revenues— has underperformed expectations, while early
studies also failed to consider negative impacts of shale development on the state’s
economy and finances.

The Economic Development from Shale Drilling Has
Largely Followed a Boom-and-Bust Pattern in the
Largest Shale-Producing Counties
The economic development impact of shale development in the top six natural gas-
producing counties has been mixed, with some indicators showing improvement
and others weakening. Yet the overall impact has been relatively small in terms of
its contribution to lifting these counties out of poverty. In addition, many of these
economic indicators show a boom-and-bust pattern, as opposed to sustained
economic development

Population
Shale development has generally not had a positive impact on population growth in
the counties where it is occurring. Only one of West Virginia’s top producing gas
counties, Doddridge, has gained population over the past decade, despite the
massive influx in natural gas drilling activity, as shown in Figure 16.

32 The financial problems for coal-fired power plants have been compounded by flat demand for
electricity, meaning that new generation is displacing older plants. (See, for example, P. Maloney,
“New gas build, coal retirements could make PJM next market with distressed power prices,”
Utility Dive, April 7, 2017.)
33 Energy Information Administration, Quarter Coal Reports for Oct-Dec 2010 and Oct-Dec 2017.
34 D. Mistich, “Central Appalachia, Southern West Virginia ‘ground zero’ for recent coal mine

layoffs,” WV Public Broadcasting, June 17, 2015.
Falling Short: Shale Development in West Virginia
Fails to Deliver on Economic Promises                                                22

Figure 16: Change in Population of the Top Six Shale-Producing Counties,
2007-2017

Source: Bureau of Economic Analysis.

Median Household Income
Median household income measures the income of the typical household— or the
household in the middle of the income distribution— and serves as a good indicator
for how the middle class is faring. Shale development is correlated with
improvements in county-level median household income.

The top gas producing counties have all experienced strong median household
income growth during the natural gas boom. All but Marshall County have exceeded
the state average median household income growth since 2010, with Doddridge and
Harrison nearly doubling the state’s growth rate (Table 3).

Table 3: Median Household Income Before and After the Natural Gas
Boom (Nominal Dollars)
                          2010             2017           Percent Change
 United States                    $51,914                $57,652          11.1%
 West Virginia                    $38,241                $43,238          13.1%
 Doddridge County                 $34,444                $44,370          28.8%
 Harrison County                  $40,441                $51,711          27.9%
 Marshall County                  $37,206                $41,471          11.5%
 Ritchie County                   $35,170                $40,636          15.5%
 Tyler County                     $36,122                $43,951          21.7%
 Wetzel County                    $36,390                $41,882          15.1%
Source: U.S. Census Bureau Small Area Income and Poverty Estimates.
Falling Short: Shale Development in West Virginia
Fails to Deliver on Economic Promises 23
Educational Attainment
Another positive for the gas producing counties is that educational attainment,
while in general lower than the state average, has been increasing during the
natural gas boom. All but Ritchie County have seen an increase in the share of the
population 25 and older with at least a bachelor’s degree, while Wetzel County
experienced a decrease (Table 4). Increasing the levels of education in the
workforce is one of the key factors in improving the state’s economy.35
Table 4: Share of Population 25 and Older with at Least a Bachelor’s
Degree
2009 2017 Change
United States 27.5% 30.9% +3.4%
West Virginia 17.1% 19.9% +2.8%
Doddridge County 8.3% 14.9% +6.6%
Harrison County 18.4% 22.6% +4.2%
Marshall County 12.2% 17.1% +4.9%
Ritchie County 9.0% 9.3% +0.3%
Tyler County 10.2% 13.5% +3.3%
Wetzel County 13.4% 11.8% -1.6%
Source: 2009 and 2017 5-year American Community Survey.
Poverty
However, despite gains in median household income and educational attainment,
the boom in natural gas production and related activity does not appear to have had
a significant impact on poverty rates in the top natural gas producing counties or
the state as a whole. Since natural gas production began increasing sharply in 2010,
the state’s poverty rate has remained essentially unchanged at 18.5%, even as
poverty rates declined nationwide. Among the 6 top gas producing counties, 4 saw
minor reductions in their poverty rates, while two saw increases of more than 2
percentage points.
Table 5: Poverty Rates Before and After the Natural Gas Boom
2010 2017 Change
United States 15.3% 13.4% -1.9%
West Virginia 18.2% 18.5% +0.3%
Doddridge County 20.6% 20.1% -0.5%
Harrison County 17.3% 16.8% -0.5%
Marshall County 17.0% 19.1% +2.1%
Ritchie County 19.9% 18.5% -1.4%
Tyler County 16.2% 16.0% -0.2%
Wetzel County 18.3% 20.6% +2.3%
Source: U.S. Census Bureau Small Area Income and Poverty Estimates.
35 See State of Working West Virginia, WVCBP, 2015 and 2016.Falling Short: Shale Development in West Virginia
Fails to Deliver on Economic Promises 24
Similarly, another economic indicator, the Appalachian Regional Commission’s
(ARC) County Economic Status, shows a lack of economic progress for the state’s top
gas producing counties. The ARC County Economic Status is an index based on
county averages for three economic indicators, three-year average unemployment
rate, per capita market income and poverty rate, compared with national averages.
Counties are designated as distressed, at-risk, transitional, competitive or
attainment, based on their ranking in the index. None of West Virginia’s top natural
gas producing counties have seen an improvement in the ARC County Economic
Status during the natural gas boom. (Table 6).
Table 6: Appalachian Regional Commission County Economic Status
FY 2010 FY 2019
Doddridge County At-Risk At-Risk
Harrison County Transitional Transitional
Marshall County Transitional Transitional
Ritchie County At-Risk At-Risk
Tyler County At-Risk At-Risk
Wetzel County At-Risk At-Risk
Source: Appalachian Regional Commission.
County Economic Indicators Follow a Boom and Bust
Pattern
Using several economic indicators - total earnings, total personal income,
employment, and population - a clear boom and bust pattern can be found in the top
six gas producing counties. And the pattern closely follows the price of natural gas,
which, as mentioned in the previous section, fell sharply when production first
began booming, falling from Henry Hub prices of $4.59/MMBTU in 2010 to $2.78 in
2012. Prices recovered between 2012 and 2014, fuelling the biggest acceleration in
West Virginia’s production, but as prices fell again in 2014, the pace of production in
West Virginia began to slow. After bottoming out in 2016, prices began to recover in
2017. These changes in prices and production have resulted in three distinct phases
of the industry’s economic impact in the top producing counties.
Figure 17 shows the difference in the average annual growth rates of West Virginia
and the top six gas producing counties for each economic indicator. Bars above the
line mean that the gas counties had higher growth rates than the state on that
measure. Bars below the line mean that the gas counties had lower growth rates
than the state.Falling Short: Shale Development in West Virginia
Fails to Deliver on Economic Promises 25
Figure 17: Difference in Average Annual Growth Rates Between Top
Natural Gas Producing Counties and West Virginia
Source: WVCBP analysis of Bureau of Economic Analysis data.
In the years leading up to the natural gas boom, West Virginia’s natural gas
producing counties experienced relatively slower growth than the state as a whole,
trailing in earnings, income, and population growth, while experiencing slightly
higher employment growth. During the initial boom in natural gas production,
starting in 2010, the gas counties saw much faster rates of growth in earnings,
income, and employment, while in fact losing population. But when natural gas
prices began to fall in 2014, the economic boom busted, and the counties began to
experience slower earnings and income growth, with no better employment and
population growth than the state average.
The accelerated boom and bust cycle means that
for several of the state’s top natural gas producing
counties, many of their economic gains have been
wiped out by falling natural gas prices, even as
they continue to produce natural gas. For example,
adjusted for inflation, Wetzel County produced
more than $2 billion in natural gas from 2010 to Wetzel County
2016, including $308 million in 2016. But Wetzel experienced no net
county experienced no net job increase from 2011 job increase from
to 2016 and has lost 338 jobs (-5.3%) since its
peak in 2012. The same can be said for Marshall
2011 to 2016.
County, which from 2010 to 2016 produced more
than $1.3 billion in natural gas, including $211
million in 2016. In 2016 Marshall County had
fewer jobs (13,006) than it did in 2009 (13,736)Falling Short: Shale Development in West Virginia Fails to Deliver on Economic Promises 26 and has lost more than 1,500 jobs (-10.4%) since its peak in 2013. During the crash of natural gas prices starting in 2014, West Virginia’s top natural gas producing counties lost 1,571 jobs despite producing $5.7 billion worth of natural gas from 2014 to 201636 (Figure 18). Figure 18: Change in Nonfarm Employment 2014-2016 Source: Workforce WV. In 2017, as natural gas prices stopped their free fall, the state’s top gas producing counties began to recover their lost gains. In 2017, the top gas producing counties saw gains exceeding the state average in earnings, personal income, and employment, although they continued to lose population (Figure 19). 36 Natural gas value based on pricing at Dominion South Hub.
Falling Short: Shale Development in West Virginia
Fails to Deliver on Economic Promises                                                   27

Figure 19: Annual Growth Rates of Key Economic Indicators, 2016-2017

Source: WVCBP analysis of Bureau of Economic Analysis data.

In short, while the natural gas producing counties have seen some economic
benefits from the shale boom, these benefits have been small relative to the billions
of dollars of shale gas extracted from these counties. The boom-and-bust nature of
the economic gains, combined with the persistent declining population of these
counties, indicates that shale development is not yet translating into long-term
economic gains for these counties.
Falling Short: Shale Development in West Virginia
Fails to Deliver on Economic Promises 28
Wetzel County Case Study
Wetzel County has consistently been one of West Virginia’s largest shale gas
producing counties. i In 2017, this rural county in northern West Virginia accounted
for 12.8% of all gas produced in the state. Yet Wetzel County’s economy has
performed worse than the rest of the state in key macroeconomic indicators during
the last decade of the shale boom.
From 2010 to 2016, Wetzel County lost 3.5% of its population, a nine times greater
rate of population loss than the state as a whole. Enrollment in K-12 schools has
fallen by 11%, a rate six times great than the state as a whole. Median household
income has increased by 7.7%, less than the overall increase across West Virginia of
11.1%. In 2010, Wetzel County had approximately the same percentage of
households below the federal poverty line as the state as a whole (17.4 compared to
17.5%). By 2016, West Virginia’s poverty rate was essentially flat at 17.7%, while
Wetzel County’s poverty level had grown to 21.1%.ii
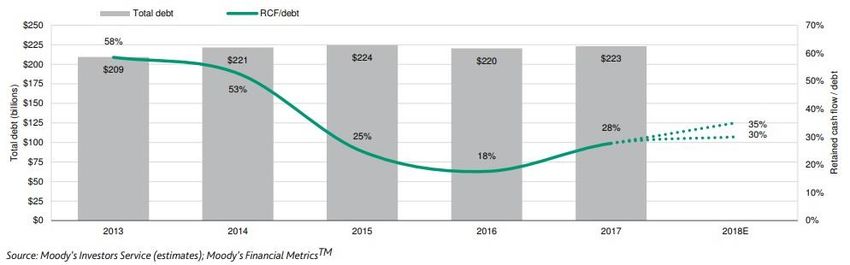
However, Wetzel County has outperformed the state as a whole in terms of total
employment. Employment has increased 8%, compared to a 1% decrease across the
state from 2009 to 2017; however, the county experienced all of this job growth
from 2009 to 2012 and jobs have remained approximately constant since 2012.
About half of the new jobs in Wetzel County have been in the mining and natural
resources sector (a classification that includes natural gas drilling). Nevertheless,
the unemployment rate in Wetzel County has actually increased, from 6.9% in 2010
to 8.5% in 2016.iii
Figure 20: Employment in Wetzel County and Comparison of
Unemployment Rate to State as a Whole
Source: Workforce WV.
Interviews with Wetzel County officialsiv provide some indication as to why this
increase in employment has not translated into a decrease in unemployment or
poverty or into increases in population or school enrollment. According to theseFalling Short: Shale Development in West Virginia
Fails to Deliver on Economic Promises 29
officials, the labor force for the gas industry still resides primarily in hotels, motels,
and campsites. v In other words, natural gas industry workers are from out of the
county and are generally not putting down roots and starting families in Wetzel
County.
Interviews with county officials also revealed significant quality of life concerns that
the natural gas industry has caused for county residents, primarily related to heavy
truck traffic. vi Although a voluntary safety agreement has been established by the
County Commission, the Wetzel County School Board and industry
representatives— an agreement which includes standard practices for escort cars,
road curfews to allow safe passage of school buses, and limits on truck size and
weight— there is no penalty for drillers who do not comply with the commitments.
Existing federal guidelines for best practices of escort cars are not well-tailored for
rural West Virginia conditions, which include narrow roads, blind turns, steep
grades, convoy lanes, difficulty in communicating the number of vehicles in a
convoy, multiple companies and contractors, degraded infrastructure, yard and road
staging, and poor notification of road closures. Residents also had a number of
complaints of unsafe driving by pipeline construction vehicles. Because these
companies are only in the area for a short time, residents feel they have even less of
an incentive to protect community members and listen to their concerns.
One positive development for the county from natural gas production has been the
increase in the county’s education budget resulting from natural gas property tax
collections. vii This has allowed the county to hire new teachers and nurses, invest in
new electronic equipment for classrooms, give teachers’ salaries above the state
base formula, and avoid consolidating the county’s four high schools.
However, on balance, the example of Wetzel County shows that the actual impact of
shale gas development has not had the local economic development impact
anticipated by early boosters of the shale industry. Instead, employment has
primarily gone to workers brought in from outside the county, who have not chosen
to remain in the county for the long-term. The second-largest natural gas producing
county in the state has fared worse than the state as a whole; poverty has increased
and population and school enrollment have fallen faster than the state average.
i. From 2012 to 2017, Wetzel has been either the 2nd or 3rd largest dry gas producing county
each year. (See WV Geological & Economic Survey Marcellus Shale and Utica-Point Pleasant
summary reports.)
ii. U.S. Census Bureau, American Community Survey 5-Year Estimates.
iii. Workforce WV.
iv. Interviews conducted by Rachel Rubin (WV Center on Budget and Policy) in summer 2018
with: Wetzel County Commission (Larry Lemon, Bob Gorby, Lisa Heasley), Wetzel County
School Board (Superintendent Ed Toman, Personnel Director Shane Highley and Treasurer
Jeffrey Lancaster), Ray Renaud of the Wetzel County Oil and Gas Task Force, and local business
owner Steve Conlon.
v. See also: L. Matthews, “Hotel to Open April 7,” Wetzel Chronicle, January 21, 2015; L.
Matthews, “Commission shows support for local workers,” Wetzel Chronicle, April 29, 2015; J.
Snoderly, “Campsites for oil and gas workers benefit economy, but not without issues,” The
Exponent Telegram, October 28, 2018.
vi. See also: C. Lawrence, “Wetzel County group hopes changes will be adopted for safe roads,”
WV Metro News, April 21, 2018.
vii. See also: “Wetzel Gas Tax Brings in $1.67M”, Wetzel Chronicle, May 13, 2015.Falling Short: Shale Development in West Virginia
Fails to Deliver on Economic Promises 30
Shale Industry in West Virginia Faces Uncertain
Outlook
The future outlook for the shale industry in West Virginia is uncertain, in large part
due to the shaky financial position of the industry itself.
Despite the rapid growth of oil and gas production, the paradox of shale is that it has
never made money.37 From a financial perspective, the last decade of the shale boom
has been a bust.
The underlying challenge to the industry’s
financial health is that shale drilling is
much more capital intensive than
conventional natural gas drilling. Shale gas
wells deplete quickly: in the Marcellus
shale, for example, production from a shale
From a financial perspective,
well often declines by 60-80% in the first the last decade of the shale
year.38 As a result, shale-focused boom has been a bust.
companies must spend heavily on new
wells simply to maintain production— and
must spend even more to keep output
climbing.
Shale-focused companies have never been able to finance these massive drilling
outlays solely from the sale of gas and oil. Instead, they have repeatedly sought new
infusions of cash from debt and equity markets to finance their drilling budgets and
keep their companies afloat. While one would expect a new industry to require
significant start-up capital, as the industry matures, investors expect that the
industry should become financially self-sustaining, generating enough cash to cover
new investments. The oil industry, for example, has always generated enough cash
from operations to fund its capital expenditures. And the U.S. coal industry for most
of its history funded itself out of cash from operations, until its recent period of
financial distress. By 2012-2013 many coal companies were turning more to equity
and debt markets to finance capital expenditures.
An analysis of financial records from 32 independent, publicly traded oil and gas
companies revealed that shale-focused companies spent $196 billion more on
capital expenditures from 2010 through mid-2018 than they realized by selling
hydrocarbons. Even with an uptick in prices through much of 2018, which the
37 B. Olson and L. Cook, “Wall Street tells drillers to stop counting barrels, start making profits,”
Wall Street Journal, December 13, 2017; R. Elliott and B. Olson, “Frackers burn cash to sustain U.S.
oil boom,” Wall Street Journal, August 12, 2018; C. Matthews and B. Olson, “Oil is above $70, but
frackers still struggle to make money,” Wall Street Journal, May 17, 2018; N. Salvaterra, “Rising
costs are cutting into shale company profits – Energy Journal,” Wall Street Journal, August 13,
2018.
38 “Natural gas production decline curve and royalty estimation,” Penn State Extension, October
30, 2014.Falling Short: Shale Development in West Virginia Fails to Deliver on Economic Promises 31 industry touted as the beginning of a turnaround39, these companies collectively spent $4.9 billion more on capital expenditures through the first three quarters of 2018 than they gained from selling their products. All told, 23 of the 33 companies spent more on drilling than they realized from oil and gas sales through the first three quarters of the year.40 Appalachian drillers are no exception to this trend. Figure 21 shows the free cash flow of major Appalachian drilling companies EQT, Antero, and Southwestern Energy. Aside from a brief moment of positive cash flow for Southwestern in 2014, these drillers have failed to become financially sustainable, and have relied on new infusions of money from investors to fuel their operations for the entire period of their operations in West Virginia. Figure 21: Free Cash Flow (Cash from Operations Less Capital Expenditures) for the Top Three Appalachian Natural Gas Producers Source: Form 10-Ks and 10-Qs filed with Securities and Exchange Commission. Data for Antero and Southwestern starts in 2013 because Antero completed its initial public offering and Southwestern acquired significant Marcellus acreage in that year. In addition to negative cash flows, the shale industry is showing other signals of financial stress. For example, in the U.S. oil and gas exploration and production industry as a whole, net debt increased 250% from 2005 to 2014, while EBITDA (earnings before interest, taxes, depreciation and amortization) increased only 39 B. Olson, “Frackers could make more money than ever in 2018, if they don’t blow it,” Wall Street Journal, January 22, 2018. 40 K. Hipple, T. Sanzillo, and C. Williams-Derry, “More Red Flags on Fracking,” Institute for Energy Economics and Financial Analysis, December 2018; C. Williams-Derry, K. Hipple and T. Sanzillo, “Energy Market Update: Red flags on fracking,” Institute for Energy Economics and Financial Analysis, October 2018.
Falling Short: Shale Development in West Virginia
Fails to Deliver on Economic Promises                                                                  32

68%.41 Since 2014, the relationship between debt and earnings has only gotten
worse. Currently the oil and gas E&P sector has much lower levels of cash flow
relative to debt than it did before oil prices collapsed in 2014.

Figure 22: Total Debt and Retained Cash Flow to Debt Ratio for 35 North
American Exploration and Production Companies

Source: Moody's Investor Service, Sector-in-depth: Exploration & Production, North America, June 11,
2018.

Part of the problem for shale drillers has been the
low natural gas price environment described in
the previous sections. Producers are caught in a
trap of production and prices. They must
continually drill in order to offset well declines
and attract new investors. Yet they are unable to
sell their gas at a favorable price because the
market is oversupplied with natural gas.
Remarkably, the U.S. natural gas market was                      Remarkably, the U.S.
oversupplied even before the shale boom took off.                 natural gas market
In its 2009 annual outlook on the independent oil
and gas exploration and production sector,                         was oversupplied
Moody’s wrote, “An unprecedented surplus of                      even before the shale
natural gas has haunted North America’s                             boom took off.
independent exploration and production (E&P)
sector in 2009, and shows little sign of retreating
in 2010… For the near term, we see little relief in
the ongoing oversupply conditions… Until we see
more evidence of a healthier supply/demand
balance for natural gas, our outlook for the E&P
Industry remains negative.” At the time of that
report, U.S. natural gas production was 20%

41A. Azar, “Reserve base lending and the outlook for shale oil and gas finance,” Columbia Center
on Global Energy Policy, May 2017, p. 9.
You can also read