Summary of Natural Catastrophe Events 2020 - Willis Re eVENTTM Update Insured losses and economic impact due to natural disasters Volume 9 ...
←
→
Page content transcription
If your browser does not render page correctly, please read the page content below

Summary of Natural
Catastrophe Events 2020
Willis Re eVENTTM Update
Insured losses and economic impact due to
natural disasters

Volume 9
Natural Catastrophes in 2020 i
Table of contents
Major natural catastrophes in 2020 per region based on insured losses ..................................................... iii
Contact us .....................................................................................................................................................iv
Introduction.................................................................................................................................................... 1
1.    In focus .................................................................................................................................................. 3
2.    Major natural catastrophes in 2020 ....................................................................................................... 8
3.    Other natural catastrophe events by peril and location ....................................................................... 51
Abbreviations ............................................................................................................................................ 65
Sources ...................................................................................................................................................... 65

Natural Catastrophes in 2020                                                    ii
Major natural catastrophes in 2020 per region based on insured losses

*The man-made explosion at Beirut port is included in the map due to its impact.

Natural Catastrophes in 2020                                                       iii
Contact us

 John E. Alarcon, Ph.D., M.Sc.                    Prasad Gunturi, M.Sc.
 Executive Director                               Executive Vice President
 Catastrophe Analytics, Willis Re International   Catastrophe Analytics, Willis Re North America

 Willis Re                                        Willis Re
 Willis Ltd I 51 Lime Street I London EC3M 7DQ    8400 Normandale Lake Blvd, Suite 1700 I
 D +44 (0) 20 3124 8678                           Bloomington, MN 55437
                                                  D +1 952 841 6641
 john.alarcon@willistowerswatson.com              prasad.gunturi@willistowerswatson.com

 Yingzhen Chuang                                  Vaughn Jensen
 Regional Director                                Executive Vice President
 Catastrophe Analytics, Willis Re International   Catastrophe Analytics, Willis Re North America

 Willis Re                                        Willis Re
 Willis Ltd I 51 Lime Street I London EC3M 7DQ    8400 Normandale Lake Blvd, Suite 1700 I
 D +44 (0) 20 7558 9340                           Bloomington, MN 55437
                                                  D +1 952 841 6641
 yingzheng.chuang@willistowerswatson.com          vaughn.jensen@willistowerswatson.com

With special thanks to the eVENT™ summary response team:

Roy Cloutier (NA, Minneapolis) | Natasha Denn (APAC, Ipswich) | Charlie Mariner (APAC, Ipswich) |
Alexander Paul (EMEA N/E, Ipswich) | Laura Lin (EMEA N/E, Ipswich) | Ricarda Linz (EMEA N/E,
Munich) | Marc Beeg (EMEA N/E, Munich) | Nigel Moreira (EMEA N/E, Mumbai) | Satish Sharma
(EMEA N/E, Mumbai) | Sarah Lochhead (EMEA W/S, London) | Sophie Barratt (EMEA W/S, London) |
Matt Day (EMEA W/S, London) | Bethany Young (LAC, London) | Nikil Pujari (NA, Mumbai)
willistowerswatson.com I willisre.com
January 2021

Natural Catastrophes in 2020                                          iv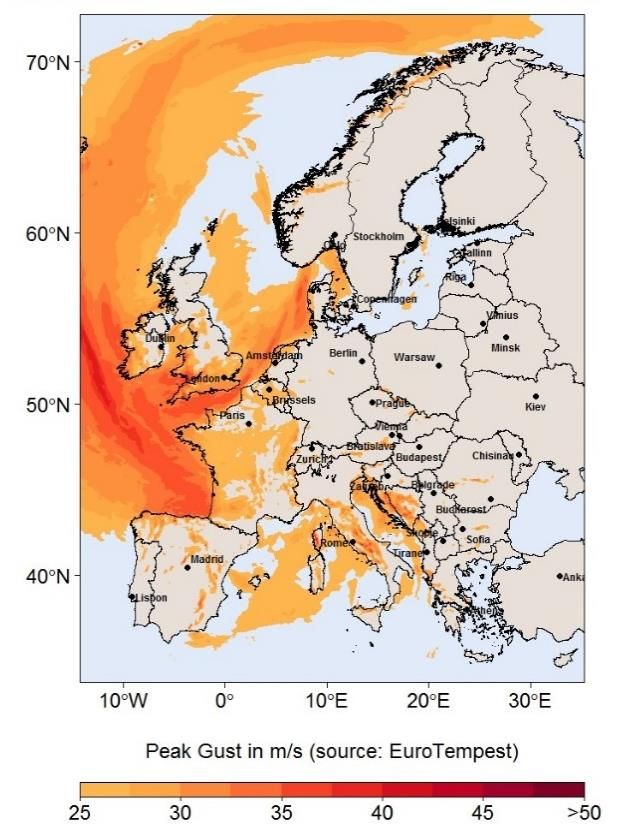
Introduction
This report summarizes economic and insured losses from the most relevant natural catastrophe
events that occurred during 2020. The loss values presented herein include those reported by
Willis Re, catastrophe model vendors, reinsurance companies and third-party organizations. Loss
estimates are presented in U.S. dollars (USD), for which rates of exchange at December 1, 2020,
have been used.

Our insured loss estimates from major natural catastrophes in 2020 of about USD 78 billion are the
fourth largest since the 2011 annual market losses of USD 120 billion and 17% larger than the average
annual losses over the past 10 years (see figure below). In spite of the 2020 insured losses being above
average, they are only close to half of the losses from the peak observed in 2017 of USD 143 billion. It is
important to highlight that these estimates do not include losses to the industry coming from neither
COVID-19 (see the In Focus section in this report) nor man-made insured losses, such as the riots in late
May in the U.S. or the explosion at the port of Beirut in early August. We estimate that overall man-made
disasters would add USD 5.5 billion to the insured losses.

In the U.S., in spite of the significantly above average hurricane activity in the North Atlantic, the number
of landfalling events did not follow this basin activity. The largest insured losses from a single event in the
U.S. came from Hurricane Laura in late August with approximately USD 8 billion to 9 billion in losses, and
from the severe weather in the Midwest in early August with around USD 5 billion to 6 billion in losses. In
Europe, the largest loss-causing event came in early February when Windstorm Sabine/Ciara affected
more than 10 countries producing close to USD 2 billion in insured losses. A point worth noting during
2020 for Europe is the clustering of windstorms that were observed (see the In Focus section). In Asia,
Tropical Cyclone Haishen (Kristine) passed by Japan and South Korea in early September causing less
than USD 1 billion in insured losses, which contrasts with the tropical cyclone losses observed in Japan
during 2019. In the Middle East, the largest insured loss event in 2020 was the man-made explosion at
Beirut’s port with estimated insured losses of USD 1.5 billion, while in Latin America and the Caribbean,
the largest event of 2020 was hurricane Iota in November with an estimated economic loss in the order of
USD 1.3 billion.

The aforementioned events, along with others having lower insured losses, are described in detail in the
second part of this report, listed in chronological order, while a summary of events is provided in the
tables at the end of the document, organized by peril/region affected in chronological order.

Insured losses from natural catastrophes since 2011 (Willis Re estimates)

Natural Catastrophes in 2020                                                1
Largest insured losses from single Natural Catastrophe events during 2020. Note the top eight are USA
related though it is key to note their losses are significantly lower than those from recent past years such
as Hurricanes Harvery, Irma or Maria in 2017 or the California Wildfires in 2018.

Natural Catastrophes in 2020                                               2
1. In focus
The 2020 Japan tropical cyclone season
The tropical cyclone (TC) season within the Western North Pacific (WNP) basin came to an end in 2020
just below the historical average in terms of TC frequency after a slow start to the year. In Japan no
TCs made landfall, in contrast to recent seasons where activity was close to or slightly above average.

  Seasonality: TC activity can be measured in multiple
  ways; these can include activity in the WNP basin as a
  whole or landfalls. The number of TCs in the WNP
  basin so far (23) is close to the seasonal average
  (approximately 25) while the zero-landfall count for
  Japan during 2020 highlights that landfalls are not
  wholly correlated to basin activity.

  The absence of landfalls in Japan (Figure 1) highlights
  that general seasonality and weather-related steering
  conditions still form a part of how a TC season can
  impact a given country.

2018 – 2019: The zero landfall season for Japan in 2020
comes as a stark contrast to the activity in 2018 and 2019.
Historical landfall observations (Figure 2) indicate that 2018
and 2019 were not exceptional compared with historical
                                                                                  Figure 1. Tropical cyclone activity in the WNP
averages, and that zero landfalls do occur (2020, 2008 and
                                                                                  basin, recorded as tracks (Kinetic Corp.),
1988).                                                                            observed seven TCs bypass Japan to the west
                                                                                  and to the south
One of the key learnings from previous seasons with events such as Typhoon Jebi is that loss experience is
not exclusively driven by the landfalling TC intensity but is heavily dependent on where the TC makes landfall;
but first, landfall must take place.

                                    Categorization of historical landfalls in Japan by central pressure
                         8   Cat1
                             Cat2
                         7
                             Cat3
   Number of landfalls

                         6   Cat4
                         5
                         4
                                                                             Figure X: Tropical cyclone activity in the WNP basin,
                         3
                                                                             recorded as tracks (Kinetic Corp.) observed 7 TCs
                         2                                                   bypass Japan to the west and to the south.
                         1
                         0
                             1951
                             1952
                             1953
                             1954
                             1955
                             1956
                             1957
                             1958
                             1959
                             1960
                             1961
                             1962
                             1963
                             1964
                             1965
                             1966
                             1967
                             1968
                             1969
                             1970
                             1971
                             1972
                             1973
                             1974
                             1975
                             1976
                             1977
                             1978
                             1979
                             1980
                             1981
                             1982
                             1983
                             1984
                             1985
                             1986
                             1987
                             1988
                             1989
                             1990
                             1991
                             1992
                             1993
                             1994
                             1995
                             1996
                             1997
                             1998
                             1999
                             2000
                             2001
                             2002
                             2003
                             2004
                             2005
                             2006
                             2007
                             2008
                             2009
                             2010
                             2011
                             2012
                             2013
                             2014
                             2015
                             2016
                             2017
                             2018
                             2019
                             2020

Figure 2. Willis Re landfall analysis of IBTrACS observed activity by equivalent Saffir-Simpson hurricane scale and view of
average annual landfall (black dotted line)

 Natural Catastrophes in 2020                                                              3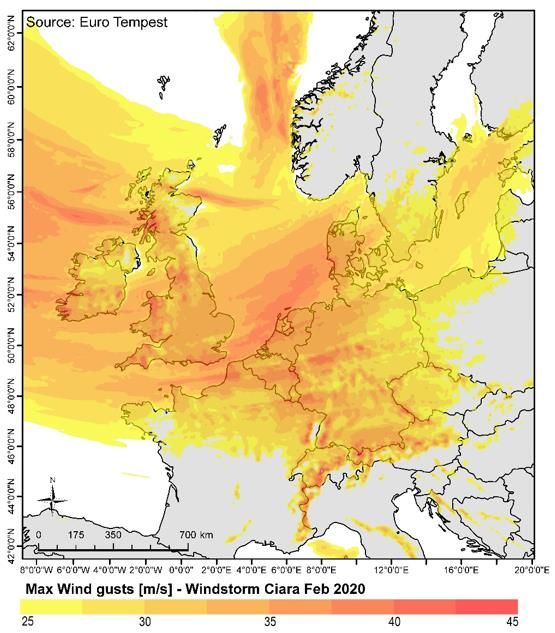
Latin America and Caribbean: Highest number of storms on record

In the Latin America and
Caribbean region, the losses
and impacts of natural
catastrophes were notably low
in 2020. The largest losses
may not be from natural
catastrophes but from COVID-
19, which were intensified by
the hurricane season.

For the 2020 season, the
National Oceanic and
Atmospheric Administration
(NOAA) recorded 30 named
                                     Figure 3. 2020 activity versus average activity for the years 1950 – 2011 (Source:
storms, of which 13 became
                                     Willis Re eVENT Report)
hurricanes, including six major
hurricanes. This is the most storms on record, surpassing the 28 from 2005, and the second-highest
number of hurricanes recorded.

Considering the number of storms during 2020, only a few notable hurricanes in the 2020 season affected
the Latin America and Caribbean region, in particular, hurricanes Eta and Iota, which caused catastrophic
flooding over Central America. Iota made landfall in Nicaragua on November 17 as a powerful Category 4
and affected an area that had been hit by Eta, also a Category 4, less than two weeks before, with
hundreds of casualties. It was the first time on record the Atlantic has had two major hurricane formations
in November at a time of year when the season is normally winding down. In Central America, Eta and
Iota caused unprecedented chaos in the region, which was already affected by COVID-19 conditions,
creating a humanitarian crisis that has left thousands of people without homes and at a constant risk of
contracting the virus.

In the lead-up to January 1, 2021 renewals, one of the main discussion points in the industry has been
the reinsurance market’s reactions to COVID-19. From a life perspective, COVID-19 has been a
challenge for many companies in the region. Pandemic is often excluded from life treaties; generally,
legislation across Latin America requires that the cover is interpreted in favor of the insured with the onus
on insurers to prove the application of any exclusions; however, depending on the country, death rates for
people under age 60 have been higher than the expected. This has resulted in more life insurance claims
in the insured population compared with other regions. Additionally, we will see COVID-19 continue to
play a role in renewal discussions, as many portfolios in the region have had difficulties quantifying the
final impact due to a delay in the reporting of losses because of extended lockdowns.

Natural Catastrophes in 2020                                                     4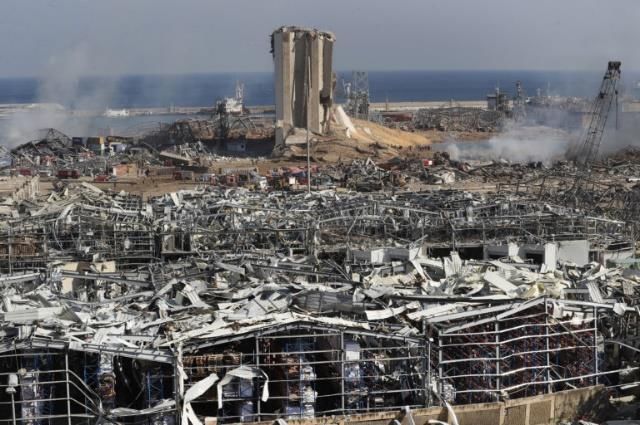
The U.S. in 2020: A year that broke many records

In the U.S., 2020 industry losses were well above average annual loss (2010 to 2020), with at least
19 events exceeding USD 1 billion and two events exceeding USD 5 billion. In contrast, 2019 had
only four events greater than USD 1 billion, whereas 2018 and 2017 had not more than 12 events
each exceeding USD 1 billion.

The year’s most significant severe thunderstorm insured loss
event was an outbreak across the northern Midwest regions of
the U.S. producing multiple rounds of thunderstorms between
August 8 and 11 (Figure 4). A powerful derecho (a particular
kind of storm) swept across the region bringing strong wind
from Nebraska through the Ohio Valley. Some locations
reported wind gusts over 100 mph. In addition, there were 15
tornadoes across northeastern Illinois, several affecting the
Chicago metropolitan area. Economic losses for this event are
estimated to be between USD 5 billion to 10 billion (NOAA).           Figure 4. Thunderstorm reported on August 10,
                                                                      2020 (Source: SPC, NOAA)

The 2020 Atlantic hurricane season was the most active with 30
named storms, including 13 hurricanes and six major hurricanes.
This makes 2020 the most active season on record, breaking the
previous record of 28 storms set back in 2005 (NOAA). Among
the year’s most significant insured loss events for U.S. regions
are Hurricane Laura, Hurricane Sally, Hurricane Delta, Hurricane
Zeta and Tropical Storm Isaias. Total insured losses for these
five events exceeded USD 15 billion. Hurricane Laura made
landfall as a Category 4 hurricane near Cameron, Louisiana
(Figure 5) with maximum sustained winds of 150 mph and a
minimum central pressure of 938 mb. All the other mentioned
hurricanes made landfall as Category 2 on the U.S. coastlines.    Figure 5. Hurricane Laura’s path as of August
2020 was only the second year in history that Greek letter names 28, 2020 (Source: NOAA)
were used as storm names after exhausting the usual rotating list
of 21 names (2005 is the only other year this has been done), and
it marked a record fifth consecutive year with at least one
Category 5 hurricane. It was also the fifth consecutive above-
average Atlantic hurricane season from 2016 onward.

The 2020 wildfire season was highly active in comparison with
2019. There were as many as 17 wildfire events this year (PCS).
Severe thunderstorms in the month of August ignited wildfires
across California, Oregon and Washington. Of the 17 wildfire        Figure 6. FEMA extent of the LNU Lighting
events, four of them (LNU Lighting, CZU Lighting, Beachie Creek Wildfire (source: FEMA Geospatial Resource
                                                                    Center)
and Glass Fire) caused insured losses exceeding $7 billion. In
total, these four events burned more than 600,000 acres of land. The LNU Lighting Complex Fire (Figure
6), August 17 to September 16, is believed to have been caused by nearly 11,000 lightning strikes that
occurred within a 72-hour span. According to CalFire, the 2020 wildfire season saw around 10,488
structures destroyed and more than 31 fatalities.

Natural Catastrophes in 2020                                               5
Pan-European windstorms drive 2020 EMEA NatCat insured losses The main driver of Europe, Middle East and Africa (EMEA) NatCat losses in 2020 was extratropical cyclone activity (ETC), notably storms Ciara and Dennis. However, the year was also characterized by exceptional subtropical storms, particularly Alpha and Ianos, affecting Portugal and Greece during the summer season. Reflections on potential European windstorm clustering At the peak of the 2019/2020 storm season in February, Northwestern Europe experienced several significant windstorms in short succession, with storms Ciara, Ines, Dennis and Jorge all occurring within a two-week period. Clusters of this type have the potential to cause large economic and insured losses as a result of accumulated precipitation and wind damage. This was demonstrated in 2020 by the U.K. experiencing its wettest February on record, partially due to the impact of Storm Ciara, followed by a series of Figure 7. U.K. winter 2020 rainfall rates (Met Office) smaller low-pressure frontal systems and culminating with impacts from Storm Dennis. Heavy rainfall persisted within the two-week period, which caused severe flooding from otherwise moderate events. Regulators are increasingly showing interest over the material impact of windstorm clustering for capital requirements. The February succession of windstorms this year acts as a reminder of the importance of efficient insurer systems to manage and distinguish concurrent peak events, for both claim handling and regulatory reporting. Evolving windstorm risk in Southern Europe? While much focus in the European windstorm market is generally placed on extratropical systems, 2020 has also highlighted the potential impacts of strong subtropical storms in Southern Europe. The 2020 windstorm season saw two notable but rare subtropical events, Storm Alpha and Medicane Ianos. Storm Alpha was the most easterly for the formation of an Atlantic named storm and the first tropical or subtropical cyclone recorded to have hit Portugal. Medicane Ianos was a particularly strong tropical-like system that skirted southern Italy and peaked just prior to landfall in Greece. While these systems did not lead to significant insured Figure 8. Subtropical Storm Alpha impacting losses of the likes of Ciara or Dennis, they do highlight Portugal (EOSDIS) the potential damaging impacts of powerful subtropical storms affecting Mediterranean regions. While future climate models predict a reduction in the frequency of medicane events specifically, their severity is expected to increase, making these an important consideration for the Southern European insurance market. Natural Catastrophes in 2020 6
COVID-19 pandemic
The ongoing COVID-19 pandemic has dominated the global news throughout 2020. The
coronavirus was first identified in Wuhan, China, before the World Health Organization (WHO) was
notified of the outbreak on December 31, 2019. Government interventions, including national
lockdowns, have been seen across the globe, with many countries implementing different levels
of restrictions.

COVID-19

COVID-19 is the disease caused by a new
coronavirus called SARS-CoV-2, which causes
respiratory illness. Global government
interventions have tried to curb the spread of the
virus, most commonly national lockdowns, work-
from-home orders, and the closures of
nonessential businesses and schools.
Variants of the strain have been reported in
multiple countries, including the U.K. when the
                                                                Figure 1. Timeline of COVID-19 responses (Brookings)
SARS-CoV-2 variant was announced on
December 14, 2020.

As of today, multiple countries have approved several vaccines against the COVID-19 disease. In the
West, the U.K. was first to do this on December 2, 2020, when the Pfizer vaccine was approved for mass
use, while currently the AstraZenca and Moderna vaccines have also been approved in Western
countries.

Global economic effects

The COVID-19 pandemic escalated worldwide only a few short weeks after the WHO was notified. Many
sources were predicting the global economy would suffer its worst recession since World War II.
Government restrictions to minimize the risk caused by COVID-19 have triggered steep downturns in
economic growth.

The pandemic is still ongoing, and thus the full scale of the effects will not be seen for years to come due
to the impact seen across a wide number of global industries.

Insured losses so far

Willis Re has published multiple
reports covering the ongoing
pandemic, which are available online.
To date, the actual losses booked in
2020 amount to 23 billion, and the
average industry loss estimate is 68
billion, assuming full development
of losses, which may take years.     Figure 2. Booked losses and industry loss estimates
                                     Source: Company disclosures, Dowling & Partners, Barclays Research, Autonomous Research,
Specific details on these numbers BofA Global Research, Lloyd’s, Berenberg, Moody’s, Willis Towers Watson
can be found through your Willis
                                     1: Willis Towers Watson’s $32 billion to $80 billion estimate corresponds to its Moderate to Severe
Re account executive or our          scenarios. Willis Towers Watson has also published Optimistic and Limited Success scenarios. These
website.                             are represented by the hashed portions of the WTW bar and widen the range to $11 - $140 billion.

Natural Catastrophes in 2020                                                              7
2. Major natural catastrophes in 2020
ST Midwest U.S.A. January 10 to 12, 2020
Midwest &
Southern U.S.A. Timeline and meteorology
▪ An upper level trough positioned over the western-
central U.S. moved eastward, an area of low
pressure at the surface began to organize and
strengthen over the central-southern Plains.
▪ Thunderstorms when severe, formed a squall line,
Insured losses producing hail (1-1.75 inches in diameter) and 50-
(in USD millions) 60+ mph wind gusts across much of the southern
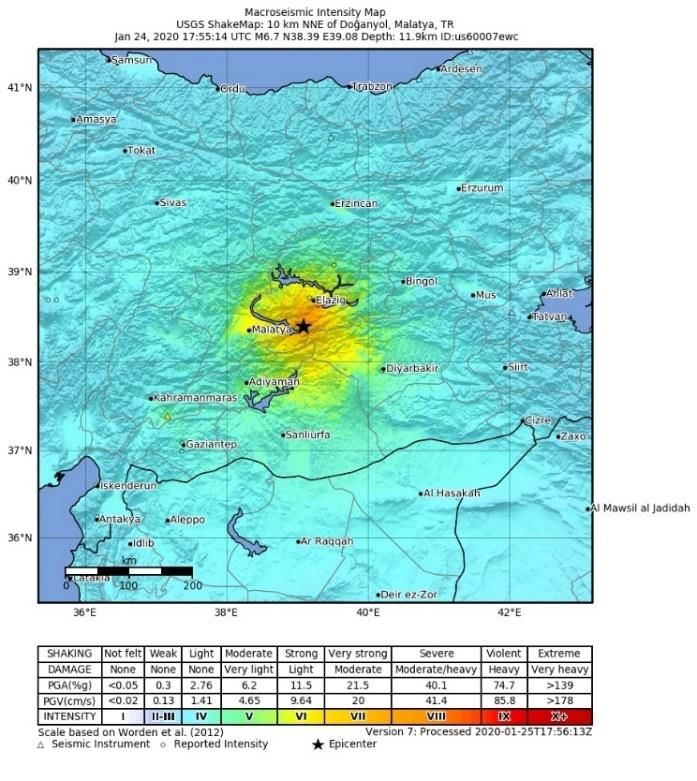
▪EQ Turkey January 24, 2020
Turkey
Timeline and Seismology
Magnitude: 6.7
▪ On 24th January 2020 at 20:55 (local time), a Mw
6.7 earthquake struck eastern Turkey. The
Depth: 11.9 km earthquake was felt widely across eastern Turkey,
with significant damage caused in the immediate
surroundings of the epicenter (USGS).
▪ The epicenter was located approximately 9km
northeast of Doganyol district, at a
depth of 11.9km, and occurred on the East
Insured losses
Anatolian Fault (USGS).
(in USD million) ▪ A number of aftershocks were detected, some
▪ Unknown having a magnitude greater than 4.0, with the
largest being 5.1 that occurred on 25th January at
Economic Losses 16:30 (local time) (Daily Sabah).
(in USD million) ▪ The region has seen significant historical seismic
activity with the last destructive earthquake being a
▪ 40% probability Mw 6.1 in 2010, located ~100 km north east of the
of losses 24th January 2020 event.
between 100
and 1000 Impact
(USGS) ▪ There were 41 fatalities and over 1,600 injured
following the event (AFAD).
▪ Structural damage was reported up to 40 km from USGS shaking intensity (MMI) footprint for
Fatalities the epicenter, 19 towns and 200 villages were the 24/01/20 Mw6.7 event
affected (Relief Web).
▪ 41 (AFAD)
▪ During surveys following the earthquake, 81
buildings were found to be heavily damaged and 53
partially damaged while 30 structures had
collapsed (Anadolu Agency).
Natural Catastrophes in 2020 9ST Southern U.S.A. February 5 to 8, 2020
South and
Northeast U.S.A. Timeline and meteorology
▪ An upper level trough was located over the central
U.S. and an area of low pressure at the surface, and
its associated frontal boundaries began to
strengthen over the lower Mississippi Valley.
▪ Hail measuring 1 to 1.75 inches in diameter and
winds gusting to 50-60+ mph was observed across
Insured losses Arkansas, Louisiana, Mississippi, and Alabama.
(in USD millions) ▪ Localized areas of Louisiana, Mississippi, Alabama,WS Ciara/Sabine February 8 to 11, 2020
Austria, Belgium,
Czech Republic, Timeline and Meteorology
Denmark, France, ▪ On February 8th, 2020, an extratropical cyclone formed
Great Britain, in the Atlantic and developed into a powerful European
Germany, Ireland, windstorm.
Netherlands, ▪ From February 9th to February 11th, the centre of the
Norway, cyclone tracked eastward across the north of the UK
Switzerland with a minimum pressure of 950mb, and subsequently
moved up the coast of Norway.
▪ Unusually high wind speeds inland of up to 130 km/h
affected the UK, Germany, Denmark, northern France,
Belgium and the Netherlands causing damage to
buildings and power disruptions.
Insured losses ▪ Some regions including the UK and Netherlands were
also hit by heavy rain with rainfall totals reaching 179.8
(in USD millions)
mm during the period, causing severe flooding (Met
▪ 1,100 (Munich Office).
Re) ▪ Damaging winds were also experienced in Poland,
▪ 1,900 (PERILS) Czech Republic and southern regions of Norway and
▪ 2,200– 2,400 Sweden.
(Willis Re
estimate) Impact Storm Ciara/Sabine, Peak Wind Gust
▪ At least 13 fatalities were reported with three deaths in Footprint 9th Feb (source: Euro Tempest)
the UK and Poland, two in Sweden and one in France,
Economic losses Germany, Italy, Slovenia and Switzerland (Insurance
(in USD millions) Journal).
▪ A wide area across the British Isles and Continental
▪ 1,800 (Munich
Europe was impacted by damaging wind gusts.
Re)
Additionally, the conditions persisted unusually long for
an extended period of over 48 hours in many countries
(PERILS).
Fatalities ▪ >200 flights and several events were cancelled.
▪ 14 (Insurance Severe restrictions in the train traffic also occurred (NY
Journal) Times).
▪ The city center of Hamburg and the Altona fish market
were flooded by 2.6 m of water (Federal Maritime and
Hydrographic Agency).
▪ Windstorm Ciara/Sabine represents the largest loss
from a European Windstorm since Friederike in 2018.
The majority of insurance losses (>600mn USD) were
reported in Germany (PERILS).
Natural Catastrophes in 2020 11WS Dennis February 15 to 17, 2020
Belgium, Germany,
Denmark, France, Timeline and Meteorology
Luxembourg, ▪ 13th named storm in the 2019-2020 season
United Kingdom, ▪ Struck less than a week after storm Ciara
Republic of Ireland, ▪ Originating over the US, the storm was named by the
Iceland, Norway, Met Office on the 11th of Feb (PERILS).
Sweden, ▪ The system underwent explosive cyclogenesis where
Netherlands the system dropped rapidly to a low pressure of
920hPa and accelerated rapidly towards Europe
(PERILS).
Impact
▪ Red warnings issued in the United Kingdom by the
Insured losses Met Office
▪ 60,000 homes without power in France, 45,000 in the
(in USD millions)
UK, 3,500 in Ireland and 17,000 in Sweden (Perils)
▪ 372 (PERILS) ▪ Travel disruptions and flight cancellations were seen
in all affected countries, mainly flights travelling to the
UK were affected (PERILS). Market Loss per CRESTA (PERILS)
Fatalities ▪ Severe flooding in the UK and Ireland, due to storm
▪ 13 (PERILS) Ciara and Dennis being only 1 week apart.
▪ Record breaking number of Environment Agency flood
warnings (Met Office).
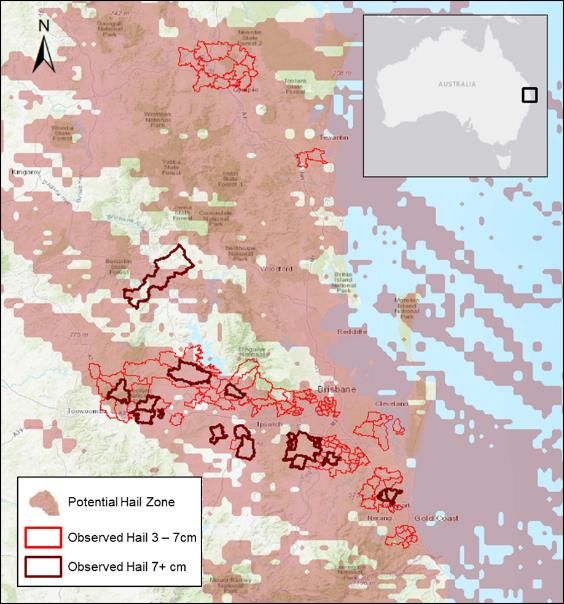
Natural Catastrophes in 2020 12FL UK February 2020
UK – Northern
England, Wales, Timeline and Meteorology
Ireland and ▪ Record breaking rainfall on saturated grounds led
Scotland to extensive river flooding across the UK,
impacting Northern England, parts of Wales,
Ireland and Scotland (PERILS).
▪ The heavy rainfall was associated with the
storms: Ciara, Dennis and Jorge which all hit the
UK successively in February 2020.
Industry Loss
Impact
(in GBP millions)
▪ It was the wettest February on record for England
▪ 375 (Met Office) and the costliest flood event in the
(PERILS) UK since the December 2015 winter floods
(Copernicus). Accumulated rainfall in mm for the UK Floods
▪ Properties, business and schools were flooded of February 2020
with widespread disruption to travel including
Fatalities flights, ferries and trains (JBA).
▪ At least 2 ▪ Over 200 flood warnings were issued over
deaths were England by the Environment Agency (JBA) with a
reported as a deployment of over 6km of flood barriers and 90
result of mobile pumps (Environment Agency).
flooding ▪ Rivers in Wales and the West Midlands burst their
(Copernicus) banks, prompting immediate evacuations and left
some communities cut off (Copernicus).
▪ Parts of Cumbria received nearly three quarters of
February’s rainfall in 24 hours with approximately
550 properties affected (Floodlist).
▪ In Scotland, the River Nith burst its banks in areas
of Dumfries causing widespread flooding
(Floodlist).
▪ Coastal flooding in areas surrounding Dublin were
recorded due to high waves and high tides
(Floodlist).
Natural Catastrophes in 2020 13ST Midwest U.S.A. March 2 to 4, 2020
Midwest &
Southern U.S.A. Timeline and meteorology
▪ A cold frontal boundary extended from the Great
Lakes southwestward through the southern Plains,
advancing eastward, brought some rain showers and
thunderstorms for the state of Missouri, Illinois,
Kentucky, Tennessee, Mississippi, and Alabama.
▪ Hail measuring upwards of 2 to 2.5 inches in diameter
Insured losses was recorded in parts of Missouri and
(in USD millions) Tennessee.
▪ >1,000 (PCS) ▪ Strong wind gusts (50 to 60+ mph) were also
recorded across parts of Missouri, Tennessee, and
Kentucky.
Thunderstorm reported on March 2 (source:
Impact
SPC, NOAA)
▪ A few tornadoes were reported from the greater
Nashville, TN area and caused numerous fatalities.
▪ Extensive damage to property and power lines
occurred in localized areas.
▪ The National Weather Service in Birmingham said an
EF0 tornado hit Hale County, south of
downtown Greensboro.
▪ A State of Emergency was declared in
Tennessee.
▪ Approximately, more than 100 buildings were
damages.
▪ Close to 300,000 properties were affected by power
outages.
Thunderstorm reported on March 4 (source:
SPC, NOAA)
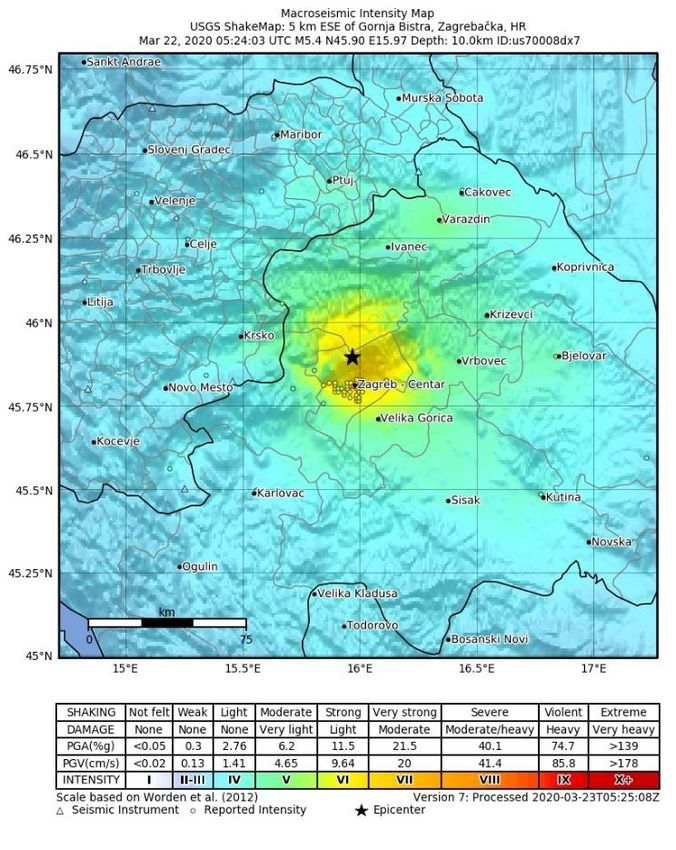
Natural Catastrophes in 2020 14EQ Zagreb March 22, 2020
Croatia
Timeline and Seismology
Magnitude: 5.3
▪ On 22nd March 2020 at 06:24 (local time), a Mw 5.3
earthquake struck northern Croatia (USGS). The
Depth: 10 km earthquake was felt widely within Zagreb, which was
biggest in last 140 years (The Guardian).
▪ The epicenter was located approximately 7km north of
Zagreb, at a depth of ~10 km (USGS).
▪ A number of aftershocks were detected, with the
Insured losses largest being Mw 4.9 that occurred on 22nd January
(in USD million) at 07:00 (local time) (Geosciences).
▪ 64-80 (Croatian ▪ The region has not seen significant recent seismic
Insurance activity with the last destructive earthquake being a
Bureau) Mw 6.9 in 1880, located in the vicinity of the 22nd
March 2020 event (Geosciences).
Economic Losses
Impact
(in USD million) ▪ There was 1 fatality and over 16 individuals were
▪ 1,100 (Munich injured as a result of the event (The Guardian).
Re) ▪ Structural damage was reported in an area of 165 km
by 56 km, covering Zagreb and the surrounding region
(Geosciences).
Fatalities ▪ During post-event surveys, 266,197 buildings were
found to be damaged and 1,900 were designated as
▪ 1 (The Guardian)
uninhabitable due to earthquake damage
USGS shaking intensity (MMI) footprint for
the 22/03/20 Mw5.4 event
(Geosciences).
Natural Catastrophes in 2020 15ST Midwest U.S.A. March 27 to 30, 2020
Midwest &
Southern U.S.A. Timeline and meteorology
▪ A low-pressure system developed over the central
plains, created an unstable environment across
portions of central Plains and middle Mississippi
Valley
▪ Hails up to 1.75-inches were reported in regions of
Insured losses Iowa, Illinois, Indiana, Kansas, Massachusetts and
(in USD millions) Mississippi. Whereas, more than 2-inch hail were
▪ >1,000 (PCS) reported in regions of Missouri, Ohio, Oklahoma,
Pennsylvania and West Virginia.
▪ Wind speeds up to 60, 70, 90 were reported in few in
Thunderstorm reported on March 28 (source:
regions of Kansas, Iowa, Kentucky.
SPC, NOAA)
Impact
▪ High winds were reported downing trees and power
lines in many areas in the state of Illinois, Indiana,
Kansas, Louisiana, New York, West Virginia.
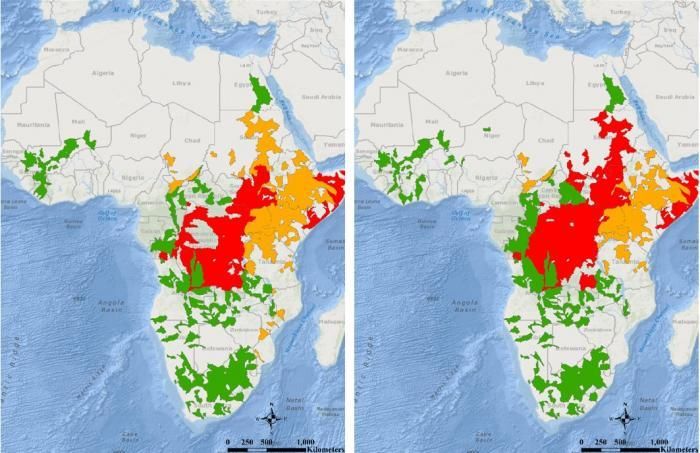
Natural Catastrophes in 2020 16FL Central and East
March - May 2020
Africa
Rwanda, Uganda,
Kenya, Somalia, Timeline and Meteorology
Sudan, South ▪ Floods lasted between March through to May 2020,
Sudan, Democratic the wettest period the region had seen since 1981
Republic of the (OCHA).
Congo, Ethiopia, ▪ Heavier and widespread rainfall during the “long-rains”
Tanzania and season lead to transboundary flooding across multiple
Burundi. countries (NASA).
▪ The 2019 October to December rains over East Africa
were one of the wettest seasons on record
(Wainwright et al., 2020).
▪ This was then followed by above average rainfall in
January and February (Wainwright et al., 2020). Watersheds in Africa that experienced a flood
Overall losses in watch (red), warning (orange), or advisory
Rwanda, Uganda Impact (green) conditions on May 5th and 6th as
and Kenya ▪ The rising water levels caused overflow of rivers and determined by model outputs from the
mudslides, impacting vulnerable settlements along the ROSES A.37 “Advancing Access to Global
(in USD millions) Flood Modeling and Alerting” project.
riverbanks.
▪ >US$70 mn ▪ Houses, roads and bridges were damaged or
(Munich Re)
destroyed and crops were washed away.
▪ Above average rainfall promoted the breeding of
locusts and caused an outbreak across the region,
threatening the main season crops (OCHA).
Fatalities in ▪ Over 200 people died in Kenya, impacting 29 of the
Rwanda, Uganda country’s 47 counties. (Floodlist).
and Kenya ▪ Torrential rain caused flash flooding and landslides in
▪ Approx. 281 Rwanda, killing over 60 people (Floodlist).
(Munich Re) ▪ 86,000 people were made homeless in the
Democratic Republic of the Congo (OCHA).
▪ Uganda was impacted by several major flash flood
events, with over 10,000 people affected in the district
of Kasese by severe flooding in early May (Floodlist).
▪ Lake Victoria, Eastern Uganda, reached record
breaking water levels due to the above average long
rains and caused an evacuation of over 3,800 people
(Floodlist/Wainwright et al., 2020).
▪ The heavy rain also causes landslides, one of which
buried a two-story house, killing at least 10 people in
Ethiopia (Floodlist).
Natural Catastrophes in 2020 17ST Northeast U.S.A. April 7 to 9, 2020
Northeast &
Midwest U.S.A. Timeline and meteorology
▪ An upper level trough moving southeastward from the
Canadian Prairies towards the
Midwest region and at the surface, a low-pressure
system began to strengthen to the west of the Great
Lakes created severe thunderstorm produced hail
Insured losses measuring upwards of 2-2.5 inches in diameter
(in USD millions) across portions of Wisconsin and Michigan.
▪ >1,000 (PCS) ▪ Hail and strong wind gusts impacted West Virginia,
Virginia, North Carolina, Kentucky,
Tennessee, Ohio, Indiana, Illinois, Iowa and Missouri.
Thunderstorm reported on April 7 (source:
▪ Total rainfall from April 7th through the 9th reached 1
SPC, NOAA)
to 2+ inches in some areas of the impacted states
Impact
▪ Strong wind gusts also impacted parts of West
Virginia and Virginia.
▪ There were multiple reports of trees being knocked
down and causing damage to vehicles.
▪ Winds caused damage to residential structures and
commercial buildings.
▪ Strong wind up to 70 mph were experienced in New
Jersey also, leading to multiple reports of trees being
knocked down and leading to some isolated power
outages.
Thunderstorm reported on April 8 (source:
▪ Close to 80,000 properties were affected by power
SPC, NOAA)
outages.
April 7 to 9, 2020
Natural Catastrophes in 2020 18ST Northeast U.S.A. April 10 to April 14, 2020
Midwest &
Southern U.S.A. Timeline and meteorology
▪ An upper level low over the Southwest slowly
progressed eastward and at the surface, moisture
moved into western Texas.
This combined with daytime heating helped create an
unstable airmass.
Insured losses ▪ Storms produced hail over portions of west Texas,
(in USD millions) where golf ball size hail and larger fell over some
▪ >1,000 (PCS) areas.
▪ Several strong tornadoes were observed in Louisiana,
Texas, Mississippi, Georgia, Tennessee, South
Fatalities: 16 Carolina, and North Thunderstorm reported on April 12 (source:
Carolina and produced extensive damage. SPC, NOAA)
Impact
▪ Damaging wind gusts (50-60+ mph) also
occurred across all states in the Southeast and
southern Mid-Atlantic.
▪ Hail was mainly concentrated in northeastern Texas,
southern Oklahoma, Arkansas, northern Louisiana,
Arkansas, Mississippi, and Alabama and measured
upwards of 1-2 inches in diameter.
▪ Heavy rainfall produced flooding in several areas
across the Southeast
▪ Close to 1,400,000 properties were affected by power Thunderstorm reported on April 13 (source:
outages.
SPC, NOAA)
Natural Catastrophes in 2020 19ST Southern U.S.A. April 18 to 20, 2020
Southern U.S.A.
Timeline and meteorology
▪ An upper level trough moving southeastward from the
Canadian Prairies towards the
Midwest region and a low-pressure system at surface,
lead to strengthening of storm to the west of the Great
Insured losses Lakes.
(in USD millions) ▪ Severe thunderstorms produced hail measuring
▪ >1,000 (PCS) upwards of 2-2.5 inches
in diameter across portions of Wisconsin and
Michigan.
Impact Thunderstorm reported on April 19 (source:
SPC, NOAA)
▪ A Hail and strong wind gusts impacted West Virginia,
Virginia, North Carolina, Kentucky,
Tennessee, Ohio, Indiana, Illinois, Iowa and Missouri.
▪ Large hail (2 to 2.5+ inches) and 40 to 60+ mph winds
were recorded in parts of Arkansas, Alabama,
Mississippi and Georgia.
▪ Close to 75,000 properties were affected by power
outages.
Natural Catastrophes in 2020 20ST Southern U.S.A. April 21 to 24, 2020
Southern U.S.A.
Timeline and meteorology
▪ An area of low pressure formed near the Texas
Panhandle and several discrete thunderstorms cells
formed during this time and moved southeastward
across Oklahoma and northern Texas.
▪ Hail up to 1.75 inches was reported in regions of
Insured losses Arkansas, Georgia and Louisiana.
(in USD millions) ▪ Hail up to 2 to 2.75 inches was reported in regions of
▪ >1,000 (PCS) Oklahoma and Texas.
▪ Wind gust up to 70 mph were reported in Florida.
Fatalities: 1 Impact
▪ Many reports of shingles blown off roofs, windows blown Thunderstorm reported on April 22 (source:
out, and damage to home and vehicles according to SPC, NOAA)
NWS.
▪ Close to 20,000 properties were affected by power
outages.
Thunderstorm reported on April 23 (source:
SPC, NOAA)
Natural Catastrophes in 2020 21ST Southern U.S.A. April 24 to 26, 2020
Southern U.S.A.
Timeline and meteorology
▪ Low-pressure system took shape over the
southern plains on as an upper-level trough was
set up over the Plains region.
▪ Strong winds, large hail and a couple tornadoes
primarily impacted areas from eastern Texas
Insured losses and eastern Oklahoma into northern Louisiana
(in USD millions) and Arkansas.
▪ >1,000 (PCS)
Impact
▪ Wind gust up to 70 mph were reported in these
few regions of Florida and Oklahoma.
▪ Large hail of greater than 2 inches were Thunderstorm reported on April 24 (source:
significantly reported in Oklahoma, Colorado, SPC, NOAA)
Illinois, Nebraska and Pennsylvania, Indiana.
▪ Strong to severe storms again developed within
the warm sector of this system, impacted areas
from the Mid-South into the Carolinas.
ST Southern U.S.A. April 27 to 30, 2020
South and
Northeast U.S.A. Timeline and meteorology
▪ A system moved across the western U.S.
towards the Central Plains and a dry line
developed across central/western Texas,
resulted in severe thunderstorms in the region.
▪ The storms resulted in scattered, large hail
across north-central Texas.
Insured losses ▪ Heavy rainfall resulted in flash flooding across
(in USD millions) areas of lower Mississippi Valley.
▪ >1,000 (PCS) ▪ There were multiple reports of hail greater than
2 inches across central and eastern Oklahoma.
Impact
Thunderstorm reported on April 28 (source:
▪ Damaging wind gusts and heavy rainfall
continued across the region and one tornado SPC, NOAA)
was reported near Gretna, Florida.
▪ High winds of up to 70 mph knocking down trees
and power lines were reported in several cities
including Benton, Cabot, Greenwood, Hope,
Jacksonville, Jonesboro, Little Rock and
Russellville.
Natural Catastrophes in 2020 22ST Southern U.S.A. May 2 to 3, 2020
Southern U.S.A.
Timeline and meteorology
▪ A strengthening storm system gradually moved
southeastward into northwestern Kansas resulted in
rain showers and thunderstorms over central-eastern
Kansas.
▪ There were multiple reports of trees being knocked
Insured losses down including Huntsville, Florence, and Athens.
(in USD millions)
▪ >1,000 (PCS) Impact
▪ Hail up to 2 to 2.75 inches were reported in regions of
Arkansas and up to 1.75 inches in region of
Tennessee and Missouri.
▪ Close to 130,000 properties were affected by power Thunderstorm reported on May 3 (source:
outages. SPC, NOAA)
▪ Damages have also been caused by downed trees
and power lines in these regions.
ST Southern U.S.A. May 4 to 5, 2020
Southern U.S.A.
Timeline and meteorology
▪ A frontal system moved out of the central Rockies
and into the northern Plains which produced isolated
thunderstorms across the northern and central Plains.
▪ Storms resulted in strong wind gusts as high as 70
mph and widespread, large hail, with some reports of
Insured losses hail up to 2” in regions of Kansas damaged many
(in USD millions) property and vehicles.
▪ >1,000 (PCS)
Impact
▪ Hail ranging from 1 to 1.75 were reported in Missouri,
South Carolina and Tennessee.
▪ Winds brought down trees in multiple locations
causing damage to vehicles and property. Thunderstorm reported on May 4 (source:
▪ Reports of significant damage to roofs and siding on SPC, NOAA)
residential and commercial buildings throughout the
areas have been received.
Natural Catastrophes in 2020 23ST Southern U.S.A. May 16 to 21, 2020
South and
Northeast U.S.A. Timeline and meteorology
▪ An upper level trough positioned over the central
US helped to produced multiple areas of severe
weather across the Great Plains and Midwest.
▪ The severe thunderstorm brought heavy rainfall,
hail, and strong wind gusts to southern Oklahoma
and central-eastern Texas.
Insured losses ▪ Flooding occurred throughout the Midwest,
(in USD millions) particularly for areas of Michigan.
▪ >1,000 (PCS)
Impact
▪ Heavy rainfall and some scattered thunderstorms
also began to impact Virginia
and the Carolinas by May 18, resulting in Thunderstorm reported on May 16 (source:
additional flooding. SPC, NOAA)
▪ Large hail greater than 2 inches in diameter
impacted portions of central Florida overnight, as
well as some stronger wind gusts.
▪ EF-0, EF-1 tornado was reported in states of
Texas with wind speed of 85 to 95 mph.
▪ Reports of significant damage to roofs and siding
on residential and commercial buildings throughout
the areas have been received.
Natural Catastrophes in 2020 24ST Southern U.S.A. May 20 to 24, 2020
Southern U.S.A.
Timeline and meteorology
▪ A small area of upper-level energy moved into northern
Texas combined with strong daytime heating resulted in
some severe thunderstorms which developed over
northern central Texas by the afternoon.
▪ Thunderstorm spread into central Texas, bringing more
Insured losses hail, strong wind gusts, and heavy rainfall.
(in USD millions) ▪ Additional storms progressed from the low-pressure
▪ >1,000 (PCS) area along a stationary frontal boundary positioned into
the Southeast.
Impact
▪ Hail and strong wind gusts were reported from Illinois Thunderstorm reported on May 22 (source:
and Indiana. Several tornadoes were also reported from SPC, NOAA)
northern-central Illinois.
▪ A weak frontal boundary extended eastward from the
upper-central Ohio River Valley to the Carolinas,
resulting in some strong wind gusts in those areas.
▪ Hails up to 1.75 inches in diameter were reported in
regions of Arkansas, Georgia, Indiana, and Texas,
whereas about up to 2.75 inches were reported in
Oklahoma and South Carolina and a maximum of 4
inches hail was reported in regions of Texas.
▪ A Local media has reported that repair shops and
roofing companies are busy due to the hail activity.
▪ Reports of significant damage to roofs and siding on
residential and commercial buildings throughout the
areas have been received.
Thunderstorm reported on May 24 (source:
SPC, NOAA)
Natural Catastrophes in 2020 25CD U.S.A. (Civil
May 26 to June 8, 2020
Disorder)
All regions U.S.A.
Timeline
▪ Protestors for the death of George Floyd gathered in the
streets of Minneapolis and marched towards the 3rd
Precinct around 6 pm central on Tuesday, May 26.
▪ As the protestors proceeded, a smaller group started to
vandalize the building and squad cars with spray paint,
Insured losses eventually shattering a window at the precinct.
(in USD millions) ▪ Riots also erupted throughout other U.S. cities also
sparked by the death of George Floyd.
▪ >1,000 (PCS)
▪ On Thursday, May 28, Governor of Minnesota issued
Emergency Executive Order 20-64, activating the
Minnesota National Guard and declaring a Peacetime
Emergency to provide safety and protection to the
people of Minneapolis, St. Paul, and the surrounding
communities. Civil Disorder reported areas in USA (source:
FEMA)
Impact
▪ Over 200 buildings have been listed as being damaged
or looted in Minneapolis and St. Paul ranging from spray
paint to burned with heavy structural damage.
▪ Damage and looting took place at the Apple store,
Urban Outfitters, Crate & Barrel, and the nearby
Mercedes-Benz dealership in the state of Arizona.
▪ In San Leandro, between 73 and 100 cars were stolen
from a Chrysler Dodge Jeep Ram auto dealer on
Sunday, June 1, 2020. Some of the sportscars cost as
much as $60,000.
▪ There were reports of severe damage in downtown D.C.
Looters damaged coffee shops, banks and one office
building after another
▪ Rioters broke windows and sales displays in Manhattan
causing damage to stores ranging from cosmetics
sellers to high-end clothing department stores. Chicago,
Los Angeles, Detroit and multiple other cities saw
people causing damage to vehicles, residential
buildings and commercial establishments.
▪ Over $100,000 in merchandise was reported to be
stolen from a Walmart in Hillsborough County, Florida.
Over 40 businesses reported damage in north Tampa.
Natural Catastrophes in 2020 26ST Texas U.S.A. May 27 to 28, 2020
Texas U.S.A.
Timeline and meteorology
▪ A low-pressure system intensified over the southern
Plains and lower Mississippi Valley aiding in increased
instability over central Texas and widespread
thunderstorms.
▪ The stronger storm cells also resulted in high wind
Insured losses gusts to the northwest of near Houston
(in USD millions)
▪ >1,000 (PCS) Impact
▪ A total of 188 high wind and large hails were reported
in Texas.
▪ Large hail up to 2.75 inches in diameter were reported
in the region.
Thunderstorm reported on May 27 (source:
▪ Wind gust up to 80 mph were reported causing SPC, NOAA)
downed trees and power lines.
ST Northeast U.S.A. June 2 to 3, 2020
Northeast U.S.A.
Timeline and meteorology
▪ An area of low pressure and its associated frontal
boundaries extended across the Great Lakes region.
▪ Hail measuring upwards of 2-2.5 inches in diameter,
50-60+ mph wind gusts, and localized heavy rainfall
were observed in central-southern portions of the
Insured losses state.
(in USD millions) ▪ A strong wind gusts and localized heavy rainfall
▪ >1,000 (PCS) impacted Pennsylvania and New Jersey.
Impact
▪ Reports of significant damage to roofs and siding on
residential and commercial buildings throughout the
areas have been received. Thunderstorm reported on June 3 (source:
▪ Damages have also been caused by downed trees SPC, NOAA)
and power lines.
▪ Vehicle damages include broken windshields, mirrors
and extensive body damage.
▪ Close to 250,000 properties were affected by power
outages throughout the region.
Natural Catastrophes in 2020 27ST Midwest U.S.A. June 5 to 11, 2020
Midwest U.S.A.
Timeline and meteorology
▪ An a broad upper-level trough moved
▪ over the western US, extending inland leading to
strong wind gusts (50-60+ mph) impacting parts of
the Great Basin-Intermountain West region.
▪ Some scattered showers and thunderstorms also
Insured losses formed over parts of Utah, Colorado, and Wyoming.
(in USD millions) ▪ A Widespread strong wind gusts and hail measuring
▪ >1,000 (PCS) 1-1.75 inches impacted Utah, Colorado, Wyoming,
the Dakotas, and Nebraska.
Impact
▪ Localized heavy rainfall caused flash flooding in Thunderstorm reported on June 6 (source:
some areas, and a few tornadoes were also
SPC, NOAA)
reported from South Dakota.
▪ Wind speeds up to 110 mph were reported in state
of Colorado, whereas up to 80 mph were recorded
in Indiana, North and South Dakota.
▪ Major hail affected region were, Minnesota, North
and South Dakota, Nebraska and Utah reporting up
to 2.5 inches of hail.
▪ Close to 100,000 properties were affected by power
outages throughout the region
Natural Catastrophes in 2020 28ST Midwest U.S.A. July 10 to 12, 2020
Midwest U.S.A.
Timeline and meteorology
▪ An area of low pressure and its associated
frontal boundaries advanced from the northern-
central Plains into the Midwest during the
afternoon and evening hours.
▪ A line of severe thunderstorms impacted parts
Insured losses ▪ of the Dakotas into Nebraska, resulting in large
(in USD millions) hail up to 3 inches in diameter in parts of
▪ >1,000 (PCS) southwestern South Dakota and central
Northeast.
Impact
▪ Largest hail up to 3.25 inches in diameter were
Thunderstorm reported on July 11 (source:
reported in South Dakota and 2.75 inches in
SPC, NOAA)
Iowa. In other regions hails ranging from 1.75
to 1.25 inches were reported in Illinois and
Indiana.
▪ Two tornadoes of maximum wind speed of 110
mph touched down in the state of South Dakota.
▪ Close to 40,000 properties were affected by
power outages throughout the region.
Natural Catastrophes in 2020 29STS Isaias July 30 to August 05, 2020
South & Northeast
U.S.A. Timeline and Meteorology
▪ Tropical Cyclone Nine was declared by the National
Hurricane Center (NHC) on Tuesday, July 28th, nearly
600 miles east of the Leeward Islands. Later on, July
29th, the system was declared Tropical Storm Isaias.
▪ On 30th the system strengthened and officially became
Insured losses hurricane, but next day despite Isaias reaching its
(in USD millions) maximum intensity of 85 mph sustained winds Isaias
▪ >1000 (PCS) ultimately began to weaken, becoming a tropical storm
▪ 3000-5000 by the evening hours, prior to tropical storm force winds
(RMS) reaching southern Florida.
▪ Tropical storm conditions impacted the east coast of
Fatalities: 1 Florida, including gusty winds, heavy rainfall, flash
flooding, and storm surge.
▪ On 3rd August by the evening hours, Isaias had regained
hurricane strength and made landfall near Ocean Isle
Beach, North Carolina. Wind speed and path of Tropical Storm
Isaias
▪ Tropical storm-force winds, heavy rainfall, flash flooding, (source: NASA, NHC)
and storm surge impacted the Mid-Atlantic region, and
several tornadoes were also reported from North
Carolina, Virginia, Maryland, Delaware, and New
Jersey.
▪ Post-tropical Cyclone Isaias shifted to the north of New
England and into Eastern Canada during the overnight
hours into August 5th.
Impact
▪ The large amount debris not only slowed traffic, it also
led to power outages in Connecticut.
▪ Torrential rain and damaging winds have buffeted South
Carolina leading to flooding in multiple locations.
▪ The Florida Governor stated the state is anticipating
power outages from Isaias while officials are working to
prepare shelters for people to be safe while being
mindful of social distancing. Tropical storm Isaias’s path as of August 2
▪ New Jersey Governor Phil Murphy issued a state of (source: NOAA)
emergency for New Jersey starting at 5 am on Tuesday,
2nd August.
▪ Broken trees and wind led to power outages throughout
the state, while falling branches and debris also
damaged vehicles and homes in across affected
regions.
▪ Close to 1,000,000 properties were affected by power
outages throughout the affected regions.
Natural Catastrophes in 2020 30Beirut Explosion 4 Aug 2020
Lebanon The Port of Beirut explosion was a notable man-made
event and is included here due to the significant impact
on property and marine insurance.
Timeline
Economic losses ▪ On Tuesday 4th August 2020 at 18:07 local
time a fire was closely followed by an
(in USD millions)
explosion at the Port of Beirut.
▪ $4.6 - 7.5bn
▪ The explosion was caused by 2,750 tonnes
(WBG / ACAL)
of ammonium nitrate improperly stored in a
warehouse since 2013.
Insured losses ▪ A state of emergency was declared in Beirut Aftermath of the Port of Beirut explosion (Insurance
(in USD millions) for two weeks following the event. Journal)
▪ $1.5bn (ACAL)
Impact N 1km
Fatalities ▪ The explosion destroyed the port creating a
▪ 220 (OCHA) 125-meter-wide crater.
▪ Reports indicate the blast caused >6,500
injuries and >300,000 homeless (WBG).
▪ The port is the critical link in the supply chain
for Lebanon handling 60% of Lebanon’s
imports and storing both food and medical
reserves. It is also one of the top 10 seaports
in the Mediterranean handling approximately
1,300,000 containers a year (POB) with the
explosion causing supply-chain losses and Damage Proxy Map (ARIA/EOS) – damage grades
loss of cargo. from dark red (severe damage or total collapse) to
▪ The explosion exacerbated ongoing civil yellow (moderate or partial damage).
unrest, socio-economic crisis and the
COVID-19 pandemic.
▪ Property insurers bore the brunt of insured
losses (ACAL) with additional significant
marine and cargo losses.
Natural Catastrophes in 2020 31ST Midwest U.S.A. August 8 to 11, 2020
Midwest U.S.A.
Timeline and meteorology
▪ An upper level trough was positioned over the
Northwest U.S.- Western Canada this feature
combined with regional instability and moisture
helped to produce multiple rounds of severe
thunderstorms for the northern Midwest.
Insured losses ▪ Locally heavy rainfall, hail measuring 1 to 1.5”, and
(in USD millions) 50-60+ mph wind gusts impacted Minnesota and
▪ >1,000 (PCS) the upper Midwest-Plains at the start of this storm.
▪ Toward later part of this storm, a derecho swept
across the region bringing strong wind from
Nebraska through the Ohio Valley.
Thunderstorm reported on August 9 (source:
Impact
SPC, NOAA)
▪ Some locations in Iowa reported wind gusts over
110 mph and brought hail of 1-2” across parts of the
region.
▪ Wind speeds up to 80, 70 and 65 were reported in
regions of Minnesota, Nebraska and Wisconsin.
▪ Close to 400,000 properties were affected by power
outages throughout the region
Thunderstorm reported on August 10 (source:
SPC, NOAA)
Natural Catastrophes in 2020 32WF Beachie Creek August 16 to October 10, 2020
Oregon, U.S.A.
Timeline
▪ The Beachie Creek Wild Fire was first detected on August
16, 2020 approximately 2 miles south of Jaw Bones flats in
rugged terrain deep in the Opal Creek Wilderness.
▪ The fire grew slowly but consistently and was roughly 200
acres by September 1st, fueled by hot and dry conditions.
▪ The winds were 50-75 miles per hour, and the fire growth
Insured losses rate was about 2.77 acres per second in areas of the
(in USD millions) Beachie Creek fire.
▪ >1,000 (PCS) ▪ The unique wind event on September 7th created an
extreme environment in which the fire was able to
▪ 150-500 (RMS) accelerate.
▪ A new fire start began at the Incident Command Post
forcing immediate evacuation of the Team and fire Extent of the Beachie Creek Wildfire
Fatalities: Unknown personnel. (source: InciWeb)
▪ From the night of September 7th, these fires became
collectively known as the Santiam Fire
▪ At the end of the wind event, the Lionshead Fire also
merged with the Beachie Creek Fire having burned through
the Mount Jefferson Wilderness.
Impact
▪ At the beginning of October, seasonal fall weather moved
over the fire producing several inches of rain.
▪ During these weeks, a BAER (Burned Area Emergency
Response) team assessed the burned landscape and
habitats to try to evaluate damage.
▪ On October 8th, PNW Team 8, a Type 2 team took over
management of the fire. Focus efforts on the ground shifted
from suppression and mop-up to suppression repair.
▪ The acreage topped out at close to 190,000 acres. Closures
remain in place to keep the public safe from hazards like
falling trees and ash pits that can remain hot and smolder
for months after the wildfire event.
Natural Catastrophes in 2020 33WF LNU Lightning
August 17 to September 16, 2020
Complex
California, U.S.A.
Timeline
▪ The LNU Lightning Complex Wild Fire Napa, Sonoma,
Lake, Yolo, and Solano Counties started on Monday
August 17.
▪ The complex fire included the Hennessey, Gamble, 15-10,
Spanish, Markley, 13-4, 11-16, and Walbridge Fires.
▪ Many of the fires are believed to have been caused by
Insured losses lightning strikes as northern and central California began
(in USD millions) experiencing an unusually active sequence of largely dry
lightning strikes earlier in the wee.
▪ >1,000 (PCS)
▪ Some reports indicate that nearly 11,000 lightning strikes
▪ 750-1,100 (RMS)
occurred in California in a 72-hour time span.
▪ The LNU Lightning Complex Fire was fully contained on FEMA extent of the LNU Lighting Wildfire
(source: FEMA Geospatial Resource
Fatalities: 5 Friday October 2.
Center)
Impact
▪ The LNU Lightning Complex had burned 363,220 acres
and has destroyed 1,491 structures and damaged a
further 232 structures.
▪ 64,600 residents had been evacuated from San Mateo,
Santa Cruz counties.
▪ Mandatory evacuations had been ordered for all non-
essential personnel on Travis Air Force
▪ The largest portion is the Hennessey Fire, which is
burning in Lake and Napa counties, in which, 305,651
acres have burned.
▪ The LNU Lighting Complex is the fourth-largest wildfire in
California.
FEMA extent of the LNU Lighting Wildfire
(source: FEMA Geospatial Resource
Center)
Natural Catastrophes in 2020 34WF CZU Lightning
August 17 to September 22, 2020
Complex
California, U.S.A.
Timeline
▪ The CZU August Lightning Complex Fire in the counties
of Santa Cruz and San Mateo started on Tuesday
August 18.
▪ The complex fire included the Waddell Fire, Warrenella
Fire, 5-14 Fire, 5-15 Fire, and 5-18 Fire.
▪ Many of the fires are believed to have been caused by
Insured losses lightning strikes as northern and central California
(in USD millions) began experiencing an unusually active sequence of
▪ >1,000 (PCS) largely dry lightning strikes earlier in the week.
▪ 1,500-2,500 ▪ Some reports indicate that nearly 11,000 lightning
(RMS) strikes occurred in California in a 72 hour time span.
▪ The CZU Lightning Complex Fire was fully contained on
Wednesday September 23.
RMS extent of the CZU Lighting Wildfire
Fatalities: 1 Impact (source: RMS)
▪ The CZU Lightning Complex had burned 86,509 acres
of land and destroyed 1,490 structures and damaged
140 further structures.
▪ The Big Basin Redwoods State Park has been badly
damaged by the fires, according to the California Parks
and Recreations Department.
▪ According to the San Mateo County park system, the
fires have burned an estimated 2,800 acres of
Pescadero Creek County Park, but did not reach
Memorial Park or Sam McDonald County Park.
▪ On September 3, the director of Santa Cruz County
Public Works reported that the CZU fire has caused an
estimated US$310 million in damage to private
infrastructure, which includes homes, and US$30 million
in damage to public infrastructure.
Natural Catastrophes in 2020 35You can also read