An International Perspective on the New Zealand Productivity Paradox - New Zealand Productivity Commission Working Paper 2014/01 April 2014 ...
←
→
Page content transcription
If your browser does not render page correctly, please read the page content below
An International
Perspective on the
New Zealand
Productivity Paradox
New Zealand Productivity Commission
Working Paper 2014/01

April 2014

Authors: Alain de Serres, Naomitsu Yashiro and
Hervé Boulhol
The New Zealand Productivity Commission Working Paper 2014/01: An International
Perspective on the New Zealand Productivity Paradox
Date:     April 2014

Authors:   Alain de Serres, Naomitsu Yashiro and Hervé Boulhol
           Organisation for Economic Cooperation and Development, Economics Department

JEL classification: O47: Measurement of economic growth; aggregate productivity; cross-country
output convergence, O30: Technological change; research and development; intellectual property
rights, F62: Macroeconomic impacts of globalisation, R11: Regional economic activity: growth,
development, and changes.

Key words: New Zealand, intangible assets, economic geography, market access

ISBN:      978-0-478-39545-7

Acknowledgements: The authors are from the OECD Economics Department. This paper was originally
prepared for the Productivity Symposium in Wellington, New Zealand, July 2 2013. They would like to
thank Dan Andrews, Calista Cheung, Paul Conway, Geoff Lewis, Jorgen Elmeskov, Ben Westmore as
well as participants in the Productivity Symposium for useful discussions and suggestions.

Disclaimer: The views expressed in this working paper are strictly those of the authors. They do not
necessarily reflect the views of the New Zealand Productivity Commission or the OECD. All errors and
omissions are the responsibility of the authors.

Information on the Productivity Commission can be found on www.productivity.govt.nz or by calling
+64 4 903 5150.
An International Perspective on the New Zealand Productivity Paradox iii Abstract New Zealand lags behind advanced OECD countries in productivity and per capita income levels, in spite of what can be characterised as growth-friendly structural policy settings. Using an augmented- Solow growth framework, this paper explores the “productivity paradox”, and identifies the main determinants of New Zealand’s economic under-performance. We find a sizeable contribution from New Zealand’s gap in knowledge-based capital (also referred to as intangible assets) and from its disadvantage in economic geography captured by an indicator of access to markets and suppliers. For instance, New Zealand’s low R&D intensity vis-à-vis advanced OECD countries can explain up to one- third of the productivity gap. The room for catch-up also extends to other types of intangible assets such as information and communication technology (ICT) and managerial practices. Furthermore, unfavourable access to large markets and suppliers of intermediate goods limits New Zealand’s trade intensity, especially its integration with global value chains where intensive transfer of advanced technologies often occurs. Overall, the empirical estimates provided in the paper suggest that remote access to markets and suppliers and low investment in innovation (as measured by R&D intensity) could together account for between 17 to 22 percentage points of the 27 percent productivity gap vis- à-vis the average of 20 OECD countries.
iv   An International Perspective on the New Zealand Productivity Paradox

     Contents
     Abstract ..........................................................................................................................................iii
     1       Introduction ........................................................................................................................... 1
             1.1 The nature and magnitude of the productivity paradox........................................................ 1
             1.2 Roadmap................................................................................................................................. 2
     2       The direct contribution of physical and human capital........................................................... 3
     3       The role of knowledge-based capital and its growing importance as a source of
             productivity ........................................................................................................................... 8
             3.1 The growth contribution from KBC comes from specific characteristics ............................. 10
             3.2 Investment in KBC appears to be relatively low in New Zealand, particularly spending
                  on R&D.................................................................................................................................. 13
             3.3 There is more to innovation than R&D, especially in a country with a highly-developed
                  service sector ........................................................................................................................ 17
     4       In search of a market: the role of geographic distance and its impact on productivity
             through international trade ................................................................................................. 23
             4.1 Low trade intensity may account for a sizeable share of the productivity gap ................... 24
             4.2 New Zealand could benefit from further integration into GVCs in innovation-intensive
                   sectors ................................................................................................................................... 27
             4.3 The composition of trade and the degree of interconnectedness also matter ................... 29
             4.4 Distance cannot be changed but its impact can be minimised ........................................... 31
     5       Concluding remarks ............................................................................................................. 33
     References .................................................................................................................................... 35

     Tables
     Table 1          Estimation results from the augmented-Solow model .......................................................... 6
     Table 2          The classification of intangible assets: an input (flow) and output (stock) perspective ......... 9
     Table 3          The importance of intangible assets as a source of growth: summary of growth
                      accounting exercises ............................................................................................................ 12

     Figures
     Figure 1         Growth performance indicator for New Zealand ................................................................... 1
     Figure 2         Average productivity growth against the initial level, 2001-2011 ......................................... 2
     Figure 3         Observed gap in GDP/capita versus the gap predicted from structural policies, 2009 ....... 2
     Figure 4         The gap in non-residential investment rate and human capital stock ................................... 4
     Figure 5         Country fixed effect and residual from Solow regression ...................................................... 5
     Figure 6         Investments in physical and intangible assets as percentage of business sector value-
                      added, 2010 ........................................................................................................................... 8
     Figure 7         R&D as percentage of GDP by sector, 2011 ........................................................................ 13
     Figure 8         Country fixed effects from base Solow regression regressed against average R&D
                      intensity................................................................................................................................. 15
     Figure 9         Relative productivity from Solow model incorporating R&D ............................................... 15
     Figure 10        Financial support for private R&D investment ..................................................................... 17
     Figure 11        Patents and trademarks ........................................................................................................ 18
     Figure 12        The gap in ICT investment rates (New Zealand compared to selected countries) ............. 19
     Figure 13        Average management quality score in the manufacturing sector; selected countries ....... 20
     Figure 14        The distribution of managerial practices across firms: New Zealand versus the United
                      States .................................................................................................................................... 21
     Figure 15        Additional capital attracted by a firm that increases its patent stock by 10%..................... 22
     Figure 16        Country size and trade intensity ........................................................................................... 25
     Figure 17        Indices of access to markets and suppliers, 2010 ................................................................ 25
An International Perspective on the New Zealand Productivity Paradox v
Figure 18 Relative productivity from Solow model incorporating Market and Supplier Access
(MASA) and R&D .................................................................................................................. 26
Figure 19 Participation in global value chains (through backward and forward linkage) .................... 28
Figure 20 Market and supplier access and GVC participation, 2009 ................................................... 28
Figure 21 New Zealand’s participation in GVCs by industries, 2009 ................................................... 29
Figure 22 Service value-added as a share of gross exports ................................................................. 30
Figure 23 Barriers to international trade............................................................................................... 31
Figure 24 The gap between actual export share and share predicted from gravity model
estimates ............................................................................................................................... 32
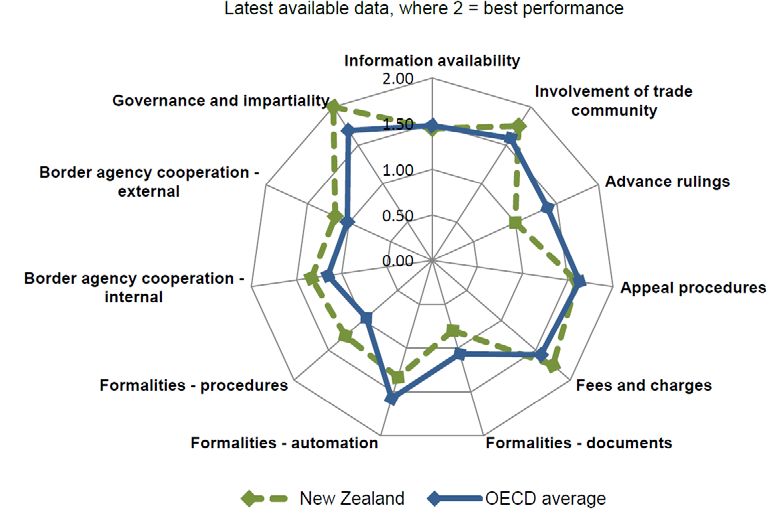
Figure 25 New Zealand’s trade facilitation performance: OECD indicators ........................................ 33An International Perspective on the New Zealand Productivity Paradox 1
1 Introduction
1.1 The nature and magnitude of the productivity paradox
Over the past two decades, New Zealand has seen its income gap vis-à-vis the most advanced
economies hovering around 30%, with no clear sign of narrowing (Figure 1). The absence of catching
up in overall living standards can be viewed as disappointing considering that over the same period,
the country has further improved its relative labour market performance, with rates of employment and
hours worked (relative to working-age population) exceeding the average of leading economies by a
margin of 10%. The flip side of the coin has been a slow but steady widening of the gap in labour
productivity. And this has resulted not so much from strong growth elsewhere, but from relatively weak
productivity growth in New Zealand.
In fact, looking at the decade of the 2000s, New Zealand has had one of the lowest growth rates in
GDP per hour worked among OECD countries, despite trailing the OECD average at the start of the
decade by around 15%, and the United States by nearly 40% (Figure 2). Closing 10% of the latter gap
over the span of a decade would require annual productivity growth to exceed the US rate by at least
half a percentage point on average. Instead, productivity growth has been on average almost one
percentage point weaker. Considering that lagging countries have in principle greater scope for
growing faster than most advanced economies, this performance is indeed puzzling.
Evidently, convergence is highly conditional on a host of factors, not least of which are policies and
institutions, which have a strong influence on investment in different and complementary types of
capital. Assessing the contribution of these factors to productivity can help to shed some light on the
significance of the puzzle. At first glance though, past reforms of product and labour markets in New
Zealand would suggest that the country is in a rather favourable position in terms of broad policy
settings that are supportive to private investment, job creation, employment and productivity growth.
Indeed, putting together the results from various empirical analyses that assessed the impact of
policies in different areas (taxation, product and labour market regulation, innovation and education)
on employment, investment, productivity and hence GDP per capita, one OECD study has provided
rough estimates of the extent to which differences in living standards across countries can be
attributed to differences in broad policy settings (Barnes et al., 2011). The highly stylised nature of the
exercise notwithstanding, the results do provide a good illustration of the puzzle. Given its generally
favourable policy settings, GDP per capita in New Zealand should be 20% above OECD average
rather than 20% or so below, making the country a clear outlier in this respect (Figure 3).
Figure 1 Growth performance indicator for New Zealand: Gap below a benchmark of 16 OECD
countries, 1970-2010
0
-5
-10
-15
-20
-25
-30
-35
-40
-45
-50
GDP per capita GDP per hour worked GDI per capita
Source: OECD Productivity Statistics.2 An International Perspective on the New Zealand Productivity Paradox
Figure 2 Average productivity growth against the initial level, 2001-2011
11
OECD average
Average of growth rates, 2001-11 10 CHN
9
8 IND
7
6
TUR KOR
5 IDN
RUS SVK
4 EST
POL IRL
CZE SWE
3 ZAF SVN AUT
BRA HUN CHE USA
ISL GBR AUS NOR
2 CHL
PRT JPN ISR
OECD average FIN
DNK
NLD
1
MEX GRC NZL EU ESP
CAN ITA
DEU FRA BEL LUX
0
0 2.5 5 7.5 10 12.5 15 17.5 20 22.5 25 27.5 30 32.5 35 37.5 40 42.5 45 47.5 50 52.5 55
Level, US dollars, 2001
Source: OECD National Accounts Statistics; OECD Economic Outlook Database; OECD Employment Outlook Database.
Figure 3 Observed gap in GDP/capita versus the gap predicted from structural policies, 2009
40
USA
30
Observed GDP per capita gap vis-a-vis OECD average (%)
20
NOR
CHE
IRL NLD AUS
10 AUT CAN
ISL
BEL SWE
0
DNK GBR
FRA
DEU
FIN
-10
JPN
GRC ITA
-20 ESP
NZL
KOR
-30
PRT
-40
-40 -30 -20 -10 0 10 20 30 40
GDP per capita gap vis-a-vis OECD average predicted from institutional settings (%)
Source: Barnes et al. (2011).
Notes:
1. The predicted GDP per capita gap is computed on the basis of estimated impact of various structural policies (ex: product market
regulation, labour protection legislation) from past OECD studies.
1.2 Roadmap
Following a top-down strategy, the rest of the paper explores possible explanations for the apparent
productivity paradox. Using a simple augmented-Solow framework, the next section first provides an
assessment of the extent to which both the level and time evolution of the gap in GDP per capita and
productivity vis-à-vis advanced OECD countries can be accounted for by investment in physical and
human capital. Section 3 considers the contribution of an important factor missing from the Solow
framework, namely investment in knowledge-based capital. After exposing how the defining
characteristics of knowledge-based assets create both opportunities and challenges for growth, the
section assesses the role of R&D and information and communication technology (ICT) investment as
well as resource reallocation both within and across firms as potential explanations for the paradox.
Using different measures of international trade intensity, section 4 examines the impact of geographic
distance and global interconnectedness on the productivity gap. Conclusions follow.An International Perspective on the New Zealand Productivity Paradox 3
2 The direct contribution of physical and
human capital
A first step in uncovering the sources of the productivity paradox consists of looking at the profile of
investment in physical and human capital, since both are proximate determinants of measured labour
productivity. A look at the evolution of physical capital investment (as a share of GDP) and average
years of schooling against a selection of English-speaking and Nordic countries shows that neither
factor can account for the widening gap in New Zealand’s labour productivity (Figure 4). 1 The
difference in investment rates vis-à-vis these countries shows no clear trend after 1990 (Panel A). If
anything the physical investment rate has risen somewhat more rapidly in New Zealand during the
2000s, except against Australia, where the significant gap has been maintained, and Canada. As for
human capital, New Zealand has generally been catching up in terms of average years of schooling, at
least vis-à-vis these countries (Panel B).
To shed further light on the contribution of these factors, a simple augmented-Solow model has been
used as a framework to provide estimates of country fixed effects, once the contribution of different
growth determinants is taken into account. The model is based on a simple production function with
constant-returns-to-scale technology (see Box 1). The augmented version includes human capital in
addition to physical capital, labour and technology as the fundamental determinants (Mankiw, Romer
and Weil, 1992). It has been estimated for a panel of 20 OECD countries over the period 1980-2010.
Consistent with earlier findings, the results reported in Table 1 (column 1) show that both human
capital and physical capital are found to have a significant impact on GDP per capita in the long run.
The respective contributions from these two types of capital and country fixed effects to deviations in
GDP per capita from the average of 20 OECD countries appear on Figure 5 Panel A. It shows that New
Zealand is slightly above average on both factor inputs, leaving the gap in GDP per capita to be
entirely reflected in fixed effects (the second largest after Portugal).
The sum of the fixed effects and the residuals from the regression provide a time profile of the gap in
what can be loosely interpreted as multi-factor productivity (MFP). The results reported in Figure 5
Panel B also show that although there is no strong downward trend after 1990, New Zealand has
nonetheless been losing ground vis-à-vis countries such as Australia, Sweden and, to a lesser extent,
the United States. It could be argued that the deep and comprehensive set of reforms implemented in
the early 1980s helped to stem the relative productivity decline but have not been sufficient to allow
New Zealand to catch up.
It should be borne in mind that the Solow framework is derived under the assumption of equilibrium
employment and hence that variations in the intensity of labour utilisation are not explicitly taken into
account. As mentioned above, New Zealand has done relatively well in terms of labour resource
utilisation relative to other OECD countries and this has a number of implications for the results shown
in Figure 5. One is that insofar as the empirical relationship is expressed in terms of GDP per capita,
failing to take into account the more rapid increase in employment rates in New Zealand relative to
other countries means that both labour productivity and MFP are over-estimated in this framework. In
other words, differences in the rate of labour utilisation relative to other countries is reflected in the
residuals (including fixed effects) from the regression and hence in what is loosely interpreted as MFP
on the figure.
1
The investment series is gross fixed capital formation, which includes both private and public investment.4 An International Perspective on the New Zealand Productivity Paradox
Figure 4 The gap in non-residential investment rate and human capital stock
Panel A: Gross fixed capital formation as percentage of GDP (New Zealand minus selected countries)
10.0
8.0
6.0
4.0
2.0
Percentage points
0.0
-2.0
-4.0
-6.0
-8.0
-10.0
-12.0
AUS CAN DNK SWE USA
Source: OECD Economic Outlook Database.
Panel B: Human capital (log of average years of schooling; New Zealand minus selected countries)
10%
5%
0%
-5%
-10%
-15%
-20%
1980
1981
1982
1983
1984
1985
1986
1987
1988
1989
1990
1991
1992
1993
1994
1995
1996
1997
1998
1999
2000
2001
2002
2003
2004
2005
2006
2007
2008
2009
2010
AUS CAN DNK SWE USA
Source: Barnes et al. (2011).An International Perspective on the New Zealand Productivity Paradox 5
Figure 5 Country fixed effect and residual from Solow regression
Panel A. Contribution of each factor to the average gap in per capita GDP, 2000-2010
40%
Average deviation of per capita GDP from the mean of 20 OECD
31%
30%
21%
20%
11%
12%
8%
10% 6%
4% 2%
5%
3%
2%
0%
countries
d
-1%
-3%
-10% -8% -4%
-4% -8%
-20%
-17%
-25%
-30%
-40%
-33%
-50%
USA CHE IRL NLD CAN NOR AUT AUS DNK GBR SWE BEL DEU FIN FRA JPN ITA ESP NZL PRT
Physical capital Human capital Country fixed effect Actual GDP per capita Predicted GDP capita
Source: Authors’ calculation.
Notes:
1. This figure shows the contribution of each explanatory variable to GDP per capita based on the column 1 of Table 1.That chart
reads as following: on average during 2000-2010, New Zealand had a GDP per capita that was 26% below the average of 20
OECD countries. These 26% is broken down according to the contribution by country fixed effect (-25% points), physical capital
(0.9% points) and human capital (1.3% points) and residual. The bold numbers correspond to contribution by country fixed effects.
Figure for Norway corresponds to the mainland.
Panel B. Relative productivity vis-à-vis 20 advanced OECD countries (Country fixed effects and
residuals from Solow regression)
0.4
Country fixed effect + residual from base Solow model (log)
0.3
0.2
0.1
0
-0.1
-0.2
-0.3
-0.4
AUS CAN DNK NZL SWE USA
Source: Authors’ calculation
Notes:
1. This figure displays for each country the sum of its estimated fixed effect and residuals obtained from the Solow regression on the
sample of 20 advanced OECD countries. Because the country fixed effects are demeaned and the residuals add up to zero across
the sample, the measure can be loosely interpreted as the relative productivity (MFP) level vis-à-vis the average of the 20 OECD
countries.6 An International Perspective on the New Zealand Productivity Paradox
Accounting for relatively strong employment growth would imply that the downward trend in New
Zealand’s true MFP gap is actually more pronounced than shown on Figure 5, especially after 1990.
On the other hand, a second implication concerns the quality aspect of the labour force. One of the
characteristics of the relatively good labour market performance of New Zealand is the good
integration of low-skilled employees in the workforce. In many countries, especially in Europe, the
relatively high measured level of productivity reflects to some extent the low participation of low-
skilled workers. According to previous OECD estimates, around 3% of the New Zealand productivity
gap vis-à-vis OECD countries during the mid-2000s can be attributed to differences in the labour force
composition and the higher share of low-skilled workers (Boulhol and Turner, 2009). Controlling for this
factor would slightly narrow the MFP gap in relation to other countries.
Table 1 Estimation results from the augmented-Solow model
Dependent Base With R&D With R&D With R&D With
variable: log of and trade and market agglomeration
(1) (2)
per capita access (4)
(3)
GDP
Physical capital 0.1951*** 0.2004*** 0.1997*** 0.1895*** 0.2261***
(0.0173) (0.0184) (0.0184) (0.0202) (0.0170)
Human capital 0.2304*** 0.1857*** 0.2031*** 0.1932*** 0.3148***
(0.0658) (0.0680) (0.0657) (0.0660) (0.0666)
Population growth 0.0131 0.0193 0.0228 0.0186 0.0241
(0.0193) (0.0212) (0.0206) (0.0229) (0.0201)
R&D intensity 0.0234*** 0.0211*** 0.0204**
(0.0084) (0.0081) (0.0084)
Trade intensity 0.0350**
(0.0169)
Index of market 0.0848***
and supplier
(0.0157)
access
Interaction of 0.2972***
human capital
(0.0698)
with measures of
agglomeration
R Squared 0.9994 0.9995 0.9995 0.9995 0.9995
Number of 599 561 561 546 511
observations
Source: Authors’ estimations.
Notes:
1. All specifications include country and year fixed effects. *** and ** each refers to statistical significance at 1% and 5% level. The
most complete sample covers 20 countries over the period 1981 to 2010.An International Perspective on the New Zealand Productivity Paradox 7
Box 1 The empirical approach based on the augmented-Solow model
The Solow (1956) model has been widely used as a theoretical framework to explain differences
across countries in income levels and growth patterns. The model is based on a simple
production function with constant-returns-to-scale technology. In the augmented version of the
model (Mankiw, Romer and Weil, 1992), output is a function of human and physical capital, as
well as labour (working-age population) and the level of technology. Under a number of
assumptions about the evolution of factors of production over time, the model can be solved for
its long-run (steady-state) equilibrium, whereby the path of output per capita is determined by the
rates of investment in physical and human capital, the level of technology, and the growth rate of
population. In the steady-state, the growth of GDP per capita is driven solely by technology,
which is assumed to grow at a (constant) rate set exogenously in the basic model.
For the purpose of this study, the model is first re-estimated with only the basic determinants
included in the specification, i.e. proxies for investment in physical and human capital, population
growth and technical progress. Then, a number of determinants are added to the benchmark
specification throughout the rest of the paper, but the set of additional variables is limited to
those related to issues directly addressed in the paper. The reason for leaving other potential
variables out is essentially one of parsimony, i.e. to limit the number of specifications, which
quickly runs up as each additional determinant is considered. However, this implies that
potentially significant control variables are not included, with the risk that this entails in terms of
biases and robustness of the results as regards the determinants of economic geography. In order
to minimise those risks, all specifications include various combinations of country and year fixed
effects and/or linear time trends, all of which are introduced in part to capture omitted variables.
The empirical version of the augmented-Solow model is re-estimated over a panel data set
comprising 20 OECD countries and 30 years of observations (1981-2010). In what will serve as the
reference model for the rest of the paper, the level of GDP per capita in country i and year t ( yi t )
is regressed on the rate of investment in the total economy ( s K ,i t ), the average number of years
of schooling of the population aged 25-64, which is used as a proxy for the stock of human
capital ( hci t ) and the growth rate of population ( ni t ) augmented by a constant factor introduced
as a proxy for the sum of the trend growth rate of technology and the rate of capital depreciation
( g + d ), with all variables expressed in logs. In principle, a measure of investment in human capital
should be used to be consistent with the treatment of physical capital in the basic Solow model.
In practice, a proxy for the stock – average number of years of schooling – is used due to the
absence of an adequate measure of the flow. However, to ensure consistency with the theoretical
model, the measure of stock is introduced both in level and first-difference forms, even in the
“level” specification.
The results presented in this paper are based on both a level specification, using a least-square
estimator (that corrects for heteroskedasticity and contemporaneous correlations). Due to
persistence in the series, control for first-order serial correlation is systematically made when the
level specification is estimated. The functional form of the equation is specified as follows:
Log yit = α .Log sK ,it + β .Log hcit + ϕ .∆Log hcit + γ .Log (nit + g + d ) + ei + et + uit
uit = ρ .uit −1 + ε it , ε it i.i.d .
where ei and et are country and year fixed effects, respectively. The parameters α , β , γ are the
long-run parameters on the three basic determinants. The parameter ρ is the first-order
autocorrelation coefficient used in the level specification.8 An International Perspective on the New Zealand Productivity Paradox
3 The role of knowledge-based capital
and its growing importance as a
source of productivity
An important factor missing from the basic augmented-Solow framework that could account for the
productivity gap is investment in knowledge-based capital (also known as intangible assets).
Knowledge-based capital (KBC) encompasses a whole range of assets (or activities aimed at creating
such assets) including branding, database development, product design, inter-firm networks, R&D,
organisational know-how, etc. Consistent with the approach originally proposed by Corrado, Hulten,
and Sichel (2009), these assets are classified under three broad categories: computerised information;
innovative property; and economic competencies. For each type of asset included in these categories,
a distinction can be made between the effort or input flow that goes into the creation of the asset and
the nature of the value or capital stock generated (Table 2), though the one-for-one correspondence
between a specific type of investment and the resulting capital stock is sometimes less obvious than
suggested 2.
Estimates of aggregate investment in intangible assets (based on their cost of production or input
flows) have been generated for several countries, on the basis of the expenditure categories listed in
Table 2 and the methodology proposed in Corrado et al. (2005)3. While the results show noticeable
variations across countries (Figure 6), most have become progressively more intensive in the use of
intangible assets.
Figure 6 Investments in physical and intangible assets as percentage of business sector value-
added, 2010
35
30
25
20
15
%
10
5
0
Brand equity, firm-specific human capital, organisational capital
R&D and other intellectual property products
Software and databases
Non-residential physical assets
Source: OECD (2013b).
Notes:
1. The growth contribution from KBC comes from specific characteristics.
2
For instance, investment in software can arguably contribute to the build-up of capital across most types of assets. Likewise, spending on R&D generates
new ideas that can be codified and take the form of knowledge capital, but it also contributes to the development of skills embodied in human capital
through learning by doing effects. In some ways, these can be viewed as internal spillovers.
3
These estimates have been produced by various institutions (e.g. the OECD in the late 1990s and more recently the European Commission through the
sponsoring of programmes such as Innodrive and Coinvest) and researchers from academia or public institutes.An International Perspective on the New Zealand Productivity Paradox 9
Table 2 The classification of intangible assets: an input (flow) and output (stock) perspective
Spending in the form of (input): Creates value in the form of (output):
Computerised information
Computer software In-house development or acquisition of Better management of information and
software knowledge, improved process efficiency
R&D in software industry and outlays on New software applications (copyrights)
software purchases
Computerised In-house development or acquisition of Better informed or data-driven decision
database database making
Included in outlays on software Database with significant market value
Innovative property
Mineral exploration Early-stage exploration of natural resources Knowledge about underlying geology of
specific areas
R&D spending in mining industry
Rights on future exploitation of mineral
reserves
Scientific R&D Science and engineering research Knowledge leading to new or higher-quality
products and production processes
In-house or outsourced R&D in manufacturing
and selected industries Patents, licences and industrial secrets
Creative property Development of entertainment or artistic Artistic and cultural creations
originals
Copyrights and licences
Non-scientific R&D: Development costs in
entertainment and book publishing industries
Design Physical appearance, quality and ease of use of Better commercial appeal, product
product and on workspace layout differentiation, improved planning and
problem solving
Outsourced architectural and engineering
designs and R&D spending in social science Design rights, blueprints
and humanities
Economic competencies
Brand equity Spending on advertising and market research Better-valued product, better market
potential; good reputation and customer
Outsourced advertising market research
relationship
services
Trademarks, customer base, internet domain
names
Firm-specific human On-site worker training, tuition payments for Increased overall skills level, more productive
capital job-related education workforce
Direct and wage costs of employee time in
training, vocational training surveys
Organisational Organisational changes Improved business practices, better
structure management of internal knowledge; inter-firm
Outsourced management consulting services
networks
and company formation expenses
Business model blueprints
Source: Andrews and de Serres (2012).10 An International Perspective on the New Zealand Productivity Paradox
3.1 The growth contribution from KBC comes from specific
characteristics
Different classes of intangible assets share a number of features that distinguish them from other forms
of productive capital (see Box 2). Taken together, the characteristics applying more broadly to assets
comprised in computerised information and innovative property have implications for the way these
intangibles influence economic growth as well as for the specific role that policies can play in some
cases in order to facilitate such influence. They also help explain why assessing their contribution to
GDP levels and growth rates is a more difficult exercise than in the case of tangible assets. In
particular:
The data requirements for conducting a growth accounting exercise are somewhat more
demanding than for simply looking at investment shares, since series on capital stocks are needed.
And building capital stock series out of investment/spending flow data is generally more
challenging in the case of intangible assets.
In addition, direct benefits to consumers from services that are highly intensive in intangible assets
are often not recorded in value-added. Measuring value-added for business services has always
been more challenging, not least in financial services.
The growing importance of internet-based services magnifies these difficulties given that many
benefits involve non-market transactions and therefore go unrecorded (Brynjolfsson and Saunders,
2010). 4
These caveats notwithstanding, studies that have looked at growth decomposition have found that
accounting for (previously unrecorded) intangible assets generally results in a modest upward revision
in measured labour productivity growth and, more importantly, in a stronger contribution of KBC
deepening to overall growth, at the expense of both the MFP contribution and, to a lesser extent, of
physical capital deepening (van Ark et al., 2009; Jona-Lasinio, Iommi and Manzocchi, 2011) and Table
3.
Box 2 Defining features of intangible assets
Different classes of intangible assets share a number of features that distinguish them from other
forms of productive capital, the most common being:
Lack of visibility: By definition, intangible assets do not have physical embodiment, which
complicates the task of assessing the stock of a specific intangible capital based on past
investment flows. For instance, depreciation rates are even harder to measure than in the case
of tangibles and optimising the use of intangible capital capacity is not straightforward, not
least owing to their virtual nature.
Non-rivalry: Many intangible assets can be used simultaneously by multiple users without
engendering scarcity or diminishing their basic usefulness, such as in the case of software or
new product designs. Because producing the original design of a product can involve years of
research and experimentation, non-rivalry leads in most cases to high sunk costs and low
marginal cost of production. The former in turn implies increasing returns to scale (i.e. supply-
side economies of scale), but also the need for firms to price above marginal cost so that they
can recoup their initial investment costs.
Non-tradability: Intangible assets used by firms are often generated internally and while some
of them – e.g. software and patents – can eventually be traded on organised markets, many
4
For example, the measured output of the search possibilities provided by Google or Yahoo only correspond to the advertising sales, which most likely
under-estimate the value of the service. According to some estimates, Americans spend on average 10% of their leisure time on the Internet, while the
share of consumption spent on internet access amounts to 0.2% (Golsbee and Klenow, 2006).An International Perspective on the New Zealand Productivity Paradox 11
remain inherently non-marketable, due in part to the difficulty and cost of writing “complete
contracts” covering all the possible outcomes. Non-tradability entails the lack of verifiability,
particularly from sources external to the firm that invests in intangibles.
Partial-only excludability: In part due to their virtual nature, the property rights of many
intangible assets cannot be as clearly defined and well enforced as is the case with tangibles.
Insofar as they cannot preclude others from partly enjoying the benefits of these assets,
owners do not have full control and may fail to fully appropriate the returns on their
investment.
Non-separability: Conversely, intangible assets have in some cases a full value that is firm-
specific. Therefore, such assets cannot be separated from the original unit of creation without
some loss of value (Jensen and Webster, 2006). One way to think of it is the value that an
asset might have in case of bankruptcy procedures.
Knowledge transferability: The conditions under which knowledge can be transferred across
firms depend in part on whether it is tacit or codified. To be transferable, tacit knowledge
requires some form of embodiment, such as human capital.
The extent to which these characteristics apply to various assets differs across them, as
qualitatively reported in the Table below:
Rivalry Tradable Excludability Separability Knowledge
(market - transferability
based
transaction)
Computerised information
Computer Fully non- Not for own- Partial only Separable High (codified)
software rival account (code-access
software protected)
Computerised Fully non- Not for Partial only Separable High (codified)
database rival internally-
generated data
Innovative property
Scientific R&D Fully non- Outsourced Partial only Separable High for patents /
rival R&D services low for secrets
and patents
Creative Fully non- Outsourced Partial only Separable High (codified)
property rival R&D services
and copyrights
Design Fully non- Outsourced Low for visible Separable High (codified)
rival design services products/High
and IPR forms for workspace
Economic competencies
Brand equity Largely rival Outsourced High/firm- Partly separable Via transfer of
marketing specific firm ownership
services
Firm-specific Largely rival Outsourced High/firm- Non-separable Via human capital
human capital training specific mobility
Organisational Largely non- Outsourced Partial only Non-separable Moderate/aspects
structure rival consulting difficult to codify
services12 An International Perspective on the New Zealand Productivity Paradox
Table 3 The importance of intangible assets as a source of growth: summary of growth
accounting exercises
Country Time Increase in Percent of LP Decrease in
period GDP growth growth percent
Study from adding accounted contribution of
intangibles for by MFP to LP
intangibles growth from
adding
intangibles
Baldwin, G & Canada 1976-2000 0.20 p.p. ------ Little impact
Macdonald (2011)
Corrado, Hulten & United States 1973-1995 0.27 p.p. 26% From 35% to 25%
Sichel (2006)
1995-2003 0.31 p.p. 27% From 51% to 35%
Marrano, Haskel & United 1979-1995 0.31 p.p. 15% From 31% to 25%
Wallis (2009) Kingdom
1995-2003 0.34 p.p. 20% From 22% to 16%
Fukao et al. (2009) Japan 1985-1995 0.10 p.p. 26% From 27% to 14%
1995-2005 0.11 p.p. 21% From 38% to 36%
Jalava, Aulin- Finland 1995-2000 0.48 p.p. 16% From 112% to 95%
Ahmavaara &
2000-2005 0.05 p.p. 30% From 59% to 42%
Alanen (2007)
Corrado, Hulten & United States 1995-2006 0.21 p.p. 28% From 64% to 45%
Sichel (2009)
Corrado, Hulten & United 1995-2006 0.16 p.p. 23% From 53% to 40%
Sichel (2009) Kingdom
Corrado, Hulten & Germany 1995-2006 0.18 p.p. 21% From 61% to 49%
Sichel (2009)
Corrado, Hulten & France 1995-2006 0.17 p.p. 24% From 48% to 35%
Sichel (2009)
Source: Authors’ calculations based on quoted studies and Roth and Thum (2010).
Notes:
1. LP stands for labour productivity, and p.p. for percentage points.
Two properties of intangible assets – non-rivalry and partial-only excludability – have particularly
strong implications for growth. The non-rivalrous nature of knowledge means that the initial cost
incurred in developing new ideas – typically through R&D – does not get re-incurred as the latter are
used by more and more people. This is what gives rise to increasing returns to scale – the important
property that makes ideas/knowledge an engine of growth (Jones, 2005) 5. The presence of knowledge
spillovers allowed by partial-only excludability is not a necessary condition for increasing returns, but it
does contribute to raising the wedge between the growth rate of knowledge (and hence of GDP per
capita) on the one hand, and growth in population and the workforce on the other. This is because the
more broadly new knowledge gets diffused, the more it contributes to the development of new ideas
and discoveries (the so-called “standing on the shoulders of giants” effect).
5
Since the framework developed in Jones (2005) allows for decreasing returns to R&D inputs, the growth rate of GDP per capita in the long run is
ultimately tied to population growth (as the latter determines the expansion in the number of researchers) and cannot be influenced merely through the
intensity of innovation efforts (hence the semi-endogenous nature of this mechanism). Population growth in itself contributes negatively to GDP per capita
as the per capita availability of rival goods diminishes, but this effect is more than offset by the growing stock of available ideas (Jones and Romer, 2010).An International Perspective on the New Zealand Productivity Paradox 13
3.2 Investment in KBC appears to be relatively low in New
Zealand, particularly spending on R&D
While comprehensive and comparable series on intangible assets have yet to be produced for New
Zealand – at least to our knowledge – partial information suggests that the country ranks reasonably
well in software investment and trademark, but much more poorly in R&D intensity and, to a lesser
extent, patents. As shown on Figure 7, New Zealand has one of the lowest (public and private) R&D
intensity among advanced OECD countries, slightly behind Southern European countries and a good
distance from Australia, Canada and Denmark. Furthermore, the share of total R&D performed in the
private sector is also among the lowest across OECD countries, implying an even lower ranking in
business R&D intensity. Such low investment may to some extent reflect the absence or small share of
traditional R&D-intensive industries (in particular pharmaceuticals, IT equipment, medical, precision
and optical equipment, as well as motor vehicles and other transport equipment). R&D intensity rarely
exceeds 0.5% of value-added in sectors such as agriculture and mining, and is typically even lower in
services sectors. Even so, the structural bias is unlikely to fully account for such a low ranking.
Figure 7 R&D as percentage of GDP by sector, 2011
4
3.5
3
2.5
2 NZL
1.5
1
0.5
0
FIN JPN SWE DNK DEU AUT USA FRA BEL AUS NLD CAN GBR IRL NOR PRT ESP NZL ITA
Business sector Government Higher education Other
Source: OECD Main Science and Technology Indicators.
Notes:
1. Australia’s value for government and higher education R&D is that of 2010.
How much of the gap in productivity and income per capita can be explained by the under-investment
in R&D is difficult to assess with any degree of confidence. On the one hand, studies focusing in
particular on R&D spending provide ample empirical evidence of the strength of increasing returns
and knowledge spillover mechanisms associated with ideas (see Hall, Mairesse and Mohnen (2010) for
a comprehensive review of the empirical literature and Andrews and de Serres (2012) for a summary).
The evidence for developed economies over the past several decades points to positive and
strong effects of R&D investment on productivity, with (private) rates of return often found to be in
the range of 20-30%, which is higher than those generally estimated for physical capital. There is
also evidence that R&D investment matters not only for state-of-the-art or frontier innovation but as
well for facilitating technological catching up through absorptive capacity (Griffith, Redding and
Van Reenen, 2004).14 An International Perspective on the New Zealand Productivity Paradox
Finding evidence of spillovers is more challenging than identifying direct R&D effects, not least
because knowledge flows across firms can in many cases be fully paid for and therefore do not
necessarily correspond to pure spillovers6. Even so, the notion that knowledge spillovers contribute
to productivity growth is also receiving growing empirical support. Studies that have tested for
spillover effects have generally found them to be large, though often the magnitude of the impact
is sensitive to estimation methods and samples.
At the same time, the empirical evidence also underscores that the efficiency of R&D investment and
return on patenting at the economy-wide level depends on a wide range of factors, the contribution of
which cannot be easily disentangled.
One recent study looked at the impact of R&D and patents on MFP levels over time using
aggregate data across 19 OECD countries and finds that both patent and R&D stocks make a
significant contribution to long-term productivity (Westmore, 2013). In the case of patents, the
effect on MFP is magnified by the share of business enterprise researchers in total employment,
which points to the importance of having absorptive capacity to exploit knowledge spillovers.
The results also provide evidence that the returns to patenting – in particular through follow-on
innovation – could be diminished by regulations that inhibit firm entry and competition. Consistent
with earlier findings (Conway et al., 2006), it finds that the knowledge diffusion process – captured
by the speed at which lagging countries close the MFP gap vis-à-vis the leading country – is
fostered by lower regulatory barriers to competition and greater openness to trade.
3.2.1 The under-investment in R&D can account for some portion of the gap
In order to provide rough estimates of how much of New Zealand’s productivity paradox could be
blamed on the R&D gap, the latter variable has been added as a determinant in the basic augmented-
Solow specification. The results shown in Table 1 (column 2) point to a statistically significant – albeit
economically modest – impact on GDP per capita in the long run. This conforms to general findings
from empirical analysis showing that overall the estimated returns to R&D tend to be lower (and more
fragile) when the main source of identification is variation in the time rather than the cross-section
dimension (Hall, Mairesse and Mohnen, 2010). Furthermore, adding R&D intensity to the set of
determinants leads to a reduction in the size of the coefficient on human capital, pointing to some
degree of collinearity between the two variables. As a result, the inclusion of R&D intensity does help
to reduce the productivity gap, but only by a small margin, despite New Zealand being well below
OECD average in this area.
The difficulty in finding a substantial and robustly significant effect of R&D on GDP per capita in the
time-series (or within country) dimension can be partly explained by the fact that on the basis of our
sample, over 90% of the explanatory power of R&D intensity is captured by country- and time-fixed
effects. As an alternative, a simple cross-section regression linking the fixed effects obtained from the
basic specification to R&D intensity (Figure 8) yields an estimated impact of the latter that is
substantially larger than reported in Table 1. Taking this result at face value, the deviation from the
OECD average in R&D could account for up to 11 percentage points of the 26 percentage point gap
in GDP per capita (Figure 9). However, considering that the R&D gap vis-à-vis other countries has
been, on average, relatively stable over time, it cannot really explain the relative deterioration in
productivity.
6
Since the contribution of Griliches (1979), a distinction has been made in the literature between rent spillovers and pure knowledge spillovers. The
former arises from the fact that quality improvements embedded in new products is less than fully reflected in higher prices (as is the case for instance
with personal computers), thereby directly benefiting firms that use such products as intermediate inputs. Pure knowledge spillovers are those related to
the partial excludability of ideas generated through R&D.An International Perspective on the New Zealand Productivity Paradox 15
Figure 8 Country fixed effects from base Solow regression regressed against average R&D
intensity
0.4
USA
0.3
Country fixed effect from base Solow model (in log)
CHE
0.2
Slope coefficient : 0.1345
t statistics: 2.816 CAN NLD
0.1 NOR
AUT DNK SWE
IRL DEU
BEL
0
ITA AUS FRA FIN JPN
GBR
-0.1
ESP
-0.2 NZL
-0.3 PRT
-0.4
0 0.5 1 1.5 2 2.5
R&D expenditure over GDP (percentage, average over 1980-2010)
Source: Authors’ calculations.
Figure 9 Relative productivity from Solow model incorporating R&D
0.4
Country fixed effect and residuals from various Solow models (log)
0.3
0.2
0.1
0
-0.1
-0.2 Up to 11 percentage points
explained by R&D
-0.3
-0.4
NZL base Solow NZL R&D included NZL MRW+R&D in FE
AUS base Solow AUS R&D included AUS MRW+R&D in FE
USA base Solow USA R&D included USA MRW+R&D in FE
Source: Authors’ calculations.16 An International Perspective on the New Zealand Productivity Paradox
3.2.2 Innovation policies can only go so far in explaining low R&D investment
The next question is how much of the R&D gap can be attributed to innovation-specific policy settings.
The properties of intangible assets that give rise to increasing returns and knowledge spillovers also
imply that private incentives (returns) to such assets are below socially desirable levels. The range of
public policies put in place to correct these market failures include IPR protection, public support for
private R&D (either through grants or tax credits), the funding of public research institutions and
measures to strengthen linkages with the private sector. These policies should be considered more as
complements than as substitutes. For instance, some degree of IPR protection is required to raise
appropriability of returns, whereas public support for private investment is needed to compensate for
the fact that when firms invest in innovation, they fail to take into account the positive contribution
they make to other firms’ stock of knowledge.
Both grants and R&D tax credits have been found to have a statistically significant impact in a
recent empirical analysis using data across countries and over time (Westmore, 2013). Still, the
estimates point to a relatively modest average impact of these incentives over time, especially in
the case of tax credits, and their effectiveness is undermined by frequent policy changes or
reversals. The same study finds a significant impact of IPR regime on patents but not on R&D
intensity.
Another recent study looking at the impact of policies on MFP growth at the firm level has found
that firms in sectors with high R&D intensity tend to grow faster in countries with higher public
spending on basic research, more R&D performed by universities and greater collaboration
between industry and universities (Andrews, 2013). This underscores the importance of
complementarity in the research efforts undertaken by various institutions and agencies.
Overall, the scope for innovation policies to account for New Zealand’s R&D gap is likely to be limited.
First, New Zealand already compares favourably to other countries in areas of policies which have
been found to have a significant influence on patents, such as the IPR regime and public research. This
may partly explain why New Zealand ranks relatively better on patents than R&D spending. Second,
data on public support for private R&D indicate wide variation across countries (Figure 10), with New
Zealand ranking relatively low. In part, this reflects the absence of a R&D tax credit, although New
Zealand is far from being alone in this respect. A number of countries with high R&D intensity do not
offer tax incentives (e.g. Finland, Germany and Sweden). Financial support in the form of direct grants
is substantial, but again well below the OECD average. In fact, few countries rank as low on both direct
and indirect support.
It is difficult to assess the extent to which policy settings are contributing to the R&D gap. New
Zealand is likely to be suffering from a lower return on R&D than other OECD countries due to its
adverse access to large foreign markets (Crawford et al., 2007). Lack of tax incentives may reinforce
such geographical disadvantage in suppressing intensive R&D, especially by the globalised firms that
can choose where their innovation activities take place internationally. On the other hand, considering
that New Zealand has the highest share of R&D performed by small firms across the OECD, 7 its
institutions do not seem overall unfavourable to innovation activities by firms. Furthermore, even if
New Zealand were to increase its direct support to the OECD average, it would only close a small
fraction of its R&D gap, based on the estimates from Westmore (2013). 8 Finally, New Zealand is
already close to the OECD average in terms of higher education expenditure on R&D and among the
top countries as regards business-funded R&D in the higher education and government sectors, a
measure of science-industry linkages.
7
The share of firms with fewer than 50 employees in New Zealand’s business R&D was 38% in 2011, which is markedly higher than other OECD countries
such as the United States (7.6%), Australia (19.5%) or Canada (23%) (OECD, 2013b).
8
This would imply raising direct public support from 0.04 to 0.07% of GDP (or a 65% jump), which would result in a rise in business spending on R&D from
0.60 to 0.72% of GDP, as compared to an OECD average of 1.46%. Based on the estimates of specification 2 in table 1, this would contribute to
narrowing the MFP gap by around 0.3 percentage points based on the low estimate or by 2 percentage points if one assumes the higher estimated
impact of R&D on GDP per capita from Figure 8.An International Perspective on the New Zealand Productivity Paradox 17
Figure 10 Financial support for private R&D investment
A. Direct public funding of business R&D
0.4
Percentage of GDP
0.3
0.2
NZL
0.1
0
2007-09¹ 2002-04²
B. Rate of tax subsidies for one dollar of R&D3
0.4
0.3
0.2
NZL
0.1
0
-0.1
2008 2004
Source: OECD (2012).
3.3 There is more to innovation than R&D, especially in a country
with a highly-developed service sector
As mentioned above, R&D spending is typically highly concentrated in a relatively small number of
manufacturing sectors. Given the high share of services in the New Zealand economy, part of the
paradox may well lie in low productivity gains in such sectors. One recent study looking at the sources
of the productivity differential vis-à-vis Australia pointed to lower MFP levels and growth in services
sectors as the prime culprit (Mason, 2013). Measuring the extent of innovation in services is certainly
no easier than in manufacturing but some indications can be obtained from different forms of
intellectual properties (patents, copyrights, design rights and trademarks). As indicated earlier, New
Zealand is doing comparatively well in trademarks (Figure 11, panel A). However, the share of total
trademarks related to services is relatively low (Figure 11, panel B).
Many studies have underscored the importance of investment in ICT in fostering productivity in
services. The contribution of ICT investment to the US productivity resurgence since the mid-1990s has
been well documented (Oliner and Sicher, 2000). And, if productivity gains in ICT-producing played a
major role in the boom phase of the late 1990s, gains in ICT-using services made a more significant
contribution during the 2000s (Jorgenson, Ho and Stiroh, 2008) and accounted for a good portion of
the gaps in the productivity and growth performance between the two sides of the Atlantic (Van Ark,
O’Mahoney and Timmer, 2008; Gordon, 2004).
Profiles of ICT investment since the early 1980s provide some evidence of slower capital build-up in
New Zealand in this area, as compared to other English-speaking or Nordic countries. With the
exception of Canada, ICT investment rates have been systematically lower, with the difference being
particularly substantial around the dot.com bubble period of the late 2000s (Figure 12). However, ICT
investment rates have steadily gone up in New Zealand and have been comparable to that of those
countries in the late 2000s. Indeed, the share of ICT in total non-residential investment was one of theYou can also read