Summary of GPS 2018 analysis - 6 March 2017 - NotGovernmentPolicy Page1of87 - Ministry of Transport
←
→
Page content transcription
If your browser does not render page correctly, please read the page content below
Summary of GPS 2018 analysis
                   6 March 2017

            Not Government Policy   Page 1 of 87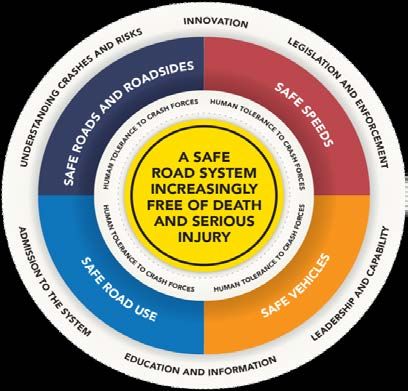
1. Purpose
1.       This document contains analysis undertaken by the Ministry of Transport as part of the
         development of the draft Government Policy Statement on land transport (GPS) 2018.
2.       The purpose of this document is to:
     •     show the main analysis the Ministry considered in drafting GPS 2018
     •     provide additional information to assist deliberation and submissions on GPS 2018.
3.       This document contains material that was used for developing the draft GPS 2018 as
         at December 2016.
2. Structure
4. This document consists of five main chapters:
         A. Background on the GPS, its current and past policy settings, and the NZ Transport
            Agency’s prioritisation process.
         B. Notes about transport policy and interventions outside of the GPS that affect the
            transport system.
         C. Data-driven analysis of outcomes across activity classes such as roads and public
            transport. This includes analysis where outcomes can be compared between
            activity classes or where multiple activity classes contribute to particular outcomes.
         D. Data-driven analysis of outcomes by activity class, ie where outcomes are
            particular to individual activity classes.
         E. Initial feedback from selected stakeholders from GPS 2018 listening sessions.

                                   Not Government Policy                              Page 2 of 87
A. Background

           Not Government Policy   Page 3 of 87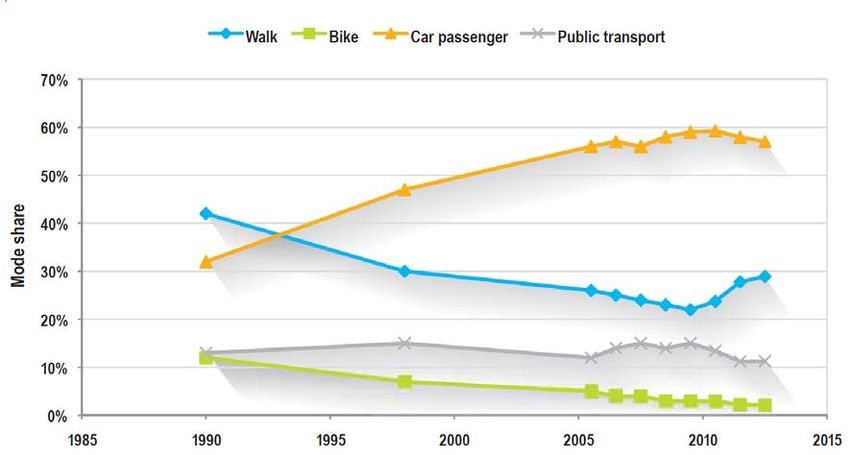
1. What is the GPS
    5. The Government Policy Statement on land transport (the GPS) outlines the
       Government’s strategy to guide land transport investment over the next ten years. It also
       provides guidance to decision-makers about where the Government will focus
       resources. The GPS operates under the Land Transport Management Act 2003 (the
       Act), which sets out the scope, and elements that are required to be present in a GPS.
6.     The GPS influences decisions on how money from the National Land Transport Fund
       (the Fund) will be invested across activity classes, such as State highways and public
       transport. It also guides the NZ Transport Agency (NZTA) and local government on the
       type of activities that should be included in Regional Land Transport Plans and the
       National Land Transport Programme.
7.     Under the Act, the Minister of Transport must, at least once in every period of three
       financial years, review the Crown’s land transport investment strategy (i.e. the GPS).
       When preparing the review, the Minister:
         •   must be satisfied that the GPS on land transport contributes to the purpose of the
             Land Transport Management Act 2003; and
         •   take into account any national energy efficiency and conservation strategy and any
             relevant national policy statement that is in force under the Resource Management
             Act 1991; and
         •   have regard to the views of Local Government New Zealand and representative
             groups of land transport users and providers.
8.     Before issuing a GPS on land transport, the Minister must consult the NZTA about the
       proposed GPS on land transport.
9.     Related to the GPS are:
         •    funding and revenue processes including:
                o    revenue raised through the petrol excise duty, road user charges and the
                     motor vehicle registration fee at rates that are set periodically through
                     legislation and regulation. This revenue is dedicated to the National Land
                     Transport Fund (NLTF) for expenditure on the land transport system 1
                o    local funding raised through rates or from other sources of local
                     government revenue. This funding is used to fund the local share of land
                     transport projects
         •    planning processes that are influenced by the GPS:
                o    regional transport committees (RTCs) established by regional councils
                     create regional land transport plans that reflect the GPS and the regions’
                     own priorities. Proposed regional transport activities are submitted to the
                     NZTA who then assess regions’ proposals and the NZTA’s own proposals
                     against the Government’s objectives in the GPS
                o    NZTA’s preparation of a National Land Transport Programme (NLTP),
                     which includes planned spending on transport activities.

1
    Some projects are also funded from Crown funding outside of the National Land Transport Fund.

                                       Not Government Policy                                    Page 4 of 87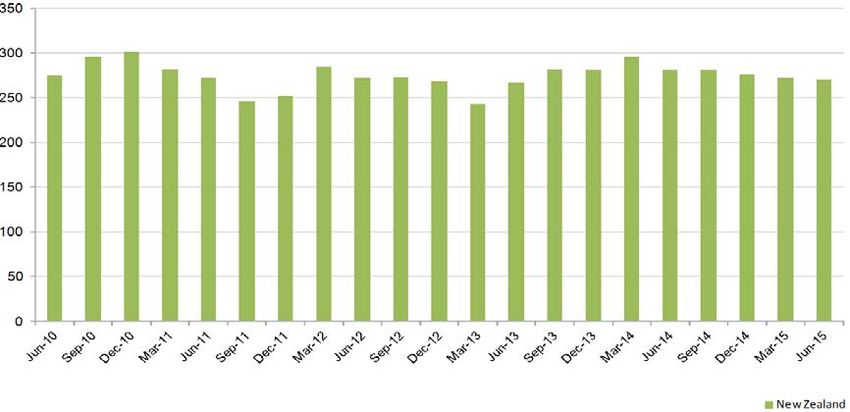
1.1. Previous GPS documents
10. The GPS sets out the Government’s objectives for land transport, and sets the budget
    for transport activities through funding ranges to activity classes.
11. There have been four GPSs since they were established under the Land Transport
    Management Act:
     •   Government Policy Statement on Land Transport Funding 2009/10 – 2018/19
         published by the Government in August 2008 (called ‘GPS 2008’ for the purposes
         of this document)
     •   Government Policy Statement on Land Transport Funding 2009/10 – 2018/19
         published in May 2009 and amended in November 2010 (called ‘GPS 2009’)
     •   Government Policy Statement on Land Transport Funding 2012/13 – 2021/22
         published in July 2011 (‘GPS 2012’)
     •   Government Policy Statement on Land Transport Funding 2015/16 – 2024/25
         published in December 2014 (‘GPS 2015’)
1.2. GPS content
1.2.1.     Strategic priorities
12. There are currently three strategic priorities in GPS 2015. These are:
     •    economic growth and productivity
     •    safety
     •    value for money.
13. These are the same strategic priorities as for GPS 2012.
14. As part of the analysis we reviewed how the focus for these priorities has changed
    between GPS 2012 and GPS 2015. Safety has remained the same but the relative
    focus within the other two priorities has changed. We also used the listening sessions
    with stakeholders to refine the focus for these priorities. As a result, the emphasis in
    GPS 2018 for these priorities has changed.
15. Another issue is how the three strategic priorities work with each other. For example, a
    new road that bypasses a town will improve the productivity of freight companies and
    generate economic growth in industries served by that freight. However, if it is low value
    for money once the costs of building that road are considered (that is, the benefit-cost
    ratio – BCR - is low), then, because of opportunity costs, there will be projects with
    greater net benefits that could have proceeded instead. This could result in a net cost to
    New Zealand in terms of productivity.
16. The tensions in these areas are not easy to resolve but can be clarified in the GPS. For
    example maximising value for money will automatically advance economic growth and
    productivity. However, there will be times when projects with low BCRs are necessary to
    advance Government priorities. For this approach to work, there needs to be a strong
    policy alignment with the GPS expression of government priorities and transparency as
    to the reason for the decision to advance the project.
1.2.2.     Results
17. GPS 2015 introduced an objectives and results framework that was enabled through
    amendments to the Act in 2013.

                                Not Government Policy                              Page 5 of 87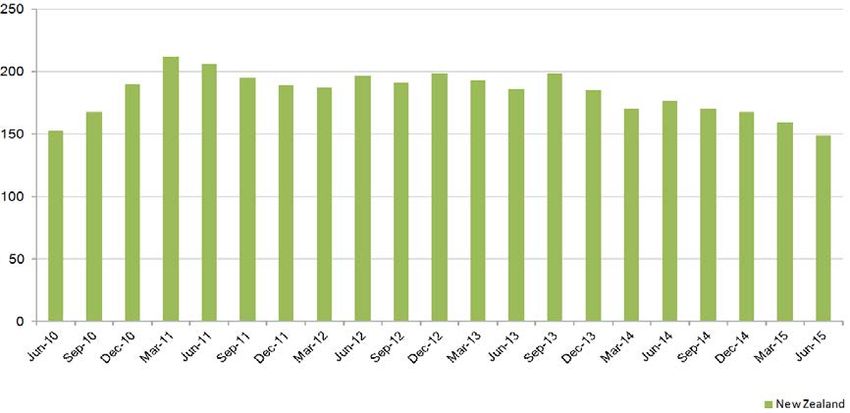
18. There are six national land transport objectives contained in GPS 2015. These aim for a
        land transport system that:
           •   addresses current and future demand for access to economic and social
               opportunities [GPS 2015 priority]
           •    provides appropriate transport choices
           •    is resilient
           •    is a safe system, increasingly free of death and serious injury [GPS 2015 priority]
           •   mitigates the effects of land transport on the environment
           •   delivers the right infrastructure and services to the right level at the best cost
               [GPS 2015 priority].
19. These objectives were mapped to ten long term results 2. Short and medium term results
    are included within the GPS 2015 activity classes. However, this mapping is not always
    consistent and NZTA’s investment assessment may also be inconsistent. For example:
       •   All the long-term results – economic growth and productivity, resilience, safety,
           mitigation of adverse environmental impacts – are primary long-term results for State
           highway improvements. However, the only primary long-term result for local roads is
           economic growth and productivity (the others are secondary).
       •   The relationship between long term and short to medium term results is confusing.
           While resilience, safety and mitigating environmental impacts are primary long-term
           results, the associated short to medium term results are not primary for State
           highway improvements. This might suggest that NZTA and RTCs can give resilience,
           safety and mitigating environmental impacts less emphasis in the short to medium
           term, but enough focus to achieve them over the longer-term. However, resilience,
           safety and mitigating environmental impacts are primary short to medium term results
           for the multi-class reporting lines.
           This could mean either that achieving results in the short- to medium-term is not a
           priority for State highway improvements and local road improvements so long as it is
           achieved in other activity classes; or that they are a priority for roads, but also for
           other activities and, so, reporting happens in the multi-class reporting lines.
       •   Reporting on safety expenditure appears to be a higher priority result than actual
           improvements in safety. While information is essential to making robust investment
           decisions, there may be a question about the emphasis on information over actual
           improvements in safety.
       •   Resilience in GPS 2015 is about economically and socially critical points. While the
           long-term and short- to medium-term results only mention ‘most critical points’
           without regard to whether they’re economic or social, the reporting requirements
           specifies ‘most economically and socially critical points’. The objective that relates to
           resilience states that ‘priority needs to be given to improving the system’s resistance
           to disruptions that pose the highest economic and social costs’ 3. However, NZTA’s
           current strategic fit criteria provide a high rating for resilience only where the
           resilience is for economic reasons. However, there is work underway within NZTA to
           incorporate social reasons into the assessment.
20. As part of developing GPS 2018, the structure of the GPS was rearranged to get better
    alignment between priorities, objectives and results. This process also highlighted some
    inconsistencies of signals within the GPS. Providing a structure that speaks largely to

2
    See Table 1 in GPS 2015, page 16.
3
    GPS 2015, page 21.

                                        Not Government Policy                             Page 6 of 87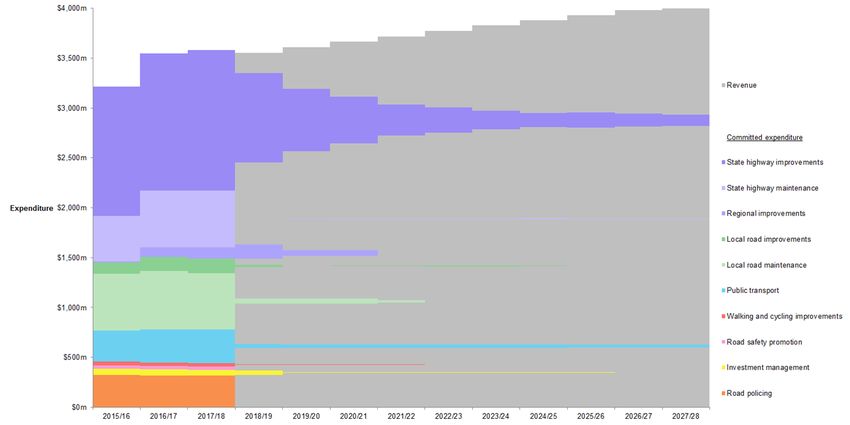
results, and not necessarily to the area of investment, should provide clearer investment
        signals to NZTA and RTCs, and signals for incorporation in the NZTA investment
        assessment framework. However, it is important to continue to review the link between
        the GPS, the investment assessment framework and what is actually happening in
        practice to ensure further necessary refinements are made both in the GPS and the
        associated planning processes.
1.2.3.          Activity classes
    21. Given the role of activity classes in GPS 2015 in delivering the short and medium terms
        results, the following analysis follows the GPS 2015 activity class structure.
    22. Funding ranges for GPS investment are set in activity classes. The 10 activity classes in
        GPS 2015 are:
         •     state highway improvements
         •     local road improvements
         •     state highway maintenance
         •     local road maintenance
         •     regional improvements
         •     public transport
         •     walking and cycling improvements
         •     road policing
         •     road safety promotion
         •     investment management.
    23. Details of what is covered by each activity class can be found at
        https://www.pikb.co.nz/activity-classes. These activity classes have changed since the
        first GPS was issued in 2008. These changes are relevant to the extent that some GPS
        analysis covers periods where the activity classes may have had a different structure or
        content. Table 1 outlines these changes. GPS 2015 merged many activity classes, and
        created a regional improvements activity class 4.
    24. State highway improvements and road policing along with most expenditure in the road
        safety promotion and investment management activity classes are completely funded
        from the NLTF. As regional improvements have, so far, all been State highway
        improvements, these have also received all of their funding from the NLTF.
    25. Other activities are funded from the NLTF and by local authorities with the local share
        varying by region according to need and ability to pay. The average regional contribution
        is around 47 percent. The average funding assistance rate (FAR) from the NLTF is 53
        percent.

4
    Prior to GPS 2015 population based R-Funds were used to fund regional improvement activity.

                                        Not Government Policy                                     Page 7 of 87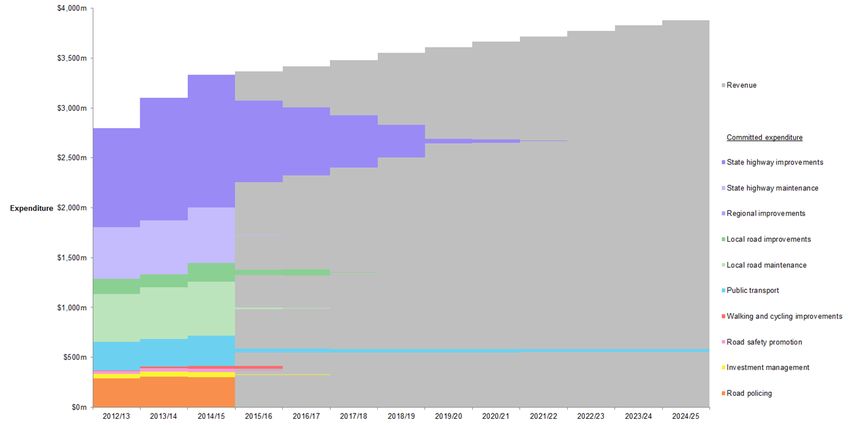
Table 1: Activity class changes, GPS 2008 to GPS 2015

         No significant change            New          Ended          Merged          Changed scope
     GPS 2008                   GPS 2009                   GPS 2012                   GPS 2015
     New and improved           New and improved           New and improved
                                                                                      State highway
     infrastructure for State   infrastructure for State   infrastructure for State
                                                                                      improvements
     highways                   highways                   highways
     New and improved           New and improved           New and improved
                                                                                      Local road
     infrastructure for local   infrastructure for local   infrastructure for local
                                                                                      improvements
     roads                      roads                      roads
     Renewal of State           Renewal of State           Renewal of State
     highways                   highways                   highways
                                                                                      State highway
     Maintenance and            Maintenance and            Maintenance and            maintenance
     operation of State         operation of State         operation of State
     highways                   highways                   highways
     Renewal of local roads     Renewal of local roads     Renewal of local roads
     Maintenance and            Maintenance and            Maintenance and            Local road
     operation of local         operation of local         operation of local         maintenance
     roads                      roads                      roads
     Public transport           Public transport           Public transport
     services                   services                   services
                                                                                      Public transport
     Public transport           Public transport           Public transport
     infrastructure             infrastructure             infrastructure
                                                                                      Walking and
     Walking and cycling        Walking and cycling
                                                           Walking and cycling        cycling
     facilities                 facilities
                                                                                      improvements
                                                                                      Regional
                                                                                      improvements
     Road policing              Road policing              Road policing              Road policing
     Demand management
                                                                                      Road safety
     and community              Road user safety           Road safety promotion
                                                                                      promotion
     programmes
     Sector training and
     support                    Sector training and
                                                           Sector research
                                research
     Sector research
     Transport planning         Transport planning         Transport planning
                                                                                      Investment
     Performance                Management of the          Management of the          management
     monitoring                 funding allocation         funding allocation
     Management of the          system, including          system, including
     funding allocation         performance                performance
     system                     monitoring                 monitoring
     Rail and sea freight       Rail and sea freight
     Domestic sea freight       Domestic sea freight
     development                development

                                   Not Government Policy                                    Page 8 of 87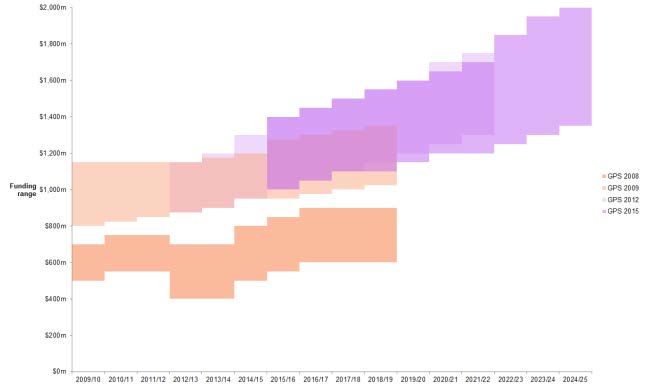
1.3. NZTA prioritisation process
    26. The NZTA interprets the GPS’s short to medium term results and, within the funding
        ranges specified, uses a prioritisation process to give effect to them, by employing an
        investment assessment framework. 5 The framework considers three factors:
             •    strategic fit - how an identified problem, issue or opportunity aligns with GPS
                  results. Strategic fit focuses on the problem, issue or opportunity being
                  addressed and is considered without regard to the possible solution
             •    effectiveness - the contribution that the proposed solution makes to achieving
                  the potential issue or opportunity identified in the strategic fit assessment and
                  the purpose of the LMTA
             •    efficiency – a benefit-cost appraisal 6 of the proposal given as a benefit-cost
                  ratio (BCR) for improvements and cost effectiveness for continuing
                  programmes.
    27. Each of the assessment factors can be rated as low, medium or high. The NZTA
        assigns a priority score to projects according to the combined assessment of these
        three factors.
       Table 2: Assessments and priority scores for NLTP 2015

                                         Assessment profile     Priority
                 [strategic fit | effectiveness | efficiency]
                                                   HHH             1
                                      HH M         H MH            2
                                      HHL          H MM            3
                                      H ML         M HH            4
                                      M HM         M MH            5
                                      M HL         M MM            6
                                                   M ML            7

28. As noted earlier, to see how well the Government’s objectives are reflected in land
    transport processes, we need to look across the GPS and its implementation through
    NZTA’s prioritisation process. The NZTA’s strategic fit criteria are key to prioritising
    projects and operates as a gateway into the assessment process. It is important that the
    investment assessment framework and strategic fit align with the GPS. This requires
    review of the outcomes from the investment assessment process.
    29. As with other elements of a GPS, there can be different emphases given to the relative
        weighting in the investment assessment framework depending on the GPS investment
        signals provided. For example, the value for money focus, based on BCRs, in GPS
        2015 placed increased emphasis on the importance of efficiency.
30. In terms of projects progressing into the NLTP, the strategic fit criteria is key:
       •   projects with a low strategic fit rating or a low effectiveness rating cannot be
           approved for funding
       •   projects with high strategic fit can progress into the NLTP even if their efficiency
           scores are low

5
 https://www.pikb.co.nz/assessment-framework
6
 Alternative methods like cost effectiveness can be used on occasion or for particular activities. Maintenance,
for instance, is generally assessed using cost effectiveness.

                                        Not Government Policy                                     Page 9 of 87
•    projects without an economic efficiency assessment or with a BCR below 1 receive
        no rating and are ineligible for funding approval other than in exceptional situations.
31. The analysis concluded that the NZTA’s strategic fit criteria overall reflects the relative
    importance GPSs have placed on economic growth by allowing activities that support
    economic activity to receive a high strategic fit. However, between GPS 2012 and GPS
    2015 the investment framework may have reduced the focus on efficiency (BCR) slightly
    more than the intent behind GPS 2015.
1.4. Funding priority
32. In developing the NLTP, the NZTA assigns each project a funding priority. Funding
    priorities are based prioritisation scores, timing, and available funding.
33. There are five levels of funding priority:
       A. Committed – projects approved under previous NLTPs and carried forward into the
          current NLTP
       B. Approved – projects approved under the current NLTP
       C. Probable – projects likely to go ahead if sufficient funding is available
       D. Proposed – projects that could go ahead if sufficient funding is available and if
          there aren’t other higher priority projects that might yet be approved
       E. Not included – projects that are put forward for inclusion in the NLTP that are not
          accepted by the NZTA.
34. A project’s funding priority changes over time as projects move through the process, or
    as projects drop out as other higher priorities arise.

                                 Not Government Policy                                Page 10 of 87
2. Revenue and expenditure
2.1. Summary of revenue and expenditure for 2015/16 to 2017/18
35. Figure 1 summarises 7 revenue and expenditure for NLTP 2015. Later chapters explore
revenue and expenditure in more detail.
Figure 1: Revenue and expenditure for NLTP 2015
Source: Ministry of Transport using NZTA estimate of revenue published at 30 June 2015 and NZTA
expenditure 1 June 2016
2.2. Revenue over time
36. Petrol excise duty was hypothecated 2008 meaning that this revenue is only available
for transport projects. For most of the time prior to 2008, petrol excise duty was Crown
revenue with Crown appropriations made into the NLTF.
37. Revenue sources for the NLTF are shown in Figure 2.
7
Expenditure and revenue totals may not equal as they were estimated at different dates (about a year apart),
and because the NLTF can move into surplus or deficit in the short-term.
Not Government Policy Page 11 of 87Figure 2: Revenue sources for the National Land Transport Fund, 1997/98 to 2014/15
Source: Ministry of Transport
3. Expenditure
3.1. Funding ranges
38. Figure 3 shows how activity class funding ranges have changed from GPS 2008 to GPS
2015. While funding ranges can be an important signal as to expected areas of
investment, actual expenditure may differ. This is because some activity classes are
subscribed at the top of the funding range (such as the walking and cycling activity class
in GPS 2015), while others may be at (or below) the minimum for the funding range
(such as the local road improvements activity class in GPS 2015).
39. Actual expenditure can be traced back to 1997/98 through the NZTA’s, and its
predecessors’, annual reports.
Not Government Policy Page 12 of 87Figure 3: GPS funding ranges, 2009/10 to 2024/25
$2,000 million scale
State highway improvements
GPS 2008
GPS 2009
GPS 2012
GPS 2015
$1,000 million scale
State highway maintenance Local road improvements Local road maintenance Public transport Road policing
$200 million scale
Walking and cycling Regional improvements Road safety promotion Investment management
Source: Ministry of Transport based on GPSs 2008, 2009, 2012 and 2015
Not Government Policy Page 13 of 8740. Figure 4a shows how activity class funding ranges have changed from GPS 2008 to
GPS 2015.
41. For instance, State highway improvements had:
• a substantial increase in funding ranges between GPS 2008 and GPS 2009
• a smaller, but significant, increase in GPS 2012
• and a slight reduction in GPS 2015 (not including the effect of regional
improvements).
42. The increase in funding for State highway improvements came from a combination of
increased road taxes and reductions in the funding available to other activity classes.
The pattern for local road improvements is typical:
• a slight change in funding ranges between GPS 2008 and GPS 2009
• a substantial reduction in GPS 2012
• a smaller, but significant, increase in GPS 2015.
43. Figure 4b shows the cumulative change in expenditure before and after 2007/08, the
year from which the NZTA was formed, and road taxes became hypothecated.
Figure 4a: Actual expenditure for all activity classes
Source: Ministry of Transport - 1997/98 to 2014/15 using NZ transport agency annual reports, for 2015/16 to
2017/18 using NZTA forecasts
Not Government Policy Page 14 of 87Figure 4b: Cumulative change in expenditure for all activity classes
Source: Ministry of Transport - 1997/98 to 2014/15 using NZ transport agency annual reports, for 2015/16 to
2017/18 using NZTA forecasts
44. Expenditure for 2016/17 and for 2017/18 come from NZTA’s forecasts of expenditure.
• Expenditure on State highway improvements is characterised by a relatively large
increase over time. This increase appears to have started around 2005/06 with large,
consistent increases continuing thereafter. 8
• Expenditure on other activity classes since 2007/08 follows that of the relevant
funding range with lower rates of growth than in previous years.
3.2. Expenditure relative to funding ranges
45. The Government sets funding ranges in the GPS that it considers will best achieve the
results it has for land transport. Where expenditure actually ends up within those funding
ranges is an indication of the quality of projects that turned out to be available and, in
the case of activity classes where local funding contributions are required, regions’
desire or ability to pay for those activities.
46. Figure 5 looks through the yearly variation and aggregates expenditure in three year
blocks: 2009/10 to 2011/12 for GPS 2009; 2012/13 to 2014/15 for GPS 2012; and
2015/16 to 2017/18 for GPS 2015. The first five activity classes are graphed along the
left hand axis; the second group of five activity classes is graphed along the right hand
axis.
8
The fork at the end of the State highway improvements line is if regional improvements is and isn’t included.
Not Government Policy Page 15 of 87Figure 5: Expenditure relative to funding ranges, by GPS
Source: Ministry of Transport using planned and actual data is from NZ transport agency annual reports, for 2015/16 to 2017/18 using NZTA forecasts
Not Government Policy Page 16 of 8747. Figure 5 shows:
• road maintenance tending to the top of funding ranges, particularly local road
maintenance
• local road improvements tending to the bottom of funding ranges, even going
below the minimum required expenditure
• other activity classes sitting within funding ranges although:
o public transport expenditure is consistently lower than planned expenditure
o State highway improvements have a tendency towards the higher end of
funding ranges.
3.3. Committed expenditure
48. Many projects involve expenditure over more than one year, and projects started under
one NLTP can carry over to future NLTPs. This section looks at how much of future
funding is ‘committed’. However, because transport projects generally take years to
plan, design, and construct, some funding may be deemed ‘committed’ from one GPS to
another.
49. Figure 6a shows Ministry estimates of how much revenue is committed by activity class
over time. These estimates do not include future projects that may have been signalled
but not yet approved (for example, any projects within the Auckland Transport Alignment
Package). During the period of a GPS, committed projects match the expected revenue
for the first three years. In the out-years, as might be expected, are less committed. The
estimates for GPS 2015 are not dissimilar to committed expenditure shares following
GPS 2012 (Figure 6b).
50. There is a considerable amount of uncommitted revenue in the years outside of the
current NLTP. This can enable changes between activity class funding to be considered.
Even for State highways, which have the most committed funds, there is still
considerable discretion.
Not Government Policy Page 17 of 87Figure 6a: Committed expenditure following GPS 2015
Source: Ministry of Transport estimate based on NZTA’s Transport Investment Online data
Not Government Policy Page 18 of 87Figure 6b: Committed expenditure following GPS 2012
Source: Ministry of Transport estimates based on NZTA’s Transport Investment Online data
Not Government Policy Page 19 of 87B. Transport policy
and interventions
Not Government Policy Page 20 of 874. Transport policies and interventions affecting the GPS
51. This section summarises other transport policy and interventions that influence the
development and content of the GPS.
4.1. Safer Journeys 2010 to 2020
4.1.1. The Safe System approach
52. Safer Journeys is New Zealand’s road safety strategy for 2010 to 2020. The goal of
Safer Journeys is a safe road system increasingly free of death and serious injury. To
support this goal, Safer Journeys articulates how road safety should be managed across
all parts of the safe system – roads and roadsides, speed, vehicles, and road use.
53. In this context, GPS investment enables the delivery of Safer Journeys’ goal of reducing
road deaths and serious injuries through Action Plans. Understanding the causes or
contributors to crashes and their impact on social costs informs allocation decisions for
road safety through the GPS.
54. Delivery of policy interventions to improve road safety occur through a number of
mechanisms, such as regulations affecting standards of vehicles on the roads, speed
limits, driver licensing, education, and Figure 7: The safe system
promotion and enforcement of the
regulations.
55. The Safe System approach (Figure 7)
recognises that people make mistakes, and
are vulnerable in a crash. It seeks to reduce
the effects of a mistake so crashes do not
result in injury or death. In a safe road
system, all parts of the system work
together to reduce risks. The four key parts
of the safe road system are:
• safe vehicles - more vehicles have
advanced safety features, including
electronic stability control, crumple
zones, front and side airbags. Tyres
and brakes are better maintained
• safe roads and roadsides are more forgiving of mistakes. Surfaces are improved,
shoulders are sealed, roadside hazards such as trees or poles are removed and
barriers and rumble strips are installed
• safe speeds – speed is managed to survivable levels through speed limits that are
appropriate for the road and through greater use of technology
• safe road use - people using the roads are skilled, alert, and drive or ride to
conditions.
4.1.2. Safer Journeys Action Plan 2016-2020 and GPS 2018
56. The outputs from the Safer Journeys Action Plan 2016-2020 (the Action Plan) are
delivered through a number of initiatives involving a range of agencies. The National
Road Safety Committee has governance and oversight of the Action Plan’s delivery.
57. While the GPS objective for road safety is the same as for the Action Plan, the GPS
includes other objectives and activity classes that influence road safety objectives.
Not Government Policy Page 21 of 87Objective
Safer Journeys GPS 2018
A land transport system
Action Plan
2016 to 2020 that is a safe system,
(Allocation
(Delivery increasingly free of death mechanism)
mechanism)
and serious injury
58. The Action Plan divides activities into two parts based on crash statistics data and
trends. The first part includes business–as-usual activities, and the second consists of
four key priorities:
• Business-as-usual
o Improving roads and roadsides
o Four types of road user (young driver/riders, visiting drivers, high risk drivers,
impaired drivers)
o Speed management
o Vehicles and motorcycles
o Cycling and pedestrian safety
• Four key priorities
o Action 1: Enable smart and safe choices (technology focus)
o Action 2: Make motorcycling safer
o Action 3: Ensure roads and roadsides support safer travel
o Action 4: Encourage safe vehicles.
4.2. Accelerated Auckland projects
59. Budget 2014 provided $375 million of new capital funding for the NZTA to accelerate
$815 million worth of Auckland transport projects. The additional funding accelerated
key Auckland transport projects by up to 10 years.
60. Under the 2014 Auckland Transport Package:
• Northern Corridor Improvements have been progressed with the project expected to
be completed by December 2021
• Southern Corridor Improvements remain on track for completion by October 2018
• upgrades to State Highway 20A to Auckland Airport are on track for completion by
December 2017.
61. In September 2016, work began on Auckland East-West Connections (that is, widening
a section of the South-western Motorway, as well as the planning and consent
processes for the wider project).
4.3. Auckland Transport Alignment Project (ATAP)
62. In 2016, the strategic approach for ATAP was released. It recommends an aligned
strategic approach from Auckland Council and the Government, and includes an
indicative package of transport investment for the next 30 years.
Not Government Policy Page 22 of 8763. Decisions on funding ATAP are underway.
4.4. Accelerated Regional Roading Package
64. In 2014, the Government announced a funding package to accelerate regionally
important State highway projects. The package comprised three tranches 9:
• Tranche 1 provided up to $80 million for five critical projects in Otago, Canterbury,
Northland, Gisborne and Taranaki
• Tranche 2 provided up to $5 million to finalise investigation and consenting for
projects in Northland, Gisborne, Taranaki, Horowhenua, Marlborough and the West
Coast. Up to $115 million was committed for construction, subject to the
investigations finding that the projects were needed
• Tranche 3 provided up to $12 million to accelerate design and investigation of three
big projects in Hawke’s Bay, Nelson and the Bay of Plenty.
65. In January 2016, the Government announced that up to $115 million in funding would be
made available to fund four projects in Taranaki, Gisborne and Marlborough. The
Government also announced that projects investigated under Tranche 2 in Horowhenua,
West Coast, Northland and Taranaki would be constructed with funding from the NLTF.
66. Overall, the package has provided funding to bring forward 14 regionally important State
highway projects, drawing on the Future Investment Fund and the NLTF.
67. Currently, all Tranche 1 projects are either under construction or are completed.
Tranche 2 projects are expected to start from 2016 to 2018. Tranche 3 projects are still
in the investigation and design phase.
4.5. Urban Cycleway Programme (UCP)
68. The UCP was announced in 2014. It is intended to improve and accelerate cycling
infrastructure in the main urban centres with a high proportion of the programme
focused on the Auckland, Wellington and Christchurch metros. The additional funding is
provided through the Urban Cycleways Fund, with $10 million made available for
projects in the first year (2014/15) and the remaining $90 million provided over the
following three financial years.
9
Further information on the individual projects can be found on the Ministry of Transport website:
http://www.transport.govt.nz/land/accelerated-regional-roading-package/
Not Government Policy Page 23 of 87C. Analysis across activity classes
Not Government Policy Page 24 of 87Analysis across activity classes
70. This section contains analysis of outcomes across activity classes. This includes
analysis where outcomes can be compared between activity classes or where multiple
activity classes contribute to particular outcomes.
71. The section begins with a commentary on the features that are relevant to this analysis,
including:
• benefit-cost ratios (BCRs) as an indicator of project value
• outcomes that have been achieved (using BCRs)
• and people’s stated preferences.
72. This section then discusses safety, environmental mitigation, and resilience where
investment is embedded in GPS investment in roads, public transport and active modes.
73. In addition to these areas, there are three further potential areas that work across
activity classes:
• Auckland: in the analysis for GPS 2018 we have relied on the Auckland Transport
Alignment Project to inform on Auckland issues
• Regions: the Regional Economic Development process for regions as well as active
engagement with local government at listening sessions have informed regional
components of the GPS
• the Intelligent Transport System Action Plan has been the basis for the technology
content in the draft GPS 2018.
74. These areas are not further discussed in this section.
5. Benefit-cost ratios
75. High quality project BCRs are good indicators of the value of projects. BCRs are
recorded in NZTA’s Transport Investment Online database and have been used in the
analysis that follows. It is also important to note that factors other than BCRs (such as
strategic fit) affect the pool of available projects for each activity class and, therefore, the
range of BCRs within each pool.
76. In using the Transport Online Database, the following caveats are important:
Table 3: Caveats and notes when using Transport Investment Online BCR data
A. BCR averages are weighted by the cost of projects.
B. Incorrect BCRs can be recorded in the database and may not match with the assessment of
efficiency, and may use assessment ranges that have since been updated. This analysis
ignores BCRs where they are inconsistent with the efficiency assessment.
C. Some BCRs are unrecorded have and have been assumed based on projects’ efficiency
ratings (e.g. between 1 and 3 if ‘low’).
D. The BCRs of draft projects have not been reviewed and are not moderated. The NZTA reviews
BCRs as projects work their way through the prioritisation system.
E. Between GPSs, the discount rate has been changed from 8% to 6%. With transport investment
usually having large upfront costs, with benefits over time, the NZTA estimate that reducing the
discount rate to 6% increases BCRs by an average of 15%. To compensate for this, NZTA
adjusted the BCR ranges for low, medium, and high efficiency projects as follows:
Not Government Policy Page 25 of 87Efficiency rating BCR range 2012/15 BCR range 2015/18
Low 1 to 2 1 to 3
Medium 2 to 4 3 to 5
High 4 or higher or higher
This analysis makes the adjustment by lowering the weighted-average BCR by 13% to account
for the 15% inflation in BCRs. As not all BCRs are recorded, this simple lowering may over- or
under-estimate true BCRs.
F. For projects with ‘high’ efficiency, the upper range was assumed to be 5 as part of GPS 2015
analysis of 2012/15 data. For the 2015/18 data, the upper range was assumed to be 15%
higher at 5.75. When looking at known BCRs, the upper limit is an underestimate.
G. As projects move forward and backwards (generally forwards) in funding priority over time,
care needs to be taken in comparing data at different points of time in GPS/NLTP cycles.
5.1. Benefit cost ratios of State highway and local road improvements
77. Figure 8 updates analysis prepared for GPS 2015. Figure 8 averages BCRs by funding
priority for projects that are either: committed and approved, probable and proposed, or
on reserve. Not included means the project has been declined or is still a draft.
Figure 8: State highway and local road improvements, by funding priority
Source: Ministry of Transport estimates based on NZTA’s Transport Investment Online data
78. For local roads 2015/16 to 2017/18 committed and approved projects had the highest
average BCRs. Probable and reserve projects had lower average BCRs, and not
included projects had the lowest average BCRs. Local road BCRs decline with lower
funding priority. This suggests that efficiency (BCRs) is a relatively important factor in
prioritising new and improved local roads.
Not Government Policy Page 26 of 8779. The pattern for State highway improvements 2015/16 to 2017/18 is different from local
roads. The BCRs for committed and approved projects is lower than for probable and
proposed projects. This pattern suggests efficiency may be a relatively less important
factor in prioritising new and improved State highways.
5.2. BCRs by funding priority across all improvement activity classes
80. Looking at BCRs using Transport Investment Online data by improvement activity class,
there appears to be no significant difference in BCRs between non-State highway
activity classes.
81. The following features are observed:
• BCRS for State highway improvements are lower than all other improvement activity
classes. However, when large project groups are taken out (that is, RONs which
have among the lowest BCRs), State highway improvements have slightly lower BCR
profiles to the other activity classes
• in general BCRs appear to have fallen between 2012/13 to 2014/15 and 2015/16 to
2017/18. BCRs for State highway improvements have fallen between the two time
periods while the BCRs for all committed and approved projects across most other
activity classes has risen with the exception of public transport where they appear to
have remained the same over the very small number of public transport projects
• public transport BCRs look to be about the same between the two periods. Not too
much can be read into the BCRs for public transport services for standby and
declined projects as there are very few projects in the activity class. Public transport
services are grouped together in programmes with a single BCR in Transport
Investment Online
• BCRs for approved road safety promotion in 2012/13 to 2014/15 reflect a small
number of projects. These projects include, for example:
o Young Driver - National Network User Behaviour Programme (BCR 49.0)
o Operator Rating System (BCR 40.2)
6. Types of benefit attained
82. The following analysis is of benefit type assigned to a project. This occurs before a
benefit-cost analysis is completed. As such, it presents the link to GPS priorities and
objectives rather than the BCR. The actual benefits from a BCR would have been
preferred but were not available for this analysis. The analysis is subject to the following
caveats:
• NZTA’s data records primary and secondary benefits when a project begins and not
the magnitude of each type of benefit a project generates. Where secondary benefits
are recorded they tend to be numerous and do not shed any insights. As such, for
this analysis all the net benefits of projects have been attributed to the primary
benefit.
• the main strategic fit for investment linked to the GPS results of the project is
recorded rather than the main monetised benefits. These reasons for investment and
monetised benefits may differ and it would be useful for both to be recorded. An
example where strategic fit and a BCR may differ is in walking and cycling activities
where the actual benefits from this activity may be health related, the main benefit
recorded relates to transport choice as this a GPS focus.
• as road safety promotion projects did not have a benefit type recorded, all of the
benefits of this activity class have been attributed to ‘reduced deaths and serious
injury’
Not Government Policy Page 27 of 87• care should be taken in analysing the public transport data as only a small proportion
of approved public transport projects had a primary benefit recorded.
83. Table 4 describes the types of benefits and gives examples of the types of projects with
these primary benefits.
Table 4: Types of benefits
Type of benefit Project examples
Congestion relief • Tauranga Northern Link
• Pakuranga park and ride
• Pakuranga to Botany Busway
Journey time reliability • Gisborne – Napier Passing Opportunities
Whereas congestion is fairly constant, • SH35 Slow Vehicle Bays
journey time reliability is about changes
in travel time due to
unexpected/infrequent congestion, bad
weather, road accidents
Freight efficiency • HPMV T2 Nelson to Lyttelton
Better freight routes that reduce costs • HPMV SH2 Waihi to Port of Tauranga
for freight operators, e.g. strengthening • Waikato Bridge Replacement
bridges that allow operators to use High
Productivity Motor Vehicles (HPMVs)
Access for economic growth • Lyttelton Port Access Road
E.g. transport serving new commercial • Road improvements complementing urban
developments; access to ports developments in Auckland
Secure and resilient network • Milford Rockfall/Avalanche Protection
• Waikouaiti Flood Mitigation
• Bridge renewals in Timaru
Better use of existing capacity • Otahuhu bus interchange
E.g. turning one lane of a road into a • Double decker network mitigation works in
bus lane to increase throughput Auckland
• Rangiora – Kaiapoi Cycle Corridor
Reduced deaths and serious injury • NZTA’s Network User Behaviour
Includes road safety promotion (ads, Programme
education) and infrastructure • Boyd Road realignment in Otago
improvements like safety barriers, lane • Ngakoroa Realignment and Passing Lane
separation in Auckland
• SH88 Cycling and Pedestrian Facilities in
Otago
Positive health outcomes • Noise Improvement Programme in
Auckland
• Dust Mitigation Programme in the Far
North
Reduced environmental effects • Stock truck effluent disposal facilities
More transport choice • Wainuiomata Hill Road Shared
Walking/Cycling Path
• Trial of a bus service in Northland
Not Government Policy Page 28 of 876.1. Type and magnitude of benefits
84. Figure 9 shows the magnitude of gross monetised benefits 10 by type of strategic fit by
the ‘improvement’ activity classes for 2015/16 to 2017/18 11. Improvement activity
classes include State highway improvements, local road improvements, public transport,
walking and cycling improvements, and road safety promotion.
85. Benefit types have been ordered roughly from:
• time benefits to users to
• commercial benefits to users to
• outcomes that are about achieving other benefits to
• externalities on users and other people to
• other externalities and social benefits.
86. Figure 9 shows what types of benefits are generated by each activity class. Bars on the
left are the shares for committed and approved projects; bars on the right are shares for
probable and proposed projects.
10
The benefits of projects before costs are subtracted.
11
Improvement activity classes require projects to have a BCR. For some activity classes (e.g. maintenance) the
BCR for projects is implied.
Not Government Policy Page 29 of 87Figure 9: Type and magnitude of benefits
Source: Ministry of Transport estimates based on NZTA’s Transport Investment Online data
Not Government Policy Page 30 of 8787. Across activity classes, there is a general pattern of more economic-type benefits and
fewer social-type benefits from approved projects, while standby projects are more likely
to be about social-type benefits. This broadly matches the direction of GPS 2015, which
prioritises projects that deliver economic activity.
88. In terms of individual activity classes:
• State highway improvements contribute the most net benefits (noting the earlier
finding that these improvements have lower BCRs on average) which are due to the
magnitude of spending on State highway improvements.
• State highway improvements benefits are “economic” benefits. However, the
distribution of benefits changes for standby projects (i.e. the hollow bars), with safety
and transport choice featuring more
• local road improvements have fewer types and a flatter distribution of benefits than
State highways
• public transport has a large amount of unrecorded benefits. This makes assessment
from the data held on public transport less informative than in other areas. From the
data recorded, public transport has a relatively even distribution of the benefits
although it contributes little to freight supply chains and access to economic growth
• across State highway improvements, local road improvements and public transport,
the main focus is on improving travel times whether through relieving congestion or
by other means
• walking and cycling improvements are largely related to about transport choice and
then safety, and contributes little to congestion
• by assumption, road safety promotion is about achieving safety benefits.
7. Progress of projects
89. Indications of demand for different types of activity may be inferred by how much
projects progress, particularly for projects that require local funding contributions. If the
public want particular types of projects, then these projects can be proposed through
regional land transport plans. However, if better uses for rate revenues arise, then local
authorities may not proceed with projects and may not put forward the local share of
funding, even if the project has been approved by the NZTA.
90. Analysis presented earlier in this document looked at how actual expenditure compared
to funding ranges by activity class. This suggested that there was a preference for more
local road maintenance and less local road improvements.
91. Another indicator comes from how quickly projects progress through the NLTP. By
looking at projects progressing through NLTP 2015 (to date):
• There are high rates of progress during NLTP 2015 for State highway
improvement and State highway maintenance projects:
o for State highway improvements, the percentage of known projects that are
approved rises from less than 10 percent to almost 70 percent. There are
also very few projects with draft status at the end of the time period
suggesting that few projects that have a status of proposed or higher are
subsequently withdrawn or removed from the process
o for State highway maintenance, all programmes of work were included in
NLTP 2015 after it was published moved through to being approved
• All local road maintenance programmes of work included in NLTP 2015 after it
was published moved through to being approved. These projects made up a
smaller proportion of projects than for State highway maintenance
Not Government Policy Page 31 of 87• Local road improvement projects advance through the NLTP at a much slower
rate than State highway improvements
• The proportion of known local road improvement projects that are probable or
proposed falls from around 65 percent to around 35 percent. However, ten
percentage points of this reduction are projects dropping out of the NLTP rather
than advancing through to approved status. The proportion of known projects that
are approved rises from around 20 percent to around 45 percent
• Public transport projects progress at the slowest rate, although actual expenditure
is within funding ranges. There may be something about public transport projects
that means they behave differently from the road activity classes when it comes to
progressing through the NLTP
• A large proportion of known public transport projects are recorded as proposed
early on in the NLTP 2015 process, but around half of them appear to drop out of
the NLTP
• Around 20 percent of probable or proposed walking and cycling improvement
projects have dropped out of the NLTP, while a good proportion of projects have
moved through to approved status
• Around 90 percent of known road safety promotion projects were approved when
NLTP 2015 was published
92. The regional improvements activity class is new and it is perhaps too early to read to
much into any patterns here. No regional improvement projects had approved status
when NLTP 2015 was published. However, this activity class appears to behave in a
similar way to State highway improvements with a relatively low number of approved
projects at the start of the NLTP, but numbers accelerate relatively quickly. As all
regional improvement projects to date have been State highways, this may help explain
this result.
93. Apart from local road maintenance, projects with a local share appear to advance more
slowly, have a lower likelihood of becoming approved and a higher chance of not
proceeding. This may be a result more pressing or valuable uses for rate payer funds.
Discussions with Regional Transport Committees would suggest this is the case.
8. Congestion and travel times
94. Transport investment has sought benefits from reducing congestion and from improving
travel times and travel time reliability.
95. Figures 10a and 10b show, respectively, travel time delays and travel time variability in
the main metro cities of Auckland, Hamilton, Tauranga, Wellington, and Christchurch
(up until the Canterbury earthquakes).
96. Variability in data makes it is hard to make confident conclusions about travel times. It
appears that travel time variability is decreasing, although it is noted that:
• travel time delays in morning and afternoon peaks are highest in Auckland
• while peak travel time delays in Auckland do not appear to have a strong trend, travel
time delays in the inter-peak period appear to be rising suggesting that congestion is
spreading beyond peak times
• there may have been some reduction in travel time delays in most cities following the
2008/09 recession.
• there may be an increase in travel time delays over the three years to 2015, and
Wellington’s morning peak perhaps earlier than this.
Not Government Policy Page 32 of 87Figure 10a: Travel time delays in metro cities AM peak Interpeak PM peak
Auckland Hamilton Tauranga Wellington Christchurch
Figure 10b: Variability in travel times in metro cities AM peak Interpeak PM peak
Auckland Hamilton Tauranga Wellington Christchurch
Source: Ministry of Transport travel time delay indicator and travel time variability indicator
Not Government Policy Page 33 of 879. People’s stated preferences
97. A new online stated preference survey developed by the Ministry of Transport (with
assistance from a range of agencies including the Treasury and the University of
Otago) sought to understand people’s preferences for different aspects of transport. It
was the first survey conducted and looks at peoples stated preferences for roads. The
survey can be found here: http://www.transport.govt.nz/news/land/what-do-you-care-
about-most-when-you-travel/
98. In order to discover participants’ priorities, the survey asks participants to choose
between a sequence of scenarios. Each scenario is made up of two transport
attributes as illustrated in Figure 11.
Figure 11: Question example
99. The survey asked people (individuals, not companies) to choose between the following
attributes for travel on New Zealand roads:
Table 5: Attributes, choices and alternatives
Attribute Choice question Inferior Superior
alternative alternative
Local travel Travel to work in a 30 minutes 20 minutes
time city (about 10km)
takes...
Reliability Due to unexpected 30 minutes 15 minutes
road delays, one longer than longer than
trip each week usual usual
takes...
Long distance A 200km trip on 2 hours 45 2 hours 15
travel time main roads takes... minutes minutes
Smoothness The road is... rough for a always
quarter of the smooth
trip
Household Total household is $25 (or stays the
cost travel spend... $10) more same
each week
Not Government Policy Page 34 of 87Safety Each week... 6 people die 5 people die
in road in road
crashes crashes
Environment Carbon dioxide stay the same drop by 20%
emissions from
transport...
100. Overall, safety ranks highest (i.e. first or first-equal) for the largest proportion of
respondents, with 39 percent of people ranking it as their highest or highest equal
priority and 70 percent ranking it in their top three options.
101. Household cost is also important for many, with a quarter (25 percent) of
respondents ranking it as their highest or highest equal priority and two-thirds (66
percent) of respondents ranking it in their top three options.
102. Environment (CO2 emissions) balanced in the middle, with a range of extreme
reactions. While 17 percent ranked it their highest or highest equal priority, 21percent
ranked it their lowest or lowest equal priority. Other attributes were more evenly
distributed. A distribution of respondent rankings is shown in Figure 12.
Figure 12: Distribution of respondent rankings
Source: Ministry of Transport
10. Safety across activity classes
103. This section looks at safety performance on roads, in particular deaths and injuries of
car occupants and motorbike riders. Safety is included under the ‘across activity class’
section of this report because road infrastructure improvements, road safety promotion
and road policing each make contributions to safety.
10.1. Road safety in GPS 2015
104. Road safety is a priority in GPS 2015, which includes two specific road safety activity
classes that are focused solely on minimising harm on roads. However, the GPS
includes a number of other activity classes that contribute to road safety outcomes.
Not Government Policy Page 35 of 87Therefore, total road safety funding across the GPS is much higher than the funding for
the two specific activity classes would suggest. GPS 2015 contains a multi class
reporting line for road safety to reflect this. However, NZTA’s first report under this multi
class reporting line is not expected to be available before GPS 2018 is finalised.
105. Activity classes not solely focussed on safety nevertheless contribute to road safety
outcomes including State highway and local road activity classes, and the walking and
cycling improvements activity class. Many road projects contribute to better road safety
outcomes through improved infrastructure such as the Roads of National Significance,
or have a specific road safety objective such as corner realignments.
106. There are two specific road safety activity classes aimed at changing road user
behaviours (which are not achievable through other activity classes):
• Road policing: Investment in road policing aims to reduce deaths and serious injuries
through effective enforcement of regulation, primarily regulation focused on road
users’ behaviour (for example, speed limits and driving under the influence of
alcohol/drugs). The NZ Police are responsible for delivering the outputs in this activity
class. Per annum, the investment ranges for the 2015 – 2018 period is $280 - $290
million at the lower end to $320 – $330 million at the upper end. Based on current
information, the funds will be fully used at the end of GPS 2015 timeframe.
• Road safety promotion: Investment in road safety promotion includes education,
advertising, and raising awareness and public information activities. The NZTA is
responsible for delivering the outputs in this activity class. For the period 2015 –
2018, the investment ranges from $30 million to $31 million at the lower end to $37
million to $38 million at the upper end. Based on current information, the funds will be
fully used by the end of the GPS 2015 timeframe.
107. The NZTA is responsible for managing the fund allocation and reporting on
achievements in these activity classes.
10.2. Road safety indicators
108. Figure 13 shows the fatality rate 12 from 2001-2015. Road deaths declined from 415 in
2006 to 253 in 2013. The pattern with the injury rate is not too dissimilar with the decline
in injuries starting later than the decline in fatalities.
12
The figure for ‘cars’ includes all fatalities other than for motorbikes. There may be a small number of
fatalities among heavy truck or bus drivers and passengers but we do not expected to change the results
signficantly. The rate has been calculated using VKT for light personal vehicles (solid line) and for VKT for light
personal vehicles and light commerical vehicles combined (dashed line).
Not Government Policy Page 36 of 87You can also read