Greater Christchurch Freight Infrastructure Statement - July 2014
←
→
Page content transcription
If your browser does not render page correctly, please read the page content below
Greater Christchurch
Freight Infrastructure
            Statement
               July 2014
Christchurch Freight Infrastructure Statement

Page | 2
Christchurch Freight Infrastructure Statement

Contents
Executive Summary				9

1. Introduction					17

2. Summary of freight forecasts			                   23

3. Infrastructure, land use and freight movement 27

4. Sea Capacity assessment			                        35

5. Rail Capacity Assessment			                       53

6. Air Capacity Assessment			                        61

7. Road capacity assessment			                       67

8. Supply Chain Assessment			                        83

9. Concluding Remarks				89

10. Glossary					93

                                                            Page | 3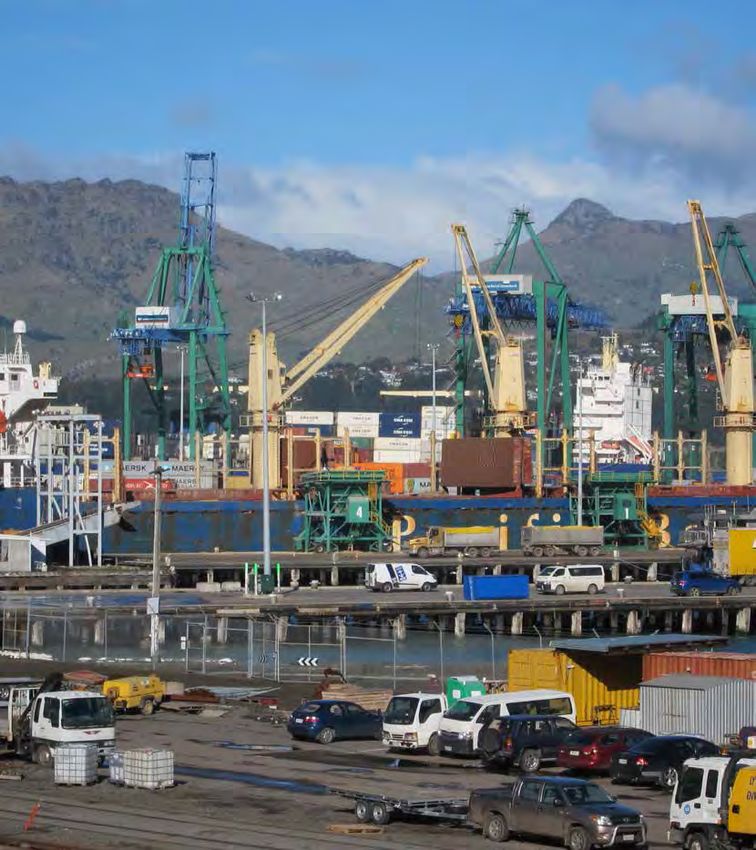
Christchurch Freight Infrastructure Statement

 Figures
 Figure 1 – Approximate road container capacity - 2041
 Figure 2 - Greater Christchurch Freight Study components
 Figure 3– Greater Christchurch transport infrastructure
 Figure 4 - Lyttelton Port – Import distribution network and tonnage (2010 values).
 Figure 5 - Lyttelton Port – Export distribution network and tonnage (2010 values).
 Figure 6 - Export distribution by commodity and tonnage (2010 values)
 Figure 7 - Import distribution by commodity and tonnage (2010 values)
 Figure 6 - Lyttelton Port of Christchurch layout
 Figure 7 - Evans Pass route
 Figure 8 - Dyers Pass route
 Figure 9 - Gebbies Pass route
 Figure 10 - Summary of Port storage utilisation metrics against time (shown against upper & lower bound con-
 tainer throughput)
 Figure 11 - Summary of Port berth utilisation metrics against time (shown against upper & lower bound container
 throughput)
 Figure 12 - Storage utilisation for 2013 and 2041
 Figure 13 - Berth Utilisation for 2013 and 2041
 Figure 14 - Assumed road container capacity in 2041, Source GCTS supplementary documentation.
 Figure 15 - Assumed rail container capacity in 2041. Source GCTS supplementary documentation.
 Figure 16 - Assumed total LPC container throughput 2041. Source GCTS supplementary documentation.
 Figure 17 - KiwiRail rail lines (in RED) in the Greater Christchurch study area
 Figure 18 - Predicted growth in train movements by rail line around Christchurch
 Figure 19 - Annex Road level crossing and Middleton Yard
 Figure 20 - 2021 AM HCV Volume Plots
 Figure 21 - 2021 PM HCV Volume Plots
 Figure 22 - Breakdown of tonnage movements on rail and road as a result of imports through Lyttelton
 Port
 Figure 23 - Distribution of imports though Lyttelton
 Figure 24 - Breakdown of tonnage movements on rail and road as a result of exports through Lyttelton
 Port
 Figure 25 - Annual vehicle movements on key roads within the region due to import and exports
 Figure 26 – Possible theoretical road container capacity through Lyttelton Tunnel in 2041.
 Figure 27 - Brougham Street
 Figure 28 - PM Saturn plot of Brougham Street
 Figure 29 - Curletts Road
 Figure 30 - Annex Road level crossing

Page | 4
Christchurch Freight Infrastructure Statement

Figure 31 - Whiteleigh Avenue level crossing
Figure 32 - Lyttelton Tunnel
Figure 33 - Possible effects of the Christchurch rebuild (HCV’s per day)
Figure 34 – Typical Canterbury Supply Chain

Tables
Table 1 - Approximate volume and value of freight moved through Greater Christchurch by mode
Table 2 - Approximate volume and value of freight moved through Greater Christchurch by mode
Table 3 - Summary of projected growth by commodity (2010 to 2041)
Table 4 - Updated measure (containers) or commodity through Lyttelton Port
Table 5 - Current facilities at Lyttelton Port
Table 6 - Freight Breakdown Summary
Table 7– Actual and Forecast Freight Breakdown Summary
Table 8 - Freight Breakdown Summary - Utilisation Metrics
Table 9 - Freight Breakdown Summary
Table 10 - Freight summary with constraint by time
Table 11 - Comparison of various aircraft freight capacities (source: CIAL)
Table 12 - CIAL forecasts for changes in freight through the airport (source:CIAL)
Table 13 - Glossary

                                                                                                                  Page | 5
Christchurch Freight Infrastructure Statement

Page | 6
Christchurch Freight Infrastructure Statement

Executive Summary

                                               Page | 7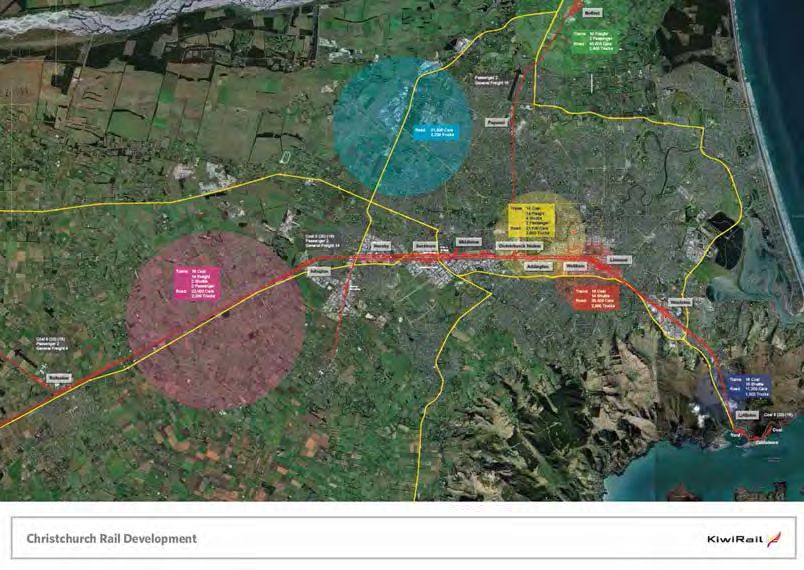
Christchurch Freight Infrastructure Statement

Page | 8

Christchurch Freight Infrastructure Statement

Executive Summary
Introduction
The Greater Christchurch Transport Statement (GCTS) partnership was formed in 2012 and consists of members
from NZ Transport Agency (NZTA), KiwiRail, Lyttelton Port Company Limited (LPC), Christchurch International
Airport Limited (CIAL), Christchurch City Council (CCC), Selwyn District Council, Waimakariri District Council,
Environment Canterbury and the Canterbury Earthquake Recovery Authority (CERA).
This partnership has collectively estimated freight growth forecasts for the Greater Christchurch region and has
commissioned Aurecon to validate these forecasts and explore options to improve and increase the resilience of
freight logistics across Greater Christchurch to respond to this growth.
As part of the wider package of works commissioned, a Freight Demand Statement was developed outlining the
current and future freight demand in Greater Christchurch.
The Freight Infrastructure Statement provides the partnership with a view on the capacity of the freight
movement infrastructure and its interaction with the current or future supply chains.
Finally, a Freight Management Directions Statement will identify interventions and improvements to optimise the
capability and resilience of the existing freight infrastructure.

The importance of freight in Canterbury
This report considers the impact of freight growth on the transport network and supply chain capability. A key
driver in assessing the impact of freight growth is the increase in volume of freight being moved. However, this
takes no account of the unit value of freight being moved through the network. We have estimated the value of
freight and compared this to volume carried by mode. This is represented in Table 1.

          Mode                Volume (tonnes)           % of total Volume                  Value                   % of total Value

                                     25,000                      0.1%                     $2.39bn                         4.0%

                                   5,297,579                    31.0%                     $18.9bn                        31.6%

                                   3,251,447                    19.0%                     $8.3bn                         13.7%

                                   8,524,026                    49.9%                     $30.4bn                        50.8%

Table 1 - Approximate volume and value of freight moved through Greater Christchurch by mode

                                                                                                                                   Page | 9
Christchurch Freight Infrastructure Statement

 Overview of Current Infrastructure Use
 Aurecon has considered transport infrastructure associated with four modes, namely: sea, rail, road and air.

 Sea Freight – Lyttelton Port
 Over half of all freight moved through Christchurch is moved through Lyttelton Port, with dairy related products
 and coal forming a large component of the volume.
 Lyttelton Port has identified land as a constraint on freight growth and accordingly is currently undertaking
 reclamation works to address this. The port has commenced a reclamation programme in Te Awaparahi Bay to
 provide additional space for their container terminal. The Port’s current resource consent allows for 10 hectares
 of reclamation. This work forms part of the Port’s Master Development Plan.
 Our assessment indicates that the 10 hectare reclamation underway will provide sufficient space for container
 storage to meet the lower bound growth estimate, assuming technology used in the future remains as per that
 used currently. Considering the upper bound growth and including the 10 hectare reclamation underway, there
 may be insufficient storage at both LPC and City Depot (Woolston) by around 2022, which would require the 20
 hectare reclamation brought forward to meet this constraint. Under the upper bound growth scenario, container
 storage would reach capacity around 2031 with both the 10 hectare consented reclamation, and 20 hectare
 planned reclamation.
 In terms of additional storage space there are a number of possible options:
 •   Reclamation at the existing Port to create more land for storing containers.
 •   Technical improvements supporting more efficient operation.
 •   Increase the land available at CityDepot, which already happening with expansion towards Curries Road.
 •   Provide additional storage space at a second inland port with good road and rail connectivity.
 Based on current GCTS projections, additional reclamation beyond the 10 hectares consented will be required
 by around 2030, when we forecast (using existing stacking technology) that the port will exceed its current
 planned (and consented) reclamation for container storage purposes.
 Increasing requirements for container storage land and growth in the use of rail associated with the dairy industry
 results in CityDepot operating near capacity. In terms of expansion, this site is constrained by both various land
 owners and the current configuration of the rail siding and is therefore unlikely to expand beyond its current
 footprint.

 Rail Freight
 Rail transports approximately 19% of all freight moved though Christchurch
 Three lines converge in the vicinity of Christchurch:
 •   The Main South line, connecting LPC to Invercargill via Christchurch and Rolleston;
 •   The Main North Line, commencing at Addington, and connecting to Picton; and,
 •   The Midland Line, connecting the West Coast to the Main South Line at Rolleston.
 Major movements include dairy product for export from Fonterra processing plants in Clandeboye (via Temuka)
 and Darfield; Synlait and Westland Milk via Rolleston. This product is either moved directly to LPC for export, or
 staged at City Depot and transferred to LPC via road, through Lyttelton road tunnel.
 Middleton Yard is an important location for KiwiRail and is used to stage freight from the north carrying
 domestic freight for local and regional distribution, and export product to Lyttelton. There is also a coal wagon
 maintenance facility located here. Import/Export (IMEX) product staged at Middleton and travelling to and from
 LPC is typically transported via road.
 •   The trains moving domestic freight are typically broken up at Middleton to allow local distribution and

Page | 10
Christchurch Freight Infrastructure Statement

    consolidation of freight. This means that trains will be shunting in the vicinity of Middleton Yard, reducing the
    capacity of the Yard with a probable impact on local level crossings (particularly Whiteleigh Avenue and Annex
    Road).
•   Freight trains destined for export typically travel straight through the Yard (and higher speed than those
    associated with shunting, etc.), and as such have a reduced impact of level crossings.
KiwiRail has identified that the current configuration of Middleton Yard will reach capacity in the next five to ten
years under current freight growth trends. However, additional land is available in close proximity to the site
should there be a desire to develop Middleton Yard to meet growth in freight volumes carried by rail for container
transfer.
Consolidation of services supporting IMEX where efficient container transfer can take place, supporting local and
regional distribution would improve both the efficiency of movement between Lyttelton and the Main South Line
through Christchurch and limit the impact of increased train paths on level crossings along the corridor.

Air Freight – Christchurch International Airport
Christchurch International Airport (CIAL) provides import and export services for high value and time sensitive
freight; and also operates as an air base for New Zealand and international governments to supply food and
materials for Antarctic scientific research. Peak summer movements for the export of stone fruit frequently results
in this product filling all available air freight capacity. However (and a key problem for airlines and dedicated
freighter services) at other times of the year there would typically be excess capacity on aircraft.
The majority of the constraints to growth are a direct result of efficiency gains in the airline industry and the move
towards single aisle aircraft on trans-Tasman routes (a key export destination for freight moving through the
airport). Maximising the opportunities around passenger growth during the peak summer months to meet the
demands of the peak produce export season as the two services are intrinsically linked. This would allow more
freight to be moved through the airport using a regular passenger service on wide bodied aircraft, without the
need for a specific freight service. Two additional areas of strength for Christchurch International Airport include:
•   Continued support of all Antarctic support services located at CIAL which may also involve attracting other
    Countries to have a base managed out of Christchurch.
•   Dakota Park is located in an ideal position to help consolidate operations of freight movement being well
    located in relation to the airport and strategic road network.

Road Freight
Whilst both Waimakariri and Selwyn Districts have freight origins in their respective districts, Selwyn is a
particularly high producer of freight (including dairy, lamb and wool, seasonal produce and timber) which is
predominately moved across their local road networks to the state highway network and then on to processing
plants (‘farm gate’ to plant). Dairy production in the Greater Canterbury region is expected to double by the year
2025 and be almost 3.5 times its current production by the year 2041, with a corresponding increase in HCV
movements from farm to processing plant supporting an increase in rail trips from processing plant to Port for
export.
Aurecon has established the origins and destinations of freight by commodity based on point of production and
have also estimated the mode of travel of freight for both imports and exports.
Based on origin/destination, we have been able to approximate the distribution of freight on the transport network.
Using existing mode splits we are further able to distinguish between road and rail forecast increases in volumes
(assuming a constant mode share between road and rail transport).
The completion of the Christchurch Southern Motorway Stage 1 (CSM1) has put additional pressures on
Brougham Street (SH76), Shands Road and Springs Road during the peak periods. The opening of CSM stage 2
(CSM2) may have a relieving effect on Shands Road and Springs Road.
A constraint in the movement of freight during the day is Brougham Street. We have established that this corridor
is used for export travelling towards LPC, while also being utilised extensively for the movement of local freight to
and from distribution centres and customers in the greater Christchurch area. The route is particularly busy during
peak times, with a large east/west movement and also significant cross movement with commuters travelling in to
the CBD area.

                                                                                                                   Page | 11
Christchurch Freight Infrastructure Statement
Figure 1 – Approximate road container capacity - 2041
Figure 1 highlights the theoretical capacity of the road network on the approach to Lyttelton, through the road
tunnel and indicates a TEU capacity significantly in excess of current volumes (and those predicted by Aurecon
in 2041) assuming a move to 24 hour operation.
Road infrastructure is utilised at significantly different levels throughout the day and there appears to be
significant gains from making more use of what we have, whilst getting more out of the supply chain. Soft
measures use existing assets in the network and their implementation is only limited by the time taken to develop
the measures.
Optimisation through soft measures may be achieved through such methods as:
• Shifting non time dependent goods outside peaks hours. This requires industry participation and the buy in
from the customer.
• Using an interactive information sharing system to help relevant parties optimise freight movement across
Christchurch.
• Introducing acknowledged freight corridors where goods can be moved outside peak hours.
Christchurch Re-Build
Significant volumes of material will be required for the re-build, representing approximately 760,000 HCV
movements. A large proportion of this movement will be between the Port and City and as such, is likely to be
concentrated on connections such as Brougham Street. It should also be noted that the construction industry
uses a large and diverse range of commodities some of which will be delivered in bulk to sites, and some of
which will be small scale local deliveries. This creates a broad range of vehicle movement.
Network Resilience
Lyttelton Tunnel currently represents a significant constraint in terms of overall network resilience with hazardous
goods travelling through the tunnel. The desirable longer term option is for these goods to be transported over
Evans Pass once the Sumner Road can be reopened. The level of remedial works to satisfy all road users on
Sunmer Road will determine whether some operators will be comfortable using that road once it is reopened.
The other alternative routes over Dyers Pass and Gebbies Pass are circuitous and incur greater costs and
distances travelled along with the result being that they are less suitable for heavy vehicle transport. In the event
that an incident occurred in the tunnel with a hazardous good vehicle, this could close the tunnel for a prolonged
period, with significant impacts on Lyttelton. Furthermore, large volumes of both exports and imports travel
through the tunnel, and a prolonged closure could have major effects on the economy of Canterbury.
Sumner Road and Causeway are areas that may have ongoing resilience issues when considering alternative
access route from the port. Cliff face collapse at Peacocks Gallop (between Sumner and Redcliffs) is an example
of the problems faced by this route.
Other resilience issues include:
• Stability of SH74 around the oxidation ponds on Dyers Road, were significantly damaged in the earthquakes
and the risk remains.
Page | 12Christchurch Freight Infrastructure Statement
• Bridge crossings of the Waimakariri River and Ashley River.
• Bridge crossings over the Heathcote and Avon Rivers within the Christchurch city area.
Supply Chain
The Christchurch supply chain system not only acts to service the Greater Christchurch region but also is heavily
involved with the supply of freight throughout the entire South Island. As Christchurch has the largest Sea Port
and Airport it is in the best position to service distribution of large number of stores throughout the Island. Our
analysis of population, employment and land use suggests a growing demand for freight related activity in the
south and west of Christchurch, reflecting the increase in population and employment in this location.
It has been identified that a significant amount of freight is either trucked or sent on rail from the North Island and
this is a direct response to the use of established freight routes. Given the importance of Christchurch in local
and regional distribution, and the size of the local market, a number of Distribution Centres and freight forwarders
are located along the Main South Line corridor between Hornby and Middleton. From here, freight is distributed
to end users in and around Christchurch, or transported to other locations in the south island, predominantly by
road.
Page | 13Christchurch Freight Infrastructure Statement Page | 14
Christchurch Freight Infrastructure Statement

Section 1
Introduction
                                        Page | 15
Christchurch Freight Infrastructure Statement Page | 16
Christchurch Freight Infrastructure Statement

1. Introduction
1.1      Purpose of the study
The Greater Christchurch Transport Statement (GCTS) partnership was formed in 2012 and consists of
members from New Zealand Transport Agency (NZTA), KiwiRail, Lyttelton Port Company Limited (LPC),
Christchurch International Airport Limited (CIAL), Christchurch City Council (CCC), Selwyn and Waimakariri
District Councils, Environment Canterbury and the Canterbury Earthquake Recovery Authority (CERA).
This partnership has collectively estimated freight growth forecasts for the Greater Christchurch region and has
commissioned Aurecon to validate these forecasts and explore options to improve and increase the resilience
of freight logistics across Greater Christchurch to respond to this growth. The growth forecasts together with
an assessment of freight origins and destinations is included in the first of three reports, the Freight Demand
Statement.
As part of the wider package of works commissioned, a Freight Infrastructure Statement is to be developed
outlining the current and future freight demand in Greater Christchurch. The Freight Infrastructure Statement
will lead on to the development of a Freight Management Directions Statement. This document will provide the
partnership with a view on the capacity of the freight movement infrastructure and its interaction with the current
or future supply chains. Finally, a Freight Management Directions Statement will identify interventions and
improvements to optimise the capability and resilience of the existing freight infrastructure.

                                                   Freight Demand Statement
 Origins and destinations          Commodities                  Freight hubs and              Validation of forecast
                                                                generation points             growth

                                                Freight Infrastructure Statement
 Current capacity assessment                  Assessment of infrastructure and      Key constraints and improvement
                                              supply chain capability               opportunities

                                          Freight Management Directions Statement
 Measures to optimise capacity                Options for land use responses        Soft and hard improvement
                                                                                    measures

Figure 2 - Greater Christchurch Freight Study components

1.2      Aims of the Freight Infrastructure Statement
This document is known as the Freight Infrastructure Statement. It is a desktop review of information, data and
forecasts from a variety of sources (some public and some private), together with an assessment of the impacts
of projected growth in freight during the CGTS timeline up to 2041. While the overall Greater Christchurch
Freight Study will seek to develop options to improve infrastructure and capacity, remove bottlenecks in supply
chain efficiency and propose measures that would focus actions to maximise the economic development of the
region. The Freight Infrastructure Statement seeks to provide an understanding of the current capacity of the
network and freight infrastructure and seeks to identify key constraints to meeting that growth whilst identifying
improvement opportunities which will be taken forward in subsequent reports.

                                                                                                                       Page | 17
Christchurch Freight Infrastructure Statement
1.3 Report structure
The Freight Infrastructure Statement has the structure shown below. The structure is designed to describe
and document current capacity of the freight system in Greater Christchurch together with an assessment of
infrastructure and supply chain capability:
Section 2 Summary of Freight Forecasts. This section contains an overview of the Freight Demand
Statement produced by analysing trends in commodity growth and population and employment
data from Statistics New Zealand to provide context for the demand for import containers.
Section 3 Infrastructure, Land Use & Freight Movement. This section contains an overview of the existing
freight-related infrastructure in the region, and provides a commentary of land use and its
relevance in the context of freight.
Section 4 Sea Capacity Assessment. This section describes the current operational arrangement at LPC
and the freight supply chain associated with the Port. An assessment of capacity has been
undertaken which has been used to identify possible future constraints to meeting projected
growth in the throughput of freight.
Section 5 Rail Capacity Assessment. This section contains considers the current and future rail related
infrastructure and its ability to accommodate the future freight task.
Section 6 Air Capacity Assessment. This section assesses the impact of projected airport freight growth and
the current infrastructure available to accommodate that growth. It describes opportunity to grow
market share of freight handled by the Airport an
Section 7 Road Capacity Assessment. This section contains an analysis of current infrastructure, and
considers the impact of the projected freight growth origin and destination on the local highway
network. This section considers specifically freight related traffic on roads in Christchurch City,
Selwyn District and Waimakariri District. The section also considers network resilience.
Section 8 Supply Chain Assessment. This section considers the current capacity restriction in the supply
chain and looks at potential future development to the supply chain that would
Section 9 Concluding Remarks. This section summarises the information presented in Sections 3 to 8, in
the context of providing a reliable set of overarching freight demands, to be used in subsequent
project stages.
1.4 Volume and value of freight in Greater Christchurch
This report considers the impact of freight growth on the transport network and supply chain capability. A key
driver in assessing the impact of freight growth is the increase in volume of freight being moved. However, this
takes no account of the unit value of freight being moved through the network.
Table 2 below shows that whilst the volume of freight moved by air is relatively small in comparison to other
modes, the value is high. Indeed, the value of exports is higher than other airports in New Zealand reflecting
the high value stonefruits/seafood and gold/gems and other high value export products. In this case, the value
of freight moved through the airport is approximately 40 times it’s volume. Whilst this Statement considers the
impact of increasing volumes of freight carried through Greater Christchurch, there is discussion in subsequent
sections on the opportunities to increase the proportion of higher value freight transported through Christchurch
International Airport
Page | 18Christchurch Freight Infrastructure Statement
Mode Volume (tonnes) % of total Volume Value % of total Value
25,000 0.1% $2.39bn 4.0%
5,297,579 31.0% $18.9bn 31.6%
3,251,447 19.0% $8.3bn 13.7%
8,524,026 49.9% $30.4bn 50.8%
Table 2 - Approximate volume and value of freight moved through Greater Christchurch by mode
Page | 19Christchurch Freight Infrastructure Statement Page | 20
Christchurch Freight Infrastructure Statement

     Section 2
Summary of freight
        forecasts
                                               Page | 21
Christchurch Freight Infrastructure Statement Page | 22
Christchurch Freight Infrastructure Statement

2. Summary of freight forecasts
2.1      Freight Demand Statement Summary
The Freight Demand Statement concluded that due to the large population and employment located in and
around Greater Christchurch, as well as the production of export commodities throughout Canterbury, the
region plays a critical role in the production of goods for domestic and international markets. As described in
this statement, production of a number of major commodities is growing, particularly dairy and other agriculture.
Producers are heavily reliant on the efficient movement of their freight from the point of production, through the
manufacturing process to the port for export. Inefficiencies in these supply chains, in particular congestion issues
relating to road, rail and port access, add costs to businesses and impact more broadly on overall productivity
and the nation’s economic health.
Current freight demand in the Greater Christchurch region is concentrated primarily on the export of a number of
key commodities, including: dairy and milk products, meat products, coal, logs and timber products. Increasingly,
these products are transported to LPC by rail, particularly dairy products (transported by rail from Clandeboye,
Darfield and Rolleston) and coal (transported by rail from the West Coast).
This is putting increasing pressure on existing rail infrastructure and adding to congestion in the Woolston area,
around LPC’s City Depot site. Currently, however, all containers transported between the City Depot and LPC
currently use road transport.
Imports from LPC through the Greater Christchurch region are commodities such as dry bulk and petroleum.
General container freight used for domestic consumption is also imported in significant quantities through LPC.
The majority of this freight is transported through Greater Christchurch and the wider Canterbury region and
South Island by road.
The primary aim of this statement has been to analyse and validate the growth forecasts as outlined in the
GCTS. Publicly available data has been used to compare trends in historical information to the forecast growth.
Where significant differences were encountered for particular commodities, alternate data sources were
interrogated and considered, to determine likely reasons for these discrepancies and, if required, to formulate
alternate forecasts.
A comparison of the forecasts outlined in the GCTS and the alternate forecasts provided in this report is shown
in Table 3 - Summary of projected growth by commodity (2010 to 2041).

                                         30 Year Assumption
      Measure or commodity                                2010         2041            Growth
Population                                            435,000       550,000               0.9%
Employment                                            200,000       244,000               0.7%
Containers (TEU) (lower)                              290,000       782,000               5.5%
Containers (TEU) (upper)                              290,000      1,500,000             *5.3%
Air Freight (tonnes)                                   25,000       107,000              10.6%
Dry bulk (tonnes)                                     660,000      1,200,000              2.6%
Petroleum (tonnes)                                  1,000,000      1,371,000              1.2%
Logs (tonnes)                                         250,000       739,000               6.3%
Coal (tonnes                                        2,300,000      3,000,000              1.0%

Table 3 - Summary of projected growth by commodity (2010 to 2041

* Compound Annual Growth Rate (all other growth rates are based on annual linear growth)
Bold numbers updated from the original GCTS values.

                                                                                                                  Page | 23
Christchurch Freight Infrastructure Statement
The Freight Demand Statement concluded that the GCTS growth forecasts appear significantly higher than
indicated in historical information available for container trade, dry bulk, petroleum and coal.
For example, container volumes are driven primarily by dairy and meat exports and imports of consumer goods.
Analysis of dairy and meat production does show that increases in exports of these products is likely, but is
unlikely to be high enough to drive an overall container movement growth of approximately 5.3% compounding
annually. However, the GCTS forecast may consider an increase in the South Island share of shipping due
to the possibility of allowing larger ships, and this could help increase the overall total, although there remains
competition within New Zealand given the relative proximity of ports to one another. Aurecon therefore have
recommended in this case to provide a range of forecasts, a lower bound based on continued strong growth, and
an upper bound based on compounding growth that considers these other factors.
It is worth noting that 2013 volumes are now available from LPC and are reproduced below.
Year
Measure or commodity 2010 Year to 30 June Percentage
2013 change
Containers (TEU) 290,000 351,217 +21%
Dry Bulk (tonnes) 660,000 649,365 -1.6%
Petroleum (tonnes) 1,000,000 1,111,189 +11.1%
Logs (tonnes) 250,000 369,657 +47.9%
Coal (tonnes) 2,300,333 2,049,949 -10.9%
Table 4 - Updated measure (containers) or commodity through Lyttelton Port
Page | 24Christchurch Freight Infrastructure Statement
Section 3
Infrastructure, Land
use and freight
movement
Page | 25Christchurch Freight Infrastructure Statement Page | 26
Christchurch Freight Infrastructure Statement

3. Infrastructure, land use and freight
movement
3.1     Location of transport infrastructure
The GCTS aims to provide a basis for the development of a transport system that will support the efficient
movement of people and freight across the region. To illustrate the current movement of freight, this section
contains an overview of the existing freight-related infrastructure in the region.
Each area of freight activity will be further described below:
1. Lyttelton Port of Christchurch (LPC). The Canterbury region is a major producer of primary produce;
   consequently, LPC is the primary export hub for freight leaving the region but also handles a significant
   proportion of the imports. For example, high volumes of milk and dairy products, logs and timber products,
   livestock, meat and coal are produced in Canterbury. Much of this output is sent through Christchurch to LPC
   for export to international markets [50-60].
2. Christchurch International Airport. Operated by Christchurch International Airport Limited (CIAL), this is
   the major gateway airport for the South Island. It plays an important role in imports and exports of various
   commodities produced in Greater Christchurch and also in the wider South Island region. Data indicates
   that CIAL is primarily an export hub [20], with approximately 25,500 tonnes moving through CIAL in the year
   to April 2011. Of this volume, only 7,500 tonnes were imported (30%), with the remainder being exported
   through CIAL (70%). The major commodities exported through CIAL include: seafood, minerals and precious
   stones, meat and dairy products [20].
3. CityDepot. LPC operates an off-port container operation called CityDepot. This site is located in Chapmans
   Road in Woolston and provides a centralised point in Christchurch for the collation of (primarily) export
   maritime containers and the re-positioning of empty containers for major producers [50-60].
4. Middleton Rail Terminal. KiwiRail operates an intermodal terminal in Middleton, Christchurch. This location
   is linked to the KiwiRail network and plays an important role in transporting general containerised domestic
   freight between Christchurch and the North Island (Auckland in particular) . [1-4].
5. On-site rail sidings. Examples of dedicated sidings on the South Island that are of relevance to Greater
   Christchurch, are Fonterra’s Temuka and Darfield sites (not shown on map), where export containers are
   packed, loaded onto trains and moved to LPC for export. Similarly, Westland Milk’s Rolleston plant uses a
   rail siding to consolidate its containers onto rail for export through LPC. Dedicated on-site rail sidings also
   exist on the West Coast, for the loading of coal trains for transport to LPC for export.
6. Distribution Centres. Distribution centres in Greater Christchurch include: Countdown’s Christchurch
   Regional Distribution Centre in Hornby; Kathmandu’s National Distribution Centre in PortLink and Croxley
   Distribution Centre in Hornby. The Warehouse South Island Distribution Centre is located at Rolleston.
7. Izone. Located in Rolleston, Izone business hub is an 8 minute drive from the nearby Hornby industrial area
   in south-west Christchurch. Half of the 180 hectare greenfield industrial development is complete. Izone is
   owned by Selwyn District Council; and is located in close proximity to road and rail infrastructure.
Within Greater Christchurch, there are other areas with significant commercial activity (such as Belfast). While
these have been excluded from the list above, they are important for transport in Christchurch, but discussion of
this type of area on an individual basis, is beyond the scope of the statement.

                                                                                                                   Page | 27
Christchurch Freight Infrastructure Statement
Figure 3– Greater Christchurch transport infrastructure
While all arterial roads are important for the movement of freight, the current key road linkages are those that
allow primary access into, or through, Greater Christchurch from their origin to destination. These are described
in more detail below:
A. Lyttelton Tunnel / Tunnel Road (SH74). Lyttelton Tunnel provides a tunnel with one lane in each direction,
from Heathcote Valley (southeast of Christchurch) through to Lyttelton. Due to the closure of Sumner Road
following the 2011 earthquakes, it provides the only viable road connection between Christchurch and LPC
for the movement of freight. As a result, all hazardous goods must use the tunnel; and special restrictions are
in place to minimise the risk of damage and collision (further discussed in Section 7.9).
Lyttelton Rail Tunnel. With a similar alignment to Lyttelton Tunnel, this rail tunnel connects Lyttelton and
Christchurch, and facilitates the transport of some freight between LPC and its markets. This includes the
transport of containers (a large proportion being export dairy products), as well as coal from the west coast of
the South Island. Each of these is discussed in later sections of this statement.
B. Sumner Road. Sumner Road provides an alternative road network link between Lyttelton and Christchurch,
and used to be the route taken for trucks carrying hazardous goods, including fuel from the storage facility at
LPC. It was severely damaged in the 2011 earthquakes, and has not re-opened to traffic, although there are
several different proposals (and associated costs) being put forward to reconstruct the link.
C. Christchurch Northern Motorway (SH1S). This link provides the main connection between Christchurch and
northern areas of the South Island. It runs adjacent to the river crossing via the Main North Road and the
Main North Trunk Line. The only other alternative is Waimakariri Gorge Road (which is Route 72) a further 50
kilometres to the west.
Main North Trunk Line. This is the main rail line that connects Christchurch through to the northern areas of
the South Island including Blenheim and eventually Picton. This line then joins up with the Interisland Ferry to
transport freight (and passengers) to and from the North Island of New Zealand.
D. Russley Road (SH1S). This road link provides bypass functionality for vehicles travelling through Greater
Christchurch from the southwest to the north (and vice-versa), as well as connecting outlying and regional
areas to Christchurch International Airport, without the need to enter Christchurch itself.
E. West Coast Road (SH73). As the name suggests, this road link connects Christchurch with the West Coast
(via Arthurs Pass) and is a considerably shorter route to Greymouth compared to the northern alternative
(State Highway 7). This road also provides a link between western areas of Canterbury and Christchurch.
F. Midland Line. The Midland Line provides the rail connection between Greymouth on the west coast of the
South Island, through to Rolleston, southwest of Christchurch, where it connects with the Main South Trunk
Page | 28Christchurch Freight Infrastructure Statement
Line, and through to Christchurch. For freight, it is used to transport coal between areas on the west coast to
be exported at LPC.
G. Main South Road (SH1S). This road provides the main link between Christchurch and southern regions of the
South Island. Further south, it crosses the Rakaia River, whose only other crossing location is approximately
40 kilometres to the west at the Rakaia Gorge on SH77.
Main South Trunk Line. This line provides the only rail access to the southern regions of the South Island.
In connects from Invercargill in the south, through to Rolleston (connecting with the Midland Line), to
Christchurch (connecting to the Main North Trunk Line), and eventually through to LPC at Lyttelton.
Brougham Street (SH76). Brougham Street serves several purposes, including the main line to transport
freight between LPC and markets southwest of Christchurch, as well as being adjacent to a hub of major
commercial activity that stretches from Woolston in the east through to Middleton in the west (where
Brougham Street becomes the Christchurch Southern Motorway); approximately 8 kilometres from one end to
the other.
3.2 Freight Movement in the Network
As we presented in the Freight Demand Statement, information on freight movements within the Greater
Christchurch region, or, more broadly, movements across the South Island, is limited in the public domain. The
only publicly available information on these movements is the historical data contained in the NFDS (2014);
however, this information is broken down to a Regional Council level, meaning that the finest detail possible for
this report is to show movements into, out of and within Canterbury.
We have analysed available data, and passed on location of population, estimated the destination of imports by
mode. This has been completed for imports and exports, with the corresponding distribution and tonnage shown
below. The key element of distribution infrastructure for imports is road based, with destinations within greater
Christchurch and the south west accounting for the majority of movement. This is an important consideration as
the movement of, and growth in freight supporting imports is closely aligned to population.
Figure 4 - Lyttelton Port – Import distribution network and tonnage (2010 values)
Page | 29Christchurch Freight Infrastructure Statement Figure 5 - Lyttelton Port – Export distribution network and tonnage (2010 values) In terms of tonnage, movement of export freight through greater Christchurch is dominated by the use of rail, reflecting the trend in the coal and dairy industries to use rail between processing points and export. Accordingly, rail moves significant volumes as presented in Figure 5. The distribution reflects the location of dairy industry processing plants towards the west and south of Canterbury. The above distribution is shown graphically in Figure 6 - Export distribution by commodity and tonnage (2010 values) and Figure 7 - Import distribution by commodity and tonnage (2010 values) Page | 30
Christchurch Freight Infrastructure Statement

Figure 6 - Export distribution by commodity and tonnage (2010 values)

Figure 7 - Import distribution by commodity and tonnage (2010 values)

                                                                                                           Page | 31
Christchurch Freight Infrastructure Statement Page | 32
Christchurch Freight Infrastructure Statement

Section 4
Sea Capacity
 Assessment
                                         Page | 33
Christchurch Freight Infrastructure Statement Page | 34
Christchurch Freight Infrastructure Statement
4. Sea Capacity assessment
4.1 Background
This section contains the validation of employment forecasts for the background.
Lyttelton Port of Christchurch is the South Island’s major commercial deep water port, located in the Christchurch
suburb of Lyttelton, on the northern shores of Lyttelton Harbour. Established as a Port in 1849, Lyttelton has
developed in to a container trade hub port for the South Island.
The Port caters for containers as well as the loading and unloading of bulk products including petroleum,
fertiliser, gypsum, cement, logs, conventional break-bulk, imported vehicles and fishing. It also has one of the
largest coal export facilities in New Zealand. A breakdown of commodities moved through the Port is contained in
the Freight Demand Statement.
The Port currently handles approximately 50% of the South Island’s container cargo; however, there is
competition from both Port Otago Ltd. and PrimePort Timaru (part owned by Port Tauranga). It is noted that
Lyttelton is the export port for the West Coast while imports travel via Nelson.
As discussed in the Freight Demand Statement, the Canterbury region is a major producer of primary produce;
consequently, LPC is the primary export hub for freight leaving the region. For example, high volumes of milk and
dairy products, logs and timber products and meat are produced in Canterbury for export from LPC.
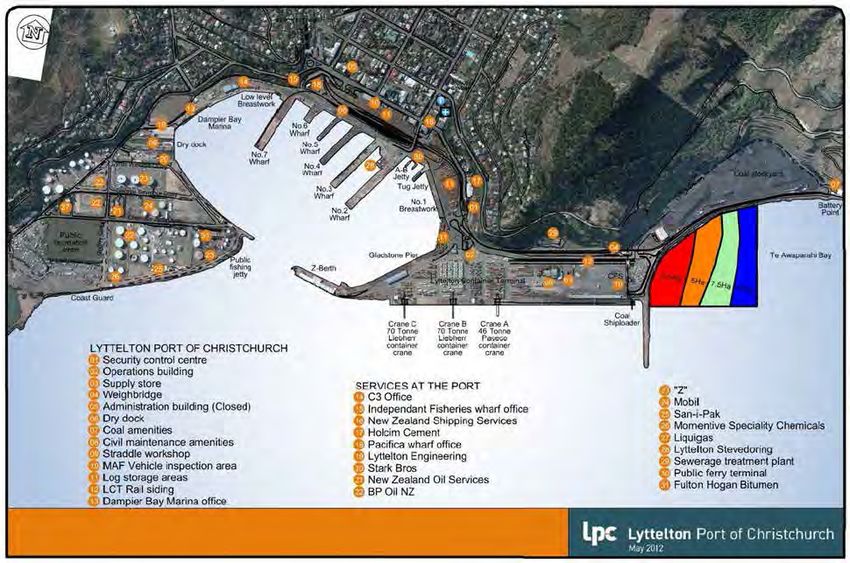
Figure 8 provides an overview of Lyttelton Port of Christchurch’s quay side operations. The Container Terminal is
located at the western end of Cashin Quay on the outer harbour reclamation. Quay side facilities are supported
by CityDepot, an inland container storage and repair facility. Petroleum facilities are located on the western side
of the outer harbour.
The inner harbour wharves and facilities cater for the unloading and loading of bulk products including petroleum,
fertiliser, gypsum, cement, logs, conventional break-bulk, imported vehicles and fishing.
Following discussion, a detailed breakdown of the port infrastructure is provided below in Table 5 - Current
facilities at Lyttelton Port. It is worth noting that Lyttelton Port has continued to operate following the
earthquakes of 2010 and 2011. We have identified two key risks to the freight volumes, and hence infrastructure
requirements associated with LPC:
• Whilst LPC is the largest Port in the South Island, we have not considered the impact of increased port
competition and the resulting effects on freight volume forecast changes on the requirement for infrastructure
investment.
• We understand a Port Consolidation Study is currently being undertaken by the Ministry of Transport
following on from the updated National Freight Demand Study.
Page | 35Christchurch Freight Infrastructure Statement
Figure 8 - Lyttelton Port of Christchurch layout . Source: LPC website.
Table 5 - Current facilities at Lyttelton Port
Structure Description
Cashin Quay CQ1 (coal), CQ2 (currently being re-built) and CQ3 and CQ4. Full cargo handling facilities
Berths with container cranes.
No.2 Wharf A finger wharf, concrete decked to class one highway standard, for discharge of dry bulk
import and general cargoes, and export of logs.
- No.2 East is 270m long, 11.8m deep
- No.2 West is 169m long, 9.3m deep
- Four mobile discharge hoppers - 60 to 90 tonne capacity (can be relocated to other berths)
- Wood faced fender piles
No.3 Wharf A finger wharf, concrete decked to class one highway standard for discharge of dry bulk
import and general cargoes, and export of logs. Also available for lay up and ship repair.
- No.3 East is 195m long, 9.5m deep
- No.3 West is 223m long, 10.6m deep
- D-formed rubber fenders running the full length of the berth face
No.7 Wharf A concrete decked wharf maintained to heavy duty standard and equipped with a heavy duty
pad at No.7 East for quarter ramp vessels and stern roll-on/roll-off vessels.
- No.7 East is 217m long, 10.3m deep
- No.7 West is 187m long, 8.5m deep
- 32 reefer points
Oil Wharf A steel four-berthing dolphin structure, concrete service deck and shore based bollards
suitable for vessels up to 225m long. Used for loading and unloading liquid bulk cargoes and
bunkering.
- 202m long, 12.6m deep
Z Berth Earthquake damaged
No.1 A general cargo berth, 159m long, 9m deep, regularly used for the discharge of bulk cement.
Breastwork - Heavy duty 30m long pad in centre of berth.
In the year ended 30 June 2013, 588 general cargo vessels called at Lyttelton Port.
Page | 36Christchurch Freight Infrastructure Statement
4.2 Containers
The Port’s 13.5 hectare container terminal (as of April 2014) is located on the eastern side of the port, and
provides container storage for approximately 4,000 containers, stacked up to a maximum of three containers
high. However, we note that current stacking is lower to optimise operational efficiency which results in a
maximum container storage of approximately 3700 TEU. The berth depth is currently 13.1m, which, at zero tide,
will allow ships of up to 10.8m draft to berth (with a maximum permissible draught of 12.4m, at high tide).
The container grid is divided into a number of ‘areas’ by a central ‘east-west’ access road and a series of ‘north-
south’ cross road all of which provide access to the grid for straddles.
Designated areas are provided for refrigerated (reefer), imports, exports, general and empty containers as
well as dangerous goods. The reefer area of the container terminal is equipped with electrical points to handle
approximately 720 integral refrigerated containers.
Infrastructure to assist in the unloading and loading of containers includes:
• 3x Container Cranes on approximately 360m of container rails, with a fourth crane expected to become
operational in July 2014.
• 22x Straddle Carriers, with four under construction
• 7x Forklifts
The Container Terminal currently operates Monday to Saturday for manual transactions in addition to Sunday
with kiosk transactions, with restricted hours for all manual transactions. The coal stockyard and marine services
can operate 24 hours a day, seven days a week. Vessels are serviced 24 hours per day, 7 days per week.
The Port provides for containers being received by both road and rail. Truck access is provided at the eastern
end of Norwich / Gladstone Quay (at the end of SH74) directly in to the container terminal. There are seven truck
lanes within the terminal for loading / unloading; with 10 off-road parkup spaces provided at the Cashin Quay
Backroad to allow documents to be completed prior to loading.
In peak periods, trucks have been reported to wait along Cashin Quay Backroad. The Port is currently
considering proposals for an internet based truck booking system which will smooth demands, and therefore
increase certainty over arrival times whilst increasing efficiency at the port entrance.
Separate gate access is provided to the empty container yard (ECY) located at the eastern end of the Port
adjacent to the reclamation being undertaken.
The KiwiRail siding accommodates one 24-wagon train (48 TEU). On average 5 container trains are received
at the container terminal per day. Fonterra’s milk powder exports are received by LPC by rail directly from
their plant in Darfield. The Clandeboye plant operates in a similar way to Darfield, with staging taking place at
CityDepot prior to reaching the Port. Fonterra pack all containers at point of processing to maintain control of
strict quality measures. In general, the proportion of imports and export containers is well balanced at Lyttelton,
and empty containers are also transported via rail to CityDepot and then back to Fonterra’s Darfield and
Clandeboye plants. The turnaround (unload) on each train is approximately 2 hours.
Average length of time a container remains at the Port is 1.9 days for an import container, and 4 days for an
export container.
The Container Terminal has suffered significant damage as a result of the 2011 earthquake including outward
movements of the seawalls and deformation of the pavement. Temporary repairs have allowed the terminal
to maintain operational but significant works will have to be undertaken over the next ten years to repair the
terminal and wharf structures which may impact on port operations. Cashin Quay number 2 will be converted for
use as part of the Container Terminal, having previously been used for general cargo and the cruise ships. The
wharf demolition and stabilisation project on Cashin Quay number 2 is programmed to commence early 2014,
noting that this wharf is currently not operational due to the extent of damage. Once completed during 2015, we
understand the container berth length available will be approximately 600m.
Page | 37Christchurch Freight Infrastructure Statement
Table 6 - Freight Breakdown Summary
Freight % Type
Top four Commodities Are dairy, meat products, coal/fuel and logs and timber products
Approximately 28% of Are empty containers
containers moved
70% of containers Are full
moved
Origin Diary related products are a significant and growing market in Canterbury. Whilst
there are dairy farms throughout Canterbury, there are large dairy processing
plants in Darfield and Clandeboye
4.2.1 Actual Container Volumes
Actual container throughput in the year to 30 June 2013, provided by LPC, was 351,217 TEU, an increase of
140,000 containers over seven years.
Full container movements contribute to approximately 70% of the total container throughput, split equally
between export and import. Empty container movements contribute to approximately 28% of the total container
throughput, with slightly more containers being imported. Other movements, such as deliver, load, restow, shift
on board and outside container terminal, make up the remainder of the terminals container movements.
Empty containers are de-hired at one of three depots in Christchurch (including CityDepot located in Woolston)
and if they are to be repositioned (exported empty) are transported to the Empty Container Yard (ECY) at the
Port. Import empty containers discharged from vessels are collected from the ECY, which has capacity for
870TEUs, with 1200TEU storage available from April 2014.
New development planned for completion in March/April 2014 will result in the ECY moving slightly eastwards
and will increase the ECY capacity to approximately 1,500 TEU (an additional Container terminal capacity of
400-500 TEUs).
4.2.2 Forecasted Container Growth
As presented and discussed in the Freight Demand Statement, LPC’s forecast for container throughput in 2041
is currently around 1.5 million TEU, which reflects a compound average growth rate of 5.3% over a 30 year
period. LPC’s growth assumptions are outlined in the Freight Demand Statement, together with alternative
growth forecasts provided by Aurecon.
A major contributor to this growth is Fonterra’s Darfield Plant, opened in 2012 (with stage 2 completed in 2013).
The first drier produces 85,000 MT of milk powder a year; which equates to approximately 5,000 TEU. When
fully operational, the plant will process 7.2 million litres of milk per day. LPC expect to receive approximately 15,
000 TEU from Darfield in the year to June 2014.
As domestic freight increases (with freight originating from the North Island coming into Christchurch for the
earthquake rebuild), this will lead to an increase in coastal shipping and an increase in the movement of material
from Lyttelton to various construction sites throughout Christchurch.
4.2.3 CityDepot
In addition to the quayside facilities Lyttelton Port of Christchurch operates CityDepot, an off- port container
facility located at Chapmans Road in Woolston, approximately 10 minutes’ drive from Lyttelton through Lyttelton
Tunnel.
The 16 hectare site (comprising 9 hectares at CityDepot and 7 hectares at Curries Road site), primarily a storage
facility for empty containers, is one of three empty container depots in Christchurch, and the only facility owned
by LPC. Currently, approximately 9 hectares is set aside exclusively for the storage of empty containers.
Page | 38Christchurch Freight Infrastructure Statement
This site, of which some is still under development, currently has capacity for approximately 9,000 TEUs which
can be stacked up to between 5 - 7 containers high within the depot. The facility also provides a full range of
container services, such as container repairs, pre-tripping and maintenance.
The depot is serviced by road and rail; with a 24-wagon KiwiRail siding located in the depot. The depot is nearing
capacity and the Port is in the process of expanding its operations into an adjoining site with additional access
off Curries Road.
4.3 Fuel
The Lyttelton Port Tank Farm, located at the western end of the inner harbour, has storage capacity for
approximately 105 million litres of petroleum product including petrol (91, 95, 96 and 98), Diesel, Jet Fuel, and
Bitumen products.
Approximately 1 million tonnes of bulk fuel product was moved through Lyttelton Port during the year ended 30
June 2013. The Tank Farm facilities / and capacity is as follows:
• Two 250mm nominal bore marine discharge units for white products - 1,100 tonnes per hour capacity
• One 250mm nominal bore marine discharge unit for black products - 420 tonnes per hour capacity
• LPG marine unloading arm
• Maximum bunkering rates:
Light fuel oil - 90 tonnes per hour
Marine diesel - 85 tonnes per hour.
The Tank Farm is operated by NZ Oil Services Ltd (NZOSL) with Mobil Oil New Zealand, BP New Zealand, Z
Energy, and Fulton Hogan Bitumen having their own bulk fuel storage tanks within the facility. Additional storage
facilities are provided in Woolston (15 million litres); Christchurch Airport (3 million litres, all jet fuel); and Timaru
(40 million litres). The majority of the fuel is destined for Christchurch; followed by Timaru and Ashburton.
Prior to the Christchurch Earthquakes, petrol was either pumped from the port through a Mobil’s 6.4km pipeline
through the Port Hills down to a depot in Woolston; or transported by tanker across Sumner Road / Evans Pass.
Diesel and jet fuel can only be transported by tanker.
Since the earthquakes the Evans Pass route has been closed, and NZ Transport Agency (NZTA) have permitted
dangerous goods to pass through the Lyttelton Tunnel at night (7pm – 6am), unaccompanied, which is causing
delays to other traffic using the tunnel.
The current procedure is as follows:
• When a tanker (or dangerous good vehicle) is leaving the Tank Farm (west Lyttelton) they advise the
Lyttelton Tunnel Control they are leaving the Port. Tankers arriving from Christchurch typically arrive at the
Heathcote Portal unannounced, and wait in the portal layby.
• The Tunnel Control Centre will then clear the tunnel, which takes approximately four minutes.
• Once given the all clear by the Tunnel Control Centre the tankers will pass through the tunnel
unaccompanied.
• Once the tanker is clear of the tunnel, it will be reopened to all other traffic.
Between eight and 30 dangerous good vehicles can pass through the tunnel a night. In May 2013 NZTA
signalled that temporary arrangement will end when Evans Pass reopens, following requests from BP New
Zealand and Z Energy to transport fuel through the tunnel permanently. A second pipeline has also been
discussed previously; however it is not possible for this to pass through the tunnel.
4.4 Timber
Timber (logs) exports to the year ended 30 June 2013 was approximately 370,000 tonnes. However, following
the large storms in Canterbury in September 2013, the port is currently experiencing a spike in volume due to
the export of windblown trees.
Page | 39You can also read