Completing the map Power system needs in 2030 and 2040 - August 2020 Draft version prior to public consultation - imgix
←
→
Page content transcription
If your browser does not render page correctly, please read the page content below

Ten-Year
Network       Completing the map
              Power system needs
Development
Plan 2020

              in 2030 and 2040
              August 2020 · Draft version prior to public consultation
About ENTSO-E

ENTSO-E, the European Network of Transmission System Operators for Electricity,
represents 42 electricity transmission system operators (TSOs) from 35 countries
across Europe. ENTSO-E was registered in European law in 2009 and given legal
mandates since then.

The role of Transmission System Operators has considerably evolved with the Third
Energy Package. Due to unbundling and the liberalisation of the energy market
TSOs have become the meeting place for the various players to interact on the
market place.

ENTSO-E members share the objective of setting up the internal energy market
and ensuring its optimal functioning, and of supporting the ambitious European
energy and climate agenda. One of the important issues on today’s agenda is the
integration of a high degree of renewables in Europe’s energy system, the develop-
ment of flexibility, and a much more customer-centric approach than in the past.

ENTSO-E is committed to develop the most suitable responses to the challenge
of a changing power system while maintaining security of supply. Innovation, a
market-based approach, customer focus, stakeholder focus, security of supply,
flexibility, and regional cooperation are key to ENTSO-E’s agenda.

ENTSO-E is contributing to build the world’s largest electricity market, the benefits
of which will not only be felt by all those in the energy sector but also by Europe’s
overall economy, today and in the future.

Transparency is a key principle for ENTSO-E, and requires a constant listening,
learning and improvement.
Completing the map
Power system needs
in 2030 and 2040
August 2020 · Draft version prior to public consultation

Ten-Year Network Development Plan 2020
Highlights
› urope’s power system is evolving rapidly. ENTSO-E’s System Needs study shows where
E
action is needed by 2040 to ensure continuous access to electricity throughout Europe and
deliver on the climate agenda.
› In addition to the 35 GW of cross-border transmission capacity reinforcements by 2025 that
are already well-advanced, the System Needs study finds that 50 GW would be cost efficient
between 2025 and 2030 and 43 additional GW by 2040. Investing 1.3 bn € / year between
2025 and 2030 translates into a decrease of generation costs of 4 bn € / year, while investing
3.4 bn € / year between 2025 and 2040 decreases generation costs by 10 bn € / year.
› ddressing system needs puts Europe on track to realize the Green Deal, with 110 TWh of
A
curtailed energy saved and 53 Mtons of CO2 emissions avoided each year until 2040. Market
integration would progress, with price convergence increasing between bidding zones thanks
to an additional 467 TWh / year of cross border exchanges by 2040.
› he System Needs study expresses needs in terms of cross-border transmission capacity
T
increase and identifies the most cost-efficient combination of increases, but it does not
mean that the identified set of increases are the only solution. The identified needs can be
addressed in multiple ways such as increased transmission capacity, storage, hybrid offshore
infrastructure, smart grids and power to gas.
› Increased cross-border exchanges and distributed generation will also create stresses for
national grids and trigger needs for internal reinforcements. Internal reinforcements already
identified in previous studies and related to cross-border needs, especially for the 2030 horizon,
have been considered as part of the estimated cost for capacity increases, but once the needs
turn into projects, they will need to be confirmed and new needs for internal reinforcements
can also arise.
› Investing in infrastructure will be key to support the economy in the post COVID era, where
the goal of developing Europe towards a decarbonized economy is an opportunity not only to
fulfil the ambitious European objectives, but also to support the European industry. Addressing
the identified needs by 2040 would represent 45 bn € of investment, translating directly
into jobs and growth.
› ome of the identified needs are already covered by concrete TYNDP projects, while about
S
50 GW do not correspond to existing projects in the 2040 horizon. All options should be
considered when these needs turn into projects and coordinated planning will be needed
across sectors. This is especially important in the subsequent steps where further analyses in
terms of environmental impact, viability, benefits beyond socio-economic welfare and refined
costs are carried out in order to complement the definition of the best project portfolio.
› he energy transition is also creating needs for system operations. Trends show a reduction
T
of system inertia due to increasing integration of renewable energy sources and distributed
generation, leading to higher vulnerability of the system to frequency mismatches. Flexibility
options will gain in importance, both at generation and demand level, and in this context the
role of TSOs in securing network stability will be key.
4 // ENTSO-E Completing the map – Power system needs in 2030 and 2040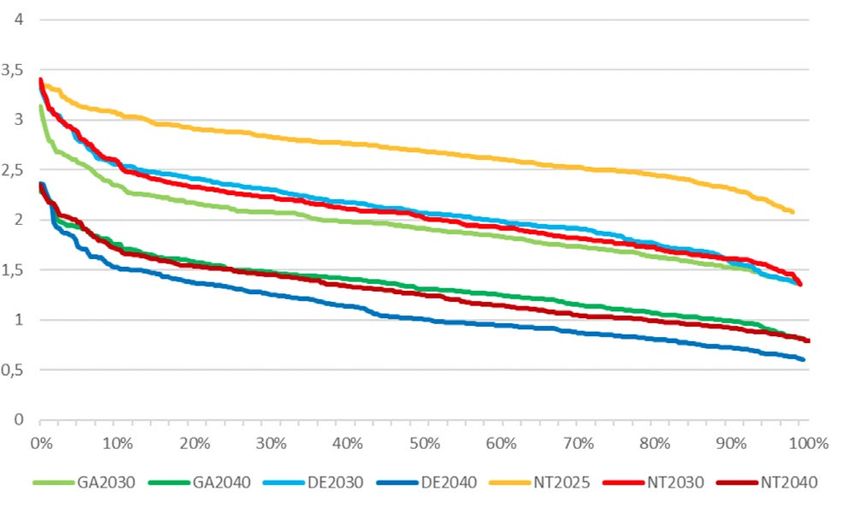
2020                                           Today’s power system

                                             35 GW of cross-border capacity increases
                                               in construction or planned until 2025

                     If Europe stopped investing                                           With an expanded
                         in the grid after 2025                                             grid after 2025

                                                                          With 50 GW of capacity increase after 2025,
                                                                            representing a cost of 1.3 bn € per year

BY 2030
            49                 618                51                       28                  576               48
          TWh/year           Mton/year         bn €/year                 TWh/year            Mton/year        bn €/year
          curtailed energy   CO2 emissions    generation cost           curtailed energy     CO2 emissions    generation cost

                                                                         With 93 GW of capacity increase after 2025,
                                                                           representing a cost of 3.4 bn € per year

BY 2040
            244                438               65                        134                 384               55
          TWh/year           Mton/year        bn €/year                  TWh/year            Mton/year        bn €/year
          curtailed energy   CO2 emissions    generation cost           curtailed energy     CO2 emissions    generation cost

                                                   ENTSO-E Completing the map – Power system needs in 2030 and 2040 // 5
How to read this report

A Q & A answers frequently asked questions.

The Introduction presents the context behind the System Needs study.

Chapter 1 presents the needs identified in 2030 and 2040.

Chapter 2 elaborates on the benefits of addressing those needs, for Europe’s
climate ambition, market integration and security of supply. To that end, a system
where needs are addressed is compared to an alternative future where Europe
would stop investing in the grid after 2025.

Chapter 3 considers the theoretical case where there would not be any capacity
constraint on electricity transmission. This exercise sheds light on the absolute
maximum benefits that could be captured by increasing network capacity.

Chapter 4 compares the findings of this edition of the System needs study to
those of the 2018 exercise.

Chapter 5 investigates new needs appearing with the energy transition: technical
challenges for system operations caused by a combination of trends including
more renewable energy sources at all voltage levels, more power electronics, a
very variable mix of generation and large and highly variable power flows.

Chapter 6 concludes with the next steps after the System needs study release.

Chapter 7 presents the methodology of the study and is completed by Appendices.

    How to use this interactive document
    To help you find the information you need quickly and easily we have
    made this an interactive document.

    Home button           Arrows                 Glossary               Hyperlinks            Visualise the data
    This will take you    Click on the           You will find a link   Hyperlinks are        tyndp.entsoe.eu/
    to the contents       arrows to move         to the glossary on     highlighted in bold   system-needs
    page. You can         backwards or           each page.             text and under-
    click on the titles   forwards a page.                              lined throughout
    to navigate to a                                                    the report. You
    chapter.                                                            can click on them
                                                                        to access further
                                                                        information.

6 // ENTSO-E Completing the map – Power system needs in 2030 and 2040
Contents
Highlights. . . . . . . . . . . . . . . . . . . . . . . . . . . . . . . . . . . . . . . . . . . . . . . . . . . . . . . . . . . . . . . . . . . . . . . . . . . . . . . . . . . . . . . . . . . . . . . . 4
How to read this report. . . . . . . . . . . . . . . . . . . . . . . . . . . . . . . . . . . . . . . . . . . . . . . . . . . . . . . . . . . . . . . . . . . . . . . . . . . . . . . . . . . 6
Q&A . . . . . . . . . . . . . . . . . . . . . . . . . . . . . . . . . . . . . . . . . . . . . . . . . . . . . . . . . . . . . . . . . . . . . . . . . . . . . . . . . . . . . . . . . . . . . . . . . . . . . . 8
Introduction. . . . . . . . . . . . . . . . . . . . . . . . . . . . . . . . . . . . . . . . . . . . . . . . . . . . . . . . . . . . . . . . . . . . . . . . . . . . . . . . . . . . . . . . . . . . . 10
What is the Identification of System Needs?. . . . . . . . . . . . . . . . . . . . . . . . . . . . . . . . . . . . . . . . . . . . . . . . . . . . . . . . . . . . . . . . . . . . . . . 10
An essential step in Europe’s long-term electricity infrastructure planning. . . . . . . . . . . . . . . . . . . . . . . . . . . . . . . . . . . . . . . . . . . 10
An evolving tool to enable the energy transition. . . . . . . . . . . . . . . . . . . . . . . . . . . . . . . . . . . . . . . . . . . . . . . . . . . . . . . . . . . . . . . . . . . . 11
1 What are system needs by 2030 and 2040? . . . . . . . . . . . . . . . . . . . . . . . . . . . . . . . . . . . . . . . . . . . . . . . . . . . . . . . . . . . 12
The SEW-based capacity increases, one solution among others. . . . . . . . . . . . . . . . . . . . . . . . . . . . . . . . . . . . . . . . . . . . . . . . . . . . 16
What is the impact on the internal grid and how does the internal grid affect network expansion? . . . . . . . . . . . . . . . . . . . . 19
The rise of offshore wind and offshore grid infrastructure development .. . . . . . . . . . . . . . . . . . . . . . . . . . . . . . . . . . . . . . . . . . . . 19
2 How addressing system needs benefits Europe .. . . . . . . . . . . . . . . . . . . . . . . . . . . . . . . . . . . . . . . . . . . . . . . . . . . . . . 22
Enabling Europe to realise the Green Deal .. . . . . . . . . . . . . . . . . . . . . . . . . . . . . . . . . . . . . . . . . . . . . . . . . . . . . . . . . . . . . . . . . . . . . . . . 22
Towards increased market integration .. . . . . . . . . . . . . . . . . . . . . . . . . . . . . . . . . . . . . . . . . . . . . . . . . . . . . . . . . . . . . . . . . . . . . . . . . . . 26
Preserving reliable access to electricity .. . . . . . . . . . . . . . . . . . . . . . . . . . . . . . . . . . . . . . . . . . . . . . . . . . . . . . . . . . . . . . . . . . . . . . . . . . 32
3 What if there was no physical constraint in the grid?. . . . . . . . . . . . . . . . . . . . . . . . . . . . . . . . . . . . . . . . . . . . . . . . . 33
The SEW-based Needs can deliver about 70 % of the maximum achievable benefits.. . . . . . . . . . . . . . . . . . . . . . . . . . . . . . . . . 34
How to increase the benefits captured?. . . . . . . . . . . . . . . . . . . . . . . . . . . . . . . . . . . . . . . . . . . . . . . . . . . . . . . . . . . . . . . . . . . . . . . . . . . 36
4 How do results of the 2020 system needs study compare with 2018 results? . . . . . . . . . . . . . . . . . . . . . . . . . 37
5 New needs in a new set-up: Challenges for system Operations – Dynamic study results .. . . . . . . . . . . . 38
Frequency management: system inertia and local f requency variations. . . . . . . . . . . . . . . . . . . . . . . . . . . . . . . . . . . . . . . . . . . . . 39
Flexibility aspects. . . . . . . . . . . . . . . . . . . . . . . . . . . . . . . . . . . . . . . . . . . . . . . . . . . . . . . . . . . . . . . . . . . . . . . . . . . . . . . . . . . . . . . . . . . . . . . 42
Transient and voltage stability related aspects.. . . . . . . . . . . . . . . . . . . . . . . . . . . . . . . . . . . . . . . . . . . . . . . . . . . . . . . . . . . . . . . . . . . . 45
How to adapt? Possible solutions for future system o perations. . . . . . . . . . . . . . . . . . . . . . . . . . . . . . . . . . . . . . . . . . . . . . . . . . . . . 46
6 Next steps . . . . . . . . . . . . . . . . . . . . . . . . . . . . . . . . . . . . . . . . . . . . . . . . . . . . . . . . . . . . . . . . . . . . . . . . . . . . . . . . . . . . . . . . . . . . 47
7 IoSN Methodology .. . . . . . . . . . . . . . . . . . . . . . . . . . . . . . . . . . . . . . . . . . . . . . . . . . . . . . . . . . . . . . . . . . . . . . . . . . . . . . . . . . . 48
The scenarios . . . . . . . . . . . . . . . . . . . . . . . . . . . . . . . . . . . . . . . . . . . . . . . . . . . . . . . . . . . . . . . . . . . . . . . . . . . . . . . . . . . . . . . . . . . . . . . . . . 48
The reference grid: starting point of the IoSN study .. . . . . . . . . . . . . . . . . . . . . . . . . . . . . . . . . . . . . . . . . . . . . . . . . . . . . . . . . . . . . . . 52
Zonal methodology for the identification of system needs in 2040 .. . . . . . . . . . . . . . . . . . . . . . . . . . . . . . . . . . . . . . . . . . . . . . . . . 55
Standard Net Transfer Capacity model for 2030 . . . . . . . . . . . . . . . . . . . . . . . . . . . . . . . . . . . . . . . . . . . . . . . . . . . . . . . . . . . . . . . . . . . 58
Scope and limits of the identification of system needs .. . . . . . . . . . . . . . . . . . . . . . . . . . . . . . . . . . . . . . . . . . . . . . . . . . . . . . . . . . . . 60
Appendices .. . . . . . . . . . . . . . . . . . . . . . . . . . . . . . . . . . . . . . . . . . . . . . . . . . . . . . . . . . . . . . . . . . . . . . . . . . . . . . . . . . . . . . . . . . . . . 62
Appendix 1 – Glossary . . . . . . . . . . . . . . . . . . . . . . . . . . . . . . . . . . . . . . . . . . . . . . . . . . . . . . . . . . . . . . . . . . . . . . . . . . . . . . . . . . . . . . . . . . 62
Appendix 2 – List of projects included in the reference grid . . . . . . . . . . . . . . . . . . . . . . . . . . . . . . . . . . . . . . . . . . . . . . . . . . . . . . . . 64
Appendix 3 – Candidate capacity increases and cost a ssumptions������������������������������������������������ 66
Authors������������������������������������������������������������������������������������������������� 68
ENTSO-E Completing the map – Power system needs in 2030 and 2040 // 7
Q&A
    	What are system needs?                                       in most cases. This is because electricity tends to transit,
		 System needs show borders/areas where new solu-                 crossing countries on its way from places with high genera-
tions for electricity exchange are needed to reach decarbon-       tion from renewable energy sources to places with high load,
isation targets and keep security and costs under control.         or from bidding zones with lower prices to bidding zones with
This study focuses on needs beyond the next anticipated            higher prices.
wave of cross-border grid investments (35 GW by 2025). They
use the National Trend scenarios for 2030 and 2040, which              	Will TSOs plan the future grid based on
means that the system needs identified exist in a world where            identified system needs?
significant uptake of renewable energy sources and system          		 The System needs study is not a network development
flexibility already happened.                                      plan. It is a study that investigates one particular dimension of
                                                                   the future, which is where increases in network capacity would
    	System needs or transmission needs?                          be the most cost-efficient from a pan-European perspective.
		 The System needs study describes needs, not the                 To plan future network development, TSOs consider a multi-
solutions to the needs. The study uses interconnection trans-      tude of aspects, including socio-economic welfare but also
mission capacity to express the needs because it is based on       other benefits of projects (for instance in term of security of
electricity TSOs’ expertise, data and models, but it does not      supply or reductions of CO2 emissions) and other scenarios of
mean that electricity infrastructure is the unique solution. The   evolution of the energy system. TSOs will use the study’s find-
methodology only provides indication of where, for example,        ings as a tool to develop future National Development Plans,
market integration could be improved, but it cannot prioritise     in complement to national and regional planning studies.
between possible solutions. ENTSO-E expects that addressing
tomorrow’s challenges will require the parallel development            	Why does the System Needs study
of all possible solutions, including for example storage, the            investigate the National Trends scenario?
role of prosumers and generation, in addition to reinforcing       		 The future investigated by the study is the National
the transmission grid.                                             Trends scenario, which aims at reflecting the commitments
                                                                   of Member States to meet the targets set by the European
    	Where do system needs exist?                                 Union in term of efficiency and GHG emissions reduction
		 The study finds needs everywhere in Europe, with a              for the energy sector. At country level, National Trends is
total of 50 GW of needs on close to 40 borders in 2030 and 43      aligned with the National Energy and Climate Plans (NECPs)
additional GW on more than 55 borders in 2040. Addressing          of the respective Member States, which translate the Euro-
system needs would put Europe on track to realize the Green        pean targets to country specific objectives for 2030. What is
Deal, with 110 TWh of curtailed energy saved each year and         necessary to achieve the objectives of the NECPs will be even
53 Mtons of CO2 emissions avoided each year until 2040.            more necessary for the Green Deal, and it is anticipated that
Market integration would progress, with price convergence          NECPs in future will evolve towards Green Deal objectives.
increasing between bidding zones thanks to an additional                Other TYNDP 2020 scenarios – the COP21 scenarios
467 TWh/year of cross border exchanges by 2040. Investing          Distributed Energy and Global Ambition, and a Current Trends
1.3 bn € each year between 2025 and 2030 translates into a         sensitivity – will be investigated in the cost-benefit analysis
decrease of generation costs of 4 bn € per year, while investing   of projects.
3.4 bn € each year between 2025 and 2040 decreases gener-
ation costs by 10 bn € per year.                                       	How does the TYNDP 2020 project portfolio
                                                                         cover the identified needs?
    	The System needs study considers only                        		 Of the 93 GW of needs identified between 2025 and
      cross-border capacities, does this mean that                 2040, transmission projects currently under conception or
      there are no needs within countries?                         development address about 43 GW (on some borders, more
		 There are needs to develop internal networks within             than one project compete sometimes to address the same
countries. Although internal needs are not the focus of the        need). Other technologies such as storage could also address
System needs study, they are a direct implication of the           these needs.
results: increasing capacity on a border will require a rein-             The remaining 50 GW of needs are left to be addressed,
forcement of the internal network of the concerned countries       by all possible means. This is a considerable investment

8 // ENTSO-E Completing the map – Power system needs in 2030 and 2040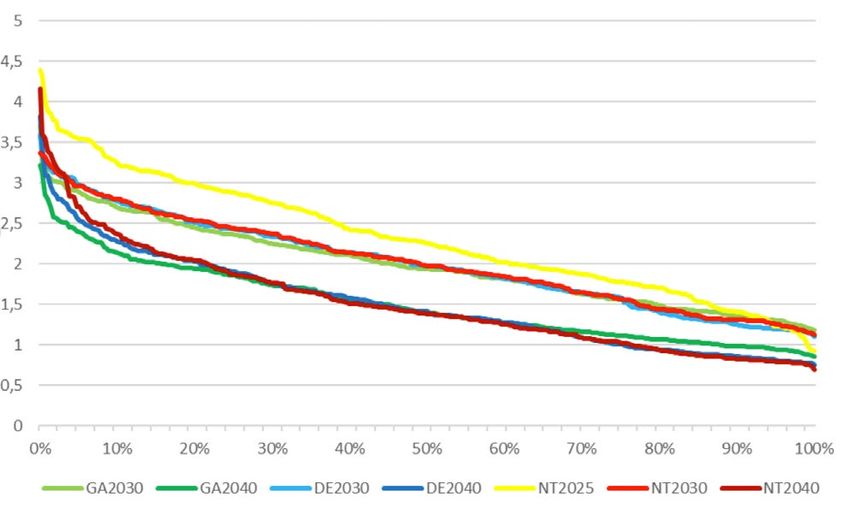
gap to be tackled until 2040. The solution will include a               	How are stakeholders involved in the
combination of technologies across sectors and will require               identification of system needs?
coordinated planning. To prepare for the future ‘system of         		 The System needs package, including this report and
systems’, ENTSO-E has developed a Roadmap for coordinated          the six Regional investment plans published alongside it,
multi-sectorial planning of infrastructure. The Roadmap will       will be submitted to a public consultation alongside the rest
serve as an umbrella for future planning activities, to improve    of the TYNDP 2020 package. The consultation is foreseen
the consideration of smart sector integration in the infra-        to begin by early November 2020 and to last six weeks. To
structure planning process and will identify needs for dual or     further engage with stakeholders, webinars at European and
multiple-sector assessment of infrastructure projects.             potentially also regional level are also planned for Septem-
                                                                   ber-October 2020.
    	There is no system need identified on a                             Stakeholders comments will serve to improve the
      border, does it mean that no infrastructure                  reports. Comments regarding the methodology itself will
      should be built?                                             be taken into account to improve the future editions of the
		 The System needs is a partial exercise that investi-            System needs study, as time does not allow to re-run the
gates one specific dimension of future system needs, which         study. Stakeholders wishing to discuss how the assessment
is where increasing cross-border capacity would be most            of system needs could be further improved are welcome to
cost-efficient. Planning electricity transmission infrastructure   contact ENTSO-E at tyndp@entsoe.eu.
requires to consider a whole area of indicators, including                In January 2021, the entire TYNDP 2020 package will
costs but also for example benefits of projects in terms of        be submitted to ACER for a formal Opinion. ACER’s comments
frequency system stability, reduction of CO2 emissions and         will be implemented as far as possible in this edition of the
other greenhouse gases, etc. It is therefore possible that a       System needs study, or alternatively considered for imple-
project receives a positive cost-benefit analysis even when it     mentation in the 2022 exercise.
is on a border that is not included in the best combination of
capacity increases identified by the System Needs study.                	Do identified system needs stay the same as
                                                                          in the previous system needs study?
    	Will the System needs study results be                      		 The 2020 system needs study identified significantly
       considered by the European Commission to                    higher needs for the 2040 horizon than the 2018 exercise, with
       select Projects of Common Interest?                         a global increase of 37 additional GW of cross-border capacity
		 Regulation (EU) 347/2013 makes the TYNDP the basis              increases. The benefits captured by the needs identified in
for the selection of Projects of Common Interest (PCIs).           2020 are also higher in terms of variable generation cost,
However, the process to select European Projects of Common         avoided CO2 reduction and avoided curtailment. The differ-
Interest is under the responsibility of the regional groups led    ences between the 2018 and 2020 results lie mainly in the
by the European Commission, who ultimately decides on              scenario used. Despite these differences, ENTSO-E considers
the material to be taken into consideration. ENTSO-E stands        that the results are consistent enough and confirm the useful-
ready to provide the European Commission with all required         ness of the zonal methodology approach.
information. In prevision of the launch of the 5th PCI process
in Q4 2020, brief summaries of the needs in each PCI corridor           	Are the data and tools to replicate the
in the 2030 horizon will be made available in September.                  System needs study available?
                                                                   		       The data used for the System needs study includes:
    	What is the expected impact of the revised
      Electricity Regulation on the System needs                        ›   Datasets of scenarios National Trends 2030 and
      study?                                                                National Trends 2040 Download
		 Regulation (EU) 2019/943 on the internal market
for electricity specifies a minimum available cross-border              ›   List of candidate projects and cost assumptions (avail-
capacity to be made available to market participants.                       able in Appendix 3)
Depending on the modalities of enforcement of this rule,
needs for grid reinforcement might be reduced, as already               ›   Network dataset of the TYNDP 2020: it will be made
more market capacity could be available based on existing                   available in aggregated form in Q4 2020. The network
cross-border interconnections. This has not been investigated               dataset of the TYNDP 2018 is accessible upon request.
in this edition of the System needs study but may be consid-
ered in future editions.                                           		 The tool used for this study is Antares, which is an
                                                                   open source tool, with an expansion module publicly available
                                                                   (antaresXpansion).

                                                      ENTSO-E Completing the map – Power system needs in 2030 and 2040 // 9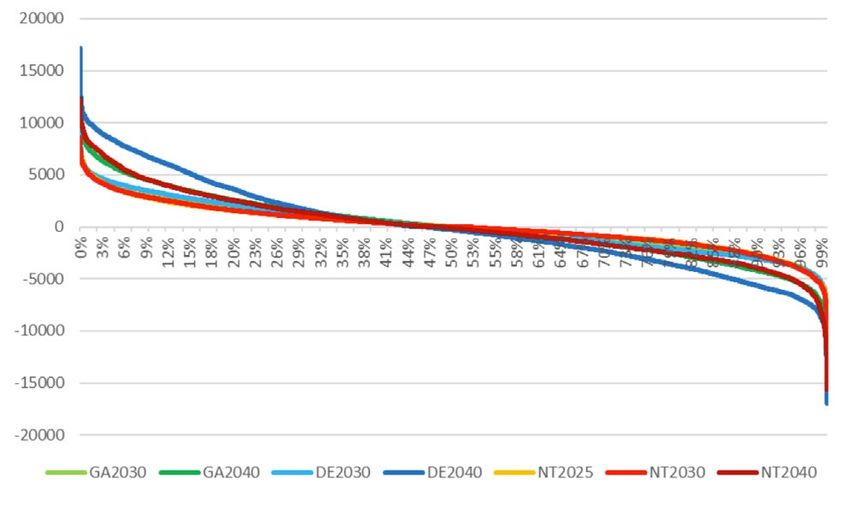
Introduction
How should the electricity grid look like in 2040 to create maximum value for
Europeans, ensure continuous access to electricity throughout Europe and deliver
on the climate agenda? What would be the cost for Europeans of not having the
right electricity infrastructure by 2040? Which future challenges will be created by
the expected high increase of renewable generation units, in part small and distrib-
uted, with variable production? The cost to society of an inadequate network is
considerable due to the central role that a reliable energy supply plays for society.
What is the Identification of System Needs?
The identification of system needs study investigates where electricity price between neighbouring countries be more
improving the electricity flow throughout Europe could bring aligned? The study also assesses the cost of not investing in
benefits to Europeans. The present report investigates needs the needed infrastructure. The System needs study is carried
in the 2040 and 2030 horizons. For example: where could CO2 out by ENTSO-E biannually and forms part of the Ten-Year
emissions be reduced? Where could the curtailed electricity Network Development Plan (TYNDP) 2020 package.
from renewable energy sources be used? Where could the
An essential step in Europe’s long-term electricity
infrastructure planning
The TYNDP is a long-term plan on how the electricity trans- The TYNDP 2020 scenarios developed jointly by ENTSO-E and
mission grid is expected to evolve in Europe to implement the its gas counterpart ENTSOG are described in the Scenarios
EU energy. Identifying the system needs is the second step in report published in June 2020. Following the collection of
the development of the TYNDP. projects from project promoters in November 2019, the
TYNDP 2020 will perform a cost-benefit analysis of 171
transmission and storage projects and evaluate how they
contribute to meeting the system needs for 2030.
SCENARIOS SYSTEM NEEDS PROJECTS ASSESSMENT
Range of possible futures Identify where new Cost-benefit analysis
to test infrastructure needs system assets would bring benefits of transmission and storage projects
and projects in the scenarios in the scenarios
Figure 0.1 – The three main steps of the TYNDP process
10 // ENTSO-E Completing the map – Power system needs in 2030 and 2040June 2020 August 2020 October 2020 2021
Scenario Identification of System Needs report, TYNDP report, Insight reports, Projects of
Report Regional Investment Plans & Country factsheets Common Interest
Projects of Common Interest and Projects sheets list
Corridors needs 2030
PROJECT COST BENEFIT PROJECTS
IDENTIFICATION
SCENARIOS COLLECTION AND ANALYSIS OF COMMON
OF NEEDS
IDENTIFICATION OF PROJECTS INTEREST
TYNDP Projects
Process of Common Interest
Process
Figure 0.2 – TYNDP and Projects of Common Interest processes and their key deliverables
Results of the System needs study will lead to the develop- needs change, because new scenarios are being investigated,
ment of new projects addressing newly identified needs. project promoters may redefine or even terminate projects,
These projects are anticipated in future national development also considering economic profitability due to market
plans and TYNDPs. To consider these projects already in the developments.
TYNDP 2020, ENTSO-E is opening a second project-submis-
sion window on the date of publication of this report, opened Alongside this System needs report, ENTSO-E publishes six
only to future projects commissioning after 2035 addressing regional investment plans diving into details of the specific
system needs. needs at regional level for 2040 and including additional sensi-
tivity studies. ENTSO-E will also release later this summer four
Running the System needs study every two years enables brief reports providing an overview of the needs for 2030 in
the needs behind projects to be monitored. As and when each of the four TEN-E electricity priority corridors.
An evolving tool to enable the energy transition
The System needs study is an evolving tool to manage increased granularity of the results and the expansion of the
increasing uncertainty in the context of the energy transition scope to the 2030 horizon with a Net Transfer Capacity model.
and EU Green Deal. Its methodology and scope have greatly
improved compared to the previous System needs release, The methodology and assumptions are further described in
with the use of a zonal model for the 2040 horizon allowing for Chapter 7.
ENTSO-E Completing the map – Power system needs in 2030 and 2040 // 111 What are system needs
by 2030 and 2040?
The 2030 and 2040 scenarios are challenging from many points of view, including
for the electricity transmission network. The change in the generation portfolio,
with increased solar and onshore wind generation in the south of Europe and
onshore and offshore wind generation in the north, in parallel with the decommis-
sioning of thermal units, cause higher and variable transit flows across Europe.
These flows must be accommodated by the grid to capture all the benefits of the
energy transition.
This new challenge brought by the evolution of generation 60 GW, Demand Side Response by 10 GW and Power-to-Gas
portfolios is already partially covered by an increase of by 3.5 GW. System needs go beyond this point in order to
flexible assets within the scenario National Trends. Indeed, provide a secure, cheap and decarbonized electricity at all
from 2025 to 2040 battery capacity in Europe increases by time and in all places.
Methodology: Identifying capacity increases
To analyze system needs by 2030 and 2040, ENTSO-E determined the combination of potential increases in
cross-border network capacity that minimizes the total system costs, composed of total network investment
(including costs of related necessary internal reinforcements for most borders) and generation costs. To do
that, a panel of possible network increases was proposed to an optimizer, who identified the most cost-efficient
combination. To take into account the mutual influence of capacity increases, the analysis was performed
simultaneously for all borders. The combination of network increases minimizing costs identified through
this process is hereafter called ‘SEW-based needs’ where SEW stands for socio-economic welfare. Further
explanation on the methodology is provided in Chapter 7.
The results of the System Needs study clearly show the high grid. This considerable amount of reinforcements can be
economic interest of investing in the grid to support the explained by a conservative approach to define the 2025
energy transition. reference grid. As a result, by 2030, in addition to accompa-
nying the evolution of the electric system occurring between
› By 2025, about 35 GW of new cross-border reinforcements, 2025 and 2030, a compensation of the delay in grid rein-
depicted in Figure 1.1, are expected to be built in addition to forcement could be necessary. Slightly more than half of
the 2020 grid. These very mature projects (some of them these needs could be covered by existing TYNDP projects
are already under construction), already justified in previous while the remaining part are currently only conceptual.
TYNDP releases, correspond to the best view of the 2025
European transmission grid. In consequence they are not › By 2040, 43 GW of additional cross-border investments on
questioned in the study and serve as the starting grid for top of the increases identified for 2030 would support the
the analysis. evolution of the electricity mix. These capacity increases
represent about 28 bn € of investment. These needs are
› By 2030, the study finds that 50 additional GW of cross only partly covered by concrete TYNDP projects (14 GW).
border reinforcements would be cost efficient to support
the electric system. These capacity increases represent
about 17 bn € of investment in the European transmission
12 // ENTSO-E Completing the map – Power system needs in 2030 and 2040CROSS-BORDER CAPACITY INCREASES EXPECTED TO BE
COMMISSIONED BY 2025 (BASED ON TYNDP 2020 PROJECTS)
800
900
FI
NO
SE
EE RU
600
LV
1,400
DK LT
2,800 1,720
900 RU
500 BY
950 1,400
400
IE
2,000
1,400
GB 2.000
PL
900 2.000
NL
1,500 DE UA
BE 1,000 500
1,000
LU CZ
1,500
1,300 MD
SK
617
4,000 800
800 AT 90 HU 335
300 RO
FR
CH 1,200
SI
0 HR
150
1,200 IT RS
BA 600
1,000 BG
844
2,200 XK 800
100 ME 500 MK
TR
PT AL 240
ES
GR
1,000
1,900
CY
MA MT
DZ TN
Figure 1.1 – Cross-border capacity increases, corresponding to projects under construction or in permitting phase and
expected to become effective by 2025. Identified needs in 2030 and 2040 come in addition to these capacity increases.
ENTSO-E Completing the map – Power system needs in 2030 and 2040 // 13NEEDS < 700 MW
1,500
NEEDS 700 2000 MW
NEEDS > 2000 MW
FI
800
NO
SE
EE RU
LV
DK LT
500
RU
BY
700 600
IE
1,000
GB
PL
NL 4,500
2,000 DE UA
700 BE
1,400 500
3,000 LU CZ
500 SK MD
1,000 1,000
1,800 2,500 1,117
3,100 AT 2,000 HU
RO
CH 600 500 1,000 1,000
FR 1,500 SI
1,200 HR
1,600 1,000
ITn RS
BA 500
2,000 IT
1,000 BG
1,500
ITcn XK 1,500
1,500
600 ME MK
ITcs TR
PT AL 1,000
ES ITs
1,500 GR
ITsar 1,500
CY
ITsic
600
MA MT
DZ TN
Figure 1.2 – Needs for capacity increases identified in the 2030 horizon, additional to the 2025 network
(SEW based needs 2030)*.
* Ireland and Northern Ireland form one wholesale electricity market area known as the Single Electricity Market (SEM). Therefore, the needs
identified between the island of Ireland and Great Britain could be satisfied by capacity increases in either Ireland or Northern Ireland.
14 // ENTSO-E Completing the map – Power system needs in 2030 and 2040NEEDS < 700 MW
NEEDS 700 2000 MW
1,500
NEEDS > 2000 MW
FI
1,800
NO
500
SE 500
EE RU
500
LV
DK 500 LT
RU 700
BY
700
IE
1,000
GB
PL
2,000
NL 1,000 4,900
DE UA
2,000
BE 1,000
1,400 2,800
4,000 LU CZ 1,500
500 1,650
500 SK MD
1,000 1,000
1,500
1,800 3,200
3,100 HU 1,117
AT 2,000 RO
3,500 1,500 1,500
CH 600 2,000
FR 1,000
SI 1,122
1,200 HR 2,500
2,000 1,600
ITn IT BA 1,350
RS 1,230
2,000 1,144 BG
500 1,000 1,500
ITcn
5,000 600 1,500XK
MK 1,000 1,500
ITcs TR
PT AL 500
ES ITs
1,500 GR
ITsar 1,500
4,000
1,000
CY
ITsic
500
500
MA MT
DZ TN
Figure 1.3 – Needs for capacity increases identified in the 2040 horizon, additional to the 2025 network
(SEW based needs 2040)*.
ENTSO-E Completing the map – Power system needs in 2030 and 2040 // 15The needs identified as transmission capacity increases Regional Investment Plans for further analysis on specific
are located all over Europe. For 2030, the highest identified capacity increases identified in Figures 1.2 and 1.3.
capacity increases are located on the German borders with
Poland, Switzerland and Austria, and on the Belgium-France The impact of these reinforcements on the power system
border, although there are many other needs to accommodate is considerable and their benefits far outweigh their costs.
flows between Southwest and Central Europe (Spain-France Additional cross-border exchange capacity allows to better
and other French borders) and between Eastern and Central mutualize generation capacity among countries as well as
Europe (from Turkey through the Balkan countries up to their differences in load profile. Chapter 2 details the impact
Austria) and to integrate the Italian peninsula. of addressing the SEW-based needs on a series of indicators,
including CO2 emissions, curtailed energy, and marginal costs
For 2040, the highest identified capacity increases are located and compares these benefits to a hypothetical situation where
in the Iberian Peninsula, especially on the France-Spain border Europe would stop investing in the grid after 2025.
with also a significant increase on the Portugal-Spain border.
As in 2030, the German borders with Poland, Switzerland As a next step, the needs found in this study will be confronted
and Austria and the Belgium-France border are among the to concrete projects (existing or new) in the TYNDP 2020
borders with the highest needs. However, in 2040 the French project portfolio, as submitted by project promoters. The
borders to Switzerland and the United Kingdom will also details of the project (capacity, location, technology...) will
require capacity increases. In Eastern Europe, where cross- allow to estimate precise costs and benefits in a variety of
border capacities are generally lower, high needs have been scenarios and assess if the investment is indeed economi-
identified on the Bulgaria-Romania border. Additional needs cally beneficial. The evolution of the energy mix and of the
require to accommodate North-South flows between the development of the grid, as well as the numerous impacts
Nordic countries through continental Europe to the Balkans, projects have on the power system beyond lowering the
between UK and Ireland with the Continent and to integrate generation costs, have to be taken into account at each
the Italian peninsula. Readers are invited to refer to the investment step through a dedicated cost-benefit analysis.
The SEW-based capacity increases, one solution
among others
The SEW-based needs are a depiction of the needed effec- therefore suggest that it is a well-identified need without being
tive cross-border transfer capacity increases necessary for part of the SEW-based solution. These network increases,
a cost-optimized operation of the 2030 and 2040 system. It identified in orange in the figures, do not constitute an alter-
is important to note that considerations in terms of system native grid solution, as they do not all belong to the same
resilience, system security, or other societal benefits are not solution. Adding one of these increases to the SEW-based
included in this analysis. The cost-optimized operation of the needs would deliver very close benefits to those delivered by
2030/2040 system is a function of the cost estimates for the addressing the SEW-based needs alone.
cross-border capacity increases and the generation costs.
In particular, considering the sensitivity of the analysis on
While the optimisation process behind this analysis has aimed the cost estimates used for the optimisation process, these
at a robust identification of the cost-optimized system, the possibilities must be considered in order to not misdirect the
inherent complexity of the power system implies that different sound development of the necessary solutions to the needs.
depictions of the needed cross-border capacity increases This is especially important in the subsequent steps where
lead to results of practically similar benefits. Figures 1.4 and further analyses in terms of environmental impact, viability,
1.5 capture this effect for those borders where a different benefits beyond SEW and refined costs are carried out in order
SEW-based solution would lead to similar benefits and would to complement the identified needs.
16 // ENTSO-E Completing the map – Power system needs in 2030 and 2040NEEDS < 700 MW
1,500
NEEDS 700 2000 MW
+500
NEEDS > 2000 MW
ADDITIONAL CAPACITY INCREASES THAT,
WHEN ADDED ONE AT A TIME TO THE SEW-BASED NEEDS,
DELIVER SIMILAR OVERALL BENEFITS
FI
800
NO
SE +1,500
EE RU
LV
+1,000 LT
DK 500
RU
+1,000 BY
+1,000 700 +700 600
IE
1,000
GB
PL
+2,000 NL 4,500
2,000 DE UA
700 BE
1,400 500
3,000 LU CZ
500 +1,000 SK MD
1,000 1,000
1,800 2,500 1,117
3,100 AT 2,000 HU
RO
500 +1,000
FR 1,500
CH 600 1,000 1,000
SI
1,200 HR +622
+1,500 1,600 1,000
ITn RS
+500 BA 500
2,000 IT
+500 1,000 BG
1,500
+1,500 ITcn +1,500 XK 1,500
1,500
600 ME MK
ITcs TR
PT AL 1,000
ES ITs
1,500 GR
ITsar 1,500
+500
CY
ITsic
600 +500
MA MT
DZ TN
Figure 1.4 – Needs for capacity increases identified in the 2030 horizon, additional to the 2025 network (SEW-based
Needs 2030) and additional network increases included in grid solutions that were only slightly more expensive than
the SEW-based Needs 2030.
ENTSO-E Completing the map – Power system needs in 2030 and 2040 // 17NEEDS < 700 MW
NEEDS 700 2000 MW
1,500
NEEDS > 2000 MW
ADDITIONAL CAPACITY INCREASES THAT,
WHEN ADDED ONE AT A TIME TO THE SEW-BASED NEEDS,
DELIVER SIMILAR OVERALL BENEFITS
FI
1,800
NO
2,000
500
SE 500
EE RU
500 500
LV
1,000
DK 500 LT
RU 700 1,000
700 BY
1,000 700
IE
1,000
GB
PL
2,000
NL 1,000 4,900
1,400
DE UA
2,000
BE 1,000 500
1,400 2,800
4,000 LU CZ 1,500
500 1,650
1,000 500 SK MD
1,000 1,000
1,500
1,800 3,200
3,100 HU 1,117
AT 2,000 RO
3,500 1,500 1,500
CH 600 2,000
FR 1,000
SI 1,122
1,200 HR 2,500
2,000 1,600
ITn IT BA 1,350
RS 1,230
2,000 1,144 BG
500 1,000 1,500
ITcn
5,000 600 1,500XK
1,000 1,000 1,500
500 ME MK
ITcs TR
PT AL 500
ES ITs
1,500 GR
ITsar 1,500
4,000
1,000
CY
ITsic
500
500
MA MT
DZ TN
Figure 1.5 – Needs for capacity increases identified in the 2040 horizon, additional to the 2025 network
(SEW-based Needs 2040) and additional network increases included in grid solutions that were only slightly
more expensive than the SEW-based Needs 2040*.
* The need at the Italy-Tunisia border has been assessed only in the 2030 horizon because of methodological limitations. As a result, the absence
of any need on IT-TUN in the 2040 horizon is only due to the non-assessment of needs on this border.
18 // ENTSO-E Completing the map – Power system needs in 2030 and 2040What is the impact on the internal grid and how does
the internal grid affect network expansion?
Reaching the level of cross-border exchanges that result from the situation of internal grids in the national framework as well
the needs identified in the SEW-based Needs and rely on the as in the European framework, to ensure that internal grids
National Trends scenario for 2030 and 2040, will create new accommodate future flows and are fit-for-purpose in the energy
needs for reinforcement of internal networks in the European transition.
national grids. Therefore, national TSOs will need to analyse
The rise of offshore wind and offshore grid infrastructure
development
Europe has today 22.1 GW of offshore wind capacity, corre- treated as an externality, which in the case of offshore wind
sponding to 5,407 grid connected wind turbines across 12 may represent an even higher deviation from overall system
countries 1. The resource potential for offshore wind in Europe costs optimality. The study does not focus on the optimal
in several areas is very high. Furthermore, the cost of offshore connection of (all types of) generation, as this is not part
wind has declined substantially in the last decade, making of the current ENTSO-E mandate. For that reason, so called
it an attractive contributor to the European Green Deal. In "hybrid projects", i.e. the combination of interconnections and
fact, the National Trends scenario expects reaching 78 and offshore generation units, are not identified with the current
131 GW in 2030 and 2040 respectively, while the European System needs methodology.
Commission Roadmap on Offshore renewable energy
strategy anticipates over 250 GW of installed offshore wind However, the results of the present System needs study,
in 2050. merged with detailed information of offshore power plants,
will allow project promoters to define new potential hybrid
Offshore transmission infrastructure and related onshore projects (yellow areas in Figure 1.6) or adapt existing ones,
connections and reinforcements need to be built much faster thus proposing new steps towards future modular offshore
than the current onshore grids, which were developed step grid infrastructure . In particular, hybrid projects could help
by step for more than a century. Several challenges for this to decrease the cost of exchange capacity in marine areas
expansion will have to be addressed in the coming years, (submarine transmission projects tend to be expensive),
including a holistic planning and coordinated on-and-offshore hence making new capacities cost-effective, which they may
grid developments, combining the fields of grid and spatial not have been by themselves. Indeed, there are still some
planning, engineering, construction and financing. ENTSO-E’s benefits to be gained by new exchange capacities as the
first Position Paper on Offshore Development, released in differences in marginal costs on these borders are still high
May 2020, identifies the basic pillars on successful offshore (Figure 1.7).
development supporting offshore wind integration in
electricity. The benefits delivered by these types of projects with the
details of the offshore power plants will be assessed in the
For the System needs study, the wind and solar capacities cost-benefit analysis process of the TYNDP according to the
are part of the scenarios, meaning that connection costs are currently valid CBA methodology.
1 WindEurope: “Offshore wind in Europe” – key trends and statistics 2019, Feb 2020
ENTSO-E Completing the map – Power system needs in 2030 and 2040 // 19NEEDS < 700 MW
NEEDS 700 2000 MW
1,500
NEEDS > 2000 MW
ADDITIONAL CAPACITY INCREASES THAT,
WHEN ADDED ONE AT A TIME TO THE SEW-BASED NEEDS,
DELIVER SIMILAR OVERALL BENEFITS
LOCATION OF OFFSHORE WIND GENERATION
OR HYBRID INFRASTRUCTURE
FI
1,800
NO
2,000
500
SE 500
EE RU
500 500
LV
1,000
DK 500 LT
RU 700 1,000
700 BY
1,000 700
IE
1,000
GB
PL
2,000
NL 1,000 4,900
1,400
DE UA
2,000
BE 1,000 500
1,400 2,800
4,000 LU CZ 1,500
500 1,650
1,000 500 SK MD
1,000 1,000
1,500
1,800 3,200
3,100 HU 1,117
AT 2,000 RO
3,500 1,500 1,500
CH 600 2,000
FR 1,000
SI 1,122
1,200 HR 2,500
2,000 1,600
ITn IT BA 1,350
RS 1,230
2,000 1,144 BG
500 1,000 1,500
ITcn
5,000 600 1,500XK
1,000 1,000 1,500
500 ME MK
ITcs TR
PT AL 500
ES ITs
1,500 GR
ITsar 1,500
4,000
1,000
CY
ITsic
500
500
MA MT
DZ TN
Figure 1.6 – Location of potential hybrid offshore infrastructure (interconnection and generation) and needs for
capacity increases identified for the 2040 horizon (SEW-based Needs 2040)
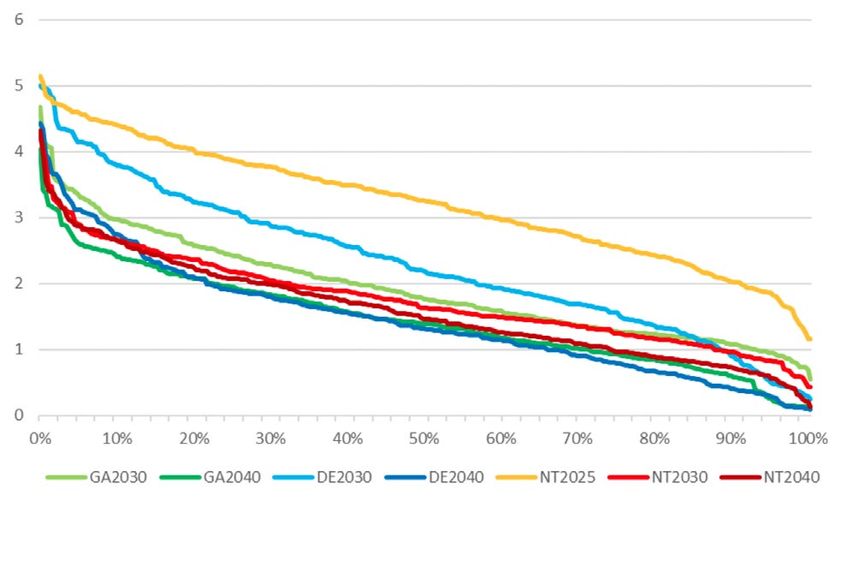
20 // ENTSO-E Completing the map – Power system needs in 2030 and 2040< 2.00 €/MWh
2.00–5.00 €/MWh NO 1
5.00–10.00 €/MWh
> 10.00 €/MWh
SE 1
SE 2
FI
NO 2
NO 3
SE 3 EE RU
LV
SE 4
DKW 1 LT
NI DKE 1 RU
BY
IE
UK
PL
NL
DE UA
BE
LU CZ
SK MD
AT HU
RO
CH
FR
SI
HR
IT
ITn RS
BA
BG
ITcn XK
ME MK
ITcs TR
PT AL
ES ITs
GR
ITsar
CY
ITsic
MA MT
DZ TN
Figure 1.7 – Difference in marginal costs between neighbouring bidding zones in potential locations of hybrid
offshore infrastructure (SEW-based Needs 2040) (For the spread in marginal cost in all potential futures for 2030 and
2040, see Chapter 2.2)
The complexity of the offshore system requires a combination looking into methodologies for identifying potential hybrid
of various technical solutions and designs in order to ensure project needs in future TYNDPs. Future TYNDPs will analyse
overall system efficiency. In anticipation of the integration the offshore grid infrastructure further based on the advance-
of significant offshore generation capacities, ENTSO-E is ment of national and regional development plans.
ENTSO-E Completing the map – Power system needs in 2030 and 2040 // 212 How addressing system needs
benefits Europe
In this chapter we compare the SEW-based needs presented in Chapter 1 to a
hypothetical future where there would not be any further increase in transmis-
sion capacity after 2025. This comparison highlights the benefits delivered by
increased network capacity on a range of indicators, in terms of reduced curtailed
energy, reduced CO2 emissions, reduced price divergence between neighbouring
countries … Addressing system needs will be key for Europe to preserve security
of electricity supply, deliver the Internal Energy Market and make the Green Deal
a reality.
Enabling Europe to realise the Green Deal
110 TWh of curtailed energy saved each year by 2040
Increasing the exchange capacity in Europe helps the inte- volume increases to 244 TWh / year by 2040. This represents
gration of renewable energy by offering more opportunities a share of over 1 % of annual RES generation in 2030 and 5 %
to RES power plants to be used. Indeed, without network rein- in 2040 2.
forcements after 2025, the RES generation would be so high
at some time in some countries that some energy has to be By taking advantage of the different energy mix over Europe
curtailed: by 2030, 49 TWh / year would be spilled whereas this and the different RES peaking period between countries,
Curtailed energy in TWh/year
250
225
110 TWh of RES energy are
200 saved each year by 2040
175 when building the grid
150
125
100
75
47 TWh of RES energy are
50 saved each year by 2030
25
when building the grid
0
2030 2040
No investment after 2020 No investment after 2025 IoSN SEW-based Needs
Figure 2.1 – Curtailed energy in TWh / year in the 2030 and 2040 horizons
2 As far as hydrological losses are concerned, curtailed energy values does not include water that is not used because generation turbine capacity is not
high enough.
22 // ENTSO-E Completing the map – Power system needs in 2030 and 2040the SEW-based needs decrease drastically the curtailed The impact on RES integration is even more important
energy. With the evolution of the energy transition (RES because, in case Europe stops investing in grid reinforcement,
installed capacity in Europe increases by 28 % between 2030 RES promoters would not build their units in the first place
and 2040), this effect increases over time: the reduction is knowing they will not be able to sell their generation to foreign
21 TWh / year in 2030 and reaches 110 TWh / year in 2040. markets.
Germany and Spain are the most impacted countries due to
their high national share of RES generation.
TWh
30
25
20
15
cut
12
10
8
6
4
2
0
AL AT BA BE BG CH CY CZ DE DK EE ES FI FR GR HR HU IE IT LT LU LV ME MK MT NL NO PL PT RO RS SE SI SK U K
No investment after 2020 No investment after 2025 IoSN SEW-based Needs
Figure 2.2 – Curtailed energy in TWh in 2030, in No investment after 2020, No investment after 2025 and
SEW-based Needs
TWh
80
70
60
50
40
30
cut
15
10
5
0
AL AT BA BE BG CH CY CZ DE DK EE ES FI FR GR HR HU IE IT LT LU LV ME MK MT NL NO PL PT RO RS SE SI SK U K
No investment after 2025 IoSN SEW-based Needs
Figure 2.3 – Curtailed energy in TWh/year in 2040, in No investment after 2025 and SEW-based Needs
ENTSO-E Completing the map – Power system needs in 2030 and 2040 // 23Over 41 Mton of CO� emissions avoided each year by 2030
By allowing a better integration of non-CO2 emitting gener- in 2040 to reach in Europe 576 Mton /year in 2030 and 387
ation, increased cross-border network capacity leads to a in 2040 3.
significant reduction of European CO2 emissions. This high-
lights the important role of the network in the path toward If Europe stopped investing in the grid after 2020, the negative
carbon neutrality. Compared to a path with no investment effect would be even larger: by 2030, CO2 emission would be
after 2025, CO2 emissions of the power sector decrease by higher by 60 Mton / year compared to the SEW-based Needs.
7 % (41 Mton) per year in 2030 and 12 % (53 Mton) per year
CO2 emissions in Mton/year
700
600 60 Mton CO2/year:
reduction in CO2 emissions
500 per year when building the grid
400 53 Mton CO2 are saved
each year by 2040
300 when building the grid
200
100
0
2030 2040
No investment after 2020 No investment after 2025 IoSN SEW-based Needs
Figure 2.4 – Yearly CO� emissions from the power sector in the 2030 and 2040 horizons
Mio. Tons
120
100
80
60
cut
40
35
30
25
20
15
10
5
0
AL AT BA BE BG CH CY CZ DE DK EE ES FI FR GR HR HU IE IT LT LU LV ME MK MT NL NO PL PT RO RS SE SI SK U K
No investment after 2020 No investment after 2025 IoSN SEW-based Needs
Figure 2.5 – CO� emissions in 2030, in ’No investment after 2020’, ‘No investment after 2025’ and SEW-based
Needs 2030
3 The overall European emission decreases between 2030 per country and 2040 because of the highest share of renewable energy in 2040 associated with
an increase in the ETS CO2 cost considered at this horizon.
24 // ENTSO-E Completing the map – Power system needs in 2030 and 2040Mio. Tons
50
40
30
20
cut
14
12
10
8
6
4
2
0
AL AT BA BE BG CH CY CZ DE DK EE ES FI FR GR HR HU IE IT LT LU LV ME MK MT NL NO PL PT RO RS SE SI SK U K
No investment after 2025 IoSN SEW-based Needs
Figure 2.6 – CO� emissions in 2040 per country, in the SEW-based Needs 2040 and in ‘No investment after 2025’
Because the current identification of system needs method- are not sufficient to properly decrease CO2 emissions to an
ology focuses on benefits in terms of socio-economic welfare extent consistent with EU climate ambitions. This explains the
and integration of renewable energy sources, the network relatively reduced impact of the SEW-based Needs especially
increases composing the SEW-based Needs are not optimal in the first decade to come, compared to a future with no
with regard to CO2 emissions reduction. CO2 is partially taken investment after 2025, when using the current ETS CO2 price.
into account in socio-economic welfare via the ETS CO2 price
which producers have to pay when they emit CO2, because To investigate the impact if the CO2 price was increased,
it is included in the generation cost. However, the ETS CO2 ENTSO-E has run a sensitivity study for 2030 with a price of
prices of 28 EUR/ton of CO2 in 2030 and 75 EUR/ton in 2040 100 €/ton of CO2 4.
‘No investment after 2025’ SEW-based Needs 2030 ‘No investment after 2025’ SEW-based Needs 2030
with the current with the current with a CO2 price of with a CO2 price of
ETS CO2 price of 28 €/ton ETS CO2 price of 28 €/ton 100 €/ton 100 €/ton
Increased capacity in GW – 50 – 74
Curtailed energy in TWh / year 49 28 49 23
CO2 emissions in Mton / year 618 576 508 452
Figure 2.7 – Key indicators in 2030 in No investment after 2025 and SEW-based Needs, with a CO� price of 28 €/ton
and 100 €/ton
By increasing the marginal cost of electricity generation for In a second step, a higher CO2 price implies a higher level of
highly emitting plants, increasing CO2 price changes the merit investment in cross-border network capacity until 2030, with
order in the 2025 starting grid, with plants with high CO2 emis- an additional 24 GW of capacity increase (compared to the
sions being substituted by plants with lower CO2 emissions. increase with a lower CO2 price). These investments in turn
As a result, CO2 emissions in the ‘No investment after 2025’ decrease CO2 emissions even more, by reducing curtailed
case with a higher CO2 price would already be reduced by energy by an additional 5 TWh / year.
110 Mton / year.
4 100€/ton corresponds to the central climate change avoidance cost at this horizon according to DG MOVE Handbook on external costs of Transport
(2019)
ENTSO-E Completing the map – Power system needs in 2030 and 2040 // 25Towards increased market integration
By connecting more consumers with more producers, grid costs in some countries, with direct impact on consumers’
development allows a better use of the cheapest generation. electricity bills. If Europe stops to invest in grid after 2025,
As a result, European countries can exchange electricity to exchanges would be constrained leading to an average
replace expensive generation with cheaper one. On the oppo- marginal cost difference 5 of 7 € / MWh between bidding zones
site, limiting exchange capacity alters market integration and by 2030. The impact is even stronger by 2040 with an average
would result in splits between regional market prices. Frag- marginal cost difference of 35 € / MWh.
mented markets therefore lead to artificially high marginal
Generation costs decrease by 10 billion euro per year by 2040
The capacity increases found in the SEW-based Needs have › In 2030, the main drivers of the investments are the better
a major impact on generation costs: they lead to a reduction access to RES generation (mainly in Germany, Spain and
of costs for Europeans of about 3 bn € / year in 2030 and the Netherlands) and nuclear generation (mainly in France)
10 bn € / year in 2040. These gains far outweigh the cost of that replaces expensive thermal generation (in particular
building the grid, of 17 bn € for the SEW-based Needs 2030 gas in Italy and Poland and coal in Poland).
and 45 bn € for 2040. They are the result of a better use of the
European generation mix:
TWh
60
40
20
0
-20
-40
Avoided Curtailment Coal Gas Nuclear
Figure 2.8 – Difference in the generation mix of the ENTSO-E area in 2030, between the ‘No investment after 2020’
case and the SEW-based Needs 2030 (in TWh)
TWh
30
20
10
0
-10
-20
-30
AL AT BA BE BG CH CY CZ DE DK EE ES FI FR GR HR HU IE IT LT LU LV ME MK MT NL NO PL PT RO RS SE SI SK U K
Avoided Curtailment Coal Gas Nuclear
Figure 2.9 – Difference in the generation mix per country in 2030, between the ‘No investment after 2020’ case and
the SEW-based Needs 2030 (in TWh)
5 The price differences discussed here are taken in absolute value (the yearly mean is the mean of the absolute value of the hourly spread) in order to give
some insight on the interest of the exchange.
26 // ENTSO-E Completing the map – Power system needs in 2030 and 2040› In 2040, the main driver remains better access to RES
generation, with the highest avoided curtailed energy
in Germany, Spain, Portugal and Sweden, that replaces
thermal generation from gas mainly in Italy, Greece and
Poland.
TWh
150
100
50
0
-50
-100
Avoided Curtailment Coal Gas Nuclear
Figure 2.10 – Difference in the generation mix of the ENTSO-E area in 2040, between the ‘No investment after 2025’
case and the SEW-based Needs 2040 (in TWh)
TWh
40
30
20
10
0
-10
-20
AL AT BA BE BG CH CY CZ DE DK EE ES FI FR GR HR HU IE IT LT LU LV ME MK MT NL NO PL PT RO RS SE SI SK U K
Avoided Curtailment Coal Gas Nuclear
Figure 2.11 – Difference in the generation mix per country in 2040, between the ‘No investment after 2025’ case and
the SEW-based Needs 2040 (in TWh)
ENTSO-E Completing the map – Power system needs in 2030 and 2040 // 27Higher electricity exchanges and price convergence between countries
Cross-border capacities increases allow European countries to In addition, increasing cross-border capacities converges Euro-
exchange more energy: in total an additional 256 TWh / year and pean marginal costs 6 to an average spread under 4 € / MWh
467 TWh / year would be exchanged in 2030 and 2040 respec- and 8 € / MWh in 2030 and 2040 respectively. For example,
tively, relative to the situation where Europe would not invest in with no grid investments after 2025, the French-Italian border
the grid after 2025. This brings the total exchange volume to would be congested 95 % of the time in 2030 with an average
909 TWh / year in 2030 and 1,176 TWh / year in 2040. price difference of 24 € / MWh. The SEW-based Needs reduce
< 2.00 €/MWh
2.00–5.00 €/MWh NO 1
5.00–10.00 €/MWh
> 10.00 €/MWh
SE 1
SE 2
FI
NO 2
NO 3
SE 3 EE RU
LV
SE 4
DKW 1 LT
NI DKE 1 RU
BY
IE
UK
PL
NL
DE UA
BE
LU CZ
SK MD
AT HU
RO
CH
FR
SI
HR
IT
ITn RS
BA
BG
ITcn XK
ME MK
ITcs TR
PT AL
ES ITs
GR
ITsar
CY
ITsic
MA MT
DZ TN
Figure 2.12 – Difference in marginal costs between neighbouring bidding zones in 2030, in ‘No investment after 2020’
case (left) and the SEW-based Needs 2030 (right)
6 Countries with high marginal costs tend to see these costs decrease and countries with low marginal costs tend to see an increase.
28 // ENTSO-E Completing the map – Power system needs in 2030 and 2040You can also read