Climate change and critical infrastructure - storms - JRC ...
←
→
Page content transcription
If your browser does not render page correctly, please read the page content below
Climate change and critical
infrastructure – storms

 Georgios Marios Karagiannis
 Monica Cardarilli
 Zehra Irem Turksezer
 Jonathan Spinoni
 Lorenzo Mentaschi
 Luc Feyen
 Elisabeth Krausmann

 2019

 EUR 29411 EN
This publication is a Science for Policy report by the Joint Research Centre (JRC), the European Commission’s
science and knowledge service. It aims to provide evidence-based scientific support to the European
policymaking process. The scientific output expressed does not imply a policy position of the European
Commission. Neither the European Commission nor any person acting on behalf of the Commission is
responsible for the use that might be made of this publication.

Contact information
Name: Elisabeth Krausmann
Address: Joint Research Centre, Via Enrico Fermi 2749, 21027 Ispra (VA), Italy
Email: elisabeth.krausmann@ec.europa.eu

JRC Science Hub
https://ec.europa.eu/jrc

JRC113721

EUR 29411 EN

 PDF ISBN 978-92-79-96403-9 ISSN 1831-9424 doi:10.2760/986436

Luxembourg: Publications Office of the European Union, 2019

© European Union, 2019

The reuse of the document is authorised, provided the source is acknowledged and the original meaning or
message of the texts are not distorted. The European Commission shall not be held liable for any consequences
stemming from the reuse.

How to cite this report: Karagiannis, G.M., Cardarilli, M., Turksezer, Z.I., Spinoni, J., Mentaschi, L., Feyen, L.
and Krausmann, E., Climate change and critical infrastructure – storms, EUR 29411 EN, Publications Office of
the European Union, Luxembourg, 2019, doi:10.2760/986436.

All images © European Union 2019, except:
Cover page, Fré Sonneveld, 2014. Source: https://unsplash.com/@fresonneveld
Page 11, Figure 5, FEMA, 2017. Source: https://www.fema.gov/media-library/assets/images/141939

Climate change and critical infrastructure – storms
This study attempts to elucidate the vulnerability of critical energy infrastructure to storms. First, it gauges how
certain characteristics of storms affect the resilience of the power grid. Then, it presents a methodology for
assessing the change in the level of risk to critical infrastructure due to the impact of climate change on the
frequency and severity of storms.
Contents

Executive summary ............................................................................................... 2
1 Introduction ...................................................................................................... 3
2 Power grid resilience to storms – incident analysis ................................................. 5
 2.1 Research design and data collection ............................................................... 5
 2.2 Damage types and storm impact on power grid resilience ................................. 6
 2.3 Equipment damage and hazard mitigation ...................................................... 8
 2.4 Early warning, emergency response and recovery .......................................... 12
3 Effects of climate change on the level of risk from an economic perspective ............ 15
 3.1 Methodology ............................................................................................. 15
 3.1.1 Probability of occurrence ..................................................................... 15
 3.1.2 Loss estimation ................................................................................. 15
 3.1.2.1 Losses to critical energy infrastructure ............................................ 16
 3.1.2.2 Impact on the local economy ......................................................... 18
 3.1.3 Change in risk level ............................................................................ 20
 3.2 Demonstration of the methodology .............................................................. 21
 3.2.1 Case study site .................................................................................. 21
 3.2.2 Hazard analysis ................................................................................. 21
 3.2.3 Loss estimation ................................................................................. 22
 3.2.3.1 Data and assumptions .................................................................. 22
 3.2.3.2 Results ....................................................................................... 24
 3.2.4 Risk analysis ..................................................................................... 28
 3.3 Discussion ................................................................................................ 29
4 Recommendations for disaster risk management ................................................. 31
References ......................................................................................................... 34
List of abbreviations and definitions ....................................................................... 38
List of figures ...................................................................................................... 39
List of tables ....................................................................................................... 40
Annex ................................................................................................................ 41

 i
Executive summary
Infrastructure systems are the backbone of modern economies, and critical infrastructure
resilience is essential to sustainable development. Natural hazards can affect the
electricity supply and result in power outages which can trigger accidents, bring economic
activity to a halt and hinder emergency response until electricity supply is restored to
critical services.
This study attempts to elucidate the vulnerability of critical energy infrastructure to
storms and outlines how certain characteristics of this hazard affect the resilience of the
power grid based on forensic analysis. Wind loading and debris impact are the main
causes of storm damage. Tall, slender structures, such as transmission towers,
distribution poles and wind turbines are most affected. Transmission and distribution
assets can also be damaged by the impact of flying debris. Moreover, freezing rain forms
glaze ice which accumulates on power lines and increases their catenary load. The added
weight can cause the line to break or distribution poles and transmission towers to
collapse. Substations were also found to be affected by storms, particularly by inundation
and airborne debris. However, damage from flying debris was less compared to that
sustained by transmission and distribution lines. Storms in coastal areas may affect
transmission and distribution networks by increasing the amount of saltwater deposits on
electrical equipment. Given adequate preparedness, early warning can help expedite
recovery by allowing TSOs and DSOs to activate disaster response plans, including surge
mechanisms and mutual aid agreements, before the storm hits.
We also present a methodology to investigate the impact of climate change on the risk
posed by storms to the power grid. Our approach combines a future projection of the
recurrence interval of selected storm scenarios and the assessment of the estimated
economic losses incurred by critical infrastructure and those resulting from the disruption
of daily economic activity. A case study was conducted to demonstrate the methodology
in a large urban area in Western Europe. We derived the projected peak wind gust of the
10-, 50- and 100-year storm scenarios for five time periods. For each recurrence
interval, the cost to repair the damage to overhead lines and the economic losses from
the interruption of the daily economic activity amount each to about half of the total
losses. The proportion of the repair cost increases by approximately 10% for the 50-year
and the 100-year storms compared to the 10-year scenario. This increase causes the
total expected losses from the 50-year and the 100-year storms to rise as well.
The duration of the power outage has a major impact on the estimated losses for all
scenarios across all time periods. In this case study, the increase of the duration of the
power outage from 3 days to 10 days increases the total expected losses 3.5 times. With
longer-term power outages, the economic losses caused by interruption of the daily
economic activity progressively become the main determinant of the total impact.
The scope of this study is limited to demonstrating the feasibility of the methodology and
inductively drawing preliminary conclusions regarding the impact of storms on critical
infrastructure given climate change conditions. It is not intended to supplement, replace
or challenge existing risk assessment and management plans prepared by Member
States.
The following recommendations emerged from the findings of this study:
— Consider increasing transmission tower design requirements for resistance to wind
 loading in standards and regulations.
— Consider the risk from climate change in investment analyses.
— Consider events with recurrence intervals longer than 100 years in hazard mitigation
 and emergency planning.
— Standardize mutual aid resources.
— Plan for surge capabilities and external contractors.

 2

1 Introduction
Infrastructure systems are the backbone of modern economies, and critical infrastructure
resilience is essential to the societal well-being and sustainable development. The risk
environment facing critical infrastructure in Europe is complex and in constant change.
The Overview of Natural and Man-made Disaster Risks the European Union may face (1)
outlines numerous natural, technological and human-caused hazards and threats.
Meteorological hazards, such as floods, storms and wildfires (2), are among those most
frequently identified by Member States in their National Risk Assessments. In a recent
study, Forzieri et al. (2016) predict a likely increase in the frequency of extreme weather
events across Europe. The exposure of coastal and floodplain areas to extreme weather
is expected to increase. Neumann et al. (2015) estimate that between 82.9 and 85.7
million people will be living in low-elevation coastal zones (3) and the 100-year floodplain
in Europe by 2030.
Because of the high population density and important economic activity, infrastructures
are also concentrated in coastal and floodplain areas. Therefore, the exposure of critical
infrastructures to meteorological hazards is likely to increase disproportionately with
climate change. Forzieri et al. (2018) estimate that damage to critical infrastructure due
to climate change in Europe could increase to ten times present values by the turn of the
century, but southern and southeastern European countries will be most affected. The
impact of storm surge, riverine and flash flooding, and windstorms on critical
infrastructure is expected to increase across Europe. The losses are likely to be highest
for the chemical, manufacturing, transportation and energy sectors.
Several authors (Forzieri et al., 2018; Neumann et al., 2015; Mechler et al., 2014)
highlight the need for further research in the quantification of vulnerability of critical
infrastructures to meteorological hazards. This study focuses on the energy sector,
mainly because of its ubiquity in everyday life and the dependence of all other critical
infrastructures on a reliable supply of electric power (Karagiannis et al., 2017a). A
previous study (Karagiannis et al., 2017b) presented a methodology to investigate the
impact of climate change on the risk posed by floods to critical infrastructure and
suggested the approach be expanded to other natural hazards as well.
This study attempts to elucidate the vulnerability of critical energy infrastructure to
storms, with emphasis placed on the power grid. First, we discuss the impact of storms
on the power grid and outline how certain characteristics of this type of hazard affect the
resilience of the power grid using forensic analysis. Second, we present a methodology to
investigate the impact of climate change on the risk posed by storms to the power grid
infrastructure. Our approach combines a future projection of the recurrence interval of
selected storm scenarios and the assessment of the estimated losses incurred to critical
infrastructure and those resulting from the disruption of daily economic activity. A case
study was conducted to demonstrate the methodology in a large urban area in Western
Europe. The scope of this study aims at demonstrating the feasibility of the methodology
and inductively drawing preliminary conclusions regarding the impact of storms on critical
infrastructure given climate change conditions. It is not intended to supplement, replace
or challenge existing risk assessment and management plans prepared by Member
States.
This is a two-part study. Chapter 2 is the first part, which is intended to improve the
understanding of power grid’s resilience to storms. It is based on the analysis of past
storm occurrences and their impact on the power grid. Its purpose is to inform policy-

(1) Commission Staff Working Document: Overview of Natural and Man-made Disaster Risks the European
 Union may face, Brussels, 23.5.2017, SWD(2017) 176 final, http://ec.europa.eu/echo/sites/echo-
 site/files/swd_2017_176_overview_of_risks_2.pdf (accessed October 29, 2018)
(2) NFPA 1600 Standard on Disaster/Emergency Management and Business Continuity/Continuity of
 Operations Programs, 2016, https://www.nfpa.org/codes-and-standards/all-codes-and-standards/list-of-
 codes-and-standards/detail?code=1600 (accessed October 30, 2018)
(3) Defined as the contiguous and hydrologically connected zone of land along the coast and below 10 m of
 elevation (Neumann et al., 2015).

 3
making and strategic and disaster risk management planning in the European Union and
Member States. Additionally, however, this analysis serves as a foundation of the risk
assessment methodology that follows. Specifically, Chapter 3 is the second part of this
study and outlines a methodology for the estimation of the change in the risk level of
failure or disruption of the power grid resulting from the impact of climate change on the
frequency and severity of storms. Risk is quantified in economic terms to support cost-
benefit analyses.

 4
2 Power grid resilience to storms – incident analysis
Widespread power outages are a common occurrence during storms. This chapter
examines storm damage to the power grid with a focus on restoration and resilience. It
endeavors to elucidate how the impact of storms affects the recovery of the power grid.
It is intended to inform policy-making and disaster risk management planning in the
European Union Member States.

2.1 Research design and data collection
The research design for this part of the study was predominantly purposeful. It focused
on disruptions of the power grid caused by storms and explored the relationship between
recovery time and hazard characteristics. This part was data-driven, using an inductive
approach. The findings in this chapter are based on the analysis of lessons identified
from 52 storms, including tropical and extratropical cyclones, as well as ice, snow and
wind storms (Figure 1) affecting 14 countries in 4 continents (the full list of the events is
included in the Annex). Whenever a storm affected more than one countries, a separate
record was made for each affected country, producing a total of 58 cases ( 4). Cyclones
made up approximately 2/3 of our sample, followed by wind storms.

 Figure 1. Breakdown of storms reviewed in this study, by type

 Source: JRC

Storms were included in the analysis if they caused damage to power grid components.
This study was based exclusively on publicly available information. Sources
included the scientific literature, technical reports, disaster response operations situation
reports and press articles. The quality, detail and granularity of data describing the storm
intensity, damage, power outages and impact on the population were a particular
challenge. Most of the information in the dataset was categorical, but numerical data was
considered whenever feasible and available. The level of detail varied across sources. The
information was sufficient to establish the type of damage and the failure mechanism.
The affected population was typically reported as the proportion of customers or
households where the hazard impacts were observed.
Nevertheless, several limitations undermined data collection and analysis. The intensity
of the wind storms and cyclones was either reported in terms of the mean wind speed or

(4) The terms “records” and “cases” are used here interchangeably.

 5
peak wind gust for wind storms, but reporting was inconsistent in terms of the metric
used. Precipitation height was reported as a proxy of snow and ice storm intensity. In
addition, the exposure of power grid components to varying storm intensity levels (i.e.
wind speed or precipitation height) was difficult to establish. Spatial distributions of wind
speed and/or precipitation were generally neither comprehensive nor readily available.
Inconsistencies in the description of the impact, location and duration of power outages
caused by storms were another challenge. The impact of a power outage was described
in several different units of measurement, including people, customers, households,
houses, homes, businesses and properties suffering an outage. The impact was described
with numbers in 55 out of 58 records (including relative descriptions in 14 cases), with
categorical descriptions in 2 cases, and was unknown in 1 case. Furthermore, several
different thresholds were used to report recovery time. Information on the duration of
the outage was available in only 34 cases. Each source used different definitions and
indicators of recovery. Most sources reported the time needed after the onset of the
outage to restore power to varying numbers or percentages of affected units (e.g.
customers, households etc.).
Information on the type of damage and the types and numbers of affected assets were
reported in 38 out of 58 cases, of which only 30 included numbers of damaged
equipment and assets per category. However, it was often unclear whether damage was
caused by storm-related flooding, wind loading, debris impact, or a combination of the
above. In addition, the localization of damage or outages was also unclear, and was
described as a general area, not associated with any clear geographical or administrative
boundaries, or for the entire event. Similar challenges were noted in a previous study
(Karagiannis et al., 2017a), but the quality of reported information on storms seems to
be lower than for earthquakes or floods. Clearly, the granularity of reported
information needs to be improved if statistical correlations between wind speed
and the duration of a power outage are to be made at a larger scale.
In addition, there are inconsistencies in recovery time reporting. First, not all sources
reported recovery time. Second, different definitions and indicators of recovery were
used by each reporting source. Some sources defined recovery as the restoration of
service to the population affected by a power outage, while others as the repair of the
power grid or subsystems to its pre-disaster state. Last, most sources reported the time
to achieve a different fraction of complete recovery, such as a percentage of the affected
population with restored service, or a percentage of power generation.
Two power grid recovery thresholds were used in this study. The first threshold is the
restoration of power supply to customers. Both domestic and industrial customers were
considered, based on available information. This threshold includes efforts directed at
temporary repairs or workarounds, as well as the use of backup generators. The progress
of recovery in this case is usually reported in terms of the percentage or number of
customers with power supply, or the quantity of power supplied, expressed in power
units or as a percentage of pre-earthquake supply. The second threshold is the complete
repair of the network, so that temporary solutions, including generators, are no longer
required.

2.2 Damage types and storm impact on power grid resilience
Power outages occurred during all but one of the storms reviewed in this study. The one
exception was a wind storm which occurred in September 1996 in France (Abi-Samra,
2010). The high winds collapsed 22 transmission towers and 18 wood poles. Despite the
collapse of a regional transmission system, equipment located outside the 2-km-wide
storm track was undamaged and no customers were affected. One reason for the
limited impact was the narrow storm corridor.
Storms of all kinds can bring heavy rains, strong winds, hail and lightning, and
may also spawn tornadoes (Bullock, Haddow & Coppola, 2012). The main causes of
storm-related damage to electricity network assets are inundation, wind

 6
loading and debris impact. Inundation resulting from heavy rains associated with
storms and storm surge can be detrimental to the power grid. Because water is a good
conductor of electricity, electrical equipment is highly sensitive to even minute quantities
of moisture and dirt. Some components, such as transformers and electrified substation
equipment, may even suffer catastrophic and even explosive failures if wet. The effect of
flood-related damage has been addressed in Karagiannis et al. (2017b); therefore, this
report focuses on wind damage, which has also been demonstrated to create significant
damage to the electricity infrastructure system (Reed et al., 2010). Nevertheless,
inundation damage is taken into consideration in the analysis when relevant.
As expected, the areas on or adjacent to the storm’s track were affected the most. All
other things being equal, the number of people affected by these disruptions increased
with the peak wind speed and the population density in the affected area. However, the
data available to us was insufficient to derive a statistical correlation between the peak
wind speed, the population density in the affected area and the number of people
affected by the outage.
Despite the fragmented nature of available data, this analysis helped elucidate important
aspects of the power grid’s resilience to storms. Table 1 below outlines the main findings.
Transmission and distribution towers and lines appear to be the most
vulnerable components of the networks. Utility poles (5) suffer bending failures and
can be damaged by the impact of flying debris, which may also sever overhead lines.
Inundation is more severe of a threat for substations. Early warning is possible and,
together with disaster preparedness, goes a long way in expediting recovery.
Recovery time ranges between hours and months, depending on the extent of
the damage and the effectiveness of disaster response. Recovery here is construed
as the restoration of power supply to all customers who are able to receive it. Given the
inconsistencies in reporting discussed in the previous section and the inherent
uncertainty governing temporary repairs and recovery operations, recovery time is
reported here as a range instead of a precise value. It is driven by the sheer number of
damaged items and the time it takes to repair or replace them. The following sections
discuss these aspects in further detail.

Table 1. Overview of damage types and storm impacts on the resilience of the power grid

Damage types Bending failure due to wind pressure
 Impact of flying debris
 Inundation (substations mostly)

Contributing Early warning possible
factors
 Disaster preparedness

Most vulnerable Utility poles and overhead lines
components
 Substations (including transformers)

Recovery time Number of items in need of repair or replacement
driven by
 Access to conduct repairs

Recovery time A few hours to six months; most commonly, up to one month.
range
 Recovery time was longer for hurricanes than for other storms.

(5) The term “utility poles” is used in this report to refer collectively to transmission and distribution cable-
 bearing structures.

 7
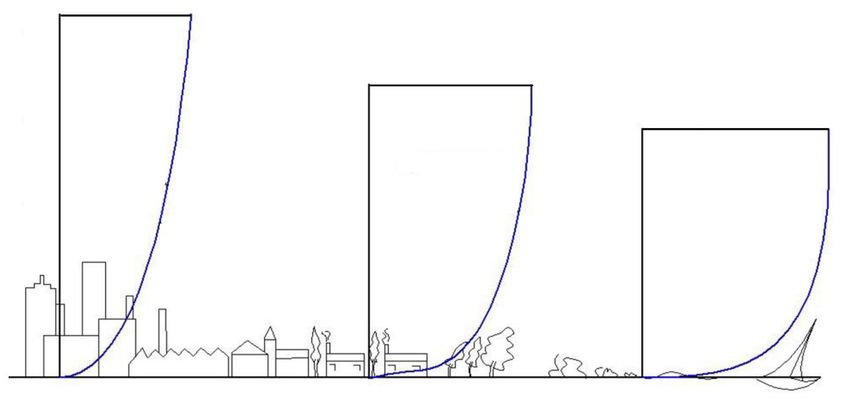
2.3 Equipment damage and hazard mitigation
Wind loads increase with wind speed (6), which fluctuates with time and increases with
height. Close to the ground, the wind is slowed down by friction, while at higher
elevations, the wind is faster. In structural and environmental engineering, the variation
of the mean wind speed variation within the atmospheric boundary layer is described
using power law profiles (Chen & Richard Liew, 2003). Several building codes consider
that wind speed achieves a practical maximum speed a few hundred meters above
ground level (Edgar & Sordo, 2017). The friction increases with terrain roughness, which
depends on the size and number of the surface features on the ground over which the
wind blows (Figure 2). Therefore, the wind forces exerted on a structure also increase
with height.

 Figure 2. Wind profiles on different terrain types

 Source: Adapted from Bendjebbas et al. (2016)

Wind forces act inward on the windward side of a structure and outward on the other
sides (Figure 3). The response of a structure exposed to wind, i.e. the effect of the wind
on it, depends on the structure’s size, shape and dynamic properties. Higher wind
pressures are exerted on tall, slender structures presenting a wide profile against
incoming winds, resulting in higher bending moments and base shear internal forces.
Impact by debris was the second major cause of damage identified in this study. Falling
trees or large branches were the most frequently cited examples of this type of effect.
Because of their high exposure, transmission and distribution towers and lines are
affected the most. Transmission towers are tall, three-dimensional steel trusses,
designed to carry and support transmission cables. Several standards apply to the design
of towers to resist wind loads (Table 2). Because transmission towers transport electricity
over large distances, they are typically located in the open. They can also be exposed to
high wind forces due to their height and the absence of surrounding features that could
mitigate the impact of the wind forces. In addition, these structures may be subjected to
higher wind pressures when the cross-arms (the members protruding to the side which
support transmission cables) are facing the wind at a right angle.
Transmission tower failures were recorded in nearly all incidents reviewed in this
study. Wind loading produced two distinct mechanisms of damage. The first was

(6) Specifically, the wind pressure is proportional to the square of the wind speed.

 8
bending failure of the tower under the wind’s distributed horizontal load. This
mechanism typically causes the affected towers to twist downward. Although the
photographic evidence available to us was in no way exhaustive, the point of inflection
appears to be located in the middle third of the structure’s height, above the juncture of
the legs. In most cases, the horizontal conductor support cross-arms appear to remain
unaffected, but the tower twists until its top comes to rest on the ground. The second
mechanism was failure of the tower foundation, causing the structure to tilt. This
failure mode is typical in hurricanes, when wind pressures are combined with heavy rain
which reduces the cohesion and resistance of the soil under the tower, causing the
foundations to fail.

 Figure 3. Wind pressure on structure surfaces (we1 and we2 denote respectively the positive
 pressure exerted on the windward side and the negative pressure exerted on the leeward side of
 the structure)

 Source: Eurocode 1, Part 1-4 (European Committee for Standardization, 2010)

Table 2. Standards applying to the design of transmission towers under wind action

 Organization Standard/Regulation Year

American Society of Guidelines for electrical transmission line structural 1991
Civil Engineers loading, ASCE Manuals and Reports on Engineering
 Practice No. 74

International (IEC Standard 60826) Design criteria of overhead 2003
Electrotechnical transmission lines.
Commission

Mexican Federal Civil works manual. Chapter of wind design 2008
Electricity Commission

American Society of (ASCE/SEI 7–10) Minimum design loads for 2010
Civil Engineers buildings and other structures.

European Committee for (EN 1991-1-4:2005+A1:2010) Eurocode 1: Actions 2010
Standardization on structures – Part 1-4: General actions – Wind
 actions

Standards Australia, (AS/NZS 1170.2) Structural design actions. Part 2: 2011
Standards New Zealand Wind actions

 9
In addition to direct damage from wind loads, severe damage to transmission towers and
lines resulted from flying debris. Smaller debris, such as tree branches, may dangle
and/or shear aerial cables at several points along a line. Larger debris, such as trees, can
knock down transmission towers and distribution poles, and damage heavy equipment
upon impact. The numbers of transmission tower failures because of wind loading vs.
those attributed to debris impact were only available for a fraction of the events reviewed
in this study. However, wind loading appears to be the most frequent failure mechanism.
For instance, when cyclones Lothar and Martin hit Europe, most of the damage sustained
by the French transmission grid resulted from wind loads rather than from debris impact,
as illustrated in Figure 4. It also appears that 63 and 90 kV towers were much more
vulnerable to debris damage than 225 and 400 kV towers. In this case, falling trees were
the main cause of debris damage (OSCE, 2016).
Furthermore, Figure 4 shows that in absolute terms the number of damaged 63 and 90
kV towers is more than twice the number of damaged 225 and 400 kV towers.
Nevertheless, this information alone does not support any conclusions about the
vulnerability of any type of tower over another to storm damage. Although it can be
argued that there are more 63 and 90 kV towers than 225 and 400 kV towers in any one
area, the reported information does not include the number of towers exposed to
equivalent wind speeds but undamaged.
The number of exposed (i.e. the sum of out-of-order and undamaged) 63 and 90 kV
circuits is more than four times higher than the number of exposed 225 kV circuits and
about 9 times higher than the number of exposed 400 kV circuits. However,
approximately 8% of exposed circuits of each voltage category went offline.

 Figure 4. Damage to the French transmission grid resulting from cyclones Lothar and Martin:
 towers destroyed by wind and debris (left axis), and circuits out of order (right axis)

 Source: OSCE, 2016

Wind turbines also suffered damage from wind loading. These structures are made of a
tall and relatively slender column supporting a heavy load at the top. Therefore, despite

 10
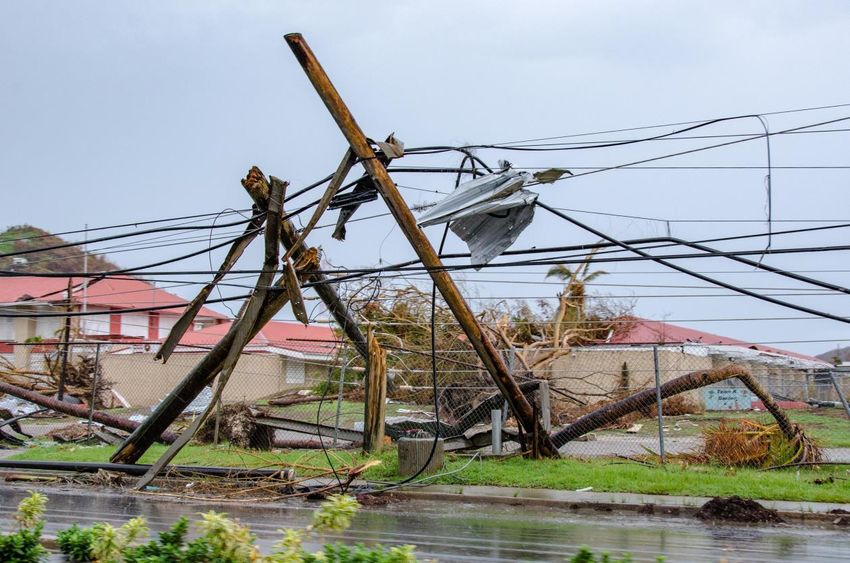
their aerodynamic shape which somewhat reduces wind pressures, a relatively small
displacement of the large mass at the top generates a disproportionately greater bending
moment at the base. The result is a failure mechanism similar to that of transmission
towers.
Wooden and concrete distribution poles were also affected. Distribution pole
failures were more frequent than losses of transmission towers and occurred during
every storm in this study. The mechanisms of damage were similar to those of
transmission towers. When subjected to direct wind loading, wooden poles may snap
(Figure 5) and concrete poles may fail in bending. Although the numbers of failures of
distribution poles and transmission towers were only available for a fraction of the
incidents reviewed in this study, the distribution system suffered disproportionately in
terms of absolute numbers. For instance, Hurricane Katrina damaged 3,000 miles (4,828
km) of transmission lines and 28,500 miles (45,866 km) of Entergy’s infrastructure in the
United States (Entergy Corporation, 2005). Although the fraction of this damage
attributed to flooding, wind forces or debris impact was unclear, transmission and
distribution substations typically take a higher toll during floods (Karagiannis et al.,
2017a). The higher impact of storms to distribution poles and lines is arguably attributed
to their higher number in the affected area, as there are more distribution lines than
transmission lines, and the former tend to be more concentrated in urban areas.

 Figure 5. Snapped utility poles in St. Thomas, U.S. Virgin Islands, after Hurricane Irma

 Source: FEMA, 2017 (7)

In addition to the effects of wind loads and debris impact, a particular kind of
transmission and distribution line damage occurs during ice or snow storms. Freezing
rain forms glaze ice which accumulates on power lines and increases their
catenary load. The added weight can cause the line to break or distribution poles and

(7) Federal Emergency Management Agency, https://www.fema.gov/media-library/assets/images/141939
 (accessed December 5, 2018)

 11
transmission towers to collapse. Furthermore, glaze ice may accumulate on trees,
causing large branches to fall tearing down power lines. For instance, these types of
effects were quite pronounced during the winter storm which hit the Northeastern United
States (New Hampshire, New York, Vermont, Massachusetts, Connecticut, Pennsylvania
and Maine) in December 2008, leaving 1,365,500 customers without power. In the State
of New York alone, National Grid replaced 350 utility poles and 235 km of cables (Nelson
et al., 2009).
Substations were also affected by storms in this study, albeit to a lesser extent
compared to transmission and distribution lines. Inundation and airborne debris
were the leading mechanism of damage. Because electrical equipment is often
sensitive to even minute amounts of moisture and dirt, flooding can take substations
offline for days or weeks (Karagiannis et al., 2017a). Flying debris may also affect
substation equipment, such as transformer retaining structures. Records of substation
damage were found in 15 (out of 52) storms reviewed in this study. Of those, 12 were
related to hurricanes and 3 to other types of storms. Hurricane records were unclear as
to whether damage was due to flooding, wind loading or airborne debris. Other than
inundation, substations went offline when they were disconnected from the grid
because power lines were severed due to tower failures or debris.
Storms in coastal areas may affect transmission and distribution networks by
increasing the amount of saltwater deposits on electrical equipment. As
discussed in Karagiannis et al. (2017a), this may cause catastrophic failure of some
electrified devices. Non electrified equipment may also be affected, because the saltwater
deposits must be thoroughly cleaned before the equipment gets back online.
Several mitigation strategies have been used to increase the grid’s resilience to storms.
One example is the use of alternative tower designs which limit the structure’s response
to wind loads. For instance, according to a report by the Puerto Rico Energy Resiliency
Working Group (2017), monopole towers fared better than the lattice structures when
Hurricane Maria hit Puerto Rico in 2017. Although not specified in the report, it is safe to
presume that the reason is that their narrower profile reduces wind pressures. Another
structural mitigation method is strengthening the foundations of transmission towers to
reduce their vulnerability to toppling. This measure may also help to mitigate against
flood and earthquake hazards (Karagiannis et al., 2017a).
However, structural mitigation measures may have unwanted side-effects. For
example, one flood mitigation strategy involves elevating vulnerable equipment, such as
switchgear and relays, above the expected water level (Karagiannis et al., 2017a).
However, this strategy may expose substation equipment to debris impact. For instance,
airborne debris was the primary cause of heavy damage caused by Hurricane Rita to
elevated substation equipment in Texas (Reed et al., 2010).

2.4 Early warning, emergency response and recovery
Early warning can play a significant role in electricity grid resilience during storms.
Modern weather forecasting systems can provide notification of a forming storm system
or worsening weather conditions with a lead time of a few days, depending on local and
regional conditions. Uncertainty is inherent in all hydrometeorological predictions, but is
seldom communicated with weather forecasts. The lack of information on the uncertainty
of weather predictions can undermine decision-making in disasters (National Research
Council, 2006).
Although there is little that can be done to protect power grid assets from high winds in
the hours or days before a storm hits, early warning is a significant component of
electricity resilience in two ways. First, effective early warnings can help TSOs and
DSOs mitigate the effects of the inundation caused by the intense rainfall which
often comes with storms, by preemptively shutting down substations which
may be flooded. This measure prevents catastrophic damage which would otherwise be
caused when electrified equipment came in contact with water and reduces the asset

 12
recovery time to that needed for cleanup and repair (Karagiannis et al., 2017a). Second,
early warning gives TSOs and DSOs time to activate their emergency operations
plans.
The impact of storms on critical power infrastructure follows a pattern of widespread
moderate to catastrophic damage to the most vulnerable components along the storm’s
path. Power grid recovery in the aftermath of storms is therefore driven by the
need to repair or replace large numbers of utility towers and poles, and replace
large lengths of electric cables. The success of emergency response for TSOs and
DSOs is judged by how fast power is brought back online to the maximum number of
users possible. The need to rapidly conduct a vast number of repairs often exceeds the
capacities of any single TSO/DSO and generates a demand for rapid repair capability,
which is highly dependent on disaster preparedness.
Rapidly increasing electricity infrastructure repair capabilities in the aftermath of a major
storm requires mobilizing manpower, equipment and spare parts. TSOs/DSOs often enter
into mutual aid agreements with neighboring jurisdictions to acquire repair crews and
equipment in the event of an emergency. Additional equipment and spare parts are
usually acquired through mutual aid agreements, from corporate suppliers, or both.
Response-generated demands include shelter, food and water for both mutual aid and
home-based repair crews, transportation for people and equipment, fuel and
consumables. For example, the rapid restoration of power to every customer of
Mississippi Power who could receive it in the aftermath of Hurricane Katrina is largely
attributed to the company’s efficient disaster logistics (Ball, 2006).
Lessons identified after the response to a severe winter storm that hit Slovenia in 2014
emphasize the need for disaster preparedness in a European context. Over the
course of five days, from January 30 to February 3, 2014, between 40 and 200 mm of
precipitation fell on most of the country. In the western and southwestern part of the
country, rainfall reached 300 mm (Markosek, 2015). Freezing rain caused extensive
damage to the country’s transmission and distribution infrastructure. Electro Ljubljana
rapidly reinforced their capabilities through mutual aid agreements with foreign
distribution companies. The response effort was carried out by 1,500 people from civil
protection, fire/rescue, the military, voluntary organizations, construction companies and
electricity companies. The use of temporary transmission towers was particularly
effective, as it helped to rapidly reconnect transmission substations to the grid (OSCE,
2014).
However, several problems hampered the response and slowed down recovery efforts.
Most were due to the lack of interoperability with non-traditional responders and mutual
aid resources. First, record keeping during the operation was a challenge, because
different companies used different systems. Second, local surge arrangements lacked
efficiency. Several workers were engaged without written agreements, either because
printing was impossible due to the power outage, or because of the perceived urgency to
make the resources available in the field. Contractors selected through a tender were
sometimes unfamiliar with the area. Many volunteers were former employees of the
company, by then retired. Despite their technical competencies, they could not be
insured and were thus assigned less difficult tasks. Third, language barriers hampered
communications with mutual aid crews. In addition, local staff were tied liaising with
mutual aid crews which were unfamiliar with the area and local practices, which reduced
the number of available local resources. Last, transportation was difficult because of road
closures, and cellular service was interrupted as soon as base stations ran out of backup
power. Until power was at least partially restored, the operation had to rely only on
satellite communications (OSCE, 2014).
Access is also a major determinant of the power grid recovery in the aftermath
of storms. Transmission towers are often located in remote areas serviced by dirt roads
which are easily blocked by landslides and debris such as fallen trees. For instance, most
towers damaged by Hurricane Rita were located in marshes and were thus difficult to
access (Reed et al., 2010). Relocating transmission towers alongside main roads is likely

 13
to increase the grid’s resilience. Although it is unknown whether this strategy will reduce
the failure rate of towers, it is argued that it will make it easier for repair crews to access
damage locations and thus speed up recovery. Distribution lines are usually located
alongside urban and suburban roads, which may also be blocked by debris. However,
urban and suburban roads are more accessible than dirt roads in mountainous regions
and are also usually easier to clear by heavy equipment.
One successful response strategy involves phasing the operation to protect
repair crews, responders and equipment, by keeping them out of the hazard
zone. This means staging local and mutual aid resources at the edge of a hurricane zone
or sheltering them inside strong buildings while the storm passes. Resources are then
typically deployed after the storm has passed. For example, Mississippi Power used this
strategy to streamline its response to Hurricane Katrina (Ball, 2006). This course of
action is also popular in search and rescue operations in the aftermath of hurricanes.
Another successful strategy involved the use of temporary transmission towers.
Called Emergency Restoration Systems (ERS) or simply Restoration Towers in some
countries, these versatile structures are relatively easy to transport and can be erected
with minimal equipment. Although a transmission tower may take 10 days to build, a
trained crew can erect an ERS tower within a day or two (Karagiannis, et al., 2017a) and
allow a TSO to quickly restore a line until a permanent structure is built. Such ERS
towers were used by Electro Ljubljana in the aftermath of the 2014 ice storm and
contributed a lot to the quick recovery.

 14
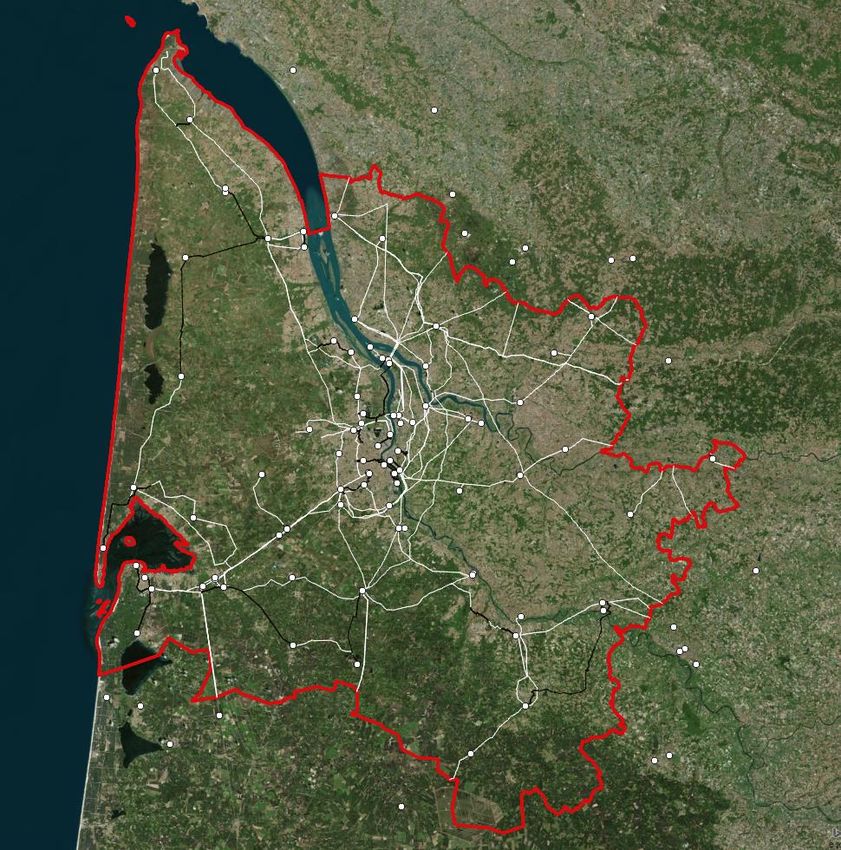
3 Effects of climate change on the level of risk from an
 economic perspective
A pan-European multi-hazard analysis by Forzieri et al. (2016) indicates that the
frequency and severity of windstorms is likely to increase in coastal areas in Western,
Eastern and Northern Europe. Because of the high population density and intense
economic activity of coastal areas, the level of risk is likely to increase substantially. This
chapter demonstrates a methodology for the estimation of the change in the level of risk
(quantified in economic terms) of failure or disruption of the power grid resulting from
the impact of climate change on the frequency and severity of storms. The assessment of
the level of risk is based on the estimation of potential losses from wind loads on the
transmission grid. A selected area in Europe is used as a case study.

3.1 Methodology
Disaster risk results from the probability of occurrence of a storm and the severity of the
impact of the event. The probability may be expressed either qualitatively or
quantitatively, depending on the level of knowledge about each hazard. The severity is
expressed in terms of the expected morbidity and mortality, damage to property,
disruption of infrastructure, and social consequences (Agius et al., 2017). The scenario-
based approach is a popular disaster risk analysis methodology and is highly appropriate
for the analysis of hazards when statistical information is available.
Here, the change in the level of risk is estimated by the change in the probability and the
impact severity of storms. Specifically, we analyze the change in the level of risk incurred
by the increase or decrease of the probability of occurrence of several storm scenarios
brought about by climate change. For each scenario, the level of risk is derived as the
expected value of the economic losses resulting from the storm under review (Hickman &
Zahn, 1966). The following sections discuss how we determine the change of the
probability of occurrence of each scenario and estimate the losses.

3.1.1 Probability of occurrence
The probability of occurrence of a storm is quantified by its recurrence interval, defined in
this case as the average number of years between storms of the same intensity (8).
Using the approach discussed in Forzieri et al. (2016; 2018), we derived the projected
peak wind for a range of recurrence intervals over several future time slots. We use the
ensemble mean values from 15 simulations combining different Global Circulation Models
(GCMs) with different Regional Climate Models (RCMs) at a resolution of 0.11 degrees, as
in the EURO-CORDEX (9) framework (Table 3). The return levels were computed using a
peak-over-threshold (98.5%) generalized Pareto distribution with daily maximum wind
speed as the input variable.

3.1.2 Loss estimation
Each scenario is analyzed to determine the consequences of the storm on the affected
communities. The potential losses are a function of the intensity of the hazard and the
exposure of people and economic activities to that hazard. Loss estimations conducted in
support of disaster risk assessments and hazard mitigation plans consider the expected
losses to people, buildings, infrastructure and other community assets (Coppola, 2015).
Here, loss estimation includes the economic losses from the damage incurred to electric
utilities and the impact to the local economy from the power outage. The total losses due
to each scenario are calculated as the sum of the costs to repair the damage incurred to

(8) The actual number of years between storms of any given intensity varies a lot. A common misconception
 about the 100-year storm is that it is likely to happen only once in 100 years. In reality, a 100-year storm
 is the storm which has a 1% annual exceedance probability, that is, a 1% chance of occurring every year.
 In other words, it is possible for the 100-year storm to occur two or more times per year.
(9) Coordinated Downscaling Experiment - European Domain, https://www.euro-cordex.net/ (accessed
 December 4, 2018)

 15
electric utilities and the impact to the local economy resulting from the storm and the
outage. The process is illustrated in Figure 6 and detailed in the following sections.

Table 3. List of EURO-CORDEX simulations used in this study

Simulation Global Circulation Model Regional Climate Model

 1 DMI-HIRHAM5

 2 KNMI-RACMO22E
 ICHEC-EC-EARTH
 3 CLMcom-CCLM4-8-17

 4 SMHI-RCA4

 5 CLMcom-CCLM4-8-17
 CNRM-CERFACS-CNRM-CM5
 6 SMHI-RCA4

 7 CLMcom-CCLM4-8-17

 8 MPI-M-MPI-ESM-LR MPICSC-REMO2009

 9 SMHI-RCA4

 10 KNMI-RACMO22E

 11 MOHC-HadGEM2-ES CLMcom-CCLM4-8-17

 12 SMHI-RCA4

 13 NCC-NorESM1-M DMI-HIRHAM5

 14 IPSL-INERIS-WRF331F
 IPSL-IPSL-CM5A-LR
 15 SMHI-RCA4
Source: EURO-CORDEX (10)

The underlying assumption is that the power outage associated with the storm
does not cause additional casualties, injuries, or loss of property. This is likely to
be an underestimation, because a prolonged power outage is expected to undermine
disaster response capabilities, disrupt healthcare facilities, render heating and air-
conditioning systems inoperable, generate traffic jams and contribute to traffic accidents
(Petermann et al., 2011; Karagiannis et al., 2017a). However, existing methodologies
cannot grasp the secondary effects of power outages, as these depend to a large extent
on additional parameters, such as local climate and weather, and disaster response
capabilities.

3.1.2.1 Losses to critical energy infrastructure
The direct losses to critical energy infrastructure are estimated as the cost of repairing
the damaged power grid assets. The repair costs are calculated from the
replacement value of the assets and the potential for asset failure. The latter is
estimated from the exposure of assets to the projected peak wind speed using
appropriate fragility functions (Veeramany et al., 2015).

(10) Coordinated Regional Climate Downscaling Experiment, http://www.cordex.org/ (accessed December 4,
 2018).

 16
Figure 6. Loss estimation approach

First, we determine the exposure of power grid components to the storm. We combined
geospatial data layers of electricity network assets with storm scenarios (developed as
discussed in section 3.1.1) to derive the peak wind speed that power grid components
are exposed to. The storm scenarios yielded the projected peak wind speed values on the
vertices of a square grid with a .11 degree (approximately 12 km) edge. The projected
peak wind speed was assumed to expand over the influence zone of each vertex, derived
using Voronoi/Thiessen polygons (Sen, 2016; Longley et al., 2015).
Subsequently, fragility functions are used to derive the cost of repairs of damaged
components from the peak wind speed data. Fragility functions express the conditional
probability a damage state will be reached or exceeded as a function of the intensity of
the hazard (Porter, 2015). Several fragility functions have been developed for towers and
transmission lines (Dunn et al., 2018; Fu et al., 2017; Espinoza et al., 2016), which have
been shown by the analysis of previous storms discussed in Chapter 2 to suffer more
damage from windstorms than any other type of power grid asset. In their general form,
storm fragility functions relate the probability of damage to the peak wind speed:

 ( ) = [ ≥ | = ] (1)

where:
— D = 0, 1... : damage state of a particular asset
— d: a particular damage state
— X: value of the hazard, i.e. the peak wind speed

 17
— x: a particular value of X
The wind speed at the height of transmission lines is estimated from simulation values
using the logarithmic law discussed in Troen & Lundtang Petersen (1989):

 2
 ln

 2 = 1 0 (2)
 ln 1
 0

where:
— z2: height at which the wind speed is sought (m)
— z1: reference height at which the wind speed is known (m)
— u2: wind speed at height z2 (m/s)
— u1: wind speed at reference height z1 (m/s)
— z0: surface roughness, taken from Table 4 (m)

Table 4. Roughness length values used in this study and corresponding landscape types

Roughness
 Landscape type
length (m)

 0.0002 Water surface.

 0.03 Open agricultural area without fences or hedgerows and very scattered
 buildings. Only softly rounded hills.

 0.4 Villages, small towns, agricultural land with many or tall sheltering
 hedgerows, forests and very rough and uneven terrain.

 0.8 Larger cities with tall buildings.
Source: Troen & Lundtang Petersen, 1989.

The failure of a line is considered to be independent from tower failure, so different
fragility functions are used. In addition, the outage of a transmission tower is considered
to be independent of the condition of adjacent towers. The total damage is derived from
the projected peak wind speed and replacement value of each affected facility or asset:

 ( ) = ∑ ∑ ∑ ( ) ∙ (3)
 =1 =1 =0

where:
— i = 1, 2, …, n : facilities or assets belonging to each category
— j = 1, 2, …, m : categories of facilities or assets
— RVij: replacement value of each facility or asset i (of each category j)
— xij: peak wind speed at each facility i (of each category j)
— fdj(xij): fragility function of facility or asset category.

3.1.2.2 Impact on the local economy
The effect of the power outage on the local economy is approximated by the economic
activity that is interrupted, on a per capita basis. When all circuits supplying power to a
transmission substation fail because of wind shear and/or wind-borne debris, customers

 18
connected to that substation will lose power, unless the TSO can reroute power from
another location. Most transmission systems use three-wire, three-phase circuits, which
are arranged in corridors consisting on series of transmission towers. In transmission
grids designed for robustness and resilience, there may be more than one circuits in each
corridor and each substation may be supplied by more than one corridor. In this study, a
substation was assumed to lose power when all lines supplying it power were severed. A
transmission line was assumed to be severed when there was at least one failure of a
tower or a wire between two substations. Therefore, the probability of a substation losing
power is determined based on the probability of failure of its power supply:

 = ∏ = ∏ [1 − ∏(1 − )] (4)
 =1 =1 =1

where:
— Fout: probability of outage of a given substation
— FC: probability of failure of corridor C
— n: number of line segments in corridor C
— m: number of corridors supplying the substation
— FT: probability of failure of a line segment T (a line may include one or more circuits,
 and each circuit is made of three wires)
The area affected by the loss of power to a transmission substation is approximated by
its influence zone, which is derived using Voronoi/Thiessen polygons (Sen, 2016; Longley
et al., 2015). The combination of the affected area with a population density map yields
the number of people affected by the outage.
The business losses from the outage are approximated by the daily economic activity
that is interrupted (Zimmerman et al., 2005). The outage stops all business in the
affected area until power is back online. Costs are estimated on a per capita basis. The
business losses from power loss at a single substation are estimated by the following
equation:

 ∙ ∙ ∙
 ( ) = (5)
 365 ∙

where:
— GDP: the Gross Domestic Product of the jurisdiction under review
— tout: the estimated duration of the outage (in days).
— Ptot: the jurisdiction’s entire population.
— Pout: the population affected by the outage.
Then, the total business cost is the sum of the future business losses from the loss of
power at each individual substation:

 ( ) = ∑ (6)

This formulation is based on three underlying assumptions. The first is that the power
outage lasts longer than the storm, therefore the first term in the numerator of the
Business Cost (BC) formulation is dominated by the duration of the outage and not of the
storm. This is a realistic hypothesis, because the repair of damaged electric utility assets
only starts after the storm has passed. The second assumption is that the duration of the

 19
outage is the same throughout the affected area. This could be an overestimation,
because power is restored progressively as repairs are made (Karagiannis et al., 2017a).
The third assumption is that the local economic activity is homogeneously distributed
throughout the storm affected area. This could be an underestimation or overestimation
of the business cost, depending on the locus of economic activities. For instance, if
business is more concentrated near the coast, then the estimated business cost will be
lower than the actual one. On the other hand, if local businesses are located away from
the coast, then the estimated cost would constitute an overestimation.

3.1.3 Change in risk level
The combined impact is calculated as the sum of the total repair cost and the impact to
the local economy resulting from the outage. Then, the level of risk is derived as the
present value of the expected future losses incurred from each scenario (Hickman &
Zahn, 1966):

 = [∑ +∑ ] (7)
 (1 + ) (1 + )
 =1 =1

where:
— TRCt: the total repair cost in year t, which is calculated using equation (3)
— TBCt: the expected business losses in year t, which are calculated using equation (5)
— i: the social discount factor
— N: the number of years in the future
We analyze the change in the level of risk (expressed in terms of the expected economic
losses) caused by the change (increase or decrease) of the probability of occurrence of
several storm scenarios because of climate change.
In valuation analysis, the concept of time value of money reflects the notion that money
available today is worth more than in the future. Therefore, a discount factor is used to
convert future cash flows in their equivalent present values. In this case, cash flows are
the expected total repair cost and business losses over an extended period of time in the
future. From the point of view of a private entity, such as a TSO or DSO, the discount
rate is the interest it has to pay. On the other hand, governments use what is called the
social discount rate, which reflects the relationship between the interest rate faced by
consumers and producers (Stiglitz & Rosenbauer, 2015). The choice of the social discount
rate is a contested political issue and differs widely among countries. For instance, the
European Commission advocates a social discount rate of 3-5% for major projects funded
under the Cohesion Policy 2014-2020 programming period (DG REGIO, 2015). However,
Member States use different social discount rates for different projects (Evans, 2006), or
may have not regulated a social discount rate at all.
Another set of difficulties arise with the change in the characteristics of the study area
over an extended period of time. First, the GDP of any country is expected to change in
response to the country’s economic environment, resources and other factors. All other
things being equal, an increase in the GDP would bring about a proportionate increase of
the business cost estimated from Equations 5 and 6, but also arguably increase the
affected country’s resilience. Shocks such as economic crises are notorious for being able
to dramatically shrink the economy of the affected country to a fraction of its pre-crisis
capability. However, economic outlooks are notoriously uncertain for periods of time
longer than one or two years (Silver, 2012), let alone a few decades, as is the case in
this study.
Second, population density is dynamic and depends on the population and land use. The
United Nations World Population Prospects (2017) project that Europe’s population will

 20
You can also read