Wharekawa Coast 2120 Coastal Processes and Hazards
←
→
Page content transcription
If your browser does not render page correctly, please read the page content below
Wharekawa Coast 2120
         Coastal Processes and Hazards

     Draft report prepared for Waikato Regional Council
                                      26 June 2020

                                 Dr Terry M. Hume

Note: This draft report has yet to undergo external peer review. It has been provided as a
      background paper to inform Wharekawa Coast 2120 Community Workshops, Technical
      Advisory Group, Joint Working Party and Community Advisory Panel activities.

                                                                                             1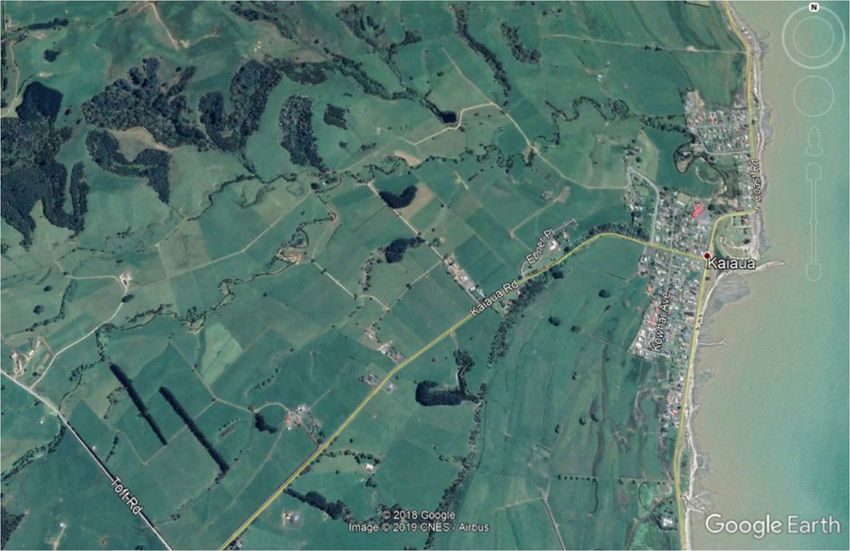
Contents
Executive summary                                                        3
1. Introduction                                                          7
2. Background                                                            11
3. Coastal setting and hazard drivers                                    13
       3.1 Geomorphology
       3.2 Water levels
              Astronomical tide
              Storm surge
              Storm tides
              Wave runup and setup
              Rivers
       3.3 Long term sea levels
       3.4 Currents and circulation
       3.5 Winds
       3.6 Waves
       3.7 Sediment sources and transport
       3.8 Shoreline change
       3.9 Vertical land movement
       3.10 Human influences on coastal processes
       3.11 Climate change and sea level rise
4. Coastal hazards                                                       40
       4.1 Coastal inundation
              Historical coastal inundation events
              Future potential for coastal inundation events
              Effects of climate change and sea level rise
       4.2 Coastal erosion
              Shoreline change
              Coastal erosion processes
              Effects of climate change and sea level rise
       4.3 Tsunami
              Modelling the tsunami threat
              Effects of climate change and sea level rise
5. Strategies to mitigate coastal hazards and inform adaptive planning   59
       5.1 Predicting hazard events
       5.2 Coastal inundation
       5.3 Coastal erosion
       5.4 Tsunami
       5.5 Multi-hazard assessment
       5.6 Mangroves – a potential means of hazard mitigation?
       5.7 Monitoring and predicting forcing processes
       5.8 Documenting coastal hazard events
       5.9 Input from citizen science
6. References and information sources                                    66
7. Acknowledgements                                                      70

Appendix A. Historical storm events                                      71

                                                                              2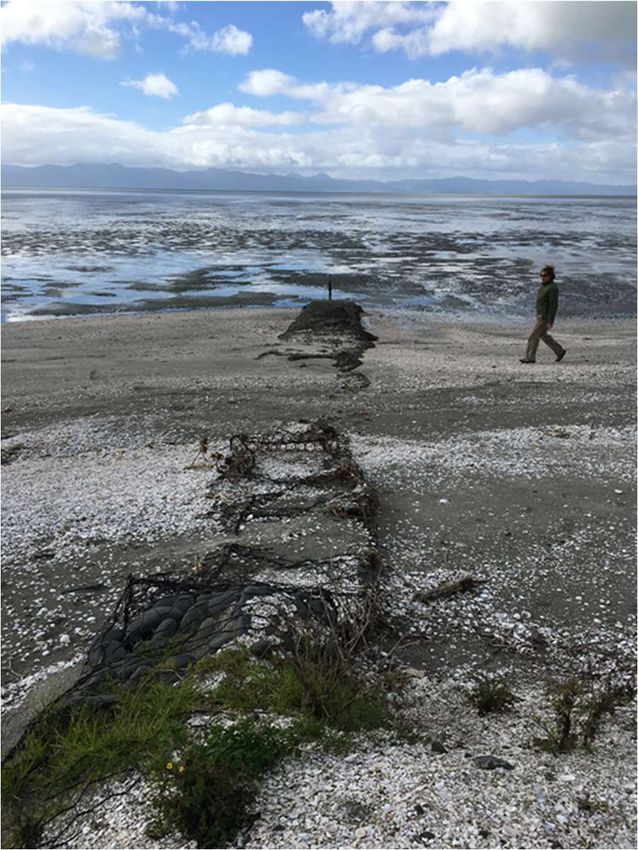
Executive summary
Introduction and background to this assessment
The low lying coastal plain and narrow beach system between Miranda and Matingarahi (the
Wharekawa coast) make farmland and coastal infrastructure vulnerable to, and at risk from, coastal
hazards and notably inundation from the sea and coastal erosion. There is also the threat of tsunami
from both distant and local sources. Coastal hazards are expected to worsen with climate change
and projected sea level rise. This report provides an assessment of coastal drivers and hazards in
respect to the coastal geomorphology in order to inform a community strategy so that discussions
and adaptive planning options are based on a common understanding of coastal processes. This
assessment is a component of the wider Wharekawa Coast 2120 initiative aimed at developing a
long-term strategy for the sustainable management of the Wharekawa coast. It is one of a suite of
reports that address: Coastal processes (this report); River flooding of the Hauarahi Stream; Land
Stability; Social impact assessment for Wharekawa; Wharekawa Coast 2120 risk assessment.
This assessment is timely because the knowledge base has improved considerably since the review
of coastal processes and hazards and their management by Tonkin & Taylor in 2010. The last decade
has seen: detailed topographic mapping of the coastal plain by LiDAR, re-mapping shoreline change,
surveys of vertical land movement, numerical modelling of currents and circulation, wave climate
and tsunami events, analysis of the occurrence of extreme water levels and development of the
Waikato Regional Hazards Portal and Coastal Inundation Tool. These studies, along with lessons
learned from recent storm events have improved knowledge and understanding of coastal
processes, by both technical experts and communities, will better inform decision making and
options for the management of coastal processes and drivers of coastal hazards. This assessment is
also timely in light of guidance produced by MFE in 2017 for local government on how to adapt to
coastal hazard risks from climate change and sea level rise.
Coastal setting and hazard drivers
The 22 km stretch of coast between Matingarahi and Miranda (the Wharekawa coast), is an east-
facing shoreline in the southern Firth of Thames. North of Wharekawa the coastal plain is narrow,
the steep beaches comprised of pebbles and cobbles with little shell material and with a narrow
intertidal zone. Between Wharekawa and Kaiaua the coastal plain widens to about 0.5 km and
beaches are less steep and mixed sand and gravel with a wider intertidal zone. To the south in the
vicinity of Miranda the geomorphology is characterised by a wide (c. 1.8 km) low-lying coastal plain,
fronted by a very narrow strip of wetlands and mixed sand-gravel beaches with low storm berms.
Seawards of the beach there are extensive muddy intertidal flats that extend more than 2 km
offshore. Significant geomorphological features of the plain are the chenier ridges which are shelly,
low, shore parallel chenier ridges lying atop muddy sediment. At several places along the coast
rivers, streams and farm drains emerge on the beach building small deltas.
The coastal plain is formed from a sequence of (relict) chenier beach ridges representing successive
positions of an advancing shoreline. The chenier ridges have built seawards in the last 6,000 years in
response to several factors including: an overall fall in sea level of some 2 m between 4,000 and
1,000 years ago, an episodic supply of sediment and in accommodation space provided by an
embayed shoreline. The plain built seaward from the former coastal cliffs and high ground to the
west prograding some 1.8 km at its widest point and at a rapid rate (average of about 4.5 m/yr). This
process has resulted in an overall straightening and north south re-alignment of the once irregular
shoreline. Today formative processes are very different and far less conducive to coastal
progradation. The shoreline is straighter and there is less accommodation space for sediments to
accumulate in shelter from wave attack. Furthermore, sea level is no longer falling and is predicted
to rise in the future accompanying climate change. The coast is in a state of dynamic equilibrium
north of Kaiaua and oscillating forward and back, and in a state of dynamic equilibrium of perhaps

                                                                                                        3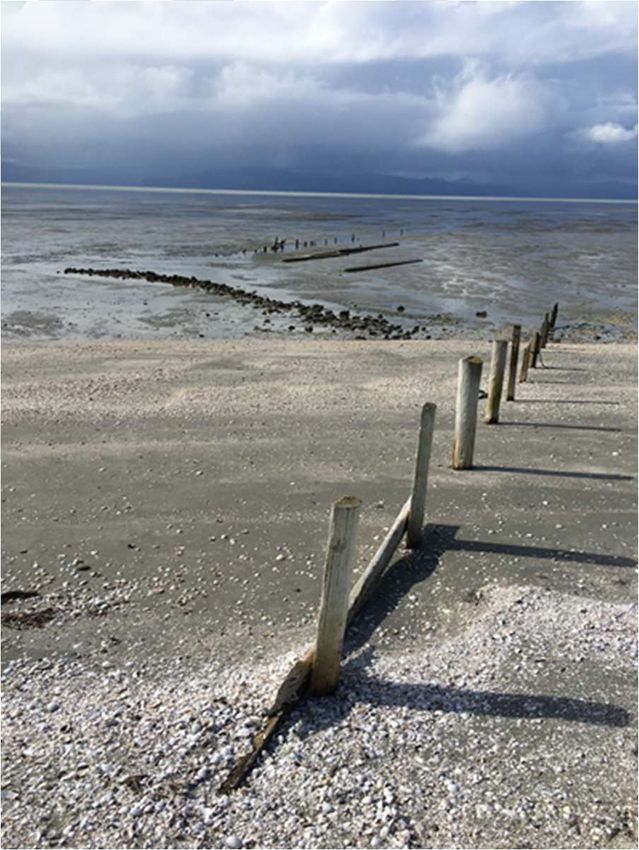
retreating north of Miranda. Shoreline stability is very dependent on a continued supply of sand and
gravel from the rivers and shell material from the tidal flats offshore.
The beaches on the Wharekawa coast are mixed sand gravel beaches that vary from rocky, steep,
cobble and boulder systems with narrow intertidal areas in the north at Waharau to shelly, less
steep, gravel/sand systems with very wide intertidal areas in the south near Miranda. The beaches
receive sufficient wave energy during storms, to build-up a low gravelly beach ridge barrier above
high water level, fronted by steep, shelly/gravelly high tide beach, with low gradient sand flats
extending offshore from the base of the high tide beach. The beach ridge barrier is narrow, rises to
about 0.5 to 1.0 m above MHWS, and contains only a small volume of sediment. It is easily
overtopped by high water levels and waves in storms and provides little volume of sediment to
buffer against the effects of coastal erosion. Rivers and streams build small deltas that protrude
offshore. Delta survival/longevity at decadal time scales is very dependent on sediment supply. If
supply is cut off (e.g., through catchment activities, gravel extraction, dredging channels, building
groynes updrift), then the deltas will erode.
The nature, scale and frequency of occurrence of coastal hazards varies with coastal setting and the
drivers of coastal processes. The drivers are water levels, rivers, currents, waves, wind and sediment
transport and supply, at longer time scales vertical land movement (movement up and down
changes the level of the shore relative to the sea) and climate change and associated sea level rise.
Water levels play an important role in determining coastal hazards by allowing overtopping of
coastal barriers, controlling the distance water travels inland over low topography, controlling the
amount of wave energy reaching the backshore and beach ridge barrier and causing erosion during
storms, and by controlling the mean shoreline position on longer time scales. Storm tides (a
combination of the astronomical tides, storm surge and the monthly mean sea level variation) can
elevate the water level above the predicted tide and ‘pile it up’ against the coastline across a region
causing coastal flooding from the sea. The largest storm tides are generally associated with a spring
tide. Waves can produce additional short term increases in water level during events due to the
processes of wave setup and runup. Wave setup and runup has not been calculated for the
Wharekawa coast. Longer-term sea-level rise in New Zealand based on analysis of tide gauge records
has averaged 1.8 ± 0.1 mm/yr. There is no long-term tide gauge record for the Firth of Thames but
Auckland, the closest gauge, shows a rate of sea level rise of 1.6 ± 0.1 mm/yr. Climate change is
predicted to accelerate this rate of sea level rise into the future.
Although not specifically addressed in the report runoff from rivers and streams during heavy rainfall
can exacerbate flooding during coastal inundation events. Sea water flooding up rivers and drains
prevents the escape of flood waters to the sea and causes water levels to rise to higher levels and
further inland and the land remains inundated for longer periods of time.
Tidal and wind driven currents are very weak and play little role in beach processes. However, they
serve to transport fine sediments (mud and very fine sand) that occur on the intertidal flats and
shallow subtidal areas. The most common winds are light with speeds ranging between 0 and 10 m/s
and accounting for 93% of the record. Strong winds from the north that generate large waves are
rare. The wave climate of the Wharekawa coast is characterised by a most commonly occurring
regime of small, short period, low energy waves. This is punctuated by infrequent occurrences of
higher energy wave conditions from: 1) long-period waves that propagate into the southern Firth
from the outer Hauraki Gulf and 2) more commonly occurring shorter period waves that are
generated along the large fetch coincident with the prevailing northerly wind direction.
Gravel and sand sized material comes primarily from rivers and streams to the north of Kaiaua. Shell
is an important source of sediment for the gravel ridges and chenier plain formation and is primarily
derived from the wide intertidal flats of the southern Firth. Mud derives from rivers in the south.
While the quantities and rates of sediment transport are unknown the overall rate is small and

                                                                                                        4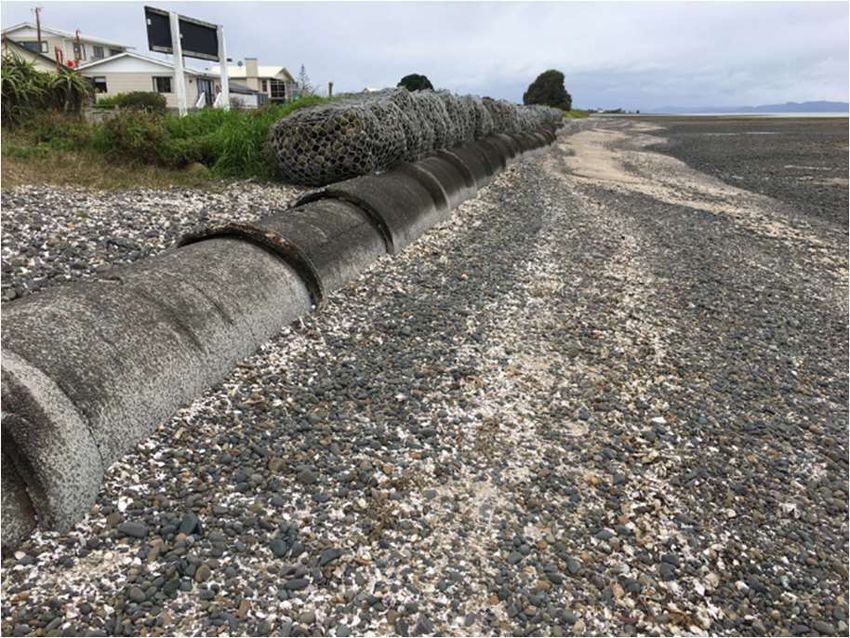
transport intermittent because for most of the time waves are small. Low sediment storage in the
beaches means that there is only a small buffer against storm events.
Vertical land movement (subsidence of the land) increases the threat of coastal inundation. There
has been vertical land displacement associated with the Kerepehi Fault of 1.6 m in four events and
having an average recurrence interval of about 2,500 years (the down thrust side of the Fault is on
the west and Kaiaua side of the fault). Long-term (up to 125,000 years ago) vertical tectonic
movement on the west side of the Firth of Thames shows a slow rise of c. 0 to 1 mm/yr. However,
given uncertainties in these numbers, it is assumed that vertical land movement in the Wharekawa
coast to be essentially zero.
A variety of structures have been used to prevent coastal erosion. These include rock walls, wooden
groynes, dumped concrete and concrete pipes. These structures are in various states of disrepair.
Some are of questionable effectiveness and may in fact detrimental to coastal processes and be
contributing to the erosion rather than preventing it.
MFE guidance issued in 2017, based on the Intergovernmental Panel on Climate Change (IPCC) 2014
report, projects a global sea-level rise by 2120 of about 0.5 and 1.4 metres (above the 1995 level)
depending on the amount of future greenhouse gas emissions. Over a shorter time frame up to
2060, the IPCC projects a narrower range of sea-level rise of 0.3 to 0.5 metres. Storm tides will also
provide for temporary increases in ocean and estuary water levels (over and above the level of
predicted tides) caused by storm conditions that last from hours to days. There are also predictions
for storms to occur more frequently.
Coastal hazards
Past events have highlighted the fact that the Wharekawa coast and its settlements and associated
infrastructure, coastal road and power supply lifelines, boat launching facilities and farmland are
vulnerable to and at risk from coastal hazards, most notably widespread coastal inundation from the
sea and more locally coastal erosion. Coastal hazards have arguably been exacerbated through the
modification of coastal processes by human activities such as gravel extraction, stream diversion and
channelisation, stream mouth clearance, bunding of farmland and poorly engineered structures to
combat shoreline erosion. The threats and risk to assets from coastal inundation and erosion are
predicted to ‘ramp up’ in both magnitude and frequency with projected climate change and
associated sea level rise.
Coastal inundation is a major threat to the Wharekawa coast. The coastal plain is at or below mean
sea level and begins to flood either directly or indirectly from the sea when the sea level reaches
about 2.0 m (MVD-53). Furthermore, the low and narrow coastal barrier ridge provides little
protection against overtopping by the sea. the sea. Under the status quo inundation events will, as
they have in the past, continue to threaten infrastructure (housing, businesses), agriculture (grass
die-off and soil salinity in paddocks), lifelines (roading, power supply, water supply and septic
systems), the local economy (business continuance) and public safety. Coastal flooding events will be
the largest and most extensive when storm tides coincide with king tides and when these conditions
are maintained for several days. Flooding can be further exacerbated during heavy rainfall that is
commonly associated with storms causing rivers to back up retarding drainage to the sea. While
large events are rare, the coastal plain is so low in places that any one of those events occurring
alone can cause lesser amounts of inundation.
Coastal erosion is less of a hazard for the Wharekawa coast than coastal inundation. However, the
low gravel ridge barrier, unlike large dunes on a sandy coast, provides little buffer against erosion as
it contains only a small volume of sediment and receives only a meagre (but unquantified) supply of
sand and gravel. The coast is in a state of dynamic equilibrium north of Kaiaua and oscillating
forward and back, and in a state of dynamic equilibrium of perhaps retreating north of Miranda. The
stability of the beach ridge barriers and delta sand bodies are threatened by rising sea level and an

                                                                                                       5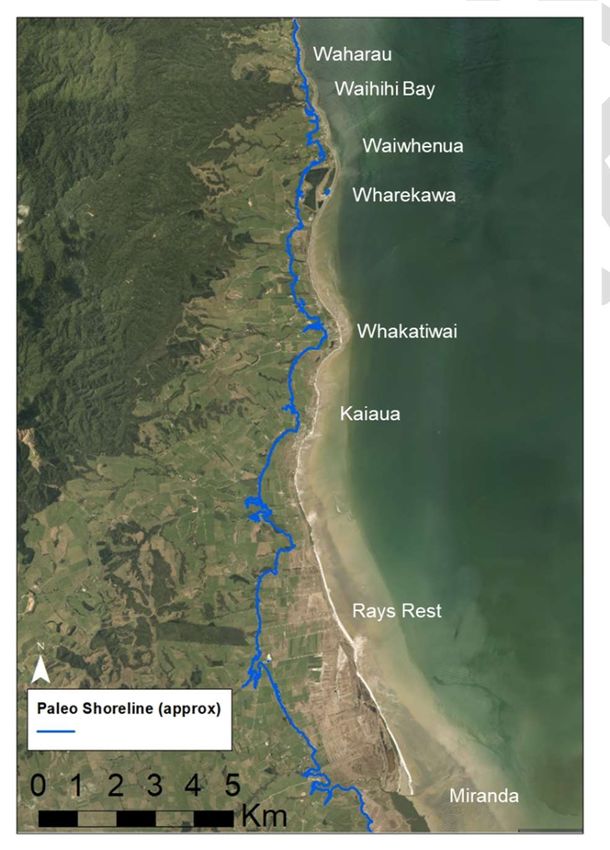
increased frequency of storm events that are predicted to accompany climate change. Higher sea
levels will bring breaking waves closer to the high tide beach and ridge system more frequently and
exacerbate coastal erosion.
The Hauraki Gulf has experienced at least 11 tsunami and one meteorological tsunami since 1840.
While most of these were small events, 4 had amplitudes up to 2 m. Modelling of both distantly and
locally generated tsunami tends to suggest that tsunami hazard in the Firth of Thames is relatively
low. However major earthquakes could occur on the Kerepehi Fault (including the offshore
segments) once every 1,000 years, equivalent to a 1% probability of occurrence in 10 years. If this
generated a tsunami there will be little warning other than the associated shaking associated with
the earthquake.
Coastal hazard threats will be exacerbated by rising sea level accompanying climate change which
could add 0.3 to 0.5 metres to global sea levels by 2060 and 0.5 to 1.4 metres by 2120. A
consequence of sea level rise is that a long-term rise in sea level dramatically increases the
frequency of occurrence of coastal inundation events and events of a magnitude that is uncommon
today will be more common in the future. Storm tides will also provide for temporary increases in
ocean and estuary water levels (over and above the level of predicted tides) caused by storm
conditions that last from hours to days. Such a rise in mean sea level would have a very significant
impact on coastal inundation, increasing both the frequency and severity of flooding. Sea level rise
accompanying climate change will bring water levels and waves closer to the shore resulting in
rollback of the beach ridge system and overall shoreline retreat. Coastal erosion may be offset to
some degree by increased sediment supply from catchment and cliff line erosion that will occur with
increased storminess. We do not know how the supply of sediment (including shell) to the coast will
alter with climate change, although an increase in the magnitude and frequency of storm events
could increase catchment erosion and sediment supply to the coast. However, at long time scales
(50 to 100 years) coastal inundation is predicted to flood the low lying coastal plain and likely to
completely dominate over coastal erosion. Vertical land movement is effectively zero so the rise in
sea level will not be offset by the gradual uplift of the land.
These projections pose a dire warning for the Wharekawa coast which is already suffering significant
inundation during storm events at current sea levels. While there is uncertainty in regard to these
predictions, a precautionary approach would seem to be warranted given the present scientific
consensus of opinion on the effects of climate change. Tsunami occurrence will not be affected by
climate change, although higher long-term sea levels associated with climate change will allow
coastal inundation to propagate further landward.
Strategies to mitigate coastal hazards and inform adaptive planning
Various strategies to mitigate the effect of coastal hazards are described along with further work
that could be undertaken to improve knowledge of coastal processes. These include predicting
hazard events, monitoring and predicting forcing processes, specific recommendations for mitigating
the effects of coastal inundation, coastal erosion and tsunami, documenting hazard events and
potential input from communities in by way of citizen science projects.

Note: This draft report has yet to undergo external peer review. It has been provided as a
background paper to inform Wharekawa Coast 2120 Community Workshops, Technical Advisory
Group, Joint Working Party and Community Advisory Panel activities.

                                                                                                      6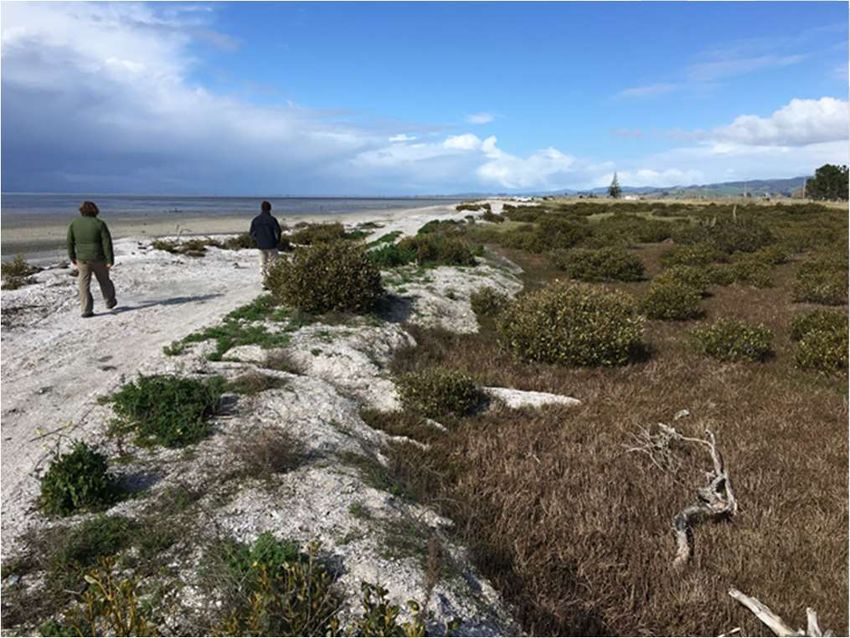
1. Introduction

The 22 km stretch of coast between Matingarahi and Miranda (the Wharekawa coast) is an east-
facing shoreline in the southern Firth of Thames (Figure 1-1). North of Wharekawa the coastal plain
is narrow, steep beaches comprised of pebbles and cobbles with little shell material and there is a
narrow intertidal zone (Figure 1-2). Between Wharekawa and Kaiaua the coastal plain widens to
about 0.5 km and beaches are less steep, comprised and mixed sand and gravel and with a wider
intertidal zone. To the south in the vicinity of Miranda the geomorphology is characterised by a wide
(c. 1.8 km) low-lying coastal plain, fronted by a very narrow strip of wetlands and mixed sand-gravel
beaches with low storm berms (Figure 1-2). Seawards of the beach there are extensive muddy/sandy
intertidal flats that extend more than 2 km offshore. Significant geomorphological features of the
plain are the chenier ridges which are shelly, low, shore parallel chenier ridges lying atop muddy
sediment. At several places along the coast rivers, streams and farm drains emerge on the beach
building small deltas. Sediment supply to the coast is by way of sand and gravel from streams and
rivers in the north, shell from the intertidal areas and mud from the large rivers in the southern
Firth. Waves transport sediments in a predominantly southerly direction along the shoreline.

Figure 1-1. Location map showing todays shoreline and the position of the palaeo-shoreline (blue
line) prior to the development of the chenier plain.

                                                                                                      7
Figure 1-2. Narrow steep pebble and cobble beach in the north at Waharau (left) and the wide flat
mixed sand gravel beach in the south near Rays Rest (right).
The low lying coastal plain and narrow beach system make farmland and coastal infrastructure
vulnerable to, and at risk from, coastal hazards and notably inundation from the sea and coastal
erosion. There is also the threat of tsunami from both distant and local sources. There are small
settlements of Kaiaua, Whakatiwai and Waihihi Bay. Housing, commercial premises and boat
launching facilities are located close to the sea. Lifeline infrastructure including the main road (East
Coast Road), bridges and power supply run close to the coast. In the south near the Pukorukoru
Miranda Shorebird Centre the wetlands and chenier shell banks have RAMSAR status.
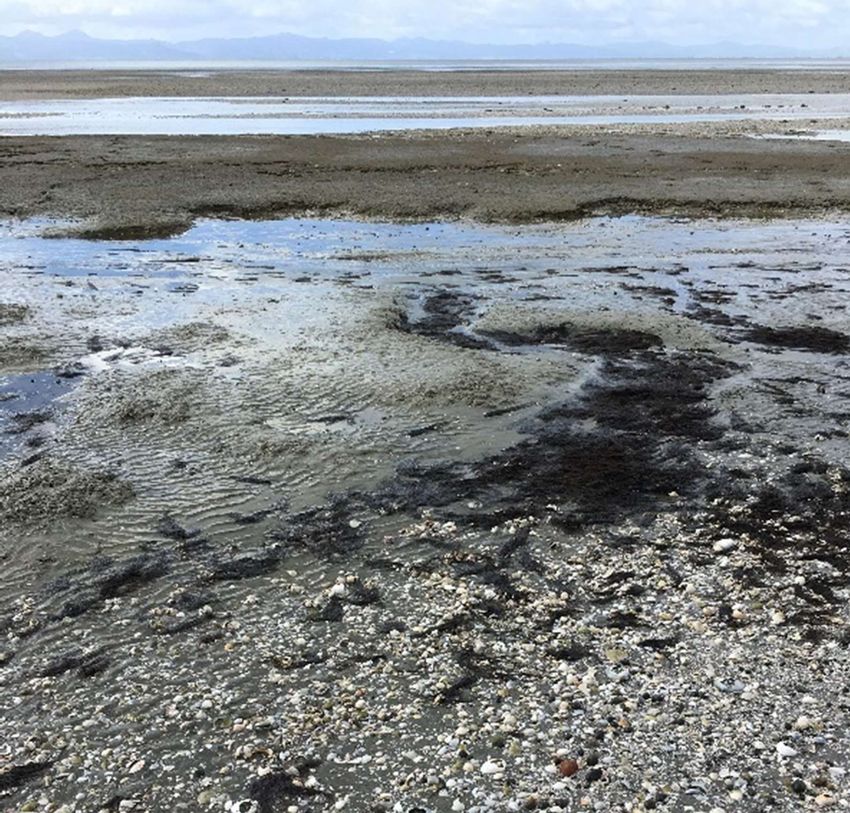
In the past, and most recently in January 2018, storm events have resulted in widespread flooding
and salt burn of farmland, road closures and damage to buildings in the townships (Figure 1-3).
Coastal protection structures in various states of disrepair are testimony to efforts to combat coastal
erosion (Figure 1-4). Although beyond the scope of this report there are also hazards due to: 1)
small-scale landslips that threaten East Coast Road in the north, 2) flooding of the land following
rainfall events and 3) potential salinization of ground water and soils associated with a rise in sea
level.
Figure 1-3. Aftermath of the January 2018 storm event showing flooding from the sea at Kaiaua
township and overwash debris on East Coast road.
8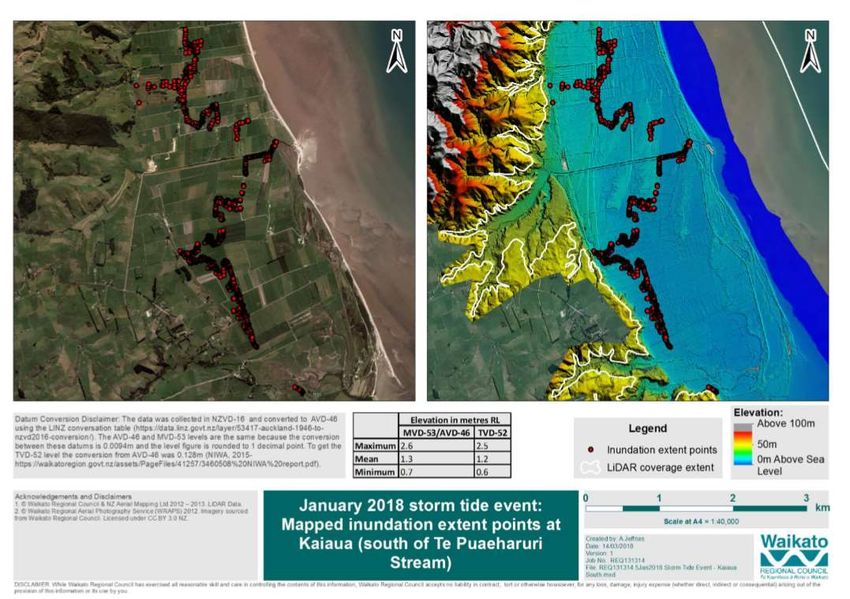
Figure 1-4. Various structures on the shoreline near Kaiaua to combat coastal erosion.
Wharekawa Coast 2120 is a project aimed at developing a long-term community strategy for the
sustainable management of the Wharekawa coast. Its goal is to provide the community and other
key stakeholders with information on key hazards, assets, values and how to best manage risk and
uncertainty over the short, medium and long term. The strategy will provide a platform that can be
regularly reviewed to ensure the most up to date information is assessed and management options
are updated
This report is a component of Wharekawa Coast 2120. It provides an updated assessment of coastal
drivers and hazards in respect to the coastal geomorphology and to inform a community strategy in
order that discussions and adaptive planning options are based on a common understanding of
coastal processes and drivers. It is based on reviews of previous studies and new information, site
visits, the authors experience in coastal processes and discussions council staff. The report:
Provides a current understanding of coastal processes and drivers for the Wharekawa coast.
Provides an assessment of coastal hazards.
Provides an assessment of projected climate change on the processes and drivers of coastal
hazards based on the MfE Guidance (2017).
Considers whether planning and responses, for the short-, medium- and long-term
management of coastal processes and drivers of coastal hazards, can be improved in light of
our improved understanding of coastal processes, hazard events and climate change.
Considers what additional information or studies need to be undertaken to improve decision
making around coastal management.
This report does not provide specific advice on solutions to issues at specific sites – these will be
addressed in a subsequent phase of Wharekawa Coast 2120.
9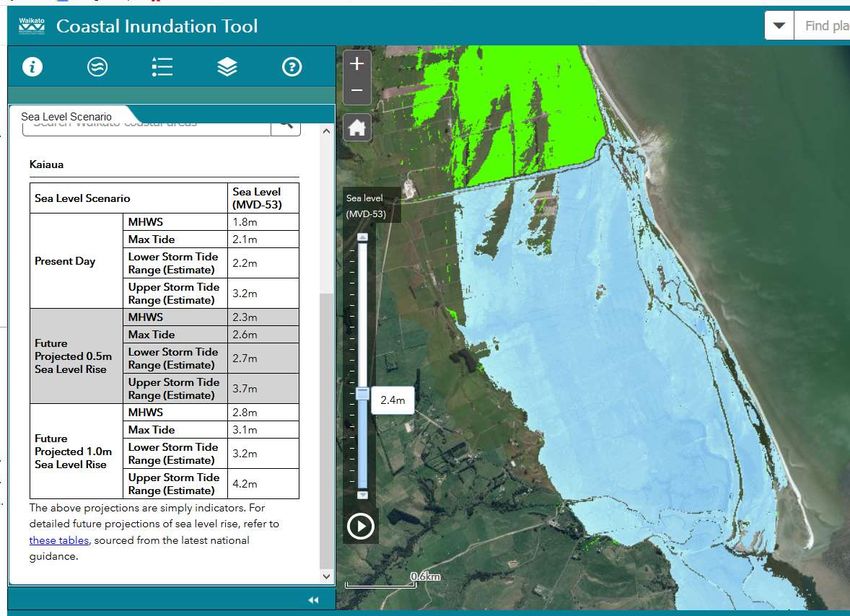
To understand the impacts of climate change and natural hazards in the Wharekawa Coast 2120
project area, the following suite of reports have been compiled:
Coastal processes, drivers and hazards (coastal inundation, coastal erosion and tsunami) and
climate change effects (this report)
River flooding of the Hauarahi Stream
Land stability
Social impact assessment for Wharekawa
Wharekawa Coast 2120 risk assessment
102. Background
This assessment is timely. The last comprehensive review of coastal processes and hazards and their
management was undertaken by Tonkin & Taylor in 2010. Since that time various surveys and
studies and lessons learned from recent storm events have provided improved knowledge and
understanding, for both technical experts and communities, which will better inform decision
making and options for the management of coastal processes and drivers of coastal hazards. It is
also timely in light of guidance produced by MFE in 2017 for local government on how to adapt to
coastal hazard risk from climate change and sea level rise.
The most recent review of coastal processes and hazards for the Wharekawa coast is described in
two reports by Tonkin & Taylor in 2010. They prepared a Coastal Compartment Management Plan
(CCMP) based on work by Franklin District Council, Environment Waikato and the Auckland Regional
Council. The purpose of the plan was to identify values associated with the coastline and highlight
issues and actions relevant to future management (Tonkin & Taylor 2010a). Tonkin & Taylor also
prepared a technical report describing coastal processes and mechanisms that occur along the coast
based on readily available published literature, aerial photo analysis and a site inspection (Tonkin &
Taylor 2010b). It focussed on coastal hazards and management options to serve as an information
base for development of the CCMP.
Since the Tonkin & Taylor reports numerous studies and surveys have added considerably to the
knowledge base. These include:
Detailed topographic mapping of the coastal plain and surrounds using LiDAR (Light
Detection and Ranging) in 2015.
Google Earth imagery of the Wharekawa coast from 2003 to 2019.
Remapping of shoreline change and rates of erosion using historical cadastral survey data
(1885 to 1925) and aerial photography (1944 to 2017) (currently underway by WRC).
A reappraisal of the mode of evolution of the chenier ridges and development of the coastal
plain (Dougherty and Dickson 2012).
Surveys of vertical land movement (Denys 2016, Swales et al. 2016).
Estimates of suspended sediment yields from rivers (Hicks et al. 2011).
An additional 9 years of water level record from the Tararau tide gauge in the southern Firth
of Thames.
Modelling currents and circulation in the Firth of Thames (Zeldis et al. 2015; Haughey 2017).
Wave climate data in the form of modelled hindcast wave data extracted from MetOcean
View https://app.metoceanview.com/hindcast/
11 Surveys of mangrove forest evolution and intertidal sedimentation in the southern Firth
(Swales et al. 2016; Haughey 2017; Hunt 2019).
Modelling tsunami of near- and far-field origin (Borrero 2018).
Analysis of the occurrence of extreme water levels (Stephens et al. 2015; Stephens 2018).
Descriptions and analysis of recent storm events and notably the 5 January 2018 event
(Craig and O’Shaughnessy 2018).
A “soft launch” of the Waikato Regional Hazards Portal that has been developed to improve
access to hazard information, and to help the public, local authorities and others make
informed decisions about their exposure to natural hazards.
https://waikatoregion.maps.arcgis.com/apps/MapSeries/index.html?appid=f2b48398f93146
e8a5cf0aa3fddce92c (Coastal tabs).
Development of the WRC Coastal Inundation Tool that provides an interactive online tool for
assessing the effect of sea-level rise on coastal-storm inundation for the Wharekawa coast.
https://coastalinundation.waikatoregion.govt.nz/
Guidance produced by MFE in 2017 for local government on how to adapt to coastal hazard
risks from climate change http://www.mfe.govt.nz/climate-change/technical-
guidance/guidance-local-government-preparing-climate-change
123. Coastal setting and hazard drivers
The nature, scale and frequency of occurrence of coastal hazards varies with coastal setting and the
drivers of coastal processes and hazards. The drivers are water levels, rivers, currents, waves, wind
and sediment transport and supply, at longer time scales vertical land movement (which changes the
level of the coastal plain and beach relative to the sea level) and climate change and associated sea
level rise. Having a knowledge and understanding of the scale and frequency of these drivers in a
particular geomorphic situation is paramount to making informed and evidenced-based decisions on
interventions, mitigations, engineering solutions and adaptive planning options to address coastal
hazards.
3.1 Geomorphology
The 22 km long Wharekawa coast between Matingarahi and Miranda and is characterised by a
diverse coastal geomorphology. The key features are the low-lying coastal plain, fronted by mixed
sand gravel beaches with low storm berms and, in places, by a narrow strip of wetlands. The north
south aligned coast has small promontories in the form of headlands and deltas and harder
substrate that divide the coast into coastal compartments1. Stream and farm drains emerge on the
shore in places. Seawards of the beach, particularly in the south, there are extensive muddy/sandy
intertidal flats extending offshore.
The coastal plain
Low-lying coastal plains front the hinterland hills and an ancient marine cliff line cut in a Pleistocene
terrace about 15-25 m high. In the south the plain is about 1.8 km wide at Miranda (Figure 1-1). It
narrows to the north being c. 0.7 km wide south of Kaiaua, 0.6 km wide between Kaiaua and
Whakatiwai and 0.4 km wide near Wharekawa and reduces to a narrow coastal strip at Waihihi Bay.
Coastal cliffs back the beach north of Waharau. Much of the coastal plain, now drained and
converted to farmland, is at or below mean sea level. It begins to flood either directly or indirectly
from the sea when the sea level reaches about 2.0 m (MVD-53).
1
A coastal compartment is an area in which coastal processes, and their effects on the geology of the coast,
are broadly homogeneous. The compartment boundary is usually a feature such as a headland or river mouth
which effectively divides the compartment and its processes from its neighbour. The compartment boundaries
act as natural barriers to sediment transport, enabling the area between boundaries to be treated as a semi-
closed system with quantifiable sediment sources and sinks.
13The beach barrier plain is formed from a sequence of (relict) chenier beach ridges representing
successive positions of an advancing shoreline (Figures 3-1 and 3-2). The 13 sets of chenier ridges are
a significant geomorphological feature on the Wharekawa coastal plain (Figure 3-2).
Figure 3-1. Chenier ridges north of Miranda show clearly as the white colour at the shoreline. The
left image shows the wetland behind the white shell bank and a chenier developing in the intertidal
area (left image) that is making its way to the shore.
Figure 3-2. The 13 chenier ridges of the Wharekawa coast (source: Woodroffe et al. 1983).
14The ridges are accretionary progradational features consisting two or more long, low-lying (typically
up to 3 m high and 40 to 400 m wide), parallel to sub parallel ridges comprised of shelly gravely
sand. This plain is a site of global significance for understanding chenier evolution. Chenier formation
has been described by Schofield (1960), Woodroffe et al. (1983) and Dougherty and Dickson (2012).
Schofield (1960) and Woodroffe et al. (1983) evoked origins of sea level oscillations for individual
cheniers and transgression of the modern chenier respectively. Woodroffe et al. (1983) described
their development as beginning as sand bars developing on the intertidal foreshore, that migrate
landward under the influence of wave action to form a base on which the shell material accumulates
to form cheniers. In the lee of the shell ridges muds accumulate forming embayed flats that can be
colonised by salt marsh and mangroves. Chenier ridge growth is accelerated by wave overtopping in
storm events, causing sand and shell to be overwashed and deposited on the landward side of the
ridge. The sediment source is both longshore transport (sand and gravel fed by rivers/streams and
shoreline erosion) and shell material transported from the intertidal flats offshore. More recent
work by Dougherty and Dickson (2012) reported that chenier development is strongly influenced by
episodic sediment supply, although other factors such as the magnitude and frequency of storm
events, sea-level fluctuations, climate oscillations, longshore currents and tidal inlet dynamics are
also important (Dougherty and Dickson 2012. They hypothesised that storms, and perhaps with
waves arriving at a high angle to the shore, provided conditions for the initial formation of cheniers
and by a process where shell material initially accumulates over sand bars advancing toward the
shore (Figure 3-1). The landward movement of a chenier presumably ceases when a further sand bar
and incipient chenier develop to seaward of it. The older ridge then becomes stranded on the plain
and its former foreshore becomes an embayed tidal flat with the new ridge seaward of it.
Importantly, development of the ridges was aided by an overall fall in sea level during the latter part
of the Holocene. In the North Island the early-Holocene sea-level highstand commenced about 8,100
to 7,240 cal yr BP when present relative sea-level was obtained (Clement et al. 2016). From this
point it rose to more than 2.0 m higher than at present. Sea-level fell from about 2 m above its
present level sea level some 4,000 years BP to its present level 1,000 years BP. The fall in sea level
forced rapid progradation of the ridges and influenced the spacing of sequential ridges (Dougherty
and Dickson 2012). All 13 cheniers in the Miranda plain initially transgressed, producing similar
resultant spit morphologies, but the evolution of the more recent ridges (numbers 1–5) differed
from older ridges (numbers 6–13) in that transgression occurred over embayed tidal-flat sediments,
while the older cheniers stabilized on foreshore mudflat.
Woodroffe et al. (1983) dated chenier ridge 13 which lies against the ancient coastal cliffs at the
widest part of the plain and some 1.8 km from shore at 3900 ± 90 yrs BP. This suggests that here the
15chenier plain has built seawards at a very rapid rate (net rate of c. 4.5 m/yr). As mentioned
previously the development of the chenier plain is strongly influenced by intermittent sediment
supply, storms and sea-level fall. The Miranda cheniers are fed by a supply of shell material from the
extensive tidal flats offshore. Continued chenier development is very dependent on the continuing
supply of shell material. Chenier development in the future will also be influenced by climate
change which may increase the magnitude and frequency of storm events and be accompanied by a
rise in sea level.
The beach system
Beach systems consist of wave deposited sediment and extend from the upper limit of wave runup
or swash to seawards over the intertidal area to the sand bars in the nearshore surf zone2. The
beach morphology refers to the shape of the beach, intertidal area and surf zone. Beaches are
comprised of sediment deposited by waves. The beach morphology reflects the interplay of waves of
a certain type, length and direction and the type of sediment that is available and whether its size is
cobble, gravel (rock and shell), sand or mud or some combination thereof. Other structures on the
shore such as river and stream mouths, deltas, headlands and reefs offshore also play a role in
shaping the beach morphology. Beach type encapsulates the prevailing morphology (the modal or
most frequently occurring state) of a beach, including the wave and current conditions, the extent of
the nearshore zone, the width and shape of the surf zone and bars and troughs, and the dry or
subaerial beach. Beach types can be classified according to their morphology based on their modal
state (Short 1999).
The beaches on the Wharekawa coast can be generally classified as tide-dominated. Tide-dominated
beaches form in areas of high tide range and lower waves. They occur when the tide range is
between 10 and 15 times the average wave height and the wave height is very low. These beaches
receive sufficient wave energy, often during storms, to build-up a low gravelly beach ridge barrier
above high water level, fronted by steep, shelly/gravelly high tide beach, with low gradient sand flats
extending offshore from the base of the high tide beach. The beaches can be classified into three
sub types (Figure 3-3):
Reflective + ridged sand flat beaches have a moderate to steep, narrow, high tide beach,
with shore parallel, sinuous, low amplitude, evenly spaced sand ridges extending out across
the inter- to sub-tidal sand flats. The beach is composed of sand and gravelly sand. The
beach is only active at high tide. The ridges (sometimes called multiple bars) are active and
formed during infrequent periods of higher waves acting across the intertidal ridged zone.
2
The surf zone is the area of white water in which waves break.
16 Reflective + sand flats beaches have a small, narrow, steep (3-10°), high-tide beach
composed of coarse sand, fronted by flat featureless sand flats up to several hundred meters
wide composed of finer sand. There are no waves at a reflective + sand flat beach unless
strong onshore winds are blowing. At high tide there is deep water off the beach. At low tide
the tidal currents may parallel the low tide shoreline and it’s a long distance from dry beach
to the low tide level.
Beach + tidal/sand mud flats beaches have a narrow reflective high-tide beach composed of
coarse sediments, fronted by wide (100's to several 1000's of metres), low gradient (composed of coarse sandy, pebbly, cobble and/or shelly material, although the size and composition
of the material varies markedly from north to south along the shore. In the north at Waharau cobble
and pebble size rock material dominates with a small amount of shell (mostly oyster). At Wharekawa
the ridge is primarily gravel size rock fragments. In the south at Miranda the ridge is primarily shell
(mostly cockle) material. The composition of sediment on the beaches changes locally where
streams inject their sediment to the shoreline. The total volume of sediment stored in the beach
ridge barrier is small.
Figure 3-4. Differences in beach type along the Wharekawa coast showing the steep pebble and
cobble beach in the north at Matingarahi (upper left image) and the shelly gravelly sands south of
Kaiaua (upper right image). The lower left image shows the low beach ridge with wave overwash
lobes extending into the wetland behind. The lower right image shows muddy sands that extend
offshore from the beach in the south.
On the coast south of Wharekawa the beach type generally takes the form of Reflective + sand flats.
But there is variation both spatially and temporarily. The intertidal flats narrow to the north from
Miranda where they are about 2.2 km wide, to 1.4 km wide at Kaiaua, to 0.5 km at Whakatiwai and
to only a few 10’s of metres at Matingarahi. The tidal flats are generally muddy sands, flat and
featureless offshore from Miranda where the beach barrier is backed in places by a narrow strip of
18mangrove dominated wetlands typical of the Beach + tidal/sand mud flats morphology. This
situation can change as described by Liefting (1998 p13) who observed that during Cyclone Drena in
1997 mud was stripped/winnowed from the flats and low amplitude bedforms built in sandy
sediment appeared. Some 6 months after the event Liefting observed that suspended sediment was
deposited to form a muddy veneer over the sandy flats. That is to say the beach type transitioned
from Beach + tidal/sand mud flats to Reflective + sand flats and back to Beach + tidal/sand mud flats
post Drena. North of Kaiaua and further away from the mud input from rivers in the southern Firth
the intertidal fats are sandier and the beaches fit the types Reflective + sand flats beaches and
Reflective + ridged sand flat.
Rivers and streams (and farm drains) emerge at the shoreline in several places where they build
small deltas comprised of sand and gravel sized material. Deltas (Figure 3-5) are built by waves but
fed by sediment that comes from both the rivers/streams, sediment being transported south along
the coast and from the offshore area (mostly shell material). Deltas build seaward where sediment
supply overwhelms the capacity of waves and currents to transport material away. Delta
survival/longevity at decadal time scales is dependent on a delicate balance of sediment supply and
wave action. Because deltas protrude offshore incoming wave energy is focussed on them. If
sediment supply is cut off (e.g., through catchment activities, gravel extraction, dredging channels,
building groynes updrift), then the deltas will erode. The sensitivity of deltas poses a potential
hazard for communities built on these features.
Figure 3-5. Delta built at the mouth of the Whakatiwai Stream.
19Some 2 km south of Kaiaua consolidated muddy sediments with mangroves on top form a raised
bank that protrudes seaward over a 1 km long section of coast. The mangroves at the seaward edge
are dying as shelly beach ridge material is washed landwards. Woodroffe et al. (1983) describe a
similar burial of mangroves that occurred at the northern end of the modern chenier at Miranda and
how an area of salt marsh was entirely buried during the two years of their study.
Figure 3-6. A muddy bank with mangroves on top south of Kaiaua. The mangroves at the seaward
edge are dying as shelly beach ridge material rolls back as the coast erodes.
3.2 Water levels
Water levels play an important role in determining coastal hazards by allowing overtopping of
coastal barriers, controlling the distance water travels inland over low topography, controlling the
amount of wave energy reaching the backshore and beach ridge barrier and causing erosion during
storms, and by controlling the mean shoreline position on longer time scales.
The key determinants of water level are:
Astronomical tides
Barometric and wind effects, that are generally referred to as storm surge
Wave setup and run-up in storm events
Medium term fluctuations, including El Niño–Southern Oscillation (ENSO) and Interdecadal
Pacific Oscillation (IPO) effects
Long-term changes in sea level due to climate change
The components of increased water levels during a storm event are illustrated in Figure 3-7.
20Figure 3-7. Components causing increased water levels along the coast during a storm event.
(Source: Stephens 2019)
Astronomical tide
The astronomical tide is the tidal characteristics which occur due to gravitational effects, primarily
from the Earth, Sun and Moon, without any atmospheric influences. Spring tides occur when the sun
and moon are in alignment, as is the case with a new or full moon, their combined gravitational pull
results in exceptionally high and low tides (a large tidal range). “King Tide” is commonly used term
for the highest tides that occur over the course of the year and that eventuate when a new or full
moon occurs at the same time as the moon is at its closest to the earth (in its perigee). Neap tides
occur when the sun and the moon are at right angles to each other and pull in opposite directions
resulting in lower high tides and higher low tides than usual (a small tidal range).
Tides in the Firth of Thames are semi-diurnal. It is a mesotidal system3 (Dyer 1997) having a mean
spring range of 3.3 m and a mean neap range of 2.1 m (LINZ 2017). Tidal statistics for Rocky Point
and Tararu are presented in Table 3-1.
Note that all vertical elevations quoted in this report are relative to MVD-53 unless otherwise stated.
3
Mesotidal systems have a tide range of 2 to 4 m.
21Table 3-1. Tide statistics from Rocky Point and Tararu tide gauge. The Rocky Point data are based on
the average predicted values over the 18.6-year tidal cycle (LINZ 2017). The levels in terms of MVD-
53 (Moturiki Vertical Datum-1953) were derived by adjusting the Rocky Point Chart Datum values to
MSL = zero and then adding 0.18 m sourced from Stephens et al. (2015) from the Tararu tide gauge
analysis. The Tararau tide gauge values are derived from an analysis of the Tararu tide gauge records
(Stephens et al. 2015). It is assumed that these values are representative of the Wharekawa study
area.
Tide state Rocky Point Rocky Point Tararu
Level Chart Datum (m) Level MVD-53 (m) Level MVD-53 (m)
Maximum high water NA NA 2.10
MHWS 3.8 1.75 NA
MHWN 3.2 1.18 NA
Minimum high water NA NA 0.91
MSL 2.2 0.18 0.18
MLWN 1.1 -0.92 NA
MLWS 0.5 -1.52 NA
Storm surge
Storm surge is a temporary increase in sea level induced by winds and barometric pressure
associated with weather systems. Its effect is to elevate the water level above the predicted tide
across a region. A decrease in atmospheric pressure causes the water to rise (approximately 1 cm
water level for every 1hPa drop in pressure) and is the so-called Inverted Barometer effect. Onshore
winds ‘push’ water from deep water and ‘pile it up’ against the coastline. Storm surge excludes
nearshore effects of storm waves such as wave setup and wave run-up at the shoreline.
Storm tides
Storm tides are a combination of the astronomical tides, storm surge and the monthly mean sea
level variation (mean sea level anomaly). The largest storm tides will occur when they coincide with
a spring high tide.
Table 3-2 shows the astronomical tide and storm tide water levels for the Firth of Thames at
Miranda, Tararu tide gauge and Kaiaua. The storm tide ranges for each location are representative
only, but are derived from storm-tide analysis of water levels recorded by WRC tide gauges
(Stephens 2019). For each tide gauge, storm surge levels were calculated from the difference
between the tide value and storm tide value. The lower storm surge value is the difference between
22the MHWS10 tide value (MHWS–10 = mean high water spring height exceeded by 10% of all tides)
and the 39% AEP storm tide value (which represents a “biannual” event). The upper storm surge
value is the difference between the maximum high tide value and the maximum storm tide value. As
the largest component of a storm tide is the astronomical tide, which varies around the Waikato
region in a known way, the storm surge component derived from the nearest tide gauge was added
to the tide at each location. The lower storm tide value is the lower storm-surge value added to the
MHWS value at each location. The upper storm tide value is the upper storm surge value added to
the maximum high tide value at each location. The lower and upper storm-surge components for
each tide gauge, which were added to the tide values of the representative areas are shown in Table
3-2.
Table 3-2. Astronomical tide and storm tide water levels for Firth of Thames at Miranda, Tararu tide
gauge and Kaiaua (levels are in terms of MVD-53). (Source: Coastal Inundation Tool Guide). Note
that the Tararu tide gauge recorded a maximum water level elevation 2.982 m MVD-53 in the
January 2018 storm event – this level lies between the upper and lower storm tide levels.
Wave setup and runup
Waves can produce additional short term increases in water level during events due to the processes
of wave setup and runup.
Wave setup is the increase in mean still water sea level at the coast resulting from the release of
wave energy in the surf zone as waves break. Wave runup is defined as the maximum vertical extent
of sporadic wave ‘up rush’ or flowing water (‘green water’) on a beach or structure above the still
water or storm tide level, and thus constitutes only a short-term upper-bound fluctuation in water
level compared with wave setup (MFE 2017).
Wave setup and runup has not been calculated for the Wharekawa coast.
23Rivers
Although not specifically addressed in the report runoff from rivers and streams during heavy rainfall
can exacerbate flooding during coastal inundation events. Sea water flowing landwards up rivers and
drains prevents the escape of flood waters to the sea and causes water levels to rise to higher levels
and further inland and the land remains inundated for longer periods of time.
3.3 Long term sea levels
Global or eustatic sea level refers to the sea level change in the volume of Earth’s oceans. It is not a
physical level as such but instead represents the sea level if all the water in the oceans were
contained in a single basin. Differences of eustatic sea level are caused by:
Changes in total ocean water mass, for instance, by ice sheet melt and runoff, particularly
the large ice sheets like Greenland.
Density changes of the water, for instance, by thermal expansion, an important driver of
which is a rise in greenhouse gases such as carbon dioxide, methane and ozone.
Changes in the size of the ocean basin, for instance, by tectonic seafloor spreading or by
sedimentation.
The first two are markedly affected by climate change.
Longer-term sea-level rise in New Zealand based on analysis of tide gauge records has averaged 1.8
± 0.1 mm/yr. There is no long-term gauge records and rate for the Firth of Thames but Auckland, the
closest gauge, shows a rate of 1.6 ± 0.1 mm/yr. (Bell and Hannah 2012; Hannah 2016, MFE 2017).
Climate change is predicted to accelerate this rate of sea level rise into the future.
3.4 Currents and circulation
Currents and wider scale circulation in the Firth result from forcing by the tides and wind. While
currents play little role in beach processes, they do serve to transport fine sediment (mud and very
fine sand) that occurs on the intertidal flats and in the shallow subtidal areas. Currents and
circulation patterns have been studied by measurement and modelling and reported in Proctor and
Grieg (1989), Liefting (1998), Stephens (2003), Zeldis et al. (2015), Green and Zeldis (2015) and
Haughey (2017).
Modelling by Stephens (2003) showed that tides dominated the instantaneous flow field in the Firth
of Thames, with strongest flows in the outer Firth reaching 0.2 and 0.4 m/s during neap and spring
tides respectively (Figure 3-8). Tidal flows were very weak less than 0.05 m/s in the shallow southern
Firth. Modelling of time-average currents (or residual currents) to show long-term water migration
trends revealed that the Earth’s rotation (Coriolis force) deflected currents to the left, causing flood
24tides (incoming) to be stronger on the eastern side of the Firth near Wilsons Bay and ebb (outgoing)
tides to be stronger on the western side.
Figure 3-8. Peak instantaneous depth-averaged tidal currents in the Firth (neap 2 March 2000) and
spring (22 March 2000). Contour scale is in m/s. (Source: Figure 14 in Stephens 2003).
Wind stress on the water surface adds to and modifies flows. The modelling by Stephens (2003)
showed that wind is of secondary importance to the instantaneous currents but has a dominant
influence on time-averaged (residual) currents. When winds approach from the ENE, surface
currents are pushed southwest with a time-averaged clockwise circulation in the lower Firth, and
deep currents returned toward the north. When winds approach from the WSW, surface currents
are pushed northeast with a time averaged anticlockwise circulation in the lower Firth, and deep
currents returned toward the southwest. For example, during the calibrated March 2000 simulation
(Figure 3-9) the wind helped push stronger surface currents out of the Firth and draw bottom
currents faster than would have occurred during calm conditions. River flows also contributed to
push surface currents out of the Firth, but their contribution was minor in comparison to tide and
wind. Variable winds in the absence of stratification contributed to high variability of time-averaged
25currents during September 1999 (Figure 3-10). Overall residual currents in the southern Firth and off
the Wharekawa coast are weak and of the order of several cm/sec.
Figure 3.9. Time-average currents during the March 2000 calibration simulation, using tide, wind,
river and temperature inputs. Plots are for horizontal layers, 0-2 m and 18-20 m below mean sea
level. (Source: Figure 17 in Stephens 2003).
Figure 3.10. Time-average currents during the September 1999 calibration simulation, using tide,
wind, river and temperature inputs. Plots are for horizontal layers, 0-2 m and 18-20 m below mean
sea level. (Source: Figure 18 in Stevens 2003).
263.5 Winds
Winds are important in that they drive the waves and set up wider circulation patterns in the Firth.
Hunt (2016) reported that wind conditions measured at the Tararu tide gauge between 2003-2015
showed that the most common wind speeds range between 0 and 10 m/s and account for 93% of
the record (Figure 3-11). The majority of winds have speeds of less than 6 m/s accounting for 70% of
the record. The most common wind direction is from the north (345 - 15˚) accounting for 15.5% of
the record and the north northwest (315 - 345˚) accounting for 13.4% of the record. Within these
common directions, the most frequent wind speeds are in the 0 – 6 m/s bin (18.5% of the record)
and the 6 – 10 m/s bin (8.2% of the record). Wind from these directions have a maximum fetch of
~100 km terminating at the area around Little Barrier and Great Barrier Islands. When the wind is
blowing from the edges of these northerly sectors (345˚ and 15˚) the fetch is shorter and measures
~25 km. Strong winds blowing from this sector are rare - winds exceeding 12 m/sec (23 Knots or 43
km/hr) occur only for 0.0007% of the time.
Figure 3-11. Wind rose summarising the wind record at Tararu tide gauge between 1st January 2003
and 1st January 2015. Wind speeds are m/sec. (Source: Figure 17 in Hunt 2016).
3.6 Waves
In the absence of nearshore wave data, wave data based on the MOV Hauraki hindcast statistics for
the period 1979-2014 was extracted from MetOcean View at a location about 3.6 km offshore from
Kaiaua where the water depth was -5 m LAT (LINZ 2017). The data describe a most commonly
27occurring regime of small, short period, low energy waves, punctuated by infrequent occurrences of
taller and longer period waves from the north to northeast sectors. Wave energy from the north will
decrease to the south along the coast due to shallower water and sheltering effects.
The most common waves have a small peak period (Tp) with waves between about 1 and 4 s
accounting for 46.8% of the record (Figure 3-12). These waves have small significant wave heights
(Hs) ranging from 0 to 0.9 m (Figure 3-13). Most of these waves have a Tp of 1-3 s and range in
height from 0 to 0.4 m. accounting for 31.0% of the record (Figure 3-14). The majority of these
waves come from the north accounting for 72% of the record. These short period small waves are
probably generated by local winds blowing a short distance across the Firth. There is another group
of waves with Tp of 4 to 7 s with Hs ranging from 0 to 1.4 m that that make up about 23.5% of the
record (Figure 3-14). These waves of longer fetch are probably result from strong northerly winds
blowing down the Firth. There are less commonly occurring waves of 9 to 14 Tp and of 0 to 0.4 m Hs
that make up about 19.6% of the record. The longer period suggests that these waves represent
swell that propagates into the Firth after generation over a large fetch in the outer Hauraki Gulf.
Figure 3-12. Distribution of wave events from the MetOcean View hindcast model plotted as the
percentage occurrence of Tp and Hs. The data was extracted at 37.108 175.339E. (Source: MetOcean
View).
28Figure 3-13. Wave rose showing distribution of wave events from the MetOcean View hindcast
model plotted as the percentage occurrence of Tp and the associated wave direction. The data was
extracted at 37.108 175.339E. (Source: MetOcean View).
Figure 3-14. Distribution of wave events from the MetOcean View hindcast model plotted as the
percentage occurrence of Hs and the associated wave direction Tp. The data was extracted at
37.108 175.339E. (Source: MetOcean View).
Overall, the wind record and wave hindcast data indicate that the prevailing low energy wave
climate is infrequently exposed to both occasional long-period waves that propagate into the Firth
from the outer Hauraki Gulf and more commonly occurring shorter period waves that are generated
along the large fetch coincident with the prevailing northerly wind direction.
293.7 Sediment sources and transport
Sediment on the shore comprises a wide range of grainsize ranging from cobbles, gravel, sand and
mud. The larger size fractions are made up mainly rock fragments and some shell material. The
primary sediment sources are streams and rivers, cliff erosion and shell from the intertidal and
nearshore.
Cobble, pebble and gravel size material is derived from the rivers and streams that drain the Hunua
Ranges and discharge onto the western coast. The southernmost supply to the coast comes from the
Whakatiwai River. Far lesser amounts of coarse sediment come from erosion of coastal cliffs north of
Wharekawa. Shell material is made up of oyster and mussel shells (predominant in the north), oval
trough shell, pipi and cockle (predominant in the south). The greatest volume of shell is derived from
the wide intertidal flats of the southern Firth that provide a vast area (about 8,500 hectares) for
shellfish to grow and feeding grounds for flocks of migratory wading birds. The shell is a major and
an essential source of sediment for the gravel ridges and chenier plain formation.
Sand sized material is largely broken-down rock and soil delivered by the rivers and streams and
shell material from the sea.
Mud sized material is primarily derived from the rivers in the south of the Firth (Waitakaruru, Piako
and Waihou) that collectively drain a very large catchment. The Waihou and Piako Rivers account
for 96% of the 3,600 km2 land catchment (Swales et al. 2016). These rivers deliver an estimated
160,000 t/yr and 30,000 t/yr respectively of suspended sediment to the Firth (Hicks et al. 2011).
Peak sediment inputs from these rivers coincided with timber extraction, gold mining and land
conversion to farming by European settlers in the late mid to late 1800s (Swales et al. 2016).
3.8 Shoreline change
Shoreline change is a complex process where coastal and river/stream mouth dynamics, waves and
currents wind and tides and sediment supply and locally human modifications all play a role and
interact over different time scales. Pre-existing conditions also play a role and the extent of erosion
can depend of preceding conditions as much as the size of the storm event (Figure 3-15). For these
reasons Ramsay et al. (2012) make the point that quantifying how the shoreline will change under an
event and how the patterns and rate of change may be influenced by climate change is extremely
difficult. In particular there are considerable uncertainties in the assessment of coastal erosion,
particularly for planning periods of greater than 50 years and which involve choosing appropriate
scenarios of projected sea level rise associated with climate change.
30You can also read