GLOBAL ATTRACTIONS ATTENDANCE REPORT - Themed Entertainment ...
←
→
Page content transcription
If your browser does not render page correctly, please read the page content below
GLOBAL ATTRACTIONS ATTENDANCE REPORT

Cover image:
Star Wars: Galaxy’s Edge, Disneyland Park, Anaheim, CA, U.S.
Photo courtesy of Disney

CREDITS

TEA/AECOM 2019 Theme Index and Museum Index: The Global Attractions Attendance Report
Publisher: Themed Entertainment Association (TEA)
Research: Economics practice at AECOM
Editor: Judith Rubin
Producer: Kathleen LaClair
Lead Designers: Matt Timmins, Nina Patel
Publication team: Tsz Yin (Gigi) Au, Beth Chang, Michael Chee, Linda Cheu,
Celia Datels, Lucia Fischer, Marina Hoffman, Olga Kondaurova, Kathleen LaClair,
Jodie Lock, Jason Marshall, Sarah Linford, Jennie Nevin, Nina Patel, John Robinett,
Judith Rubin, Matt Timmins, Chris Yoshii

©2019 TEA/AECOM. All rights reserved.

CONTACTS

For further information about the contents of this report and about
the Economics practice at AECOM, contact the following:

John Robinett                                          Chris Yoshii
Senior Vice President – Economics                      Vice President – Economics, Asia-Pacific
john.robinett@aecom.com                                chris.yoshii@aecom.com
T +1 213 593 8785                                      T +852 3922 9000

Kathleen LaClair                                       Beth Chang
Associate Principal – Economics, Americas              Executive Director – Economics,                GLOBAL ATTRACTIONS
kathleen.laclair@aecom.com
T +1 610 444 3690
                                                       Asia-Pacific
                                                       beth.chang@aecom.com
                                                                                                      ATTENDANCE REPORT
                                                       T +852 3922 8109                               The definitive annual
Linda Cheu                                             Jodie Lock                                     attendance study for the
Vice President – Economics, Americas                   Associate – Economics, Asia-Pacific and EMEA   themed entertainment and
linda.cheu@aecom.com                                   jodie.lock@aecom.com
T +1 415 955 2928                                      T +852 3922 9000                               museum industries.
                                                       aecom.com/economics                            Published by the Themed
                                                                                                      Entertainment Association
For information about TEA (Themed Entertainment Association):                                         (TEA) and the Economics
Judith Rubin                                           Jennie Nevin                                   practice at AECOM.
TEA Director of Publications                           TEA Chief Operating Officer
judy@teaconnect.org                                    jennie@teaconnect.org
T +1 314 853 5210                                      T +1 818 843 8497

TEAconnect.org
8.0%
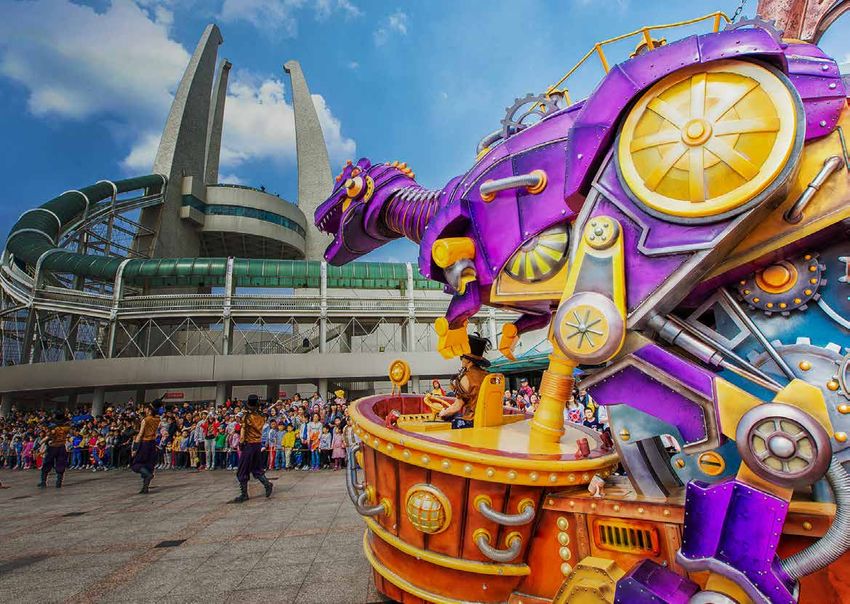
China Dinosaur Park,
Changzhou, China,
attendance growth
2018–19
CONTENTS
THE BIG PICTURE 6
THE AMERICAS 24
ASIA-PACIFIC 42
EMEA 58
MUSEUMS 70
ABOUT THE STUDY 98
FREQUENTLY ASKED QUESTIONS 99
China Dinosaur Park, Changzhou, China
© China Dinosaur Park
4 5
THE BIG PICTURE    4.0%                                             STABLE 2019 SETS STAGE
                   Top 10 theme park
                   groups worldwide
                   attendance
                                                                    FOR COMING CHALLENGES
                   growth 2018–19
                                                                    While 2020 has been a year of great
                                                                    challenges for the global visitor attractions
                   521.2m                                           industry, our report, as always, focuses on
                                                                    the results of the previous year, in this case,
                   Top 10 theme park                                2019. We will share some brief comments
                   groups worldwide
                   attendance 2019                                  about 2020 at the end of this column and
                                                                    in selected sections of this report, with
                                                                    detailed analysis to follow, of course, in next
                   501.2m                                           year’s edition.
                   Top 10 theme park
                   groups worldwide
                   attendance 2018                                  After clearing the half billion
                                                                    attendance mark in 2018, the
                                                                    world’s top theme parks, water
                                                                    parks and attractions continued
                                                                    to climb to 521m in 2019 for a 4.0%
                                                                    annual growth rate as represented
                                                                    by the top 10 attraction groups.
                                                                    —
                                                                    The Asian operators once again dominated
                                                                    — with OCT, Chimelong, and Fantawild
                                                                    all reporting high single- or double-digit
                                                                    increases. In the West, Cedar Fair led the
                                                                    pack with visitation up 8.0%, which included
                                                                    the acquisition of several water parks.

    JOHN ROBINETT                      9.1m
    Senior Vice President –
                                       Universal Studios
    Economics                          Hollywood, Universal City,   Universal Studios Hollywood, Universal City, CA, U.S.
    —                                  CA, U.S., attendance 2019                           © Universal Studios Hollywood

6                                                                                                                           7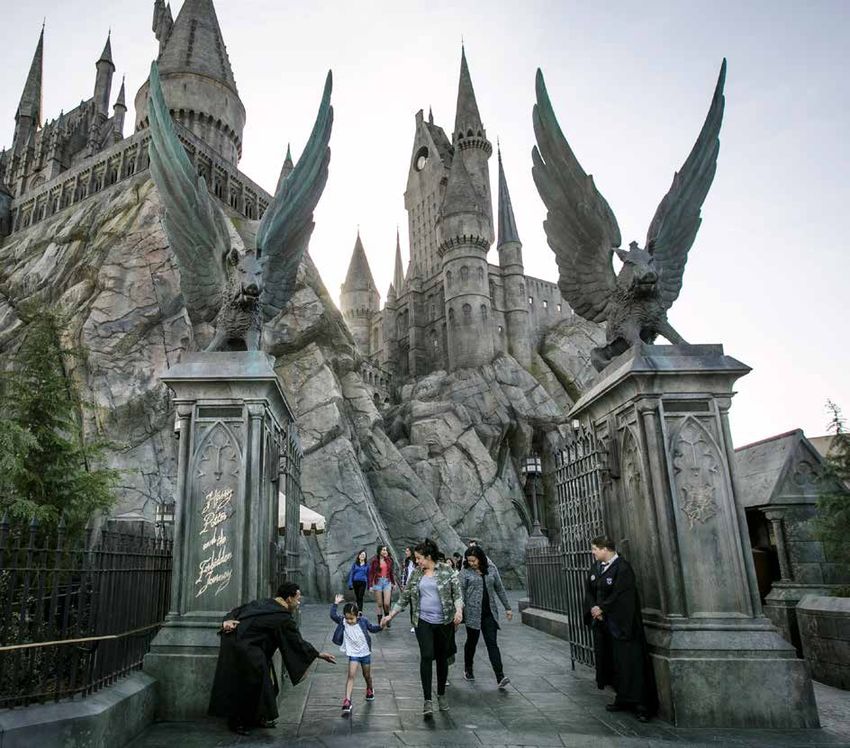
Looking at the top 20 theme parks in the      Overall, EMEA was relatively flat in 2019.
    various global markets showed general         North American parks advanced at a
    stability in 2019 with modest growth rates.   modest rate of 1.0% with Universal’s Islands      23.3%
    Asia’s top parks expanded at roughly 2.0%,    of Adventure producing the best results at        Therme Erding,
    slightly down from the previous year, with    6.0%, followed by Canada’s Wonderland at          Erding, Germany,
    China in general, and OCT in particular,      4.0%, and Knott’s Berry Farm at 3.0%. Latin       attendance growth
                                                                                                    2018–19
    delivering strong performances. EMEA          American parks were flat as a whole.
    had mixed results this year with Merlin’s
    LEGOLAND parks showing consistent, mid-       Water parks fared about the same as theme
    single digit growth, Germany’s parks doing    parks this year with a slight increase of
    well, and Parc Astérix (France) up 7.0%.      0.6%. Contributors were a number of strong
                                                  Asian parks, and Therme Erding in Germany
                                                  whose seasonal investments delivered a
                                                  notable 23.0% increase in volume.

                                                  Museums in Europe had positive results off
    THE ATTRACTIONS INDUSTRY                      the back of some major exhibits expanding
    IS RESILIENT, CREATIVE AND                    attendance by over 4.0%. While Asian
                                                  Museums had stable attendance, overall
    RESPONSIVE TO THE NEEDS                       global market share in the top visited
    OF ITS GUESTS.                                museums increased. North America
                                                  came down off a big exhibit year in 2018
                                                  and was also impacted by a re-calibration                                                         Therme Erding, Erding, Germany
                                                  of Smithsonian numbers which led to a                                                                            © Therme Erding
                                                  loss of 17.5%.

                                                                                                  As a whole, 2019 was a rather mild-
                                                                                                  mannered year in the industry, with stable
                                                                Chimelong International Ocean
                                                                                                  results in the established European and
      8.4%                                                       Tourist Resort, Hengqin, China
                                                                                   © Chimelong    American markets being supplemented by         AS A WHOLE, 2019 WAS A
      Chimelong Ocean                                                                             moderate growth in Asia. This could indicate   RATHER MILD-MANNERED
                                                                                                  that some pre-recessionary pressures
      Kingdom, Hengqin,
      China, attendance                                                                           were building under the surface before the
                                                                                                                                                 YEAR IN THE INDUSTRY, WITH
      growth 2018–19                                                                              tectonic COVID-19 shifted the foundation of    STABLE RESULTS IN THE
                                                                                                  the world’s health and economies.              ESTABLISHED EUROPEAN AND
                                                                                                                                                 AMERICAN MARKETS BEING
                                                                                                  With respect to the impact of COVID-19, as
                                                                                                  of this writing major commercial attraction
                                                                                                                                                 SUPPLEMENTED BY MODERATE
                                                                                                  operators are either considering or have       GROWTH IN ASIA.
                                                                                                  opened their attractions for the summer
                                                                                                  season. Cultural attractions, such as
                                                                                                  museums and aquariums, are beginning
                                                                                                  to open — albeit with more caution — in
                                                                                                  various parts of the world as well.

8                                                                                                                                                                                    9
The general sentiment is that with new
     health and safety measures, many
                                                    Finally, it is worth noting that the industry
                                                    has undergone major disruptions before
                                                                                                        TOP 10
     attractions will be able to get back to        — related to health, safety, economic and           THEME PARK GROUPS
     business this year (although at a different
     level). Some are predicting 30.0% to 50.0%
                                                    security issues. While acknowledging the
                                                    serious nature and consequences of the              WORLDWIDE
     of normal business volume for the coming       current pandemic, history shows us that

                                                                                                        GROUP NAME

                                                                                                                                                                                                 ATTENDANCE

                                                                                                                                                                                                              ATTENDANCE
     months, and surveys show positive demand       people’s behavior, with some exceptions,

                                                                                                                                                                                      % CHANGE
     from the market. However, it may take one      largely returns to normal once the threat

                                                                                                        RANK

                                                                                                                                                                                                 2019

                                                                                                                                                                                                              2018
     to several years to return to pre-COVID        is removed. The attractions industry is
     operating levels, and the investment horizon   resilient, creative, and responsive to the
     of many owners may be altered due to cash      needs of its guests. This — combined with           1 WALT DISNEY ATTRACTIONS                                                    -0.8% 155,991,000 157,311,000
     flow loss.                                     the industry’s lasting value of producing           2 MERLIN ENTERTAINMENTS GROUP                                                 0.9% 67,000,000 66,400,000*
                                                    family fun, shared experiences, and escape
                                                    — points to a future of recovery and new            3 OCT PARKS CHINA                                                             9.4% 53,970,000 49,350,000
                                                    innovations as it has in the past.                  4 UNIVERSAL PARKS AND RESORTS                                                 2.3% 51,243,000 50,068,000
                                                                                                        5 FANTAWILD GROUP                                                            19.8% 50,393,000 42,074,000
                                                                                                        6 CHIMELONG GROUP                                                             8.9% 37,018,000 34,007,000
                                                                                                        7 SIX FLAGS INC.                                                              2.5% 32,811,000 32,024,000
                                                                                                        8 CEDAR FAIR ENTERTAINMENT COMPANY                                            7.8% 27,938,000 25,912,000
                                                                                                        9 SEAWORLD PARKS & ENTERTAINMENT                                              0.2% 22,624,000 22,582,000
                                                                                                        10 PARQUES REUNIDOS                                                           6.2% 22,195,000 20,900,000
                                                                                         14.7m            TOP 10 ATTENDANCE GROWTH 2018–19                                            4.0% 521,183,000 501,228,000
                                                                                                        © 2020 TEA / AECOM
                                                                                   Tokyo DisneySea,
                                                                                        Tokyo, Japan,
                                                                                    attendance 2019

                                                                                                        * Adjustment versus the figure we published in last year’s report

                                                                                                        4.0%                                         521.2m                      501.2m
                                                                                                        Top 10 theme park groups                     Top 10 theme park groups    Top 10 theme park groups
                                                                                                        worldwide attendance growth                  worldwide attendance 2019   worldwide attendance 2018
     Tokyo DisneySea, Tokyo, Japan                                                                      2018–19
     © Tokyo DisneySea

10                                                                                                                                                                                                                         11
TOP 25
AMUSEMENT/THEME PARKS
WORLDWIDE
ATTENDANCE
ATTENDANCE
ATTENDANCE
ATTENDANCE
% CHANGE
% CHANGE
LOCATION
LOCATION
RANK
RANK
PARK
PARK
2019
2018
2019
2018
1 MAGIC KINGDOM THEME PARK AT WALT DISNEY WORLD RESORT, 0.5% 20,963,000 20,859,000 14 DISNEYLAND PARK AT DISNEYLAND PARIS, MARNE-LA-VALLEE, FRANCE -1.0% 9,745,000 9,843,000
LAKE BUENA VISTA, FL, U.S.
15 UNIVERSAL STUDIOS HOLLYWOOD, UNIVERSAL CITY, CA, U.S. 0.0% 9,147,000 9,147,000
2 DISNEYLAND PARK, ANAHEIM, CA, U.S. 0.0% 18,666,000 18,666,000
16 EVERLAND, SEOUL, SOUTH KOREA 12.9% 6,606,000 5,850,000
3 TOKYO DISNEYLAND, TOKYO, JAPAN 0.0% 17,910,000 17,907,000
17 LOTTE WORLD, SEOUL, SOUTH KOREA -0.1% 5,953,000 5,960,000
4 TOKYO DISNEYSEA, TOKYO, JAPAN 0.0% 14,650,000 14,651,000
18 NAGASHIMA SPA LAND, KUWANA, JAPAN 0.5% 5,950,000 5,920,000
5 UNIVERSAL STUDIOS JAPAN, OSAKA, JAPAN 1.4% 14,500,000 14,300,000
19 EUROPA-PARK, RUST, GERMANY 0.5% 5,750,000 5,720,000
6 DISNEY'S ANIMAL KINGDOM AT WALT DISNEY WORLD, LAKE BUENA VISTA, FL, U.S. 1.0% 13,888,000 13,750,000
20 OCEAN PARK, HONG KONG SAR -1.7% 5,700,000 5,800,000
7 EPCOT AT WALT DISNEY WORLD, LAKE BUENA VISTA, FL, U.S. 0.0% 12,444,000 12,444,000
21 HONG KONG DISNEYLAND, HONG KONG SAR -15.0% 5,695,000 6,700,000
8 CHIMELONG OCEAN KINGDOM, HENGQIN, CHINA 8.4% 11,736,000 10,830,000
22 DE EFTELING, KAATSHEUVEL, NETHERLANDS -1.7% 5,260,000 5,350,000*
9 DISNEY'S HOLLYWOOD STUDIOS AT WALT DISNEY WORLD, LAKE BUENA VISTA, FL, U.S. 2.0% 11,483,000 11,258,000
23 WALT DISNEY STUDIOS PARK AT DISNEYLAND PARIS, MARNE-LA-VALLEE, FRANCE -1.0% 5,245,000 5,298,000
10 SHANGHAI DISNEYLAND, SHANGHAI, CHINA -5.0% 11,210,000 11,800,000
24 OCT HAPPY VALLEY, BEIJING, CHINA 29.6% 5,160,000 3,980,000
11 UNIVERSAL STUDIOS FLORIDA AT UNIVERSAL ORLANDO, FL, U.S. 2.0% 10,922,000 10,708,000
25 CHIMELONG PARADISE, GUANGZHOU, CHINA 4.8% 4,905,000 4,680,000
12 UNIVERSAL'S ISLANDS OF ADVENTURE AT UNIVERSAL ORLANDO, FL, U.S. 6.0% 10,375,000 9,788,000
TOP 25 TOTAL ATTENDANCE 2019 253,724,000 251,070,000
13 DISNEY CALIFORNIA ADVENTURE PARK, ANAHEIM, CA, U.S. 0.0% 9,861,000 9,861,000
TOP 25 ATTENDANCE GROWTH 2018–19 0.7% 253,724,000 251,990,000
© 2020 TEA / AECOM
0.7% 253.7m 252.0m
Top 25 amusement/theme parks Top 25 amusement/theme parks Top 25 amusement/theme parks
worldwide attendance growth worldwide attendance 2019 worldwide attendance 2018
2018–19
12 © 2020 TEA / AECOM © 2020 TEA / AECOM 13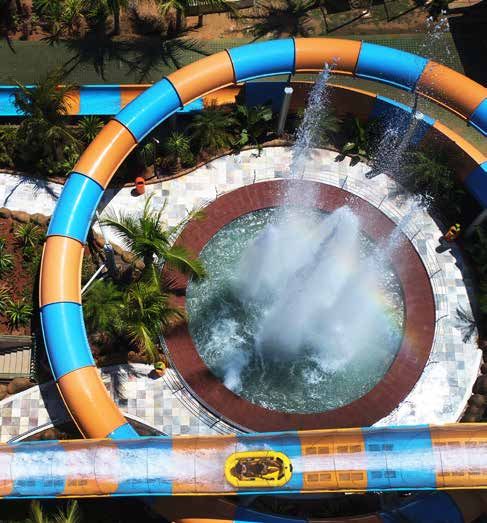
TOP 25
AMUSEMENT/THEME PARKS
WORLDWIDE
NETHERLANDS SOUTH KOREA
5.3m 22 17 16 12.6m
1 PARK 2 PARKS
GERMANY
FRANCE
23
19
5.8m 25 18
15
15.0m 14 1 PARK
CHINA
24 8 3 JAPAN
CALIFORNIA, U.S.
37.7m 2
2 PARKS 33.0m 5 53.0m
4 PARKS 4 PARKS
3 PARKS 10
13 4
HONG KONG
21 20 11.4m
12 2 PARKS
1
11
FLORIDA, U.S.
80.1m
6 PARKS
9 6
7
MAP KEY GROWTH Top 25 theme/amusement parks worldwide
Top 20 water parks worldwide
Circles represent size of 1010
0.7% 253.7m 252.0m
0%–4.9%
5%–9.9%
attendance at ranked parks at
the geography indicated. Slices 5
10%+
< 0%
within circles represent proportion
of attendance at the geography 0
from the ranked park indicated Top 25 amusement/theme parks Top 25 amusement/theme parks Top 25 amusement/theme parks
by number. Shading indicates -5-5 worldwide attendance growth worldwide attendance 2019 worldwide attendance 2018
attendance growth at the ranked 2010–11 2011–12 2012–13 2013–14 2014–15 2015–16 2016–17 2017–18 2018-19 2018–19
park versus all other ranked parks. 3.8% 5.2% 4.3% 4.1% 5.4% -1.1% 4.7% 3.3% 0.7%
14 © 2020 TEA / AECOM © 2020 TEA / AECOM 15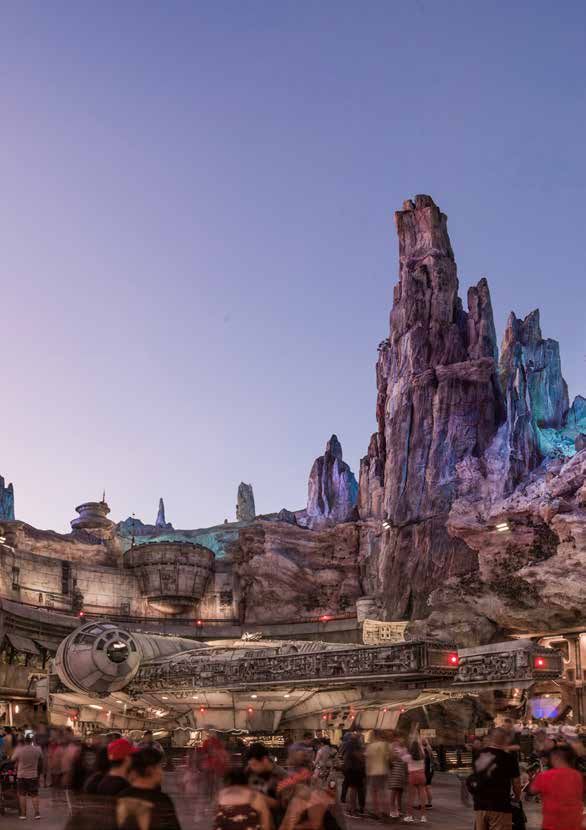
TOP 20
     WATER PARKS
     WORLDWIDE

                                                                           ATTENDANCE

                                                                                           ATTENDANCE

                                                                                                                                                                                                        ATTENDANCE

                                                                                                                                                                                                                        ATTENDANCE
                                                             % CHANGE

                                                                                                                                                                                          % CHANGE
     LOCATION

                                                                                                        LOCATION
     RANK

                                                                                                        RANK
     PARK

                                                                                                        PARK
                                                                           2019

                                                                                           2018

                                                                                                                                                                                                        2019

                                                                                                                                                                                                                        2018
     1 CHIMELONG WATER PARK, GUANGZHOU, CHINA              10.0%        3,014,000       2,740,000       11 CARIBBEAN BAY, SEOUL, SOUTH KOREA                                            11.1%        1,333,000       1,200,000
     2 TYPHOON LAGOON AT DISNEY WORLD, ORLANDO, FL, U.S.   -1.0%        2,248,000       2,271,000       12 AQUAVENTURE WATER PARK, DUBAI, U.A.E.                                        -5.4%        1,322,000       1,397,000
     3 BLIZZARD BEACH AT DISNEY WORLD, ORLANDO, FL, U.S.   -1.0%        1,983,000       2,003,000       13 AQUAPALACE, PRAGUE, CZECH REPUBLIC                                            0.9%        1,300,000       1,288,000
     4 THERME ERDING, ERDING, GERMANY                      23.3%        1,850,000       1,500,000       14 TROPICAL ISLANDS, KRAUSNICK, GERMANY                                          2.8%        1,233,000       1,200,000
     5 THERMAS DOS LARANJAIS, OLIMPIA, BRAZIL              -6.4%        1,845,000       1,971,000       15 PLAYA MAYA WATER PARK, WUHAN, CHINA                                          12.0%        1,210,000       1,080,000
     6 BAHAMAS AQUAVENTURE WATER PARK, PARADISE ISLAND                                                  16 AQUAVENTURE ATLANTIS, SANYA, CHINA                                          100.0%        1,200,000        600,000
                                                           -1.0%        1,813,000       1,831,000
       (NASSAU, NEW PROVIDENCE), BAHAMAS
                                                                                                            SUNWAY LAGOON, KUALA LUMPUR, MALAYSIA                                       -7.7%        1,200,000       1,300,000
     7 VOLCANO BAY, ORLANDO, FL, U.S.                       5.0%        1,811,000       1,725,000
                                                                                                            SIAM PARK, SANTA CRUZ DE TENERIFE, SPAIN                                    -0.8%        1,200,000       1,210,000
     8 AQUATICA, ORLANDO, FL, U.S.                         -1.5%        1,533,000       1,556,000
                                                                                                        19 WET 'N' WILD GOLD COAST, GOLD COAST, AUSTRALIA                                0.0%        1,120,000       1,120,000
     9 HOT PARK RIO QUENTE, CALDAS NOVAS, BRAZIL            2.1%        1,469,000 1,439,000*
                                                                                                        20 OCEAN WORLD, GANGWON-DO, SOUTH KOREA                                        -15.3%        1,071,000       1,264,000
     10 WUHU FANTAWILD WATER PARK, WUHU, CHINA             -0.9%        1,348,000       1,360,000
                                                                                                         TOP 20 TOTAL ATTENDANCE 2019                                                                31,103,000 30,055,000
                                                                                                         TOP 20 ATTENDANCE GROWTH 2018–19                                                0.6% 31,103,000 30,919,000
                                                                                                        © 2020 TEA / AECOM

                                                                                                        * Adjustment versus the figure we published in last year’s report

                                                                                                        0.6%                                         31.1m                          30.9m
                                                                                                        Top 20 water parks worldwide                 Top 20 water parks worldwide   Top 20 water parks worldwide
                                                                                                        attendance growth 2018–19                    attendance 2019                attendance 2018

16                                                                            © 2020 TEA / AECOM        © 2020 TEA / AECOM                                                                                                           17
TOP 20
WATER PARKS
WORLDWIDE
SOUTH KOREA
GERMANY CZECH REPUBLIC
20 11 2.4m
2 PARKS
8
3.1m 14 4 13 1.3m
2 U.S. 2 PARKS 1 PARK
16
7.6m CHINA
7 4 PARKS SPAIN 6.8m 15
1
3
BAHAMAS
1.2m 16 4 PARKS 10
1 PARK
6 1.8m 12
1 PARK
U.A.E.
1.3m MALAYSIA
1 PARK 1.2m 16
1 PARK
BRAZIL
9 5 3.3m
2 PARKS
AUSTRALIA
19 1.1m
1 PARK
MAP KEY GROWTH Top 20 water parks worldwide
Top 25 theme/amusement parks worldwide
Circles represent size of 1010
0.6% 31.1m 30.9m
0%–4.9%
5%–9.9%
attendance at ranked parks at
the geography indicated. Slices 5
10%+
< 0%
within circles represent proportion
of attendance at the geography 0
from the ranked park indicated Top 20 water parks worldwide Top 20 water parks worldwide Top 20 water parks worldwide
by number. Shading indicates -5-5 attendance growth 2018–19 attendance 2019 attendance 2018
attendance growth at the ranked 2010–11 2011–12 2012–13 2013–14 2014–15 2015–16 2016–17 2017–18 2018-19
park versus all other ranked parks. 8.2% 5.4% 7.1% 2.8% 3.7% 3.6% 1.6% 2.5% 0.6%
18 © 2020 TEA / AECOM © 2020 TEA / AECOM 19TOP 20
MUSEUMS
WORLDWIDE
ATTENDANCE
ATTENDANCE
ATTENDANCE
ATTENDANCE
FREE/PAID
FREE/PAID
% CHANGE
% CHANGE
LOCATION
LOCATION
MUSEUM
MUSEUM
RANK
RANK
2019
2018
2019
2018
1 LOUVRE, PARIS, FRANCE -5.9% 9,600,000 10,200,000 11 SHANGHAI SCIENCE AND TECHNOLOGY MUSEUM, SHANGHAI, CHINA 36.3% 4,824,000 3,540,000
2 NATIONAL MUSEUM OF CHINA, BEIJING, CHINA -14.2% 7,390,000 8,610,000 12 REINA SOFÍA, MADRID, SPAIN 13.5% 4,426,000 3,898,000
3 VATICAN MUSEUMS, VATICAN, VATICAN CITY 1.9% 6,883,000 6,756,000 13 NATIONAL MUSEUM OF NATURAL HISTORY, WASHINGTON, DC, U.S. -12.5% 4,200,000 4,800,000
4 THE METROPOLITAN MUSEUM OF ART, NEW YORK, NY, U.S. -8.0% 6,770,000 7,360,000 14 NANJING MUSEUM, NANJING, CHINA 13.6% 4,169,000 3,670,000
5 BRITISH MUSEUM, LONDON, U.K. 5.8% 6,208,000 5,869,000 15 ZHEJIANG MUSEUM, HANGZHOU, CHINA -1.2% 4,150,000 4,200,000
6 TATE MODERN, LONDON, U.K. 4.6% 6,098,000 5,829,000 16 NATIONAL GALLERY OF ART, WASHINGTON, DC, U.S. -7.5% 4,074,000 4,404,000
7 NATIONAL GALLERY, LONDON, U.K. 4.8% 6,011,000 5,736,000 17 VICTORIA & ALBERT MUSEUM, LONDON, U.K. -1.2% 3,921,000 3,968,000
8 NATURAL HISTORY MUSEUM, LONDON, U.K. 3.8% 5,424,000 5,226,000 18 CHINA SCIENCE TECHNOLOGY MUSEUM, BEIJING, CHINA -11.6% 3,891,000 4,400,000
9 AMERICAN MUSEUM OF NATURAL HISTORY, NEW YORK, NY, U.S. 0.0% 5,000,000 5,000,000 19 NATIONAL PALACE MUSEUM, TAIPEI, TAIWAN -0.7% 3,832,000 3,860,000
10 STATE HERMITAGE, ST PETERSBURG, RUSSIA 15.4% 4,957,000 4,294,000 20 MUSÉE D'ORSAY, PARIS, FRANCE 15.0% 3,652,000 3,175,000
TOP 20 TOTAL ATTENDANCE 2019 105,480,000 104,795,000
TOP 20 ATTENDANCE GROWTH 2018–19 -2.4% 105,480,000 108,080,000
© 2020 TEA / AECOM
-2.4% 105.5m 108.1m
Top 20 museums worldwide Top 20 museums worldwide Top 20 museums worldwide
attendance growth 2018–19 attendance 2019 attendance 2018
20 © 2020 TEA / AECOM © 2020 TEA / AECOM 21TOP 20
MUSEUMS
WORLDWIDE
17 5
U.K.
27.7m 8
5 MUSEUMS 7 6
RUSSIA
10 5.1m
1 MUSEUM
FRANCE 20
13.3m 1 VATICAN CITY 18
16
4
U.S. 2 MUSEUMS 3
6.9m 2 CHINA
24.4m
13
20.0m 12 1 MUSEUM
15
5 MUSEUMS
9 4 MUSEUMS 14 11
SPAIN TAIWAN
4.4m 19 3.8m
1 MUSEUM 1 MUSEUM
MAP KEY GROWTH Top 20 museums worldwide
Circles represent size of 10 10
-2.4% 105.5m 108.1m
0%–4.9%
5%–9.9%
attendance at ranked parks at
the geography indicated. Slices 5
10%+
< 0%
within circles represent proportion
of attendance at the geography 0
from the ranked museum Top 20 museums worldwide Top 20 museums worldwide Top 20 museums worldwide
indicated by number. Shading -5 -5 attendance growth 2018–19 attendance 2019 attendance 2018
indicates attendance growth at 2012–13 2013–14 2014–15 2015–16 2016–17 2017–18 2018–19
the ranked museum versus all 7.2% 1.6% -0.7% 1.2% 0.2% 0.1% -2.4%
other ranked museums.
22 © 2020 TEA / AECOM © 2020 TEA / AECOM 23THE AMERICAS 1.0%
Top 20 amusement/
NORTH AMERICA THEME
PARKS: STEADY GROWTH IN
theme parks North
America attendance 2019, SUSTAINED BY BEST
growth 2018–19
PRACTICES
159.1m The top 20 theme parks in North
Top 20 amusement/ America saw 1.0% growth overall in
theme parks North 2019, representing 1.6 million new
America attendance
2019
visits for these leading operators
and popular chains.
—
157.5m
Top 20 amusement/ Collectively, we’re seeing the operators and
theme parks North parks in this group doing all the right things
America attendance — making strategic acquisitions, investing
2018
in new lands and rides, extending the
season and customer base with new events,
and focusing on the guest experience to
drive performance. These practices will
continue to be important as the industry
moves forward.
KATHLEEN LACLAIR
Associate Principal –
Economics, Americas Kings Island, Mason, OH, U.S.
— © Cedar Point
24 25Of course, the big new IP on the horizon for Attendance at Canada’s Wonderland
6.0% this operator is Super Nintendo World which increased 4.0%, due in part to additional
Universal's Islands of will open first at Universal Studios Japan, operating days for its new WinterFest event
Adventure at Universal then within the massive, new Epic Universe and a new coaster Yukon Striker. Knott’s
Orlando, FL, U.S., in Orlando and eventually at Universal Berry Farm also had a great year, with 3.0%
attendance growth
2018–19
Studios Singapore. growth, a new PEANUTS celebration and a
revamped raft ride, Calico River Rapids.
Regional Operators
Cedar Fair reported the strongest increase
among the domestic operators, with growth
of 7.8% within its full portfolio, which now
includes the Schlitterbahn New Braunfels
and Schlitterbahn Galveston water parks
(acquired mid-summer 2019). Outside CEDAR FAIR'S STRATEGY, AND
the increase in overall attendance from RESULTING PERFORMANCE,
the two new water parks, attendance at
the operator’s legacy collection of parks
FORM A STRONG EXAMPLE FOR
increased 5.0%. INVESTING AND REINVESTING,
Universal's Islands of Adventure at Universal Orlando, FL, U.S., WHETHER IN NEW PARKS, RIDES
© Universal and WBEI. Publishing Rights © JKR.(s20) Cedar Fair's strategy, and resulting OR EXPERIENCES, TO DRIVE
performance, form a strong example
for investing and reinvesting, whether in
ATTENDANCE AND REVENUES.
new parks, rides or experiences, to drive
Disney, Universal There has been continued investment in attendance and revenues.
At Disney's domestic parks, the opening of Pixar Pier at Disney California Adventure
Star Wars: Galaxy’s Edge introduced a richly with Jessie’s Critter Carousel and Inside Out
themed new land that takes participatory Emotional Whirlwind in 2019. Set to open
immersion to new levels, and showcases soon: Avengers Campus at Disneyland,
what Disney does best, immersing guests a strong IP with immense potential for 2.0%
in storied lands, rides and attractions. theming within their parks. Six Flags Great America,
The land and its pioneering rides, Rise of Gurnee, IL, U.S.,
the Resistance and Millennium Falcon: Universal Studios North American parks attendance growth
Smugglers Run, have received accolades, were up 2.8% in 2019, with most of that 2018–19
including TEA Thea Awards. Disney’s growth due to strong performance at
domestic park attendance numbers were Universal’s Islands of Adventure with the
flat overall for 2019 compared to the new addition of Hagrid's Magical Creatures
previous year which could be attributed Motorbike Adventure steel coaster (soon
to the operator emphasizing its yield to receive a TEA Thea Award) within the
strategy by prioritizing the quality of guest Wizarding World of Harry Potter. This
experience and per caps. This operating popular IP continues to drive attendance
model has emerged over the last decade and performance for Universal, which first
and will likely serve operators well moving debuted the Wizarding World of Harry Potter
forward, with respect to capacity limitations realm at Islands of Adventure in 2010 —
in parks and the continued need to 10 years and still going strong.
stay competitive.
Universal Studios Florida continues to benefit
from the Fast and the Furious franchise Six Flags Great America, Gurnee, IL, U.S.
as well as more onsite capacity with the © Six Flags Great America
Aventura hotel added in 2018.
26 27Knott's Berry Farm, Buena Park, CA, U.S. NORTH AMERICA Unfortunately, Hurricane Dorian and a
wetter than average summer overall led
3.0% © Knott's Berry Farm
WATER PARKS: to slight declines in attendance. Outside
Knott's Berry Farm, Buena
Park, CA, U.S., attendance
RAIN OR RIDES? Florida, these mostly suburban water parks
saw a relatively flat year in attendance, with
growth 2018–19 a few exceptions. Zoombezi Bay in Ohio had
The top water parks in North America added another strong season with a 6.4% increase,
nearly 200,000 visits in 2019, an increase of which they attribute to a wide range of
1.2% over 2018. factors, including better weather, continued
success from the 2018 Otter Banks
Orlando’s four water parks comprise nearly addition, and new marketing campaigns.
half of our list’s total attendance, and with Typhoon Texas in Katy also reported record
relatively even market share, especially attendance for the second year in a row,
as Universal’s Volcano Bay continues to with a 6.0% increase. Contributing factors
stabilize within the competitive market. included a switch to dynamic pricing,
There were no significant changes at enhanced marketing and better execution
Disney’s Typhoon Lagoon and Blizzard overall — proof that strategies implemented
Beach; SeaWorld’s Aquatica added the by the big operators can also benefit
family-oriented KareKare Curl slide. regional markets and smaller parks.
In 2019, SeaWorld Parks and Entertainment
was able to maintain the additional visits
secured in 2018, continuing its rebound 4.0% 6.0%
after a series of challenging years leveraging Canada's Wonderland, Typhoon Texas,
new attractions, improved theming and IP. Vaughan, Ontario, Katy, Texas, U.S.,
Sesame Street Land was very well received Canada, attendance attendance growth
at SeaWorld Orlando and the operator growth 2018–19 2018–19
continues to employ this popular IP with
the transition of Aquatica San Diego into a
Sesame Place park, slated to open in 2021.
Six Flags reported steady growth, at 2.5%,
which represents almost 800,000 new visits,
helped by the new Maxx Force coaster at
Six Flags Great America near Chicago. The
operator acquired five new parks in 2018,
which resulted in significantly increased
attendance for their portfolio last year, and
also continues to please guests with rides
and experiences themed on DC Comics
stories and characters.
Canada's Wonderland, Vaughan,
Ontario, Canada Typhoon Texas, Katy, Texas, U.S.
© Canada's Wonderland © Typhoon Texas
28 29Other significant reinvestments in 2019 That said, there were some notable
Parque de la Costa, Buenos Aires, Argentina
include Water Country USA’s Cutback increases at individual parks in 2019: Parque
Water Coaster, Aquatica San Antonio’s Ihu's Xcaret in Cancun, Mexico saw an increase 10.5% © Parque de la Costa
Breakaway Falls, Schlitterbahn Galveston’s of 4.0% and continues to gain market share Parque de la Costa,
Infinity Racers slides, Six Flags Hurricane after adding another hotel in 2018. Grupo Buenos Aires, Argentina,
Harbor Splashtown, Houston’s Wahoo Xcaret has an established record of high attendance growth
Wave six-story wave wall slide and Six quality and smart reinvestment and can now 2018–19
Flags Hurricane Harbor, Jackson’s new boast a fully integrated destination resort
100,000-gallon activity pool. at this location. Parque Mundo Petapa in
Guatemala saw an attendance increase
of 8.5%, likely due to positive market
LATIN AMERICA conditions and a new coaster, Relámpago.
THEME PARKS: Parque de la Costa in Argentina increased
attendance by 10.5%, thanks to good
UPS AND DOWNS weather, and an increase of domestic
visitors. Beto Carrero World in Brazil, which
ranks #2 on the top 10 and saw attendance
With visits totaling 15.7 million at the top 10 grow by 2.9%, also cited more domestic
theme parks in Latin America and Mexico visitation and the positive economic
in 2019, attendance overall is flat, showing recovery in Brazil during much of 2019.
an increase of just 0.1 % over 2018. In this
region, we continue to see three factors play Though their visitor numbers weren’t high
a key role in the success of parks: politics, enough to make the Top 10 list this year,
economics and safety — with positive and two other parks had notable increases. Hopi
negative results. Hari in Brazil continues to make a comeback
from safety and ownership issues, while
also benefiting from market conditions, 8.5%
and had an attendance increase of 32.0% Mundo Petapa,
in 2019, an encouraging trend. Theme Park Guatemala City,
Xetulul in Guatemala had an attendance Guatemala, attendance
increase of 12.1%, creditable to the area’s growth 2018–19
WE CONTINUE TO SEE THREE improved infrastructure and growing
destination status.
FACTORS PLAY A KEY ROLE
IN THE SUCCESS AT PARKS In Mexico City, La Feria De Chapultepec had
IN THIS REGION — POLITICS, previously ranked high in the top 10 before
having its license revoked due to a fatal
ECONOMICS AND SAFETY accident. At this writing, the property was
— WITH POSITIVE AND closed and ripe for acquisition, with signs of
NEGATIVE RESULTS. interest from major operators.
Mundo Petapa, Guatemala City, Guatemala
© Mundo Petapa
30 31LATIN AMERICA New to our list, Magic City Water Park in
Suzano, Brazil reported strong growth due
Thermas dos Laranjais, Olimpia, Brazil
WATER PARKS: to new attractions and marketing efforts. 1.9m © Thermas dos Laranjais
MILESTONES AND Situated in the São Paulo regional market,
Magic City offers guests a variety of slides
Thermas dos Laranjais,
Olimpia, Brazil,
SHIFTING IN THE RANKS and pools, including hot springs, in an
integrated resort setting.
attendance 2019
Year 2019 saw the top 10 water parks Thermas Water Park in São Pedro, Brazil
in Latin America and Mexico pass the added 160,000 visits in 2019 and attributed
10 million mark in attendance for the first the growth to investments on multiple
time — 10.2 million visits representing a fronts including the addition of a large, new
1.9% year-over-year increase. Much of it was playground area; marketing, infrastructure,
driven by three parks, each achieving more new food and beverage options, and new
than 30.0% growth over 2018 attendance. ticket windows, resulting in a significantly
improved guest experience.
Chongqing Happy Valley
© OCT
32.2%
Magic City Water
Park, Suzano, Brazil,
attendance growth
2018–19
Hot Beach, in Olimpia, Brazil, moved up one On the down side, Piscilago, in Bogota,
place on the top 10 chart, from #10 in 2018 Colombia suffered a substantial decrease
to #9 in 2019, reflecting a 31.6% attendance of 11.5% in attendance for 2019, likely due
jump with almost 150,00 additional visits. to economic factors. The economy was
Hot Beach benefited from more domestic also cited by Thermas dos Laranjas in
visitation, aided by an increase of hotel Olimpia, Brazil, which saw a 6.4% attendance
rooms in the city, and economic conditions decrease in 2019 despite adding a new
in Brazil bringing more international tourism. slide complex — but kept its #1 position
Following the trend of increasing visitation in on the chart.
shoulder seasons and with events, the park
Magic City Water Park, Suzano, Brazil added Halloween, Christmas, Easter and
© Magic City Water Park spring break to its 2019 operating calendar.
32 33TOP 20
AMUSEMENT/THEME PARKS
NORTH AMERICA
ATTENDANCE
ATTENDANCE
% CHANGE
LOCATION
RANK
PARK
2019
2018
1 MAGIC KINGDOM THEME PARK AT WALT DISNEY WORLD RESORT, LAKE BUENA VISTA, FL, U.S. 0.5% 20,963,000 20,859,000
2 DISNEYLAND PARK, ANAHEIM, CA, U.S. 0.0% 18,666,000 18,666,000
3 DISNEY'S ANIMAL KINGDOM AT WALT DISNEY WORLD, LAKE BUENA VISTA, FL, U.S. 1.0% 13,888,000 13,750,000
4 EPCOT AT WALT DISNEY WORLD, LAKE BUENA VISTA, FL, U.S. 0.0% 12,444,000 12,444,000
5 DISNEY'S HOLLYWOOD STUDIOS AT WALT DISNEY WORLD, LAKE BUENA VISTA, FL, U.S. 2.0% 11,483,000 11,258,000
6 UNIVERSAL STUDIOS FLORIDA AT UNIVERSAL ORLANDO, FL, U.S. 2.0% 10,922,000 10,708,000
7 UNIVERSAL'S ISLANDS OF ADVENTURE AT UNIVERSAL ORLANDO, FL, U.S. 6.0% 10,375,000 9,788,000
ONTARIO, CANADA
8 DISNEY CALIFORNIA ADVENTURE PARK, ANAHEIM, CA, U.S. 0.0% 9,861,000 9,861,000
4.0m 13
9 UNIVERSAL STUDIOS HOLLYWOOD, UNIVERSAL CITY, CA, U.S. 0.0% 9,147,000 9,147,000
1 PARK
MIDWEST U.S. 10 SEAWORLD ORLANDO, ORLANDO, FL U.S. 1.0% 4,640,000 4,594,000
20
10.4m 16
14
NORTHEAST U.S. 11 KNOTT'S BERRY FARM, BUENA PARK, CA U.S. 3.0% 4,238,000 4,115,000
3 PARKS 19 18 6.8m 12 BUSCH GARDENS TAMPA BAY, TAMPA, FL U.S. 1.0% 4,180,000 4,139,000
2 PARKS
13 CANADA'S WONDERLAND, MAPLE, ONTARIO, CANADA 4.0% 3,950,000 3,798,000
14 CEDAR POINT, SANDUSKY, OH, U.S. 1.5% 3,731,000 3,676,000
15 SIX FLAGS MAGIC MOUNTAIN, VALENCIA, CA, U.S. 0.5% 3,610,000 3,592,000
15 17 16 KINGS ISLAND, KINGS ISLAND, OH, U.S. 1.0% 3,521,000 3,486,000
CALIFORNIA, U.S. 11 10 12 1
2 7 17 SEAWORLD SAN DIEGO, SAN DIEGO, CA, U.S. -8.1% 3,485,000 3,793,000*
49.0m FLORIDA, U.S. 18 SIX FLAGS GREAT ADVENTURE, JACKSON, NJ, U.S. 1.5% 3,451,000 3,400,000
6 PARKS
9
8
6
88.9m 19 HERSHEYPARK, HERSHEY, PA, U.S. 0.5% 3,384,000 3,367,000
8 PARKS
3 20 SIX FLAGS GREAT AMERICA, GURNEE, IL, U.S. 2.0% 3,169,000 3,107,000
5 4
TOP 20 TOTAL ATTENDANCE 2019 159,108,000 157,548,000
TOP 20 ATTENDANCE GROWTH 2018–19 1.0% 159,108,000 157,478,000
© 2019 TEA / AECOM
* Adjustment versus the figure we published in last year’s report
KEY GROWTH Top 20 parks North America
Top 25 parks worldwide
Circles represent size of 10 10
1.0% 159.1m 157.5m
0%–4.9%
5%–9.9%
attendance at ranked parks at
the geography indicated. Slices 5
10%+
< 0%
within circles represent proportion
of attendance at the geography 0
from the ranked park indicated Top 20 amusement/theme Top 20 amusement/theme Top 20 amusement/theme
by number. Shading indicates -5 -5 parks North America parks North America parks North America
attendance growth at the ranked 2010–11 2011–12 2012–13 2013–14 2014–15 2015–16 2016–17 2017–18 2018–19 attendance growth 2018–19 attendance 2019 attendance 2018
park versus all other ranked parks.
2.9% 3.6% 2.7% 2.2% 5.9% 1.2% 2.3% 4.0% 1.0%
34 © 2020 TEA / AECOM © 2020 TEA / AECOM 35TOP 10
AMUSEMENT/THEME PARKS
LATIN AMERICA
ATTENDANCE
ATTENDANCE
% CHANGE
LOCATION
RANK
PARK
2019
2018
1 SIX FLAGS MEXICO, MEXICO CITY, MEXICO 0.5% 2,803,000 2,789,000
2 BETO CARRERO WORLD, SANTA CATARINA, BRAZIL 1.9% 2,241,000 2,200,000
MEXICO 3 PARQUE XCARET, CANCUN, MEXICO 4.0% 1,960,000 1,885,000
6
7.2m 5
3
1 4 MUNDO PETAPA, GUATEMALA CITY, GUATEMALA 8.5% 1,330,000 1,226,000
4 PARKS
5 LA FERIA DE CHAPULTEPEC, MEXICO CITY, MEXICO -18.0% 1,306,000 1,593,000
GUATEMALA 6 PLAZA DE SESAMO, MONTERREY, MEXICO -1.0% 1,173,000 1,185,000
1.3m 4 COLOMBIA 7 PARQUE MUNDO AVENTURA, BOGOTÁ, COLOMBIA -0.6% 1,151,000 1,158,000
1 PARK 9 7 2.2m 8 FANTASIALANDIA, SANTIAGO, CHILE 0.0% 1,100,000 1,100,000
2 PARKS
9 THEME PARQUE NACIONAL DEL CAFÉ, QUINDIO, COLOMBIA 1.5% 1,043,000 1,028,000
10 PARQUE DE LA COSTA, BUENOS AIRES, ARGENTINA 10.5% 968,000 876,000
TOP 10 TOTAL ATTENDANCE 2019 15,075,000 15,040,000
TOP 10 ATTENDANCE GROWTH 2018–19 0.1% 15,075,000 15,064,000
© 2020 TEA / AECOM
BRAZIL
CHILE
2 2.2m
1 PARK
1.1m 8
1 PARK
ARGENTINA
10 1.0m
1 PARK
* Adjustment versus the figure we published in last year’s report
KEY GROWTH Top 10 parks Latin America
Top 25 parks worldwide
10
Circles represent size of 10
0.1% 15.1m 15.0m
0%–4.9%
5%–9.9%
attendance at ranked parks at
the geography indicated. Slices 5
10%+
< 0%
within circles represent proportion
of attendance at the geography 0
from the ranked park indicated
Top 10 amusement/theme Top 10 amusement/theme parks Top 10 amusement/theme parks
by number. Shading indicates -5 -5 parks Latin America attendance Latin America attendance 2019 Latin America attendance 2018
attendance growth at the ranked 2010–11 2011–12 2012–13 2013–14 2014–15 2015–16 2016–17 2017–18 2018–19 growth 2018–19
park versus all other ranked parks.
0.7% 2.6% 3.8% 6.0% 1.0% 0.7% -2.2% 4.2% 0.1%
36 © 2020 TEA / AECOM © 2020 TEA / AECOM 37TOP 20
WATER PARKS
NORTH AMERICA
ATTENDANCE
ATTENDANCE
% CHANGE
LOCATION
RANK
PARK
2019
2018
1 TYPHOON LAGOON AT DISNEY WORLD, ORLANDO, FL, U.S. -1.0% 2,248,000 2,271,000
2 BLIZZARD BEACH AT DISNEY WORLD, ORLANDO, FL, U.S. -1.0% 1,983,000 2,003,000
3 UNIVERSAL'S VOLCANO BAY, ORLANDO, FL, U.S. 5.0% 1,811,000 1,725,000
4 AQUATICA, ORLANDO, FL, U.S. -1.5% 1,533,000 1,556,000
5 SCHLITTERBAHN, NEW BRAUNFELS, TX, U.S. -2.0% 996,000 1,016,000
6 WATER COUNTRY USA, WILLIAMSBURG, VA, U.S. 1.0% 736,000 729,000
7 ADVENTURE ISLAND, TAMPA, FL, U.S. -1.9% 656,000 669,000
8 AQUATICA SAN ANTONIO, SAN ANTONIO, TX, U.S. 0.9% 651,000 645,000
NORTHEAST U.S. 9 SCHLITTERBAHN, GALVESTON, TX, U.S. 1.4% 567,000 559,000
18
MIDWEST U.S. 13
10
1.5m 10 SPLISH SPLASH, CALVERTON NY, U.S. 0.6% 542,000 539,000
3 PARKS
0.9m 20 16
11 SIX FLAGS-HURRICANE HARBOR, ARLINGTON, TX, U.S. 0.9% 538,000 533,000
2 PARKS SOUTHERN U.S.
SOUTHWEST U.S. 19 12 SIX FLAGS WHITE WATER ATLANTA, MARIETTA, GA, U.S. -0.9% 526,000 531,000
0.4m 17
12
6 1.7m 13 SIX FLAGS HURRICANE HARBOR, JACKSON, NJ, U.S. 1.5% 482,000 475,000
1 PARK 3 PARKS
TEXAS, U.S. 15 5 14 TYPHOON TEXAS, KATY, TX, U.S. 6.0% 478,000 451,000
14
3.7m 11
15 SIX FLAGS HURRICANE HARBOR SPLASHTOWN, SPRING, TX, U.S. 0.0% 475,000 475,000*
6 PARKS 9 8
4
7 1 16 ZOOMBEZI BAY, POWELL, OH, U.S. 6.4% 466,000 438,000
FLORIDA, U.S.
8.2m 17 SIX FLAGS HURRICANE HARBOR PHOENIX, GLENDALE, AZ, U.S. -2.0% 441,000 450,000*
5 PARKS 18 CAMELBEACH, TANNERSVILLE, PA, U.S. 0.5% 439,000 437,000
3 2
19 DOLLYWOOD'S SPLASH COUNTRY, PIGEON FORGE, TN, U.S. -0.9% 433,000 437,000
20 CEDAR POINT SHORES, SANDUSKY, OH, U.S. 1.0% 424,000 420,000
TOP 20 TOTAL ATTENDANCE 2019 16,425,000 16,359,000
TOP 20 ATTENDANCE GROWTH 2018–19 1.2% 16,425,000 16,237,000
© 2020 TEA / AECOM
* Adjustment versus the figure we published in last year’s report
KEY GROWTH Top 20 water parks North America
Top 20 water parks worldwide
Circles represent size of 10
10
1.2% 16.4m 16.2m
0%–4.9%
5%–9.9%
attendance at ranked parks at
the geography indicated. Slices 5
10%+
< 0%
within circles represent proportion
of attendance at the geography 0
from the ranked park indicated Top 20 water parks North Top 20 water parks North Top 20 water parks North
by number. Shading indicates -5-5 America attendance growth America attendance 2019 America attendance 2018
attendance growth at the ranked 2010–11 2011–12 2012–13 2013–14 2014–15 2015–16 2016–17 2017–18 2018–19 2018–19
park versus all other ranked parks.
0.1% 2.2% -2.3% 1.6% 4.3% -0.7% -2.9% 5.8% 1.2%
38 © 2020 TEA / AECOM © 2020 TEA / AECOM 39TOP 10
WATER PARKS
LATIN AMERICA
ATTENDANCE
ATTENDANCE
% CHANGE
LOCATION
RANK
PARK
2019
2018
BAHAMAS 1 THERMAS DOS LARANJAIS, OLIMPIA, BRAZIL -6.4% 1,845,000 1,971,000
2 1.8m 2 BAHAMAS AQUAVENTURE WATER PARK, PARADISE ISLAND
(NASSAU, NEW PROVIDENCE), BAHAMAS
-1.0% 1,813,000 1,831,000
1 PARK
MEXICO
0.5m 10 3 HOT PARK RIO QUENTE, CALDAS NOVAS, BRAZIL 2.1% 1,469,000 1,439,000*
1 PARK 4 PARQUE ACUATICO XOCOMIL, SAN MARTÍN ZAPOTITLÁN, RETALHULEU, GUATEMALA 6.4% 894,000 840,000
GUATEMALA 5 BEACH PARK, AQUIRAZ, BRAZIL -6.3% 890,000 950,000
0.9m 4 COLOMBIA 6 PISCILAGO, GIRARDOT (BOGOTA), COLOMBIA -11.5% 876,000 990,000
1 PARK
0.9m 6
7 MAGIC CITY WATER PARK, SUZANO, BRAZIL 32.2% 681,000 515,000
1 PARK
8 THERMAS WATER PARK, SÃO PEDRO, BRAZIL 33.3% 641,000 481,000
9 HOT BEACH, OLYMPIA, BRAZIL 31.6% 608,000 462,000
8 9
BRAZIL
10 PARQUE ACUATICO EL ROLLO, MORELOS, MEXICO -0.9% 525,000 530,000
1
7 6.1m TOP 10 TOTAL ATTENDANCE 2019 10,242,000 10,009,000
5 3 6 PARKS TOP 10 ATTENDANCE GROWTH 2018–19 2.5% 10,242,000 9,988,000
© 2020 TEA / AECOM
KEY GROWTH Top 10 water parks Latin America
Top 20 water parks worldwide
10
Circles represent size of 10
2.5% 10.2m 10.0m
0%–4.9%
5%–9.9%
attendance at ranked parks at
the geography indicated. Slices 5
10%+
< 0%
within circles represent proportion
of attendance at the geography 0
from the ranked park indicated Top 10 water parks Latin Top 10 water parks Latin Top 10 water parks Latin
by number. Shading indicates -5 -5 America attendance growth America attendance 2019 America attendance 2018
attendance growth at the ranked 2013–14 2014–15 2015–16 2016–17 2017–18 2018–19 2018–19
park versus all other ranked parks.
5.7% 0.3% 3.4% 1.5% 0.6% 2.5%
40 © 2020 TEA / AECOM © 2020 TEA / AECOM 41ASIA-PACIFIC 1.6%
Top 20
6th
6th top theme park
CHINA’S REGIONAL AND
GLOBAL TRAJECTORY
amusement/theme group worldwide,
Chimelong Group,
parks Asia‑Pacific
China
The visitor attractions sector
attendance growth
2018–19 in the Asia Pacific region overall
showed attendance growth of 1.6%
for calendar year 2019. The most
141.3m dramatic increases were in China.
Top 20 Theme parks, water parks and park
amusement/theme operators in China showed strong
parks Asia-Pacific
attendance 2019 attendance growth across the
board, with some dramatic shifts
in rank, globally and regionally.
139.1m —
Top 20
amusement/theme
parks Asia-Pacific
attendance 2018
CHRIS YOSHII
Vice President – Economics,
Asia-Pacific
—
BETH CHANG
Executive Director –
Economics, Asia‑Pacific Chimelong Ocean Kingdom, Hengqin, China
— © Chimelong Ocean Kingdom
42 43Fantawild adds new parks every year and in The show “Dancing Islands” at Fantawild
2019 its total grew to 29. The four new parks, Asian Legend Park received an IAAPA
1.6m all with Chinese cultural or historical themes, Brass Ring Award in 2019 for “Most Creative
Changsha Fantawild are Jingzhou Fantawild Oriental Heritage; Multimedia Spectacular.” This operator
Oriental Heritage, Fantawild Oriental Legend in Handan; focuses on serving regional Chinese
Changsha China, Jiayugan Fantawild Silk Road Dreamland, in markets and smaller cities that draw on a
attendance 2019 Gansu province; and Changsha Fantawild base of 4-5 million population. The Fantawild
Oriental heritage in Hunan province. New development model brings the entire
Fantawild projects in development include industry chain to the region it serves with
Ningbo Traditional Chinese Culture Park support by the local government.
in Hangzhoue Bay; Boonie Bears Town in
Linhai, Shenzhen; and Xuzhou Fantawild
Park in Jiangsu province.
Zhengzhou Fantawild Adventure, Zhengzhou, China
© Fantawild CHINA’S GROWTH IN THE LEISURE
SECTOR IS A STORY OF SUPPLY AND
DEMAND: A LARGE POPULATION WITH
ASIA-PACIFIC THEME Chimelong turned the normally slow month INCREASING INCOME AND DESIRE
of December into an attendance booster FOR TRAVEL AND LEISURE.
PARKS: BIG NUMBERS with a special promotion at Ocean Kingdom,
allowing free admission to any child under
China’s growth in the leisure sector is a story 1.5 meters (five feet) in height (similar to
of supply and demand: a large population free admission for kids under age 12 in
with increasing income and desire for travel the West). The park continues to expand, 11.2m
and leisure, across a large land mass with and in 2019 opened its new, 6,700-seat Shanghai Disneyland,
ever-better transportation infrastructure. Chimelong Theater, a circus show venue. Shanghai, China,
These are ideal conditions for regional Its new Marine Science Park and hotel are attendance 2019
parks and attractions to develop and for nearing completion.
regional chains to expand. Helping drive
significant jumps in market share in 2019 Looking at our chart of the Top 10 Theme
were promotional programs that included Park Groups Worldwide, OCT Parks China
special offers, school group admissions, and Fantawild Group both grew significantly
and special celebrations marking the 70th in 2019. Fantawild, which opened four new
anniversary of the founding of Communist parks in 2019, achieved an attendance
China, an important national holiday. increase of nearly 20% representing
about 8 million additional visits. With 9.4%
In Zhuhai, Chimelong Ocean Kingdom attendance growth, OCT, already the largest
ascended to the rank of top-attended theme park operator in China, rose in the
theme park in China. Its 11.7 million visits ranks above Universal Parks and Resorts to
in 2019 reflect an 8.4% increase from the be the third-largest in the world.
prior year, coming in about 500,000 higher
than Shanghai Disneyland, which saw a
slight attendance drop as it focuses on Shanghai Disneyland, Shanghai, China
implementing a yield strategy. © Disney
44 45The state-owned OCT chain was one of Japan and Korea
many tourism and attraction operators in In Japan, theme park attendance numbers 12.9%
the country that built promotions around were relatively flat in 2019, with visitation Everland, Seoul, South
the 70th anniversary of Communist China, tapering off as the year progressed, Korea, attendance
resulting in attendance jumps. OCT’s group although its two top-attended parks, growth 2018–19
attendance totals also expanded with the Tokyo Disneyland and Tokyo DisneySea,
addition of numerous small attractions, part of Tokyo Disney Resort, still head the
including unique farm attractions with lower attendance list. Universal Studios Japan
admission fees that drew families with small experienced a slight increase for the year.
children. It should be noted that group
operator totals include visits to any gated New at Tokyo Disney Resort: In July
commercial attraction, excluding temporary 2019 Tokyo DisneySea opened the flying
events and scenic spots. attraction Soaring: Fantastic Flight and
the Song of Mirage show. DisneySea
is undergoing expansion and in May
2019 broke ground on its eighth themed
port, Fantasy Springs, a realm based on
Disney films that will include a new hotel.
Expansion has also been underway at
Tokyo Disneyland with a new Beauty and
the Beast attraction within a large-scale,
Everland, Seoul, South Korea
entertainment and retail development. © Everland
Universal Studios Japan rolled out Lotte World amusement park is part of
Universal Cool Japan 2019, a series of rides, an extensive urban complex in Seoul that
14.5m attractions and events immersing guests
in anime and pop culture brands such as
added the 1,821-foot-high Lotte World
Tower in 2017, featuring the observation
Universal Studios Detective Conan, Lupin the Third, Sailor attraction Seoul Sky. Meanwhile, in Busan,
Japan, Osaka, Japan,
Moon, Neon Genesis Evangelion, Godzilla Lotte World is developing a new family
attendance 2019
and Attack on Titan! resort, Lotte’s Magic Forest.
In Korea, overall park attendance was
up and numbers were stable for 2019,
showing recovery after a two-year slump
caused primarily by a drop in tourism from
Mainland China. In Seoul, Everland park
posted some good results though still lower
than its previous peak, and Lotte World
remained flat.
Everland helped keep guests engaged in
all weathers with New Year’s celebrations,
followed by its Winter Festival and Snow
Safari. Everland Resort also includes the
Universal Studios Japan, Osaka, Japan water park Caribbean Bay, two museums
© Monkey Punch/TMS/NTV and hospitality.
46 47Shift in travel patterns and looking Nonetheless 2020 is expected to show
down the COVID road a record reduction in park attendance in
6.0m Chinese tourists have been staying closer Asia. Looking beyond 2020, there is room
Lotte World, Seoul, to home, which is good for domestic for optimism and expectation that 2021
South Korea, markets but has meant lost revenue to other and subsequent years will bring significant
attendance 2019 countries. The effects of COVID-19 were recovery in terms of attendance numbers,
felt in China before the rest of the world, and as parks experiment with business and
subsequently the first stages of recovery operations models.
have been appearing there as well. At this
writing in midyear 2020, numerous parks The development pipeline remains strong. In
had already re-opened with restrictions and 2019, a dozen or more new parks opened in
attendance caps, and domestic travel by air China. There are big attraction projects now
and train were showing promising signs of in development or construction, including
recovery. Operators are working to salvage a major aquarium project by Chimelong.
what they can of the summer season, with Some projects will likely experience delays
an emphasis on local markets. of a few months and up to a year. However,
we see long-term, sustained growth in the
attractions industry. There is continued
interest on the part of government to
support tourism and cultural projects that
support and spur domestic consumption.
Lotte World, Seoul, South Korea
Hong Kong Accolades in 2019 included Ocean Park
Hong Kong experienced disruptions to being named “Most Popular Theme Park”
tourism and discretionary spending due to at the 5th Ferris Awards of the China 5.7m
six months of social movement protests Association of Amusement Parks and Hong Kong Disneyland,
in 2019. Hong Kong Disneyland, although Attractions (CAAPA), which also named Hong Kong SAR,
it started the year with robust attendance Timothy Ng, executive director, operations attendance 2019
growth, ended the calendar year with total and entertainment as “China Amusement
visits down 15.0%. Industry Pioneer.”
Ocean Park Hong Kong reported fiscal year Hong Kong Disneyland is undergoing a
attendance (ending June 2019) was flat; its multi-year transformation and expansion
reporting period did not reflect much impact that will include a new, immersive area
from the social movement protests. themed on “Frozen” and a re-imagining of
the castle.
In 2019, Ocean Park offered a Summer
Adventure Camp for children, opened the
new Wild Twister thrill ride and introduced an
innovative, VR free fall ride, The Abyss — VR
Space Voyage.
Hong Kong Disneyland, Hong Kong SAR
© Disney
48 49ASIA-PACIFIC There is a great deal of innovation in water
parks in Asia with more indoor parks
WATER PARKS: in cooler climates, larger water parks 10.0%
UPS AND DOWNS integrating “dry” amusement elements,
water parks as anchors to new township
Chimelong Water Park,
Guangzhou, China,
projects and resort style, tropical attendance growth
Overall, water park attendance in Asia water parks. 2018–19
was relatively flat for 2019, with half a
percent growth. Among the individual China
parks, attendance performance was all Chimelong Water Park in Guangzhou, China
along the spectrum from flat to double- readily maintained its #1 position on our
digit increases. table of the Top 20 Water Parks in Asia-
Pacific, with a healthy 10.0% attendance
The water park industry remains very vibrant increase in 2019. The park is part of the
in Asia with many new properties of all sizes extensive Guangzhou Chimelong resort
and locations opening in many different that also includes a theme park, safari park
countries. Water parks are attractive to and circus stadium. In 2018 Chimelong
developers as they generally represent a Water Park was the first to install the unique
lower investment and are quicker to design SlideWheel, which doubles as water ride and
and build compared to larger theme parks. centerpiece spectacle, and received a TEA Chimelong Water Park, Guangzhou, China
Thea Award. © Chimelong
Aquaventure Atlantis in Sanya, China In Wuhan, Playa Maya Water Park enjoyed
dramatically emerged onto the scene in a 12.0% attendance increase. The park is
1.2m 2019. It is part of Atlantis Sanya, a high- located near Wuhan Happy Valley, a tourist
Aquaventure Atlantis, end resort honored with multiple awards destination with a cluster of theme parks.
Sanya, China, from travel groups. Located in a popular, Playa Maya Water Park in Tianjin likewise
attendance 2019 coastal area, the resort includes a 55-story showed a 4.2% attendance increase. Both
hotel, water park and aquarium. In 2019, water parks benefited from the overall OCT
the resort started selling water park tickets Group summertime festival promotions.
independent of hotel stays, making it eligible
for inclusion in our study.
The water park features extensive themed
environments and landscaping, marquee
water slides through aquarium tanks and
action rivers. Its temperate location enables THE WATER PARK INDUSTRY
it to do well year-round and achieve the REMAINS VERY VIBRANT
1.2 million attendance that landed it in the
#5 position on our Top 20 chart.
IN ASIA WITH MANY NEW
PROPERTIES OF ALL SIZES
AND LOCATIONS OPENING IN
MANY DIFFERENT COUNTRIES.
Aquaventure Atlantis, Sanya, China
© Atlantis Sanya
50 51Caribbean Bay, Seoul, South Korea
1.2%
11.1% © Caribbean Bay
Sunway Lagoon,
Caribbean Bay, Kuala Lumpur,
Seoul, South Korea, Malaysia,
attendance growth attendance 2019
2018–19
Sunway Lagoon, Kuala Lumpur, Malaysia
© Sunway Lagoon
Korea and Southeast Asia Looking at Southeast Asia: Two Sunway Hopes for a sustainable season
In South Korea, the water park markets parks in Malaysia are among the Top 20 At this writing, the water parks in Asia are
showed mixed results for 2019, with some Water Parks in Asia-Pacific. Sunway Lagoon, beginning to open up for guests in 2020,
parks showing strong increases while in Kuala Lumpur, experienced a 7.7% albeit with capacity and other restrictions WATER PARK VISITATION FOR
others declined. Caribbean Bay in Seoul, attendance decrease which dropped it one imposed due to the pandemic. Water park 2020 IS NOT EXPECTED TO BE AS
part of the Samsung Everland resort place to the #5 spot. In addition to water visitation for 2020 is not expected to be as
complex, experienced an 11.1% increase in attractions, Sunway Lagoon incorporates strong as 2019 but operators are hopeful
STRONG AS 2019 BUT OPERATORS
attendance. Caribbean Bay boasts what are dry amusement rides, wildlife exhibits, live about capturing sustainable levels of visits ARE HOPEFUL ABOUT CAPTURING
said to be the world’s longest current pool shows and scary walk-through zones. In and revenue for the season. SUSTAINABLE LEVELS OF VISITS
and largest combined water slide. Everland Perak, Sunway’s Lost World of Tambun AND REVENUE FOR THE SEASON.
in general saw increased attendance to moved up from the #10 spot to #9 on our
the resort based on strong marketing and Top 20 chart, with 1 million attendance for
promotions. Woongjin Playdoci Waterdoci, 2019. Lost World of Tambun represents a
in Bucheon, showed solid attendance sizable resort and entertainment complex
growth of 4.2%. that has grown significantly over the years.
Ocean World, in Hongcheon, had an
attendance decline of 15.3% in 2019. It is the
largest water park (in terms of area) in the
country and part of the Vivaldi Park resort
which also includes a ski resort and other
leisure options.
52 53TOP 20
AMUSEMENT/THEME PARKS
ASIA-PACIFIC
ATTENDANCE
ATTENDANCE
% CHANGE
LOCATION
RANK
PARK
2019
2018
1 TOKYO DISNEYLAND, TOKYO, JAPAN 0.0% 17,910,000 17,907,000
SOUTH KOREA 2 TOKYO DISNEYSEA, TOKYO, JAPAN 0.0% 14,650,000 14,651,000
NORTHERN CHINA
7 6 12.6m 3 UNIVERSAL STUDIOS JAPAN, OSAKA, JAPAN 1.4% 14,500,000 14,300,000
2 PARKS
5.2m JAPAN
4 CHIMELONG OCEAN KINGDOM, HENGQIN, CHINA 8.4% 11,736,000 10,830,000
1 PARK
53.0m 5 SHANGHAI DISNEYLAND, SHANGHAI, CHINA -5.0% 11,210,000 11,800,000
WESTERN CHINA 11 4 PARKS 6 EVERLAND, SEOUL, SOUTH KOREA 12.9% 6,606,000 5,850,000
3.6m 18
7 LOTTE WORLD, SEOUL, SOUTH KOREA -0.1% 5,953,000 5,960,000
1 PARK
8 8 NAGASHIMA SPA LAND, KUWANA, JAPAN 0.5% 5,950,000 5,920,000
1
3 9 OCEAN PARK, HONG KONG SAR -1.7% 5,700,000 5,800,000
16
SOUTHERN CHINA
10 HONG KONG DISNEYLAND, HONG KONG SAR -15.0% 5,695,000 6,700,000
24.6m 15 4 2
11 OCT HAPPY VALLEY, BEIJING, CHINA 29.6% 5,160,000 3,980,000
4 PARKS 12
12 CHIMELONG PARADISE, GUANGZHOU, CHINA 4.8% 4,905,000 4,680,000
20 13 UNIVERSAL STUDIOS SINGAPORE, SINGAPORE 2.3% 4,500,000 4,400,000
HONG KONG 19 EASTERN CHINA
11.4m 10 9
5
26.4m 14 CHINA DINOSAUR PARK, CHANGZHOU, CHINA 8.0% 4,434,000 4,106,000
2 PARKS 17 14 5 PARKS 15 OCT WINDOW OF THE WORLD, SHENZHEN, CHINA 0.0% 3,990,000 3,990,000
16 OCT HAPPY VALLEY, SHENZHEN, CHINA 1.8% 3,980,000 3,910,000
SINGAPORE
13
4.5m 17 ZHENGZHOU FANTAWILD ADVENTURE, ZHENGZHOU, CHINA 1.1% 3,840,000 3,800,000
1 PARK 18 OCT HAPPY VALLEY, CHENGDU, CHINA 15.5% 3,580,000 3,100,000
19 NINGBO FANTAWILD ORIENTAL HERITAGE, NINGBO, CHINA -4.4% 3,575,000 3,740,000
20 OCT HAPPY VALLEY, SHANGHAI, CHINA 21.1% 3,390,000 2,800,000
TOP 20 TOTAL ATTENDANCE 2019 141,264,000 138,224,000
TOP 20 ATTENDANCE GROWTH 2018–19 1.6% 141,264,000 139,104,000
© 2020 TEA / AECOM
* Adjustment versus the figure we published in last year’s report
KEY GROWTH Top 20 parks Asia-Pacific
Top 25 parks worldwide
Circles represent size of 1010
1.6% 141.3m 139.1m
0%–4.9%
5%–9.9%
attendance at ranked parks at
the geography indicated. Slices 5
10%+
< 0%
within circles represent proportion
of attendance at the geography 0
from the ranked park indicated Top 20 amusement/theme parks Top 20 amusement/theme parks Top 20 amusement/theme parks
by number. Shading indicates -5-5 attendance growth Asia-Pacific Asia-Pacific attendance 2019 Asia-Pacific attendance 2018
attendance growth at the ranked 2010–11 2011–12 2012–13 2013–14 2014–15 2015–16 2016–17 2017–18 2018–19 2018–19
park versus all other ranked parks.
7.5% 5.8% 7.5% 4.9% 6.8% -2.8% 5.5% 3.6% 1.6%
54 © 2020 TEA / AECOM © 2020 TEA / AECOM 55TOP 20
WATER PARKS
ASIA-PACIFIC
ATTENDANCE
ATTENDANCE
% CHANGE
LOCATION
RANK
PARK
2019
2018
1 CHIMELONG WATER PARK, GUANGZHOU, CHINA 10.0% 3,014,000 2,740,000
2 WUHU FANTAWILD WATER PARK, WUHU, CHINA -0.9% 1,348,000 1,360,000
3 CARIBBEAN BAY, SEOUL, SOUTH KOREA 11.1% 1,333,000 1,200,000
4 PLAYA MAYA WATER PARK, WUHAN, CHINA 12.0% 1,210,000 1,080,000
19 SOUTH KOREA 5 AQUAVENTURE ATLANTIS, SANYA, CHINA 100.0% 1,200,000 600,000
3
17
8
3.9m SUNWAY LAGOON, KUALA LUMPUR, MALAYSIA -7.7% 1,200,000 1,300,000
4 PARKS
7 WET 'N' WILD GOLD COAST, GOLD COAST, AUSTRALIA 0.0% 1,120,000 1,120,000
15 17 1 8 OCEAN WORLD, HONGCHEON, SOUTH KOREA -15.3% 1,071,000 1,264,000
CHINA 13 JAPAN
9 KAIFENG YINJI WATER PARK, KAIFENG, CHINA 0.0% 1,000,000 1,000,000*
11.2m 11
14
0.9m
9 PARKS 2 1 PARK SUNWAY LOST WORLD OF TAMBUN, PERAK, MALAYSIA 0.0% 1,000,000 1,000,000
9
5 4
SINGAPORE
11 PLAYA MAYA WATER PARK, SHANGHAI, CHINA -2.0% 970,000 990,000
20 0.7m 12 ATLANTIS WATER ADVENTURE, JAKARTA, INDONESIA 0.3% 910,000 907,000
1 PARK 13 ZHENGZHOU FANTAWILD WATER PARK, ZHENGZHOU, CHINA -0.5% 905,000 910,000
MALAYSIA
14 SUMMERLAND, TOKYO, JAPAN 5.9% 868,000 820,000
2.2m 9 5 INDONESIA
2 PARKS 16 12
1.7m 15 XIAMEN FANTAWILD WATERPARK, XIAMEN, CHINA 0.6% 832,000 827,000
2 PARKS 16 THE JUNGLE WATER ADVENTURE, BOGOR, WEST JAVA, INDONESIA 0.3% 785,000 783,000
17 PLAYA MAYA WATER PARK, TIANJIN, CHINA 4.2% 750,000 720,000
AUSTRALIA
7
1.1m WOONGJIN PLAYDOCI WATERDOCI, BUCHEON, SOUTH KOREA 4.2% 750,000 720,000
1 PARK 19 LOTTE WATER PARK, GIMHAE, SOUTH KOREA -0.5% 740,000 744,000
20 ADVENTURE COVE WATER PARK, SINGAPORE 1.4% 710,000 700,000
TOP 20 TOTAL ATTENDANCE 2019 21,716,000 20,785,000
TOP 20 ATTENDANCE GROWTH 2018–19 0.5% 21,716,000 21,606,000
© 2020 TEA / AECOM
* Adjustment versus the figure we published in last year’s report
KEY GROWTH Top 20 water parks Asia-Pacific
Top 20 water parks worldwide
Circles represent size of 1010
0.5% 21.7m 21.6m
0%–4.9%
5%–9.9%
attendance at ranked parks at
the geography indicated. Slices 5
10%+
< 0%
within circles represent proportion
of attendance at the geography 0
from the ranked park indicated Top 20 water parks Asia‑Pacific Top 20 water parks Top 20 water parks
by number. Shading indicates -5-5 attendance growth 2018–19 Asia‑Pacific attendance 2019 Asia‑Pacific attendance 2018
attendance growth at the ranked 2010–11 2011–12 2012–13 2013–14 2014–15 2015–16 2016–17 2017–18 2018–19
park versus all other ranked parks.
10.3% 7.4% 6.0% 1.2% 1.0% 5.4% 2.7% 0.7% 0.5%
56 © 2020 TEA / AECOM © 2020 TEA / AECOM 57You can also read