GLOBAL ATTRACTIONS ATTENDANCE REPORT - Themed Entertainment ...
←
→
Page content transcription
If your browser does not render page correctly, please read the page content below
GLOBAL ATTRACTIONS ATTENDANCE REPORT
Cover image:
Chimelong Ocean Kingdom’s Journey
Of Lights Parade — Zhuhai, China
Photo courtesy of Miziker Entertainment

CREDITS

TEA/AECOM 2018 Theme Index and Museum Index: The Global Attractions Attendance Report
Publisher: Themed Entertainment Association (TEA)
Research: Economics practice at AECOM
Editor: Judith Rubin
Producer: Brian Sands
Lead Designer: Matt Timmins
Publication team: Tsz Yin (Gigi) Au, Beth Chang, Michael Chee, Linda Cheu,
Celia Datels, Lucia Fischer, Marina Hoffman, Olga Kondaurova, Kathleen LaClair,
Jodie Lock, Jason Marshall, Sarah Linford, Jennie Nevin, Nina Patel, John Robinett,
Judith Rubin, Brian Sands, Matt Timmins, Feliz Ventura, Chris Yoshii

©2019 TEA/AECOM. All rights reserved.

CONTACTS

For further information about the contents of this report and about
the Economics practice at AECOM, contact the following:

John Robinett                                     Chris Yoshii
Senior Vice President – Economics                 Vice President – Economics, Asia-Pacific
john.robinett@aecom.com                           chris.yoshii@aecom.com
T +1 213 593 8785                                 T +852 3922 9000

Brian Sands, AICP                                 Beth Chang
Vice President / Director – Economics,            Executive Director – Economics,                GLOBAL ATTRACTIONS
Americas
brian.sands@aecom.com
                                                  Asia-Pacific
                                                  beth.chang@aecom.com
                                                                                                 ATTENDANCE REPORT
T +1 202 821 7281                                 T +852 3922 8109                               The definitive annual
Linda Cheu                                        Jodie Lock                                     attendance study for the
Vice President – Economics, Americas              Associate – Economics, Asia-Pacific and EMEA   themed entertainment and
linda.cheu@aecom.com                              jodie.lock@aecom.com
T +1 415 955 2928                                 T +852 3922 9000                               museum industries.
                                                  aecom.com/economics                            Published by the Themed
                                                                                                 Entertainment Association
For information about TEA (Themed Entertainment Association):                                    (TEA) and the Economics
Judith Rubin                                      Jennie Nevin                                   practice at AECOM.
TEA Director of Publications                      TEA Chief Operating Officer
judy@teaconnect.org                               jennie@teaconnect.org
T +1 314 853 5210                                 T +1 818 843 8497

TEAconnect.org
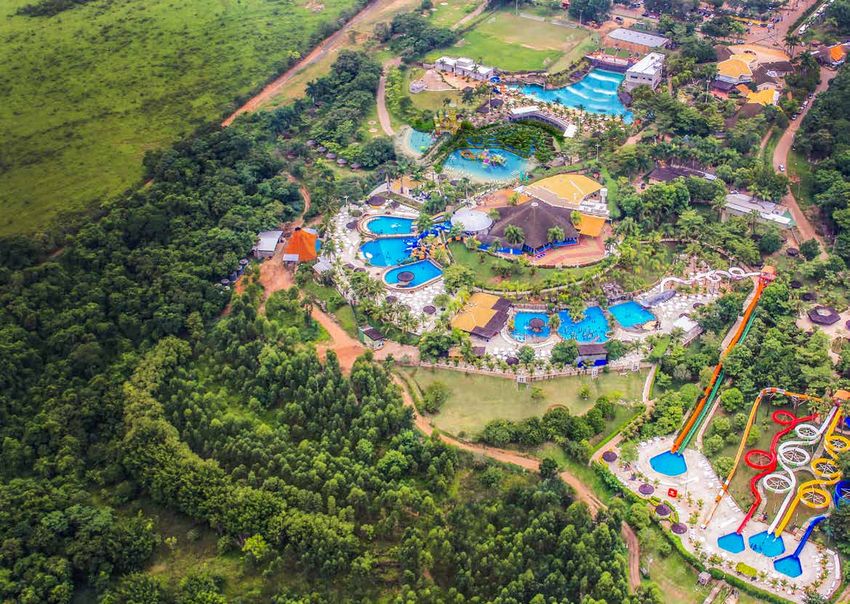
1.9m
    Thermas Water Park,
    São Pedro, Brazil,
    attendance 2018

    CONTENTS
    THE BIG PICTURE                          6
    THE AMERICAS                            22
    ASIA-PACIFIC                            40
    EMEA                                    50
    MUSEUMS                                 62
    OBSERVATION EXPERIENCES                 78
    ABOUT THE STUDY                         86
    FREQUENTLY ASKED QUESTIONS              87

    Thermas Water Park, São Pedro, Brazil
    © Thermas Water Park

4                                                5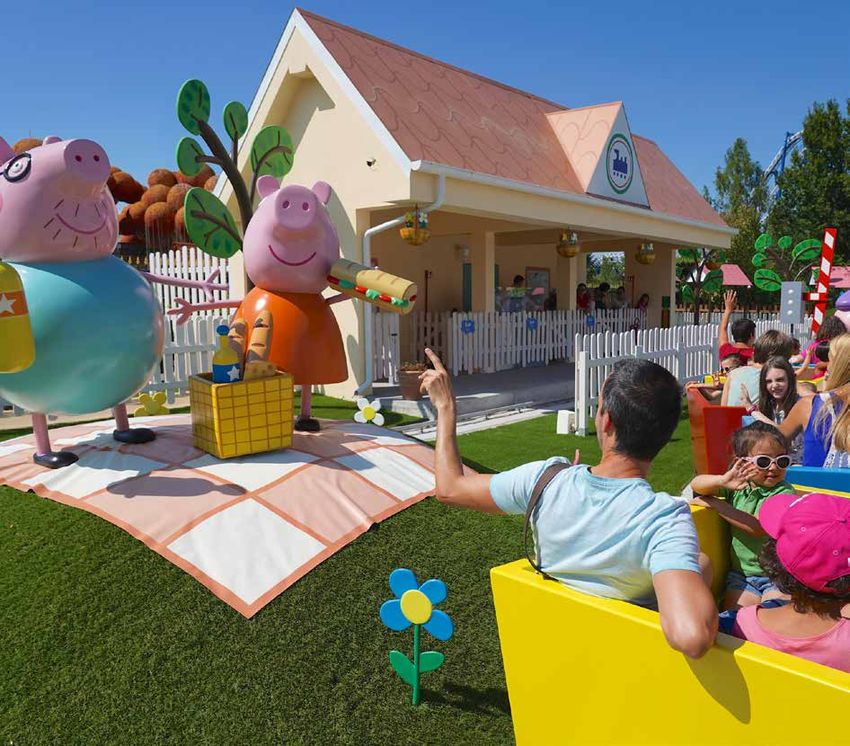
2018 HAS BEEN A
THE BIG PICTURE   5.4%
                  Top 10 theme park                                MILESTONE YEAR FOR THE
                  groups worldwide
                  attendance
                  growth 2017–18
                                                                   THEMED ENTERTAINMENT
                                                                   INDUSTRY
                  501.2m                                           Attendance at themed attractions
                  Top 10 theme park
                  groups worldwide
                                                                   at the major operators has
                  attendance 2018                                  exceeded half a billion visits for
                                                                   the first time in history. This is
                                                                   equivalent to almost 7% of the
                  475.8m                                           world population. And not only that,
                  Top 10 theme park                                but this number keeps growing.
                  groups worldwide
                  attendance 2017
                                                                   Just five years ago, the market
                                                                   capture of the industry was only
                                                                   5% of the global population.
                                                                   —
                                                                   This noteworthy achievement has
                                                                   been accomplished by focused capital
                                                                   investment, technology enhanced products,
                                                                   intellectual property based stories, and
                                                                   destination tourism development.

    JOHN ROBINETT                     7.9%
                                      Tokyo Disneyland at
    Senior Vice President –
                                      Tokyo Disney Resort,
    Economics                         Tokyo, Japan, attendance   Tokyo Disneyland at Tokyo Disney Resort Tokyo, Japan
    —                                 growth 2017–18                                            © Tokyo Disney Resort

6                                                                                                                       7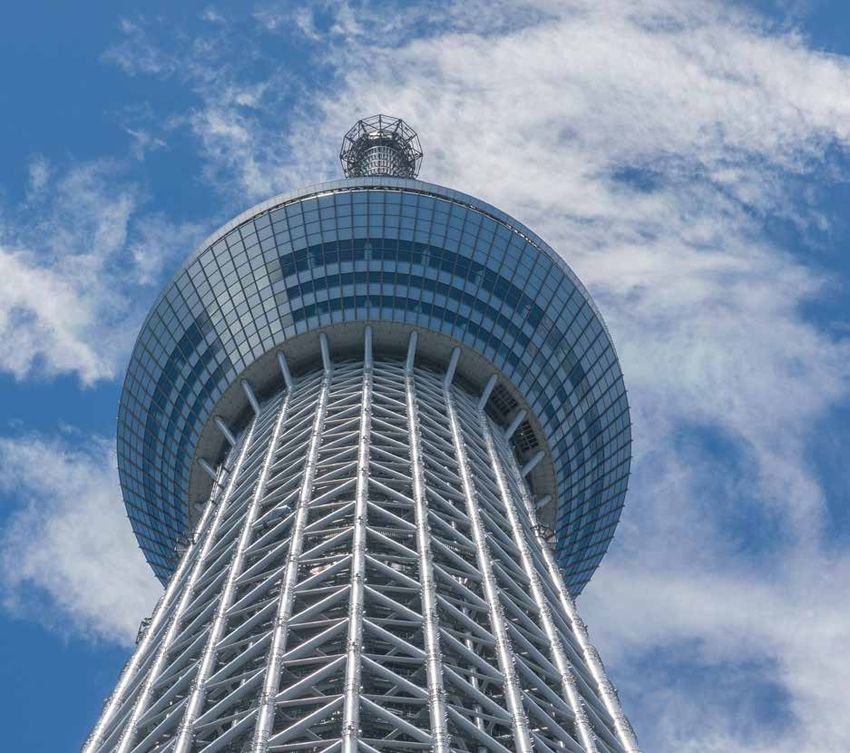
This year also showed strong and steady
    business volume through most regions and
                                                   Honorable mentions are in order this year
                                                   for a number of players including: SeaWorld
                                                                                                       TOP 10
    attraction types. In an unusual alignment,     Parks & Entertainment which turned around           THEME PARK GROUPS
    theme park attendance grew by roughly
    4% in all major markets. Waterparks’
                                                   from a 5% drop last year to an almost 9%
                                                   increase this year; and several individual          WORLDWIDE
    attendance rose at 2.5% globally, with         parks with double digit increases including:

                                                                                                      GROUP NAME

                                                                                                                                                                                                 ATTENDANCE

                                                                                                                                                                                                              ATTENDANCE
    North America at 5.8% and EMEA showing         Chimelong Paradise in Guangzhou, Parque

                                                                                                                                                                                      % CHANGE
    strong growth of 6.7%. The top museums         Warner in Madrid, Parque Xcaret in Mexico,

                                                                                                      RANK

                                                                                                                                                                                                 2018

                                                                                                                                                                                                              2017
    were relatively flat this year.                and Changzhou Dinosaur Park in China.

    We have observed a number of                   Overall, it’s been an outstanding year, as          1 WALT DISNEY ATTRACTIONS                                                     4.9% 157,311,000 150,014,000
    phenomena that have led to this and            the themed entertainment industry has               2 MERLIN ENTERTAINMENTS GROUP                                                 1.5% 67,000,000 66,000,000
    other strong years’ performance in the         matured and been recognized not only
    business. These include the addition of        as a significant driver of international            3 UNIVERSAL PARKS AND RESORTS                                                 1.2% 50,068,000 49,458,000
    second gates, the continued leveraging of      development, economic impact, and                   4 OCT PARKS CHINA                                                            15.1% 49,350,000 42,880,000
    blockbuster IP’s, and the building of resort   tourism, but as a common shared global
    hotels adjacent to park properties.            experience. We’re looking forward to what           5 FANTAWILD                                                                   9.3% 42,074,000 38,495,000
                                                   next year brings with several special new           6 CHIMELONG GROUP                                                             9.6% 34,007,000 31,031,000
                                                   attractions coming on line such as Disney’s
                                                   Star Wars: Galaxy’s Edge, opening in both           7 SIX FLAGS INC.                                                              5.3% 32,024,000 30,421,000*
                                                   California and Florida.                             8 CEDAR FAIR ENTERTAINMENT COMPANY                                            0.7% 25,912,000 25,723,000*
                                                                                                       9 SEAWORLD PARKS & ENTERTAINMENT                                              8.6% 22,582,000 20,798,000*
                                                                                                       10 PARQUES REUNIDOS                                                           1.5% 20,900,000 20,600,000
    18.8%                                                                                               TOP 10 ATTENDANCE GROWTH 2017–18                                             5.4% 501,228,000 475,767,000*
                                                                                                       © 2019 TEA / AECOM
    Parque Warner, Madrid,
    Spain attendance
    growth 2017–18

                                                                                                       * Adjustment versus the figure we published in last year’s report

                                                                                                       5.4%                                         501.2m                      475.8m*
                                                                                                       Top 10 theme park groups                     Top 10 theme park groups    Top 10 theme park groups
                                                                                                       worldwide attendance growth                  worldwide attendance 2018   worldwide attendance 2017
    Parque Warner, Madrid, Spain                                                                       2017–18
    © Parque Warner

8                                                                                                 © 2019 TEA / AECOM                                                                                                       9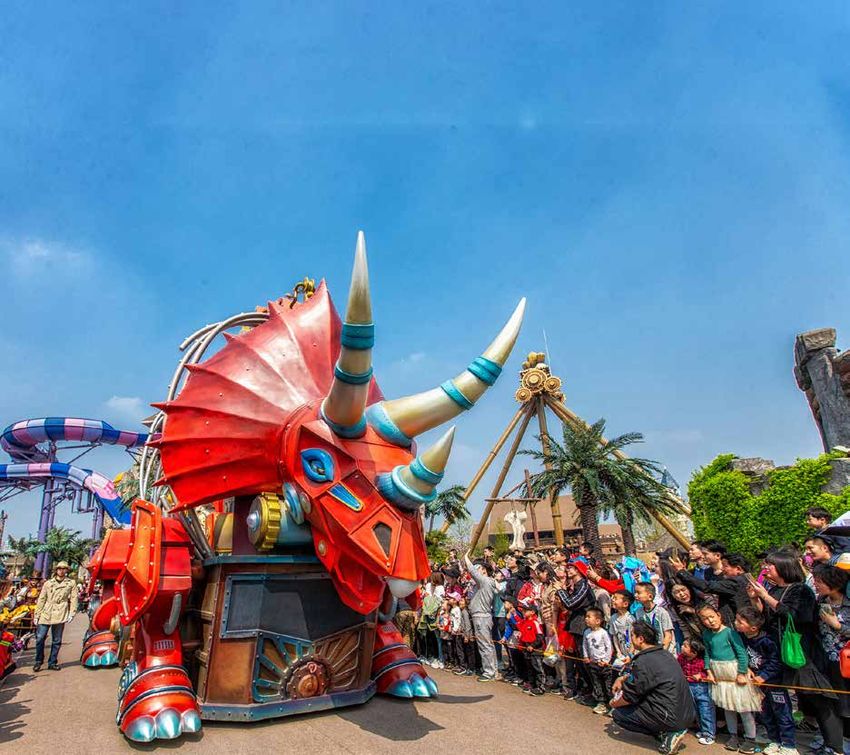
TOP 25
     AMUSEMENT/THEME PARKS
     WORLDWIDE

                                                                                                ATTENDANCE

                                                                                                              ATTENDANCE

                                                                                                                                                                                                                        ATTENDANCE

                                                                                                                                                                                                                                     ATTENDANCE
                                                                                     % CHANGE

                                                                                                                                                                                                        % CHANGE
     LOCATION

                                                                                                                           LOCATION
     RANK

                                                                                                                           RANK
     PARK

                                                                                                                           PARK
                                                                                                2018

                                                                                                              2017

                                                                                                                                                                                                                        2018

                                                                                                                                                                                                                                     2017
     1 MAGIC KINGDOM THEME PARK AT WALT DISNEY WORLD RESORT,                        2.0% 20,859,000 20,450,000             13 DISNEYLAND PARK AT DISNEYLAND PARIS, MARNE-LA-VALLEE, FRANCE             1.9% 9,843,000 9,660,000
       LAKE BUENA VISTA, FL, U.S.
                                                                                                                           14 UNIVERSAL’S ISLANDS OF ADVENTURE THEME PARK AT UNIVERSAL                 2.5% 9,788,000 9,549,000
     2 DISNEYLAND PARK AT DISNEYLAND RESORT, ANAHEIM, CA, U.S.                      2.0% 18,666,000 18,300,000                ORLANDO RESORT, FL, U.S.
     3 TOKYO DISNEYLAND AT TOKYO DISNEY RESORT, TOKYO, JAPAN                        7.9% 17,907,000 16,600,000             15 UNIVERSAL STUDIOS HOLLYWOOD, UNIVERSAL CITY, CA, U.S.                    1.0% 9,147,000 9,056,000
     4 TOKYO DISNEYSEA AT TOKYO DISNEY RESORT, TOKYO, JAPAN                         8.5% 14,651,000 13,500,000             16 HONG KONG DISNEYLAND, HONG KONG SAR                                      8.1% 6,700,000 6,200,000
     5 UNIVERSAL STUDIOS JAPAN, OSAKA, JAPAN                                       -4.3% 14,300,000 14,935,000             17 LOTTE WORLD, SEOUL, SOUTH KOREA                                         -11.2% 5,960,000 6,714,000
     6 DISNEY’S ANIMAL KINGDOM THEME PARK AT WALT DISNEY WORLD RESORT,             10.0% 13,750,000 12,500,000             18 NAGASHIMA SPA LAND, KUWANA, JAPAN                                       -0.2% 5,920,000 5,930,000
       LAKE BUENA VISTA, FL, U.S.
                                                                                                                           19 EVERLAND, GYEONGGI-DO, SOUTH KOREA                                       -7.3% 5,850,000 6,310,000
     7 EPCOT THEME PARK AT WALT DISNEY WORLD RESORT, LAKE BUENA VISTA, FL, U.S.     2.0% 12,444,000 12,200,000
                                                                                                                           20 OCEAN PARK, HONG KONG SAR                                                0.0% 5,800,000 5,800,000
     8 SHANGHAI DISNEYLAND, SHANGHAI, CHINA                                         7.3% 11,800,000 11,000,000
                                                                                                                           21 EUROPA PARK, RUST, GERMANY                                               0.4% 5,720,000 5,700,000
     9 DISNEY’S HOLLYWOOD STUDIOS AT WALT DISNEY WORLD RESORT,                      5.0% 11,258,000 10,722,000
       LAKE BUENA VISTA, FL, U.S.                                                                                          22 DE EFTELING, KAATSHEUVEL, NETHERLANDS                                    4.2% 5,400,000 5,180,000

     10 CHIMELONG OCEAN KINGDOM, HENGQIN, CHINA                                    10.6% 10,830,000 9,788,000              23 WALT DISNEY STUDIOS PARK AT DISNEYLAND PARIS, MARNE-LA-VALLEE, FRANCE    1.9% 5,298,000 5,200,000

     11 UNIVERSAL STUDIOS FLORIDA THEME PARK AT UNIVERSAL ORLANDO RESORT, FL, U.S. 5.0% 10,708,000 10,198,000              24 TIVOLI GARDENS, COPENHAGEN, DENMARK                                      4.5% 4,850,000 4,640,000

     12 DISNEY CALIFORNIA ADVENTURE PARK AT DISNEYLAND RESORT, ANAHEIM, CA, U.S.    3.0% 9,861,000 9,574,000               25 CHIMELONG PARADISE, GUANGZHOU, CHINA                                    11.9% 4,680,000 4,181,000
                                                                                                                            TOP 25 TOTAL ATTENDANCE 2018                                                           251,490,000 243,887,000
                                                                                                                            TOP 25 ATTENDANCE GROWTH 2017–18                                           3.3% 251,990,000 243,926,000
                                                                                                                           © 2019 TEA / AECOM

                                                                                                                           3.3%                                 252.0m                           243.9m
                                                                                                                           Top 25 amusement/theme parks         Top 25 amusement/theme parks     Top 25 amusement/theme parks
                                                                                                                           worldwide attendance growth          worldwide attendance 2018        worldwide attendance 2017
                                                                                                                           2017–18

10                                                                                                 © 2019 TEA / AECOM      © 2019 TEA / AECOM                                                                                                     11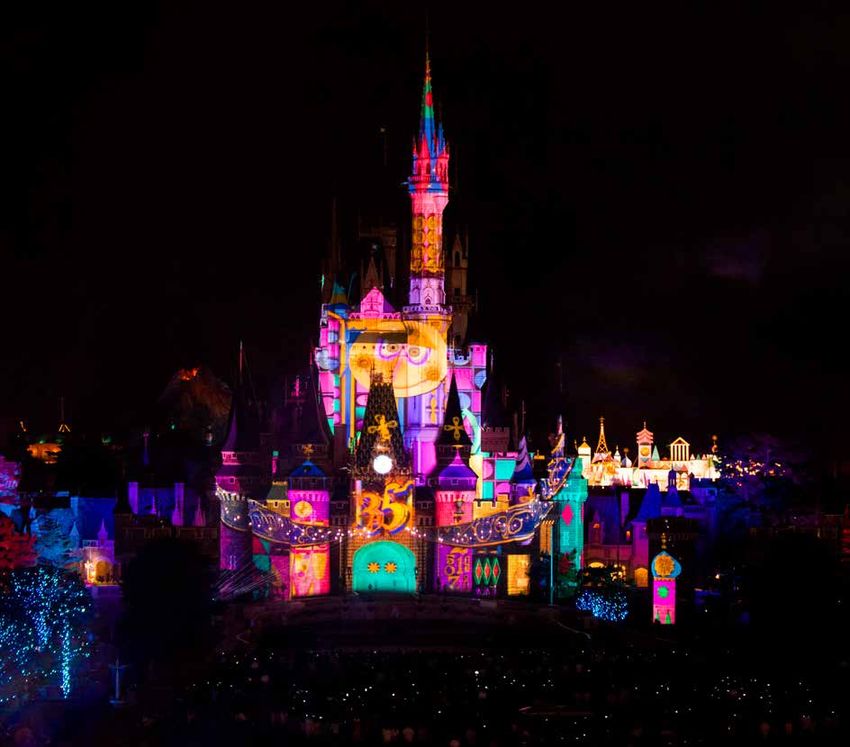
TOP 25
AMUSEMENT/THEME PARKS
WORLDWIDE
DENMARK
NETHERLANDS
5.4m
24 4.9m SOUTH KOREA
1 PARK
22
1 PARK 18 17 11.9m
2 PARKS
GERMANY
FRANCE 21
5.7m 25 18
15
15.1m 23
13 1 PARK
CHINA 3 JAPAN
CALIFORNIA, U.S.
37.7m 2
2 PARKS 27.2m 10
8
5 52.8m
3 PARKS 4 PARKS
3 PARKS 4
12
HONG KONG
20 16 12.5m
14 2 PARKS
1
11
FLORIDA, U.S.
78.8m
6 PARKS
9 6
7
MAP KEY GROWTH Top 25 theme/amusement parks worldwide
Top 20 water parks worldwide
Circles represent size of 1010
3.3% 252.0m 243.9m
0%–4.9%
5%–9.9%
attendance at ranked parks at
the geography indicated. Slices 5
10%+
< 0%
within circles represent proportion
of attendance at the geography 0
from the ranked park indicated Top 25 amusement/theme parks Top 25 amusement/theme parks Top 25 amusement/theme parks
by number. Shading indicates -5-5 worldwide attendance growth worldwide attendance 2018 worldwide attendance 2017
attendance growth at the ranked 2010–11 2011–12 2012–13 2013–14 2014–15 2015–16 2016–17 2017–18 2017–18
park versus all other ranked parks. 3.8% 5.2% 4.3% 4.1% 5.4% -1.1% 4.7% 3.3%
12 © 2019 TEA / AECOM © 2019 TEA / AECOM 13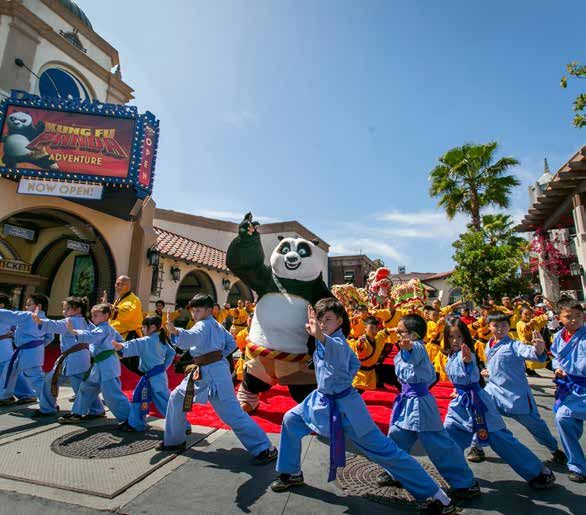
TOP 20
WATER PARKS
WORLDWIDE
ATTENDANCE
ATTENDANCE
ATTENDANCE
ATTENDANCE
% CHANGE
% CHANGE
LOCATION
LOCATION
RANK
RANK
PARK
PARK
2018
2017
2018
2017
1 CHIMELONG WATER PARK, GUANGZHOU, CHINA 1.9% 2,740,000 2,690,000 10 AQUAVENTURE WATER PARK, DUBAI, U.A.E. 3.5% 1,397,000 1,350,000
2 TYPHOON LAGOON WATER PARK AT WALT DISNEY WORLD RESORT, ORLANDO, FL, U.S. 5.0% 2,271,000 2,163,000 11 WUHU FANTAWILD WATER PARK, WUHU, CHINA 13.3% 1,360,000 1,200,000
3 DISNEY’S BLIZZARD BEACH WATER PARK AT WALT DISNEY WORLD RESORT, 3.0% 2,003,000 1,945,000 12 KAIFENG YINJI WATER PARK, KAIFENG, CHINA 3.8% 1,350,000 1,300,000
ORLANDO, FL, U.S.
13 SUNWAY LAGOON, KUALA LUMPUR, MALAYSIA 0.0% 1,300,000 1,300,000
4 PARQUE AQUÁTICO THERMAS DOS LARANJAIS, OLIMPIA, BRAZIL -1.8% 1,971,000 2,007,000
14 AQUAPALACE, PRAGUE, CZECH REPUBLIC 6.0% 1,288,000 1,215,000
5 AQUAVENTURE ATLANTIS BAHAMAS WATERPARK, PARADISE ISLAND, BAHAMAS 0.0% 1,831,000 1,831,000
15 OCEAN WORLD, GANGWON-DO, SOUTH KOREA -5.0% 1,264,000 1,330,000
6 VOLCANO BAY WATER THEME PARK AT UNIVERSAL ORLANDO RESORT, 15.0% 1,725,000 1,500,000
ORLANDO, FL, U.S. 16 SIAM PARK, SANTA CRUZ DE TENERIFE, SPAIN 0.1% 1,210,000 1,209,000
7 AQUATICA ORLANDO, ORLANDO, FL, U.S. 8.5% 1,556,000 1,434,000* 17 CARIBBEAN BAY, GYEONGGI-DO, SOUTH KOREA -13.0% 1,200,000 1,380,000
8 THERME ERDING, ERDING, GERMANY 13.6% 1,500,000 1,320,000 SHENYANG ROYAL OCEAN PARK — WATER WORLD, FUSHUN, CHINA 0.0% 1,200,000 1,200,000
9 HOT PARK RIO QUENTE, CALDAS NOVAS, BRAZIL -3.2% 1,433,000 1,481,000 TROPICAL ISLANDS, KRAUSNICK, GERMANY 2.7% 1,200,000 1,168,000
20 WET 'N' WILD GOLD COAST, GOLD COAST, AUSTRALIA -5.1% 1,120,000 1,180,000
TOP 20 TOTAL ATTENDANCE 2018 30,919,000 30,203,000
TOP 20 ATTENDANCE GROWTH 2017–18 2.5% 30,919,000 30,155,000
© 2019 TEA / AECOM
* Adjustment versus the figure we published in last year’s report
2.5% 30.9m 30.2m
Top 20 water parks worldwide Top 20 water parks worldwide Top 20 water parks worldwide
attendance growth 2017–18 attendance 2018 attendance 2017
14 © 2019 TEA / AECOM © 2019 TEA / AECOM 15
TOP 20
WATER PARKS
WORLDWIDE
17 15 SOUTH KOREA
GERMANY CZECH REPUBLIC 2.5m
2 PARKS
2.7m 17 8 14 1.3m
7 U.S. 2 PARKS 1 PARK
2 17
7.6m CHINA
6 4 PARKS CANARY ISLANDS, SPAIN 6.7m 1
3
BAHAMAS
1.2m 16 4 PARKS
12
11
1 PARK 10
5
1.8m
1 PARK
U.A.E.
1.4m MALAYSIA
1 PARK 1.3m 13
1 PARK
BRAZIL
9 4 3.4m
2 PARKS
AUSTRALIA
20 1.1m
1 PARK
MAP KEY GROWTH Top 20 water parks worldwide
Top 25 theme/amusement parks worldwide
Circles represent size of 1010
2.5% 30.9m 30.2m
0%–4.9%
5%–9.9%
attendance at ranked parks at
the geography indicated. Slices 5
10%+
< 0%
within circles represent proportion
of attendance at the geography 0
from the ranked park indicated Top 20 water parks worldwide Top 20 water parks worldwide Top 20 water parks worldwide
by number. Shading indicates -5-5 attendance growth 2017–18 attendance 2018 attendance 2017
attendance growth at the ranked 2010–11 2011–12 2012–13 2013–14 2014–15 2015–16 2016–17 2017–18
park versus all other ranked parks. 8.2% 5.4% 7.1% 2.8% 3.7% 3.6% 1.6% 2.5%
16 © 2019 TEA / AECOM © 2019 TEA / AECOM 17
TOP 20
     MUSEUMS
     WORLDWIDE

                                                                                  ATTENDANCE

                                                                                                     ATTENDANCE

                                                                                                                                                                                                      ATTENDANCE

                                                                                                                                                                                                                      ATTENDANCE
                                                                                                     FREE/PAID

                                                                                                                                                                                                                      FREE/PAID
                                                                    % CHANGE

                                                                                                                                                                                       % CHANGE
     LOCATION

                                                                                                                    LOCATION
     MUSEUM

                                                                                                                    MUSEUM
     RANK

                                                                                                                    RANK
                                                                                  2018

                                                                                                     2017

                                                                                                                                                                                                      2018

                                                                                                                                                                                                                      2017
     1 LOUVRE, PARIS, FRANCE                                     25.9% 10,200,000                8,100,000          11 NATIONAL MUSEUM OF NATURAL HISTORY, WASHINGTON, DC, U.S.     -20.0%         4,800,000       6,000,000
     2 NATIONAL MUSEUM OF CHINA, BEIJING, CHINA                    6.8%        8,610,000         8,063,000          12 NATIONAL GALLERY OF ART, WASHINGTON, DC, U.S.                -15.8%         4,404,000       5,232,000
     3 THE METROPOLITAN MUSEUM OF ART, NEW YORK, NY, U.S.          5.1%        7,360,000          7,000,000         13 CHINA SCIENCE TECHNOLOGY MUSEUM, BEIJING, CHINA               10.5%         4,400,000       3,983,000
     4 VATICAN MUSEUMS, VATICAN, VATICAN CITY                      5.1%        6,756,000          6,427,000         14 STATE HERMITAGE, ST PETERSBURG, RUSSIA                         1.8%         4,294,000       4,220,000
     5 NATIONAL AIR AND SPACE MUSEUM, WASHINGTON, DC, U.S.       -11.4%        6,200,000          7,000,000         15 ZHEJIANG MUSEUM, HANGZHOU, CHINA                             14.4%          4,200,000       3,670,000
     6 BRITISH MUSEUM, LONDON, U.K.                                3.8%        5,869,000         5,656,000          16 VICTORIA & ALBERT MUSEUM, LONDON, U.K.                         4.7%         3,968,000       3,790,000
     7 TATE MODERN, LONDON, U.K.                                  -1.3%        5,829,000          5,907,000         17 REINA SOFÍA, MADRID, SPAIN                                     0.0%         3,898,000       3,897,000
     8 NATIONAL GALLERY, LONDON, U.K.                              9.7%        5,736,000          5,229,000         18 NATIONAL PALACE MUSEUM (TAIWAN), TAIPEI, TAIWAN              -13.0%         3,860,000       4,436,000
     9 NATURAL HISTORY MUSEUM, LONDON, U.K.                       17.8%        5,226,000         4,435,000          19 NATIONAL MUSEUM OF AMERICAN HISTORY, WASHINGTON, DC, U.S.      0.0%         3,800,000       3,800,000
     10 AMERICAN MUSEUM OF NATURAL HISTORY, NEW YORK, NY, U.S.     0.0%        5,000,000         5,000,000          20 NANJING MUSEUM, NANJING, CHINA                                11.2%         3,670,000       3,300,000
                                                                                                                     TOP 20 TOTAL ATTENDANCE 2018                                                 108,080,000 105,145,000
                                                                                                                     TOP 20 ATTENDANCE GROWTH 2017–18                                0.1% 108,080,000 107,967,000
                                                                                                                    © 2019 TEA / AECOM

                                                                                                                    0.1%                                 108.1m                     108.0m
                                                                                                                    Top 20 museums worldwide             Top 20 museums worldwide   Top 20 museums worldwide
                                                                                                                    attendance growth 2017–18            attendance 2018            attendance 2017

18                                                                                             © 2019 TEA / AECOM   © 2019 TEA / AECOM                                                                                             19
TOP 20
MUSEUMS
WORLDWIDE
U.K. 16 6
26.6m 9
5 MUSEUMS 7
8 RUSSIA
14 4.3m
1 MUSEUM
FRANCE
19 3 10.2m 1
VATICAN CITY
20
12 U.S. 1 MUSEUM 4
6.8m CHINA
20.9m
31.6m 17 1 MUSEUM 15
2
4 MUSEUMS
11 5 6 MUSEUMS 13
10
SPAIN TAIWAN
3.9m 18 3.9m
1 MUSEUM 1 MUSEUM
MAP KEY GROWTH Top 20 museums worldwide
Circles represent size of 10 10
0.1% 108.1m 108.0m
0%–4.9%
5%–9.9%
attendance at ranked parks at
the geography indicated. Slices 5
10%+
< 0%
within circles represent proportion
of attendance at the geography 0
from the ranked museum Top 20 museums worldwide Top 20 museums worldwide Top 20 museums worldwide
indicated by number. Shading -5 -5 attendance growth 2017–18 attendance 2018 attendance 2017
indicates attendance growth at 2012–13 2013–14 2014–15 2015–16 2016–17 2017–18
the ranked museum versus all 7.2% 1.6% -0.7% 1.2% 0.2% 0.1%
other ranked museums.
20 © 2019 TEA / AECOM © 2019 TEA / AECOM 21THE AMERICAS Theme parks
4.0% BIG GROWTH IS
Top 20 amusement/
theme parks North
America attendance IP-DRIVEN
growth 2017–18
Attendance at the Top 20 North
American Theme Parks grew by
157.5m 4% overall in 2018, a substantial
Top 20 amusement/ increase for this mature market,
theme parks North
America attendance
representing growth of 6.1 million
2018 visits. This was notably higher
than the previous two years’
increases (2.3% in 2017 and 1.2%
151.4m in 2016).
Top 20 amusement/ —
theme parks North
America attendance The increase of more than 6 million
2017
visits at North American parks was led
by growth among top operators Disney,
Universal and SeaWorld, with particularly
good performance from Disney’s
Animal Kingdom, SeaWorld Orlando and
SeaWorld San Diego, Disney’s Hollywood
Studios, and Universal Studios in Florida.
The Six Flags chain also showed increases
for 2018, largely driven by the acquisition
of five new parks bringing about 2 million
in additional attendance.
The biggest growth is IP-driven. Innovative
experiences, rides and programming are
also important drivers. The big players are
BRIAN SANDS in a position to command the big IP. They
have full awareness to the power of these
Vice President / Director – franchises and to what good, creative
Economics, Americas use of IP in a storytelling environment —
— made immersive with state-of-the-art
technology — enables them to do.
KATHLEEN LACLAIR
Associate Principal –
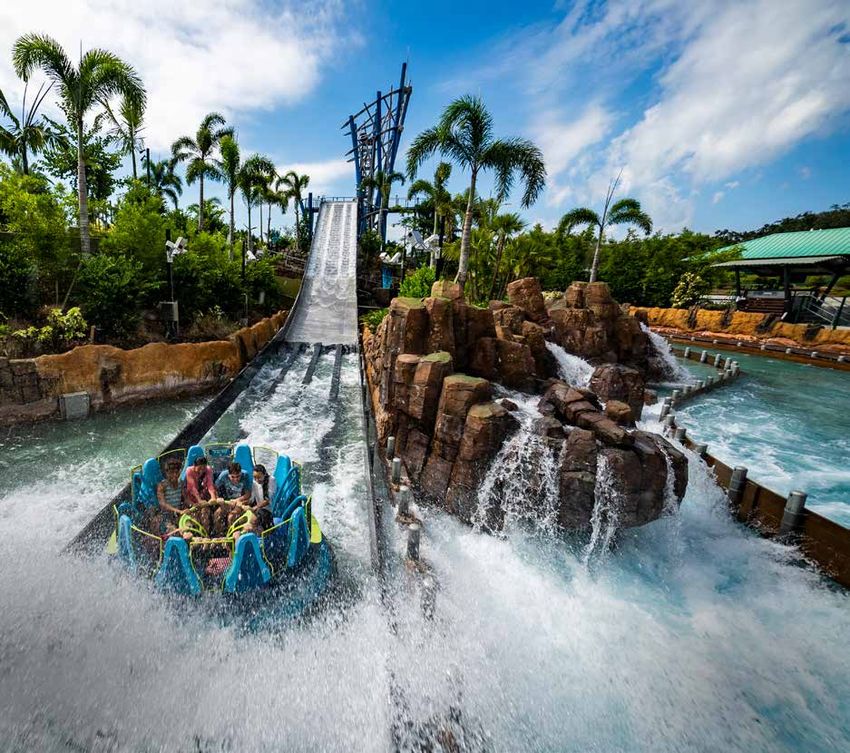
16.0%
SeaWorld Orlando, FL,
Economics, Americas U.S., attendance growth SeaWorld Orlando, FL, U.S.
— 2017–18 © SeaWorld Orlando
22 23Disney and Universal Looking ahead, we can expect that next
For the biggest operators, even a modest year’s numbers will likely show massive 9.1m
year-over-year increase represents a lot of attendance impact for Disney in North Universal Studios
visitation, as evidenced by what our charts America, from the 2019 openings of Star Hollywood, Universal
show for Disney and Universal parks in Wars: Galaxy’s Edge at Disneyland in City, CA, U.S.,
attendance 2018
Florida and California. May and at Walt Disney World in August.
Attendance at Disney’s Typhoon Lagoon
Speaking of big IPs, since first bringing the and Blizzard Beach water parks bounced
Avatar IP to life on the theme park platform back in 2018 after a decline in 2017
in May 2017 at Disney’s Animal Kingdom attributed to poor weather — these water
(Orlando), Pandora — The World of Avatar parks continue to be the most visited in
continued to be a strong attendance driver North America.
in 2018. Toy Story Land, the latest iteration
of which opened at Disney’s Hollywood Universal Studios parks in North America
Studios in June 2018, was another driver. earned modest attendance increases
The Toy Story franchise continues to overall in 2018, with the biggest growth at
capture a new generation of children every Volcano Bay, Universal’s new water theme
time a new movie comes out while older park, open since May 2017 and recipient of
fans stay fans. a TEA Thea Award in 2019.
18.7m Kung Fu Panda, Universal Studios
Disneyland Park, Hollywood, Universal City, CA, U.S.
Anaheim, CA, U.S., © Universal Studios Hollywood
attendance 2018
In Orlando, Universal is continuing to
build, having acquired new real estate
and with a new gate, new land, and
Nintendo theming among the coming
developments at Universal Studios Florida
as the area rebounds from tourism lost
due to hurricanes in 2017. In Universal
City, California, attendance growth at
XX.X% Universal Studios Hollywood was about 1%,
attributable to overall growth of the market
Park Name, Location,
attendance growth supported by reinvestment such as the
2017–18
Pixar Play Parade, Disneyland Park,
park’s new Kung Fu Panda attraction.
Disneyland Resort, Anaheim, CA, U.S.
©Name,
Park Joshua Sudock/Disneyland Resort
Location
© Copyright
24 25SeaWorld SeaWorld’s good performance is This trend has enabled the high levels
SeaWorld parks had been moving creditable to investments in new rides and of investment we’re now seeing and will
down our charts for several years but programming and leveraging the Sesame continue to see as operators mine the
2018 attendance numbers show a nice Street IP, in addition to working actively to riches of their IP and creatives explore the THERE WILL BE MORE, GREAT
comeback with room for more regrowth. change the conversation about the parks possibilities of available technology. There AND GAME-CHANGING, NEW OUT-
Globally — referencing our Top 25 Theme — internally and externally — and making will be more, great and game-changing, new
Park Groups Worldwide chart — SeaWorld other positive changes. out-of-home guest experiences coming our
OF-HOME GUEST EXPERIENCES
2018 attendance ranks below that of way. The big parks have the resources to COMING OUR WAY. THE BIG PARKS
North American regional chains Six Flags Staying competitive: IP, immersion create and deliver experiences people can’t HAVE THE RESOURCES TO CREATE
and Cedar Fair, but more change is in the and expansion get at home. And it’s important to note that AND DELIVER EXPERIENCES
wind as SeaWorld starts to become an The level of immersion that our industry immersive environments aren’t just about
international brand. is now able to deliver is other-worldly, what you do — they’re also elaborate photo
PEOPLE CAN’T GET AT HOME.
thanks to digital technology. The past few backdrops, providing guests with settings
The 2018 SeaWorld Parks attendance years have seen Universal and Disney that facilitate their online personae.
figures recoup the previous year’s decline each roll out unique, super-rich IP-based
and surpass it, helped by significant environments, in the form of the Harry That said, everyone is paying attention to Or will regional parks note the Meow Wolf
increases at SeaWorld Orlando and Potter worlds (Universal) and Avatar realm the dramatic growth of the video games model and bring in the local art collective
SeaWorld San Diego as well as a modest (Disney), whose tremendous success has industry along with the rise of competitive instead? We’ve seen that happen recently
increase at Busch Gardens Tampa. reset the entire industry. Looking forward, video gaming/esports as an industry, and at Elitch Gardens and spark a lot of interest
Disney’s soon-to-open Star Wars: Galaxy’s the power of both. Fortnite is a compelling on social media and mainstream media.
Edge lands are expected to take things to a example of a gaming platform that’s also a Emphasizing the flavor of one’s particular
whole new level of immersion. social platform. But parks have the ability region can be a powerful differentiator, and
to deliver shared, real-world immersive North American regional parks could do
experiences with broad appeal, and are well to take a page from European parks’
collaborating with IP owners to leverage success on that front.
multi-channel marketing.
SeaWorld San Diego, CA, U.S.
Expansion, hospitality and season passes
20.1% © SeaWorld San Diego
Regionality are all methods of increasing attendance.
SeaWorld San Diego, For smaller parks to also serve up magically Adding a second gate and adding hotels
CA, U.S., attendance immersive experiences is more within reach transform a park into a resort and a day
growth 2017–18 than it was 20 years ago — or even five trip into a longer stay. The recent Six Flags
years ago—because of the accessibility acquisitions have been part of a strategy to
of technology. The big question is, what add existing water parks located near the
IPs will they have access to? However, we chain’s existing theme parks. Giving guests
do see operators other than Disney and the option to buy a multi-park pass that lets
Universal working with the IP model: Cedar them enjoy two different experiences in the
Fair and Snoopy (Peanuts), SeaWorld and same metro area encourages the overnight
Sesame Street, Six Flags and DC Comics. stay and gives people more things to do.
The challenges to do so include making
licensing arrangements with the IP holder,
which can be costly, and all the subsequent
steps of creating the built environment and
experience that are true to the IP.
26 27LATIN AMERICA Along the coast near Cancun, Mexico’s
Grupo Xcaret is one for all regional
Water parks
AND MEXICO — A operators to watch and learn from, as
it has continued to grow its signature
NORTH AMERICA:
SUCCESS COMES FROM
LOCALIZED FOCUS innovative offerings and attendance,
year over year. In terms of sophisticated,
UNDERSTANDING THOSE BETTER WEATHER AND
The top theme parks in Latin America
regional authenticity and consistency
this operator is outstanding, knowing
MARKETS AND SERVING
THEM WITH UNIQUE,
BETTER NUMBERS
enjoyed aggregate attendance growth of and serving local and residential tourist
more than 4%, which is excellent. As with markets, in naturalistic settings with water
TAILORED EXPERIENCES It’s heartening to see that the 2018 water
North America, this growth is partly due to features and historical and geological THAT PLAY TO THE REGION’S park attendance numbers show recovery
recovery from the prior year’s bad weather elements. Each is within driving distance of UNIQUE CHARACTER. and then some from the weather-related dip
(the numbers were down by 2% in 2017), the others,and offered on a standalone or of the previous year. The top North American
and partly a testament to the benefits package basis. Each is a unique, picturesque water parks showed attendance growth of
of reinvesting and season extension. An park or experience with its own identity In the Mexico City area, Six Flags México and nearly 6% for 2018. Some parks benefited
unfortunate exception is Hopi Hari, which and mix of activities, including cultural La Feria de Chapultepec both prosper by from substantial increases, reflecting new
in the past held a high ranking but recently programs, historic components, underwater making the most of serving residential and attractions as well as recovery from the
spiraled into bankruptcy and slipped off the cave swimming, luxurious dining on a lake, regional markets with earmarks of regional previous year’s weather including Zoombezi
list of top theme parks in Latin America. swimming with dolphins and more. Two culture that look and feel authentic. Bay (Powell, OH), Typhoon Texas, Adventure
hotels are now part of the Xcaret mix, located Island in Tampa and Splish Splash (Calverton,
Parks in these regions cater primarily to adjacent to Parque Xcaret, pushing its In Bogota, Salitre Mágico extends its NY). Reinvestment helped in addition to
residents and domestic tourists. Success attendance up by a remarkable 25%. This calendar with the Festival of Terror, a scare better weather: Typhoon Texas added three
comes from understanding those markets exemplifies regionally tailored, multi-gate, experience featuring sinister clowns. new pools and Splish Splash added two new
and serving them with unique, tailored multi-day destination resort development at Outside Bogota, Parque del Café is themed rides. Disney’s Orlando water parks Typhoon
experiences that play to the region’s its best. on coffee. Fantasilandia has extended its Lagoon and Blizzard Beach retained their
unique character. operating season. positions at the top.
7.9%
Typhoon Texas
Waterpark, Katy,
TX, U.S., attendance
growth 2017–18
6.4%
Parque del Café,
Quindio, Colombia,
attendance growth Parque del Café, Quindio, Colombia Typhoon Texas Waterpark, Katy, Texas, U.S.
2017–18 © Parque del Café © Typhoon Texas
28 29Universal’s Volcano Bay, a unique
Zoombezi Bay, Powell, OH, U.S.
newcomer settling into its market, drew
excellent attendance, up 15% versus its 13.5% © Grahm S. Jones, Columbus Zoo and Aquarium
first year. As a separate-gate offering, SUCCESS COMES WHEN OPERATORS Zoombezi Bay,
Volcano Bay is a valuable addition to Powell, OH, U.S.,
Universal’s continued expansion and HAVE A CLEAR SENSE OF THEIR attendance growth
diversification of its Orlando property as a MARKETS AND HOW TO SERVE THEM 2017–18
destination resort. WITH GOOD OPERATIONS AND, OF
Under the SeaWorld umbrella, Aquatica
COURSE, SMART REINVESTMENT
in Orlando bounced back with visitation
growth of about 125,000. Recently
repositioned as a second gate to SeaWorld
San Antonio, the Aquatica park in that city
also did well in 2018.
LATIN AMERICA: NEW In São Pedro, Thermas Water Park has
shown significant attendance growth for
TRENDS AND PLAYERS the past two years (more than 18% in 2017
and more than 22% in 2018). The park Chongqing Happy Valley
The top water parks in Latin America had added nearly 500 rooms with its new hotel/ © OCT
essentially flat attendance in 2018, with vacation club property that opened in late
up and down fluctuations and some parks 2017 and has further strengthened its
making their first appearance on the list. position through reinvestment and growing
its market via strategic alliances with
In Olimpia, Brazil, Parque Aquático – national tourism agencies.
Thermas dos Laranjais attendance
numbers were down by nearly 2% for 2018. Wet ‘n Wild São Paolo posted a modest 0.5m
The park maintained its first-place position increase of about 5%. This water park, which Hot Beach, Olimpia,
on our list of the Top 10 Water Parks in serves the same market as did Hopi Hari Brazil, attendance
Latin America and is in fourth place on before the latter collapsed, reinvested with a 2018
our list of Top 20 Water Parks Worldwide; new ride and new drop slide. Numbers were
however, it faces new competition from relatively flat for Piscilago (Bogota), Parque
nearby Hot Beach, which recently zoomed Acuático Xocomil (Guatemala) and El Rollo
onto the scene and has changed the local Parque Acuatico (Mexico).
landscape. Parque Aquático – Thermas dos
Laranjais — a massive, busy property — Ups and downs in the water park sector
has enjoyed a large market share for many generally can be traced to weather,
years with its low- to mid-priced offerings economic and/or political situations,
targeted to guests who primarily visit by reinvestment or lack thereof, and
automobile from São Paulo. Hot Beach challenges from the competition. Success
has differentiated itself and shown there’s comes when operators have a clear sense
a market among upper-middle-class air of their markets and how to serve them
travelers, who also avail themselves of the with good operations and, of course,
park’s integrated hotels, also higher-end smart reinvestment.
than Thermas’ adjoining hotel towers.
Hot Beach, Olimpia, Brazil
© Hot Beach
30 31TOP 20
AMUSEMENT/THEME PARKS
NORTH AMERICA
ATTENDANCE
ATTENDANCE
% CHANGE
LOCATION
RANK
PARK
2018
2017
1 MAGIC KINGDOM THEME PARK AT WALT DISNEY WORLD RESORT, LAKE BUENA VISTA, FL, U.S. 2.0% 20,859,000 20,450,000
2 DISNEYLAND PARK AT DISNEYLAND RESORT, ANAHEIM, CA, U.S. 2.0% 18,666,000 18,300,000
3 DISNEY’S ANIMAL KINGDOM THEME PARK AT WALT DISNEY WORLD RESORT, 10.0% 13,750,000 12,500,000
LAKE BUENA VISTA, FL, U.S.
4 EPCOT THEME PARK AT WALT DISNEY WORLD RESORT, LAKE BUENA VISTA, FL, U.S. 2.0% 12,444,000 12,200,000
5 DISNEY’S HOLLYWOOD STUDIOS AT WALT DISNEY WORLD RESORT, 5.0% 11,258,000 10,722,000
LAKE BUENA VISTA, FL, U.S.
6 UNIVERSAL STUDIOS FLORIDA THEME PARK AT UNIVERSAL ORLANDO RESORT, FL, U.S. 5.0% 10,708,000 10,198,000
ONTARIO, CANADA 7 DISNEY CALIFORNIA ADVENTURE PARK AT DISNEYLAND RESORT, ANAHEIM, CA, U.S. 3.0% 9,861,000 9,574,000
3.8m 13 8 UNIVERSAL’S ISLANDS OF ADVENTURE THEME PARK AT UNIVERSAL 2.5% 9,788,000 9,549,000
1 PARK ORLANDO RESORT, FL, U.S.
MIDWEST U.S. 20 9 UNIVERSAL STUDIOS HOLLYWOOD, UNIVERSAL CITY, CA, U.S. 1.0% 9,147,000 9,056,000
10.3m 17
15
NORTHEAST U.S. 10 SEAWORLD ORLANDO, ORLANDO, FL, U.S. 16.0% 4,594,000 3,962,000
3 PARKS 19 18 6.8m 11 BUSCH GARDENS TAMPA BAY, TAMPA, FL, U.S. 4.5% 4,139,000 3,961,000
2 PARKS
12 KNOTT'S BERRY FARM, BUENA PARK, CA, U.S. 2.0% 4,115,000 4,034,000
13 CANADA'S WONDERLAND, MAPLE, ONTARIO, CANADA 1.0% 3,798,000 3,760,000
14 SEAWORLD SAN DIEGO, SAN DIEGO, CA, U.S. 20.1% 3,723,000 3,100,000
15 CEDAR POINT SHORES WATERPARK, SANDUSKY, OH, U.S. 2.0% 3,676,000 3,604,000
14 16
CALIFORNIA, U.S. 12 16 SIX FLAGS MAGIC MOUNTAIN, VALENCIA, CA, U.S. 2.6% 3,592,000 3,500,000*
2 10 11 1
49.1m 8
FLORIDA, U.S.
17 KINGS ISLAND, KINGS ISLAND, OH, U.S. 0.5% 3,486,000 3,469,000
6 PARKS
9 18 SIX FLAGS GREAT ADVENTURE, JACKSON, NJ, U.S. 0.0% 3,400,000 3,400,000*
7
6
87.5m 19 HERSHEYPARK, HERSHEY, PA, U.S. 2.0% 3,367,000 3,301,000
8 PARKS
3 20 SIX FLAGS GREAT AMERICA, GURNEE, IL, U.S. 0.0% 3,107,000 3,107,000*
5 4
TOP 20 TOTAL ATTENDANCE 2018 157,478,000 151,747,000
TOP 20 ATTENDANCE GROWTH 2017–18 4.0% 157,478,000 151,380,000
© 2019 TEA / AECOM
* Adjustment versus the figure we published in last year’s report
KEY GROWTH Top 20 parks North America
Top 25 parks worldwide
Circles represent size of 10 10
4.0% 157.5m 151.4m
0%–4.9%
5%–9.9%
attendance at ranked parks at
the geography indicated. Slices 5
10%+
< 0%
within circles represent proportion
of attendance at the geography 0
from the ranked park indicated Top 20 amusement/theme Top 20 amusement/theme Top 20 amusement/theme
by number. Shading indicates -5 -5 parks North America parks North America parks North America
attendance growth at the ranked 2010–11 2011–12 2012–13 2013–14 2014–15 2015–16 2016–17 2017–18 attendance growth 2017–18 attendance 2018 attendance 2017
park versus all other ranked parks.
2.9% 3.6% 2.7% 2.2% 5.9% 1.2% 2.3% 4.0%
32 © 2019 TEA / AECOM © 2019 TEA / AECOM 33TOP 10
AMUSEMENT/THEME PARKS
LATIN AMERICA
ATTENDANCE
ATTENDANCE
% CHANGE
LOCATION
RANK
PARK
2018
2017
1 SIX FLAGS MÉXICO, MEXICO CITY, MEXICO 2.0% 2,789,000 2,734,000*
2 BETO CARRERO WORLD, SANTA CATARINA, BRAZIL 3.7% 2,200,000 2,122,000
3 PARQUE XCARET, CANCUN, MEXICO 25.2% 1,885,000 1,505,000
MEXICO 6
7.5m 4
3
1 4 LA FERIA DE CHAPULTEPEC, MEXICO CITY, MEXICO
5 MUNDO PETAPA, GUATEMALA CITY, GUATEMALA
0.1%
-1.0%
1,593,000 1,591,000
1,226,000 1,239,000
4 PARKS
6 PARQUE PLAZA SÉSAMO, MONTERREY, MEXICO -1.0% 1,185,000 1,197,000
GUATEMALA
7 PARQUE MUNDO AVENTURA, BOGOTÁ, COLOMBIA 0.4% 1,158,000 1,153,000
1.2m 5 COLOMBIA
1 PARK
10 7
9 3.1m 8 FANTASIALANDIA, SANTIAGO, CHILE
9 PARQUE DEL CAFÉ, QUINDIO, COLOMBIA
4.8%
6.4%
1,100,000 1,050,000
1,028,000 966,000
3 PARKS
10 SALITRE MÁGICO, BOGOTÁ, COLOMBIA 18.4% 900,000 760,000
TOP 10 TOTAL ATTENDANCE 2018 15,064,000 14,317,000
TOP 10 ATTENDANCE GROWTH 2017–18 4.2% 15,064,000 14,461,000
© 2019 TEA / AECOM
BRAZIL
CHILE
2
2.2m
1 PARK
1.1m 8
1 PARK
* Adjustment versus the figure we published in last year’s report
KEY GROWTH Top 10 parks Latin America
Top 25 parks worldwide
10
Circles represent size of 10
4.2% 15.1m 14.5m
0%–4.9%
5%–9.9%
attendance at ranked parks at
the geography indicated. Slices 5
10%+
< 0%
within circles represent proportion
of attendance at the geography 0
from the ranked park indicated
Top 10 amusement/theme Top 10 amusement/theme parks Top 10 amusement/theme parks
by number. Shading indicates -5 -5 parks Latin America attendance Latin America attendance 2018 Latin America attendance 2017
attendance growth at the ranked 2010–11 2011–12 2012–13 2013–14 2014–15 2015–16 2016–17 2017–18 growth 2017–18
park versus all other ranked parks.
0.7% 2.6% 3.8% 6.0% 1.0% 0.7% -2.2% 4.2%
34 © 2019 TEA / AECOM © 2019 TEA / AECOM 35TOP 20
WATER PARKS
NORTH AMERICA
ATTENDANCE
ATTENDANCE
% CHANGE
LOCATION
RANK
PARK
2018
2017
1 TYPHOON LAGOON WATER PARK AT WALT DISNEY WORLD RESORT, ORLANDO, FL, U.S. 5.0% 2,271,000 2,163,000
2 DISNEY’S BLIZZARD BEACH WATER PARK AT WALT DISNEY WORLD RESORT, 3.0% 2,003,000 1,945,000
ORLANDO, FL, U.S.
3 VOLCANO BAY WATER THEME PARK AT UNIVERSAL ORLANDO RESORT, ORLANDO, FL, U.S. 15.0% 1,725,000 1,500,000
4 AQUATICA ORLANDO, ORLANDO, FL, U.S. 8.5% 1,556,000 1,434,000*
5 SCHLITTERBAHN WATER PARK AND RESORT NEW BRAUNFELS, NEW BRAUNFELS, TX, U.S. 1.0% 1,016,000 1,006,000
6 WATER COUNTRY USA, WILLIAMSBURG, VA, U.S. 2.5% 729,000 711,000
7 ADVENTURE ISLAND, TAMPA, FL, U.S. 6.0% 669,000 631,000
8 AQUATICA SAN ANTONIO, SAN ANTONIO, TX, U.S. 3.2% 645,000 625,000
NORTHEAST U.S.
16
MIDWEST U.S. 13
10
1.5m 9 SCHLITTERBAHN WATERPARK GALVESTON, GALVESTON, TX, U.S. 2.6% 559,000 545,000
3 PARKS 10 SPLISH SPASH, CALVERTON, NY, U.S. 5.1% 539,000 513,000
0.9m 18 15
11 SIX FLAGS HURRICANE HARBOR ARLINGTON, ARLINGTON, TX, U.S. 0.0% 533,000 533,000
2 PARKS SOUTHERN U.S.
CALIFORNIA, U.S. 20
0.4m 19 16
12
6
2.1m 12 SIX FLAGS WHITE WATER ATLANTA, MARIETTA, GA, U.S. -5.0% 531,000 559,000
1 PARK 4 PARKS 13 SIX FLAGS HURRICANE HARBOR NEW JERSEY, JACKSON, NJ, U.S. 0.0% 475,000 475,000*
TEXAS, U.S. 14
5 14 TYPHOON TEXAS WATERPARK, KATY, TX, U.S. 7.9% 451,000 418,000
3.2m 11
9 8
15 ZOOMBEZI BAY, POWELL, OH, U.S. 13.5% 438,000 386,000
5 PARKS 7
4 1 FLORIDA, U.S. 16 CAMELBEACH MOUNTAIN WATERPARK, TANNERSVILLE, PA, U.S. 3.1% 437,000 424,000
8.2m DOLLYWOOD’S SPLASH COUNTRY WATER ADVENTURE PARK, PIGEON FORGE, TN, U.S. 3.1% 437,000 424,000
5 PARKS 18 CEDAR POINT SHORES WATERPARK, SANDUSKY, OH, U.S. 1.9% 420,000 412,000
3 2
19 KNOTT’S SOAK CITY WATER PARK, BUENA PARK, CA, U.S. 1.5% 405,000 399,000
20 WET 'N WILD EMERALD POINTE, GREENSBORO, NC, U.S. 0.0% 398,000 398,000
TOP 20 TOTAL ATTENDANCE 2018 16,237,000 15,501,000
TOP 20 ATTENDANCE GROWTH 2017–18 5.8% 16,237,000 15,346,000
© 2019 TEA / AECOM
* Adjustment versus the figure we published in last year’s report
KEY GROWTH Top 20 water parks North America
Top 20 water parks worldwide
Circles represent size of 10 10
5.8% 16.2m 15.3m
0%–4.9%
5%–9.9%
attendance at ranked parks at
the geography indicated. Slices 5
10%+
< 0%
within circles represent proportion
of attendance at the geography 0
from the ranked park indicated Top 20 water parks North Top 20 water parks North Top 20 water parks North
by number. Shading indicates -5 -5 America attendance growth America attendance 2018 America attendance 2017
attendance growth at the ranked 2010–11 2011–12 2012–13 2013–14 2014–15 2015–16 2016–17 2017–18 2017–18
park versus all other ranked parks.
0.1% 2.2% -2.3% 1.6% 4.3% -0.7% -2.9% 5.8%
36 © 2019 TEA / AECOM © 2019 TEA / AECOM 37TOP 10
WATER PARKS
LATIN AMERICA
ATTENDANCE
ATTENDANCE
% CHANGE
LOCATION
RANK
PARK
2018
2017
BAHAMAS 1 PARQUE AQUÁTICO THERMAS DOS LARANJAIS, OLIMPIA, BRAZIL -1.8% 1,971,000 2,007,000
2 1.8m 2 AQUAVENTURE ATLANTIS BAHAMAS WATERPARK, PARADISE ISLAND, BAHAMAS 0.0% 1,831,000 1,831,000
1 PARK
MEXICO 3 HOT PARK RIO QUENTE, CALDAS NOVAS, BRAZIL -3.2% 1,433,000 1,481,000
0.5m 7
4 PISCILAGO, GIRARDOT (BOGOTÁ), COLOMBIA 0.1% 990,000 989,000
1 PARK
5 BEACH PARK, AQUIRAZ, BRAZIL -7.6% 950,000 1,028,000
GUATEMALA
6 PARQUE ACUÁTICO XOCOMIL, SAN MARTÍN ZAPOTITLÁN, RETALHULEU, GUATEMALA 1.6% 840,000 827,000
0.8m 6 COLOMBIA
7 EL ROLLO PARQUE ACUÁTICO, MORELOS, MEXICO 0.0% 530,000 530,000
1 PARK
1.0m 4
8 WET 'N WILD, SÃO PAULO, BRAZIL 5.0% 500,000 476,000
1 PARK
9 THERMAS WATER PARK, SÃO PEDRO, BRAZIL 22.7% 481,000 392,000
10 HOT BEACH, OLIMPIA, BRAZIL 90.1% 462,000 243,000
9 10 BRAZIL TOP 10 TOTAL ATTENDANCE 2018 9,988,000 9,804,000
8 1
5.8m TOP 10 ATTENDANCE GROWTH 2017–18 0.6% 9,988,000 9,933,000
5 3 6 PARKS
© 2019 TEA / AECOM
KEY GROWTH Top 10 water parks Latin America
Top 20 water parks worldwide
10
Circles represent size of 10
0.6% 10.0m 9.9m
0%–4.9%
5%–9.9%
attendance at ranked parks at
the geography indicated. Slices 5
10%+
< 0%
within circles represent proportion
of attendance at the geography 0
from the ranked park indicated Top 10 water parks Latin Top 10 water parks Latin Top 10 water parks Latin
by number. Shading indicates -5 -5 America attendance growth America attendance 2018 America attendance 2017
attendance growth at the ranked 2013–14 2014–15 2015–16 2016–17 2017–18 2017–18
park versus all other ranked parks.
5.7% 0.3% 3.4% 1.5% 0.6%
38 © 2019 TEA / AECOM © 2019 TEA / AECOM 39ASIA-PACIFIC 3.6% 27.9%
Theme parks Negative results in 2018 were often
weather-related, or due to a decline in
Top 20
amusement/theme
Changzhou China ASIA-PACIFIC GROWTH tourism from China. Big increases were
attributable to special occasions, new
parks Asia‑Pacific
attendance growth
Dinosaurs Park,
Changzhou, China,
attendance growth
STEADY AT 4% attractions and good marketing strategies.
2017–18
2017–18
Theme parks are big Regionally and internationally, Disney has
— readily maintained its position at the top
139.1m Overall attendance growth was 3.6% in 2018
of the list. Disney parks across Asia had a
very strong year overall. Tokyo Disneyland
Top 20
amusement/theme for the Top 20 Asian theme parks. While and Tokyo DisneySea enjoyed substantial
parks Asia-Pacific exhibiting the volatility of a young industry, attendance increases in 2018 on top of the
attendance 2018 the sector is doing very well. The big parks previous year’s good numbers. The former,
are getting bigger: The larger parks with in conjunction with its 35th anniversary,
higher attendance continue to grow fairly rolled out a grand new parade, “Happiest
134.2m rapidly. To make it onto our Top 20 chart, a Celebration”; the latter drew visitors with
Top 20 park needs a minimum of 3.1 million annual major festivals and seasonal activities such
amusement/theme attendance, which is substantial. as “Disney Pirates Summer.”
parks Asia-Pacific
attendance 2017
CHRIS YOSHII
Vice President – Economics,
Asia-Pacific
—
BETH CHANG
Executive Director –
Economics, Asia‑Pacific Changzhou China Dinosaurs Park
— © Changzhou China Dinosaurs Park
40 41NEW OPENING Ocean Kingdom also opened a new land,
reaped exposure from a Chinese New
Year TV special shot on-site, and fostered
more two-day visits and off-season visits A SEASON PASS IS A RELATIVELY
by bundling overnight stays with park NEW THING TO THE MARKET IN
admission (the Ocean Kingdom resort
has some 4,588 hotel rooms on site.) The
CHINA, BUT THERE ARE SIGNS THAT
new bridge mentioned above was also a OTHER PARKS WILL FOLLOW SUIT.
significant new gateway to the park.
Chimelong Paradise in Guangzhou, which
was one of the earlier Chimelong parks to
be built and opened in 2006, has instituted
significant upgrades and introduced
Halloween events, and been rewarded with a
significant (12%) increase in attendance.
Fantawild Asian Legend, Nanning, China
© Fantawild
Hong Kong Disneyland and Shanghai Hong Kong Disneyland opened a new show
Disneyland also enjoyed substantial growth. “Moana: A Homecoming Celebration,” but its
The Shanghai park launched programs to attendance increase of 8% for 2018 is also
help draw in more of the resident market, due to a pair of infrastructure improvements
including its first annual pass. A season that have greatly expanded public access.
pass is a relatively new thing to the market One is a new high-speed rail line from China
in China, but there are signs that other parks to the Hong Kong city center, and the other
will follow suit. is the new Hong Kong-Macau-Zhuhai bridge.
These new passages also helped stabilize
Behind the numbers: Disney attendance numbers at Ocean Park Hong
and Chimelong Kong. Visitors availed themselves of tourist
In the two years since its opening, Shanghai packages that bundled transportation with
Disneyland has quickly become a standard- park admission.
bearer for Asia and particularly China. It has
set the example for and shown the benefits Chimelong Group was another operator
of high-quality design and content, as well whose numbers tell the story of significant
as good operations, and wise management growth. In Zhuhai, several factors may be
that includes investment in new attractions credited for Chimelong Ocean Kingdom’s
and programmatic activities. Its influence
has led other parks to upgrade their
2018 attendance increase of over 10%. The
park’s nighttime spectacle — the Journey
7.3%
Shanghai Disneyland,
offerings and guest experience, though for of Lights parade, which was honored with a Shanghai Disneyland,
Shanghai, China,
the most part, a significant gap remains. Thea Award in 2018 — is quite popular. attendance growth Shanghai, China
2017–18 © Disney
42 43OCT parks generally saw an attendance Water parks
increase, driven by a first-ever “Cultural
Tourism Festival” featuring special events Overall, water park attendance was flat for
held at OCT attractions across 50 Chinese 2018 in Asia. In this sector, weather is a big
cities. Looking at the three leading Chinese factor influencing attendance and there
theme park groups on our charts, OCT were some big jumps as well as some fairly
shows a 15% attendance jump for 2018, large drops. Water parks in Korea suffered
approaching Universal Studios numbers; declines from the slowdown in tourism from
however, the OCT business model is unique China mentioned above.
and dependent on this government-owned
company’s continued acquisition of For those water parks that did especially
small parks and attractions as well as well, discounts and passes played a
new construction. notable part. OCT offered a popular,
10.6% Attendance growth follows a more organic
cross-visitation, multiple-admission pass
— a one-price ticket that admitted the
Chimelong Ocean Hero Island, Chimelong Ocean
Kingdom attendance Kingdom, Hengqin, China pattern at top operators Chimelong and customer to any and all of the OCT water
growth 2017–18 © Chimelong Fantawild. The latter’s attendance numbers parks and theme parks. This led to a rise
jumped by about 9%, supported by opening in attendance.
of two new Fantawild parks in 2017 that have
now been operating for a full year. Chimelong
New infrastructure and shifting While these shifts have slowed down new has some new parks in the pipeline that
development models projects for the time being, the promise we’ll be watching in the near future. Both
The past 18 months or so have brought contained within the change is that new and Chimelong and Fantawild were TEA Thea
a sharp slowdown in new construction better development models will emerge Awards recipients in 2019.
projects and the development of new that will be good for the industry. Meanwhile,
parks in China. This has to do with bank existing parks are doing well.
financing and liquidity problems connected
to changes in government policy and other Ups and downs
OCT Tianjin Playa Maya,
economic factors. Lotte World and Samsung Everland both NEW OPENING Tianjin, China
suffered significant attendance drops, © OCT
In the past, much theme park development along with other parks in Korea. The
in China has been tied to mixed-use real reason cited across the board was a
estate projects that involved other elements decline in tourism from China; for political
such as hospitality, retail and residential. The reasons, Korea has fallen out of favor as a
central government recently de-linked park destination from this source market.
development from residential development,
mostly in connection with new projects. The Changzhou China Dinosaurs Park (China)
result is that new theme park projects need raised interest with a recorded 28% jump
to be financed on their own; fundamentally in attendance. The park is establishing
a sensible move, but one that has stalled or itself as a resort destination with newly
canceled numerous projects that had been developed hotel, RDE commercial and a hot
in the pipeline. spring spa attraction.
The move grew out of concern that theme
park projects were being proposed or
built simply in order to get approval for
residential development.
44 45TOP 20
AMUSEMENT/THEME PARKS
ASIA-PACIFIC
ATTENDANCE
ATTENDANCE
% CHANGE
LOCATION
RANK
PARK
2018
2017
1 TOKYO DISNEYLAND AT TOKYO DISNEY RESORT, TOKYO, JAPAN 7.9% 17,907,000 16,600,000
SOUTH KOREA 2 TOKYO DISNEYSEA AT TOKYO DISNEY RESORT, TOKYO, JAPAN 8.5% 14,651,000 13,500,000
NORTHERN CHINA 9 7 11.8m
4m 2 PARKS
3 UNIVERSAL STUDIOS JAPAN, OSAKA, JAPAN
4 SHANGHAI DISNEYLAND, SHANGHAI, CHINA
-4.3% 14,300,000 14,395,000
7.3% 11,800,000 11,000,000
1 PARK
JAPAN
52.3m 5 CHIMELONG OCEAN KINGDOM, HENGQIN, CHINA 10.6% 10,830,000 9,788,000
15 4 PARKS 6 HONG KONG DISNEYLAND, HONG KONG SAR 8.1% 6,700,000 6,200,000
WESTERN CHINA 7 LOTTE WORLD, SEOUL, SOUTH KOREA -11.2% 5,960,000 6,714,000
3.1m 8 8 NAGASHIMA SPA LAND, KUWANA, JAPAN -0.2% 5,920,000 5,930,000
1 PARK 1 9 EVERLAND, GYEONGGI-DO, SOUTH KOREA -7.3% 5,850,000 6,310,000
3
19 10 OCEAN PARK, HONG KONG SAR 0.0% 5,800,000 5,800,000
SOUTHERN CHINA
16
27.1m 5
2 11 CHIMELONG PARADISE, GUANGZHOU, CHINA 11.9% 4,680,000 4,181,000
5 PARKS 14 11 12 UNIVERSAL STUDIOS SINGAPORE, SINGAPORE 4.3% 4,400,000 4,220,000
13 CHANGZHOU CHINA DINOSAURS PARK, CHANGZHOU, CHINA 27.9% 4,106,000 3,210,000*
18
HONG KONG EASTERN CHINA 14 OCT WINDOW OF THE WORLD, SHENZHEN, CHINA 0.3% 3,990,000 3,980,000
12.6m 10 6
17 4
23.4m 15 OCT HAPPY VALLEY, BEIJING, CHINA 0.8% 3,980,000 3,950,000
2 PARKS 13 4 PARKS
16 OCT HAPPY VALLEY, SHENZHEN, CHINA 0.3% 3,910,000 3,900,000
SINGAPORE 17 ZHENGZHOU FANTAWILD ADVENTURE, CHANGZHOU, CHINA -0.5% 3,800,000 3,819,000
12
4.4m 18 NINGBO FANTAWILD ORIENTAL HERITAGE, NINGBO, CHINA -2.3% 3,740,000 3,827,000
1 PARK
19 OCT EAST, SHENZHEN, CHINA -7.1% 3,680,000 3,960,000
20 OCT HAPPY VALLEY, CHENGDU, CHINA 4.4% 3,100,000 2,970,000
TOP 20 TOTAL ATTENDANCE 2018 139,104,000 134,794,000
TOP 20 ATTENDANCE GROWTH 2017–18 3.6% 139,104,000 134,224,000*
© 2019 TEA / AECOM
* Adjustment versus the figure we published in last year’s report
KEY GROWTH Top 20 parks Asia-Pacific
Top 25 parks worldwide
Circles represent size of 10 10
3.6% 139.1m 134.2m
0%–4.9%
5%–9.9%
attendance at ranked parks at
the geography indicated. Slices 5
10%+
< 0%
within circles represent proportion
of attendance at the geography 0
from the ranked park indicated Top 20 amusement/theme parks Top 20 amusement/theme parks Top 20 amusement/theme parks
by number. Shading indicates -5 -5 attendance growth Asia-Pacific Asia-Pacific attendance 2018 Asia-Pacific attendance 2017
attendance growth at the ranked 2010–11 2011–12 2012–13 2013–14 2014–15 2015–16 2016–17 2017–18 2017–18
park versus all other ranked parks.
7.5% 5.8% 7.5% 4.9% 6.8% -2.8% 5.5% 3.6%
46 © 2019 TEA / AECOM © 2019 TEA / AECOM 47TOP 20
WATER PARKS
ASIA-PACIFIC
ATTENDANCE
ATTENDANCE
% CHANGE
LOCATION
RANK
PARK
2018
2017
1 CHIMELONG WATER PARK, GUANGZHOU, CHINA 1.9% 2,740,000 2,690,000
2 WUHU FANTAWILD WATER PARK, WUHU, CHINA 13.3% 1,360,000 1,200,000*
3 KAIFENG YINJI WATER PARK, KAIFENG, CHINA 3.8% 1,350,000 1,300,000
4 SUNWAY LAGOON, KUALA LUMPUR, MALAYSIA 0.0% 1,300,000 1,300,000
17 SOUTH KOREA 5 OCEAN WORLD, GANGWON-DO, SOUTH KOREA -5.0% 1,264,000 1,330,000
16
5
3.9m 6 CARIBBEAN BAY, GYEONGGI-DO, SOUTH KOREA -13.0% 1,200,000 1,380,000
6 4 PARKS
SHENYANG ROYAL OCEAN PARK — WATER WORLD, FUSHUN, CHINA 0.0% 1,200,000 1,200,000
8 WET 'N' WILD GOLD COAST, GOLD COAST, AUSTRALIA -5.1% 1,120,000 1,180,000
12 17 1
CHINA 11 JAPAN 9 PLAYA MAYA WATER PARK, WUHAN, CHINA 54.3% 1,080,000 700,000
10.4m 14
0.8m 10 SUNWAY LOST WORLD OF TAMBUN, PERAK, MALAYSIA 0.0% 1,000,000 1,000,000
8 PARKS 9 1 PARK
2
6 3 11 PLAYA MAYA WATER PARK, SHANGHAI, CHINA 11.2% 990,000 890,000
SINGAPORE
12 ZHENGZHOU FANTAWILD WATER PARK, ZHENGZHOU, CHINA 1.3% 910,000 898,000
19 0.7m 13 ATLANTIS WATER ADVENTURE, JAKARTA, INDONESIA 2.5% 907,000 885,000
1 PARK
MALAYSIA 14 SUMMERLAND, TOKYO, JAPAN 1.0% 820,000 812,000
2.3m 10 4
20
INDONESIA 15 THE JUNGLE WATER ADVENTURE, BOGOR, WEST JAVA, INDONESIA -14.0% 783,000 910,000
2 PARKS
15
13
2.4m 16 LOTTE WATER PARK, GIMHAE, SOUTH KOREA -6.8% 744,000 798,000
3 PARKS
17 WOONGJIN PLAYDOCI WATERDOCI, GYEONGGI-DO, SOUTH KOREA -18.3% 720,000 881,000
AUSTRALIA PLAYA MAYA WATER PARK, TIANJIN, CHINA NEW 720,000 -
8 1.1m 19 ADVENTURE COVE WATER PARK, SINGAPORE 2.9% 700,000 680,000
1 PARK
20 OCEAN PARK WATER ADVENTURE, JAKARTA, INDONESIA -3.3% 698,000 722,000
TOP 20 TOTAL ATTENDANCE 2018 21,606,000 20,756,000
TOP 20 ATTENDANCE GROWTH 2017–18 0.7% 21,606,000 21,460,000*
© 2019 TEA / AECOM
* Adjustment versus the figure we published in last year’s report
KEY GROWTH Top 20 water parks Asia-Pacific
Top 20 water parks worldwide
Circles represent size of 10 10
0.7% 21.6m 21.5m
0%–4.9%
5%–9.9%
attendance at ranked parks at
the geography indicated. Slices 5
10%+
< 0%
within circles represent proportion
of attendance at the geography 0
from the ranked park indicated Top 20 water parks Asia‑Pacific Top 20 water parks Top 20 water parks
by number. Shading indicates -5 -5 attendance growth 2017–18 Asia‑Pacific attendance 2018 Asia‑Pacific attendance 2017
attendance growth at the ranked 2010–11 2011–12 2012–13 2013–14 2014–15 2015–16 2016–17 2017–18
park versus all other ranked parks.
10.3% 7.4% 6.0% 1.2% 1.0% 5.4% 2.7% 0.7%
48 © 2019 TEA / AECOM © 2019 TEA / AECOM 49EMEA 4.4% 11.5% Theme parks
Top 20 amusement/
theme parks EMEA
Gardaland, Castelnuovo
Del Garda, Italy, attendance
POWER OF THE
attendance growth
2017–18
growth 2017–18
DESTINATION
Destination development rules
65.4m when it comes to staying at the top
and moving up the ranks of the Top
Top 20 amusement/
theme parks EMEA 20 theme parks in Europe.
attendance 2018
—
62.6m While our study encompasses the EMEA
region, the parks on our Top 20 list are all
Top 20 amusement/
theme parks EMEA mature parks in Europe. For the most part
attendance 2017 these parks have remained consistent
and stable over the past eight years, with
moderate ups and downs in attendance
depending on reinvestment and other
factors. No Middle East parks have yet
made it into the Top 20.
JODIE LOCK
Associate – Economics,
Peppa Pig Land, Gardaland,
Asia-Pacific and EMEA Castelnuovo del Garda, Italy
— © Merlin Entertainments Group
50 51Marvel Summer of Super Heroes, Walt Wicker Man, Alton Towers,
5.3m Disney Studios Park at Disneyland Paris,
Marne-La-Vallee, France
© Disney
10.5% Staffordshire, U.K.
© Merlin Entertainments Group
Walt Disney Studios Alton Towers,
Park at Disneyland Paris, Staffordshire, U.K.,
Marne-La-Vallee, France, attendance growth
attendance 2018 2017–18
Europe — packaging appeals A park ticket can be bundled with In the Netherlands, Efteling continues to do
Disney is the top worldwide operator and transportation, hotels and other proximate well, with attendance growth of more than
the top European operator, and the Disney leisure properties operated by Parques 4% in 2018 following a dramatic increase of
parks in Paris showed moderate attendance Reunidos, including Warner Beach, EUROPEAN PARKS ARE MAKING nearly 9% in 2017, showing how a park can
growth and stability in 2018, following a 25th Parque de Atracciones de Madrid and Zoo THEIR WAY UP THE CHARTS, SHOWING continue to drive attendance in times of
anniversary bump in 2017. Aquarium Madrid. stability. Efteling has benefited from season
OFF THE POSITIVE EFFECTS OF pass sales, overnight stays and the draw of
Meanwhile, other top European parks are Merlin Entertainments Group has also BUILDING UP THEIR DESTINATIONS. unique new attractions such as Symbolica,
making their way up the charts, showing benefited from bundling its parks and a dark ride that opened in 2017 and was
off the positive effects of building up their attractions, and from aggressively honored with a TEA Thea Award.
destinations. Europa-Park (Germany), reinvesting in its parks. This strategy, along
Efteling (Netherlands), Tivoli (Denmark), with good weather, proved advantageous Outside of Paris, Parc Astérix attendance
Gardaland (Italy) and Alton Towers (UK) are in 2018 for Merlin’s UK parks, such as Alton grew by 8.7% in 2018, reaping the benefits of
among those that did well. Towers, Chessington World of Adventures, a 100 million Euro investment plan that rolled
and LEGOLAND Windsor. The popular, new out in 2017 and continues through to 2020.
Parque Warner in Madrid displays the biggest Wicker Man ride and seasonal Scarefest at This has enabled the park to thrive despite
attendance increase for a European theme Alton Towers propelled attention and helped factors negatively impacting other parks
park on our 2018 charts (approaching 19%). the park recover from the attendance in continental Europe. The improvements
This growth is attributed to expansion of the decline of a few years back, which also include a new, 150-room hotel that doubled
Aquopolis water park, a strong marketing affected other Merlin-operated theme parks the park’s accommodation capacity in 2018.
campaign, and a range of packages and across the UK. The park recently marked a key operations
“Bono Parques” passes from operator milestone — 50 million visits since opening
Parques Reunidos that extend a park visit in 1989 — and is gearing up for 30th
into a multifaceted resort experience. anniversary celebrations.
52 53You can also read


