Growth and Structural change in North Eastern Region of India
←
→
Page content transcription
If your browser does not render page correctly, please read the page content below
Chapter 3
  Growth and Structural change in North Eastern Region of
                           India

3.1    North Eastern Region of India: A brief history

―India‘s North Eastern Region is a ‗rainbow country …extraordinarily diverse and
colourful, mysterious when seen through parted clouds‖. (NER Vision 2020, 2008:1).
South Asia meets South East Asia in India‘s North East. North Eastern India has been
a gateway of commerce and culture that linked India to East and South East Asia. The
North Eastern Region (NER) comprises of Arunachal Pradesh, Assam, Manipur,
Meghalaya, Mizoram, Nagaland, Sikkim and Tripura. It constitutes a population of 3.78
percent of the total population of the country and covers an area of 2,62,189 sq. km.
constituting 7.98 percent of the country‘s total geographical area. The hill states of the
region viz. Arunachal Pradesh, Meghalaya, Mizoram and Nagaland are mostly inhabited
by tribal people. The region has over 200 of the 635 tribal groups in the country speaking
a variety of Tibeto –Burman languages and dialects with a strong tradition of social and
cultural-identity. The region has 5484 km of international border with China and Bhutan
in the north, Myanmar in the east and Bangladesh in the south and west and 98 percent of
its border is international (NER Vision 2020). According to Goswami (2013: 69) ―the
entire North-East India had a long tradition of trade relations with eastern Himalayan
sub-region comprising Bhutan, Tibet, China and Myanmar (Burma). History has recorded
a number of trade routes between North-East India and its neighbouring countries. As
many as 27 trade routes (passes) including the famous Tawang route which passes via
Tawang and Tsona Dzong have been identified between Arunachal Pradesh and Tibet.

                                           49
Source: Google image, MapsofIndia
Chellaney (2015: xx) wrote ―when we look at the sub region made up of East and
Northeast India, Bhutan, Nepal, Bangladesh, Myanmar, Thailand, Laos, Cambodia and
Vietnam- we must remember that this was historically one economy unit: an integrated
region in terms of trade, culture and people to people exchanges. But new political
borders since the 1940s have changed ground realities.‖ Yet the region became land
locked in post independence era due to geo politics as the region came to be surrounded
by hostile neighbours and traditional trade was converted overnight into smuggling
across the border. Except for Nepal and Bhutan, connectivity with other neighbouring
countries became highly unstable. Since independence the trade & commerce of the
region has been through the narrow 27km wide Siliguri corridor. The annexation of Tibet
50by China cut off Tibet‘s link with this region which also affected the economies and
cultures of the entire Himalayan region (Chellaney 2015; xxi).
Table 3.1: International Borders in NER (length in kms)
State Bangladesh Bhutan China Myanmar Nepal Total
Arunachal 217 1126 520 1863
Assam 263 267 530
Manipur 398 398
Meghalaya 443 443
Mizoram 318 510 828
Nagaland 215 215
Sikkim 32 220 99 351
Tripura 856 856
Total 1880 516 1346 1643 99 5484
Source: Department of Border Management, Ministry of Home Affairs
Rich in natural resources and a treasure house of floral and faunal bio–diversity, the
region was a gateway to East and Southeast Asia before independence. The biodiversity
of the North Eastern Region is of great significance for citizens‘ livelihoods. Its
biodiversity has been highlighted as one of its assets and as an underlying resource for
development. The immense biodiversity of the region has made it a priority area for
investment by the leading conservation agencies of the world. According to World bank
report (2007: xv) ―Northeast India probably supports the highest bird diversity in the
East, with about 836 of the 1,200 bird species known from the Indian subcontinent. The
richness of the region‘s avifauna largely reflects the diversity of habitats associated with
a wide altitudinal range. Assam hosts the entire known world population of the pygmy
hog, 75 percent of the world population of the Indian rhinoceros and wild water buffalo,
and a sizable population of Asian elephants and tigers.‖
According to Poffenberger et al (2005) of the 1300 species of orchids documented
worldwide, 700 are found in North Eastern Region of India with 550 species of orchids
in Arunachal Pradesh alone. In Manipur 430 species of plants are used for medicinal
purposes and of the 1000 species of ferns found in India over 50 percent are located in
the Northeast India.
51World bank (2007: xiii) has rightly pointed out that ―Most accounts and discussions
about the Northeast point out its diversity in people, plants, and animal life. The region is
rich in natural resources, especially water and forests, and there is a feeling that it could
potentially be one of the wealthiest regions of India.‖ Yet today this region has come to
be considered a backward region having been bypassed by the process of development.
The vibrancy, so conspicuous in the past, is no longer there. History, geography and
politics have cast the northeastern region as a far away land, remote, isolated and
surrounded by intimidating and hostile environment.
The NER Vision 2020 document has contextualized the situation in the region as
follows :
―The trauma of partition in 1947 not only took the region backwards by at least a quarter
of a century, but also placed hurdles on future economic progress. It isolated the region,
sealed both land and sea routes for commerce and trade, and severed access to
traditional markets and gateway to the East and South East Asia- the Chittagong port in
East Bengal (now Bangladesh).‖ ( NER Vision 2020,1)
The following quote from NER Vision 2020 documents succinctly sums up the
development experience of the region in the last six decades: ―At Independence, the
North Eastern Region was among the most prosperous regions of India. Sixty years on,
the Region as a whole, and the States that comprise it, are lagging far behind the rest of
the country in most important parameters of growth.‖ (NER Vision 2020, 2008; iii)
All states in the region used to be classified as special category states till 2014-15. The
National Development Council had considered factors such as those places which have
hilly and difficult terrain, larger share of the area with low population density and/or
places with bigger share of tribal population to be classified as special category states. It
also includes places with strategic location along borders, backwardness in economic
infrastructural and also non-viable nature of state finances. These characteristics are
found in NER of India.
Economic development is the undisputed objective of any society. However the scope of
the concept has expanded as people come to understand more and more dimensions of
52what makes their lives complete. Development is not just about income, it also means
removal of poverty and under nutrition, increase in life expectancy, access to sanitation,
clean drinking water and health services, reduction in infant mortality, increased access
to knowledge and schooling and literacy. In short it is a multi dimensional concept. The
objectivity of development should be more concerned with enhancing the quality of
lives people live and the justice for freedoms to enjoy. Development is a process of
expanding the real freedoms that people enjoy. It should be accompanied by removal of
poverty, of poor economic opportunities and systematic social deprivation. The problem
of poverty is such that it robs the people the freedom to satisfy their hunger or to achieve
sufficient nutrition, or to obtain facilities and remedies for treatable illnesses or to have
the opportunity to be adequately clothed or sheltered or to enjoy clean water or sanitary
facilities. Lack of freedom associated with poverty is closely associated with the lack of
public facilities, and social care such as the absence of epidemiological programmes or of
organised arrangements for health care or educational facilities or of effective institutions
for the maintenance of local peace and order. People aspire for a society free of
discrimination with tolerable levels of equality; where the sick receive proper medical
care and people do not have to sleep on the footpaths. A minimal requirement of life for
a developed nation is that the physical quality of life be high and be so uniformly, rather
than being restricted to an affluent minority.
In the next section the development and the problems faced by North eastern region are
discussed. Though the region is an abode of floura, fauna and various natural resources,
development still excludes the region. The political topography and changes there in has
taken toll on the region. The reflection is in the form of development and various
indicators depicting it. Section 3.2 presents the developmental challenges faced by north
eastern region. The views of various committees in identifying backwardness and actual
challenges faced are discussed. Section 3.3 presents the economic growth in the north
east region and the structural changes there in followed by summary and conclusion.
533.2 North Eastern Region: Development and Problems faced
Development is measured through indicators like literacy rate, infant mortality rates,
poverty ratio, real per capita NSDP, per capita electricity consumption and road density.
It can also be measured by aggregated measure such as human development index where
three dimensions of development- standard of living, knowledge and health constitute
the measure. Table 3.2 presents a comparative growth profile of the eight states. In terms
of literacy except for Arunachal Pradesh all NER states have a literacy rate higher than
the national average. Mizoram‘s literacy rate is the third highest in India after Kerala and
Lakshadweep. Most of the NER states have infant mortality rate, an important indicator
of access to health care facilities lower than the national average. Manipur has one of the
lowest infant mortality rates in India. Except for Arunachal Pradesh, Assam and Manipur
NER states have a poverty ratio lower than the national average. It ranges between
36.89% in Manipur and 8.19% in Sikkim. The real per capita Net State Domestic
Product (NSDP) has lagged behind significantly behind the rest of India implying the
standard of living to be low. At Rs 29119 in 2013-14, it was almost half of all-state
average of Rs 44875 in 2004-5 prices. Only Sikkim, Nagaland and Tripura had per capita
income higher than the national average. According to the NER Vision 2020 document
at the time of independence per capita income in the undivided state of Assam was higher
than the national average by 4 percent. The region showed vast developmental potential,
even during the period where India was under the British colonial rule the economic
performance of the region was much better than the rest of the country. The slow
progress of NER‘s economy is reflected in the low growth in income. As the growth rate
of per capita GSDP lagged behind the rest of the country the gap narrowed, and by the
late 1960s per capita income in the region had fallen behind national average. Not
surprisingly post 1960‘s the difference in per capita incomes between the country and the
region has steadily diverged.
In addition to lower per capita income from the rest of the country there are other
development indicators NER is lagging behind. Such as access to basic services in
adequately. The infrastructural development indicators such as road length per 1000
sq.km and power consumption level in the region. It is only in Sikkim that per capita
54power consumption is higher than all India average. Arunachal Pradesh has the lowest
road density despite being the largest state in the region.
Table 3.2: Socio-economic indicators of NER States
State Literacy Infant Poverty Ratio Per Capita Per Capita Road length
rate (2011 mortality (2011-12) NSDP (Rs) Electricity (km/1000 sq km
census) rate (per Tendulkar 2013-14 at Consumption of geographical
1000) 2013 report 2004-5 (Kwh) 2010- area (2008))
prices 11
Arunachal 66.95 32 34.67 36019 582.08 196.96
Pradesh
Assam 73.18 54 31.98 23392 222.86 2936.51
Manipur 79.85 10 36.89 24042 242.30 739.11
Meghalaya 75.48 47 11.87 37154 654.08 438.57
Mizoram 91.58 35 20.40 41094 461.69 292.11
Nagaland 80.11 18 18.88 49963 264.81 1345.32
Sikkim 82.20 22 8.19 83527 880.11 263.95
Tripura 87.75 26 14.05 47261 221.80 3026.23
All India 74.04 40 21.92 44875 818.75 965.73
Source: Compiled by the author from various sources
Table 3.3 depicts the demographic structure of NER states as per 2011 Census. Sex ratio
represents one of the indicators of the status of women in the society. The table shows
that only three states have a sub-national sex ratio. North Eastern states are not known
for widespread discrimination against females as in many other parts of India, however
there is mild discrimination in these areas too (Das, 2013). The Khasis in Meghalaya
follow a matriarchal system where females inherit the property of parents. Urban
population enjoy facilities not accessible to rural population. NER is dominant by a rural
regions and can be called as rural economy; almost 81 percent of population live in rural
area, having an average population density of 175 people per sq. km. of area. The
distribution of population is also uneven across the states. Assam and Tripura are top two
densely populated states, sharing almost 75% of total NER population and have a
population density close to the national average. Nagaland has the distinction of being the
only state having a decline in population during 2001-2011.
55Table 3.3 : Demographic structure of NER States (2011 Census)
States Population Decennial Sex Ratio Urban Popn
(Total) growth (females share in Density
rate per 1000 percent (per sq.
(2001- males) km)
2011) (%)
Arunachal 1383727 26.03 938 22.67 17
Pradesh
Assam 31205576 17.07 958 14.08 397
Manipur 2855794 24.5 992 29.21 122
Meghalaya 2966889 27.95 989 20.08 132
Mizoram 1097206 23.48 976 51.51 52
Nagaland 1978502 -0.58 931 28.97 119
Sikkim 610577 12.89 890 24.97 86
Tripura 3673917 14.84 960 26.18 350
NER total 45772188 17.40 960 18.39 175
All India 121,08,54,977 17.70 943 31.14 368
Source: Government of India, Census 2011
NER Vision 2020 sums up the proximate causal factors behind the stagnation of the
region as follows: ―Poor infrastructure and governance is combined with low productivity
and market access. Inability of governments to control floods and river bank erosion
causes unmitigated damage to properties and lives of millions of people every year in the
region. Frustration and dissatisfaction from seclusion, backwardness, remoteness and
problems of governance have provided fertile ground for breeding armed insurgencies.
There is overwhelming dependence for resources on the Central Government, public
investment in the region has sub-optimal productivity due to weak of forward and
backward linkages.‖
3.2.1 Wealth of the region
The region contributes substantially to oil and gas production in India. It holds promise
because the area is largely unexplored. The history of oil and gas exploration in India
dates back to the 19th century in Assam. Exploration of hydrocarbon in India began in
Assam in 1866. The first well that struck oil in Makum area near Margherita during 1867
was drilled by McKillop, Stewart & Co. The Assam Railway & Trading Co. Ltd drilled
the first commercial well Digboi-1 with an initial production of 200 gallons per day in
1890. (Hydrocarbon Vision 2030 for Northeast India 2015:55). In 2014-15 NER
56produced 4.54 Million Metric tonnes of crude oil and 4.13 Billion Cubic Metres of gas
which constituted 12.1 % and 12.2 % of total production. (Hydro carbon Vision 2030 for
Northeast India: 51)
The following table 3.4 provides details of prognosticated hydrocarbon resources of the
region
Table 3.4: Hydrocarbon resources in North East Region of India
Basin Offshore Onland Total (MMT) % of total % explored
(MMT) (MMT) (projected)
Assam- 0 1860 1860 7 10
Arakan fold
belt
Upper 0 3180 3180 11 90
Assam shelf
Total NER 0 5040 5040 18 -
India 18815 9270 28085 100 -
- indicates data not available
Source: Directorate General of Hydrocarbons (2015) Hydrocarbon Vision 2030 for
Northeast India
The upstream oil sector is commonly known as the exploration and production sector
which includes the search for potential underground or under water crude oil and natural
gas fields, drilling of exploratory oils, drilling and operating the wells to recover and
bring the crude oil and /or raw gas to the surface. Midstream sector consists of the
transportation (by pipeline, rail, barge, oil tanker or truck), storage, and wholesale
marketing of crude or refined petroleum products. The downstream sector refers to the
refining of crude oil, processing and purification of raw natural gas, as well as the
marketing and distribution of products derived from crude oil and natural gas. Products
such as gasoline or petrol, kerosene, jet fuel, diesel oil, heating oil, fuel oil, lubricants,
waxes, asphalt, natural gas and liquefied petroleum gas (LPG) etc belong to the
downstream sector. The key entities operating in this segment in this region are as
follows: Digboi refinery, Guwahati refinery, Bongaigaon refinery, Numaligarh Refinery
Ltd, Brahmaputra Cracker and Polymer Ltd, Brahmaputra Valley fertilizer Corporation
Ltd, Assam Gas Company Ltd and Tripura Natural Gas Company Ltd. Gas based power
plants have been set up by NEEPCO, Assam State Electricity Board, Tripura state
57Electricity company Ltd and ONGC Tripura Power Corporation. (Hydrocarbon Vision of
NER 2015: 54-55).
A world bank report (2007: xv) commenting on the abundance of water resources in the
region writes ―One-third of India‘s runoff flows from the Northeast through the
Brahmaputra and Barak rivers. These rivers constitute India‘s National Waterway 2
(NW-2) and their basins contain seasonally flooded wetlands that sustain a broad range of
biodiversity. There is an estimated 60,000 megawatts of economically viable hydropower
potential, of which only about 2004 megawatts is developed or under construction. It is
also clear that the abundant surface water resource imposes severe distress and costs on
the region through frequent flooding and erosive processes and that this needs to be
managed to improve economic development. The region also has a substantial unutilized
groundwater resource.‖
The basin of the Brahmaputra River is among the most flood prone in the world, followed
closely by that of the Barak River. Floods affect an annual average of 0.8 million hectares
of land, but in some unfortunate years they affect more than 4 million hectares of
Assam‘s total area of 7.54 million hectares. According to Dash (2015:15) ―India is South
Asia‘s most water stressed country; yet it has the North Eastern Region where there is
abundant water. Brahmaputra is underutilized. Despite having 34 percent of India‘s fresh
water wealth and 37 percent of the country‘s hydropower, the Brahmaputra remains
largely untouched.‖ This large water resource and hydropower potential could contribute
significantly to the national water and power requirements of the country.
According to a World Bank Study (2007:57) the Brahmaputra-Barak river system drains
a large catchment area, has the largest surface water potential, and 30 percent of the
hydropower potential (or 41.6 percent of the principal hydro potential) of the country.
The number of identified hydropower generation sites in the Brahmaputra basin is 140
(out of the 845 sites in the country; for comparison, 226 sites are on the Ganges and 180
on the Indus).
Based on the studies for re-assessment of hydro-electric potential of the country,
completed by Central Electricity Authority in 1987, identified hydropower potential in
58the country is 1,48,701 MW. This includes 63257 MW of potential in North Eastern (NE)
Region including Sikkim. The identified potential in NE Region constitutes about
42.54% of the total identified hydro power potential in the country. Presently about
3.17% of the identified potential (above 25 MW) has already been developed in N.E.
region, while another about 8.66 % is under various stages of development.
Table 3.5: Status of Hydro Electric capacity (installed capacity above 25 MW), 2016
NER states Identified Capacity Capacity Capacity yet to
capacity as per developed under be developed
reassessment construction
study(MW)
Total Above MW % MW % MW %
(MW) 25
MW
Arunachal 50328 50064 405 0.81 2854 5.70 46805 93.49
Pradesh
Assam 680 65 375 57.69 0.00 0.00 275 42.31
Manipur 1784 1761 105 5.96 0.00 0.00 1656 94.04
Meghalaya 2394 2298 282 12.27 40 1.74 1976 85.99
Mizoram 2196 2131 0.00 0.00 60.00 2.82 2071 97.18
Nagaland 1574 1452 75 5,17 0.00 0.00 1377 94.83
Sikkim 4286 4248 765 18.01 2526 59.46 957 22.53
Tripura 15 0 0.00 0.00 0.00 0.00 0.00 0.00
subtotal 63257 62019 2007 3.17 5480 8.66 55117 87.13
All India 148701 145320 37997.8 26.15 12422 8.55 94900.2 65.30
Source: Review of Performance of Hydro Power Stations 2015-16; Central Electricity
Authority, Govt. of India, Ministry of Power
Table 3.6 on the next page shows the various hydroelectric projects with installed
capacity above 25 MW that have been in operation in North eastern region.
59Table 3.6: Hydro Electric Projects in Operation in North Eastern Region
(Installed Capacity above 25 MW)
Sl.No. Name of the Installed Capacity (MW) Year of Commissioning
Project
Assam
1 Kopili (NEEPCO) 200 + 25 1988-2003
2 Khandong 25 +25 1984
(NEEPCO)
3 Lower Borpani 100 2007
(KarbiLangpi)
Total (Assam) 375
Manipur
4 Loktak (NHPC) 105 1983
Meghalaya
5 Umiam Umtru IV 60 1992
6 Kyrdamkulai 60 1997
7 Umiam St.- I 36 1965
8 Myntdu St.-I 126 2012-13
Total (Meghalaya) 282
Arunachal
Pradesh
9 Ranganadi Stage-I 405 2002
(NEEPCO)
Total (Ar. 405
Pradesh)
Nagaland
10 Doyang 75 2000
60(NEEPCO)
Total (Nagaland) 75
Total (NER) 1242
Source: Hydro Sub regional plan for the Northeast (Oct.2014)
Most of the north eastern states have a high proportion of forest coverage, all higher than
the all India average. Proportion of area under forests in the region in 2017 was 65.34%.
Though forest and tree cover of the country increased by 8021 sq km during 2016-17 area
under forests in the region declined by 630 sq.km. Five states in the region namely
Mizoram, Nagaland, Arunachal Pradesh, Tripura and Meghalaya show decline in forest
cover. The main reasons behind the decline in forest cover are practice of shifting
cultivation, rotational felling of trees, destruction of forest lands for developmental
activities, submergence of forest cover, agriculture expansion and also natural disasters.
The region has 34.53% of area under bamboo cultivation in India (Forest Survey of India
2017). On the one hand it is indicative of environmental friendliness of the growth
process in the region and on the other hand it points to the cost disability for any project
taken up in the region.
Table 3.7: Forest cover of NER states
NER states Forest coverage in percentage
Sikkim 82.31
Manipur 78.01
Arunachal Pradesh 61.39
Tripura 60.02
Nagaland 55.62
Meghalaya 42.34
Assam 34.21
Mizoram 26.76
All India 23.26
Source: Forest Survey of India, 2017
The degradation of the forests in the region would have been larger, had there been no
directive from the Honb‘le Supreme Court in 1996. In December 1996, the Supreme
Court of India made a landmark ruling in a civil writ petition (TN Godavarman vs. the
61Union of India and others) with regard to cutting down trees. The SC verdict included an
interim order prohibiting logging without government permission. The order, regarded as
a move to safeguard the forests and its resources from rampant exploitation, included
curbing any forest related commercial activity – logging, timber mills and timber
transportation. While it banned unregulated logging, it stipulated measures for state
governments to introduce sustainable timber-harvesting policy under strict supervision
coupled with afforestation programmes. In the North East, a region that was estimated to
be contributing half of the country‘s total timber production during that time, the impact
was instantaneous. The once thriving and unregulated timber trade was reined in but also
simultaneously lead to the shutdown of many timber mills across the region and to some
extent effecting the livelihood of people dependent on forests.
3.2.2 Poverty in the region
Growth is not the most important objective of economic policy. It is necessary to ensure
that the benefits of growth accrue to all sections of the society. Therefore eradication of
poverty is an important objective. To survive human beings need a certain minimum
consumption of food and non-food item. However from time to time and across countries
the perception regarding what constitutes poverty varies. Measurement of poverty is
necessary to evaluate how the economy is performing in terms of providing a certain
minimum standard of living to all its citizens. It was only after the publication of Report
of Expert Group in 2009 popularly known as Tendulkar committee report that estimates
of poverty ratio for states in NER became available. Earlier Assam‘s poverty ratio used to
proxy all other north eastern states. The new estimate is based on private expenditure
per capita near the poverty lines on food, education and health by comparing
them with normative expenditures consistent with nutritional, educational and
health outcomes.
The table 3.8 presents a comparative picture of dynamics of poverty in the region. In
1993-94 three states of the region had head count poverty ratio higher than the national
average. Manipur had the highest and Mizoram the lowest poverty ratio in India. In
2011-12 the Head Count Ratio of the same three states had HCR higher than the national
average. The poverty ratio in Manipur had been persistently above the national average.
62As a whole, poverty ratio has declined over time in all states in the region. Manipur,
except for 2004-5, had the highest poverty ratio among the north eastern states. It is only
in Sikkim, poverty ratio had persistently declined from 31.8% in 1993-4 to 8.2% in
2011-12.
Table 3.8: Percentage of population below Poverty line (Tendulkar methodology)
1993-94 2004-05 2009-10 2011-12
Arunachal 54.5 31.1 25.9 34.7
Pradesh
Assam 51.8 34.4 37.9 32.0
Manipur 65.1 38.0 47.1 36.9
Meghalaya 35.2 16.1 17.1 11.9
Mizoram 11.8 15.3 21.1 20.4
Nagaland 20.4 9.0 20.9 18.9
Sikkim 31.8 31.1 13.1 8.2
Tripura 32.9 40.6 17.4 14.0
All India 45.3 37.2 29.8 21.9
Source: GOI (2014), Report of the Expert group, Planning Commission
3.2.3 State Finances
The tax revenue of most of the North-eastern States is very limited due to low levels of
commercial activity and low levels of consumption. The own tax revenue of States
consists of VAT, State excise duties, stamp duty and registration fee, motor vehicle tax,
goods and passenger tax and other minor taxes. The components of own non-tax revenue
are: (a) interest receipt and dividends (b) royalty (c) receipts from forestry and wild life
(d) other miscellaneous general services including lotteries and (e) earning from
irrigation projects.
The following table 3.9 indicates the state of finance of these states. Own tax and non tax
revenue constitute a small segment of expenditure requirements. Even for revenue
63expenditure it constitutes a small proportion. It means these states largely depend on
various forms of transfers from the central government.
Table 3.9: State of Finance of NER states
NER states Own tax Own non tax Own tax & non Gross Fiscal
revenue in revenue in billion tax revenue as deficit as
billion (2015-16) percent of percent of
(2015-16) revenue GSDP
expenditure (2015-16)
(2015-16)
Arunachal
Pradesh 5.6 4.9 10.48 1.49
Assam 118.4 28 24.89 11.34
Manipur 5.9 1.9 10.08 5.68
Meghalaya 10.4 3.1 18.18 3.15
Mizoram 3.1 2.7 7.69 1.01
Nagaland 4.5 2.4 8.41 5.86
Sikkim 5.9 3.6 21.69 3.4
Tripura 13.2 2.8 18.73 4.99
Source: RBI handbook of statistics, 2017
Finance Commissions constituted every five years since 1950-51 and it decides the
share of taxes for the states, the quantum of the grant in aid of revenues and state
specific grants. The awards of the XIV Finance Commission will be operative till March,
2020. The following table shows that the share of the NER states in the divisible pool of
taxes has been increasing: .
64Table 3.10: Share of NER states with and without taxes under various Finance
Commission
NER Share of Divisible pool without Share of service tax
states service tax
XII XIII XIV XII XIII XIV
(2005-10) (2010-15) (2015-20) (2005-10) (2010-15) (2015-20)
Arunachal 0.288 0.328 1.370 0.292 0.332 1.431
Pradesh
Assam 3.235 3.628 3.311 3.277 3.685 3.371
Manipur 0.362 0.451 0.617 0.367 0.458 0.623
Meghalaya 0.371 0.408 0.642 0.376 0.415 0.650
Mizoram 0.239 0.269 0.460 0.242 0.273 0.464
Nagaland 0.263 0.314 0.498 0.266 0.318 0.503
Sikkim 0.227 0.239 0.367 0.230 0.243 0.369
Tripura 0.428 0.511 0.642 0.433 0.519 0.648
Total 5.413 6.148 7.907 5.483 6.243 8.059
Source: Various Finance Commission Reports
Northeastern states enjoy preferential treatment by virtue of being a special category
states. The constitution of India vide articles 370 and 371 provides for special privileges
to certain states or treat certain disadvantaged regions of the country in a special manner
(Bhattacharjee, 2016). However there is no provision to grant special financial assistance
to address the problems of remoteness, geographic isolation and backwardness. The
mechanism of special category status was meant to address this. All the NER states
belonged to the special category. Assam, Jammu & Kashmir and Nagaland were
accorded the special category status in 1969 after the Fifth Finance Commission had
recommended liberal dose of central assistance for them under the five year plans
(Bhattacharjee, 2016). Manipur, Tripura and Meghalaya were granted this status in 1972
followed by Sikkim in 1975, Arunachal Pradesh and Mizoram in 1987. This status is
granted to a state by the National Development Council on the recommendation of the
Planning Commission. The criteria details certain common features such as
i. Places with hilly and difficult terrain
ii. low population density and /or sizeable share of tribal population
iii. places with strategic location encompassed by borders of neighbouring
countries
65iv. low economic and infrastructural structures
v. poor feasibility of state finances.
According to Bhattacharjee (2016: 54) ―the creation of special category states, for
according to them special privileges in terms of liberal plan assistance is nothing
extraordinary in a federal setup; such an arrangement easily fits into framework of
federal structure in a diverse country like India.‖
Such practice of asymmetric federalism is also found in Belgium, Canada, Spain, Italy
and Switzerland. Under this policy Central assistance is provided to a special category
state as 90 % grant and 10% loan as against 70% loan and 30% grant for non- special
category states. As far as Assam is concerned 90:10 formula was applicable in its hilly
areas in the beginning. It was extended to the entire state of Assam in October ,1990
only. Over the years, eleven states were accorded this status — Arunachal Pradesh,
Assam, Himachal Pradesh, Jammu & Kashmir, Manipur, Meghalaya, Mizoram,
Nagaland, Sikkim, Tripura and, finally, in 2001, Uttarakhand. Until 2014-15, under
Special Category Scheme these 11 states received a variety of benefits and sops.
(Bhattacharjee, 2016)
The following are the benefits as the Award of special category status (under the Revised
Gadgil-Mukherjee formula):
11 special category states (SCS) get 30% of NCA (Normal Central Assistance),
while the remaining states get 70% of the allocation.
90% grant and 10% loan for special category states, while for other states it is
30% grant and 70% loan in case of NCA.
90% grants and 10% loan is for the SCA (Special Central Assistance) projects,
special central assistance of up to 100% grant is given only to special category
states.
Assistance is given for externally aided projects with grant-loan ratio of 90:10.
66 The matching contribution in respect of centrally sponsored schemes is usually
lower for Special Category states (SCS), central share is 90% for special category
while it is 25% for other states.
Special category states can enjoy concessions in excise and customs duties,
beyond additional plan resources, income tax rates and corporate tax rates are
determined by the government.
However, these benefits have been progressively diluted in the following ways:
NCA is given entirely as grant to all states and the loan component of the normal
central assistance has been removed since 2005-06. This has reduced the share of
NCA for SCS to around 56% (earlier it was 70%).
Further, NCA has reduced to account for merely 15% of central plan assistance,
as there was a proliferation of centrally sponsored schemes, thereby diluting the
benefit of untied grants to states.
The 90:10 formula for special category states is now applicable in centrally
sponsored schemes and externally aided projects.
But with the recommendations of the Fourteenth Finance Commission having been
accepted, the SCS has lost its specialty. The NITI Aayog has replaced the Planning
Commission and it has no power to allocate funds — therefore, the discretion that the
ruling party at the Centre had to dole out special category funds to states through the
Planning Commission can no longer be possible because it does not exist anymore.
Following the constitution of NITI Aayog in January, 2015 (after the dissolution of the
Planning Commission in August 2014) and the recommendations of the Fourteenth
Finance Commission (FFC), Central plan assistance to SCS States has been subsumed in
an increased devolution of the divisible pool to all States (from 32% in the 13th FC
recommendations to 42%) and do not any longer appear in plan expenditure. The FFC
also recommended to include variables such as ―forest cover‖ in devolution, which could
benefit north-eastern states that were previously given SCS assistance. However the
centre has dispensed with NCA, SCA and special plan assistance from 2015-16 onwards,
67along with that the increase in tax devolution share from 32% to 42% of divisible pool of
central taxes.
3.3 Developmental challenges of the NER
According to the Working Group on Development of the North Eastern Region during
the Seventh Five year (GOI 1985:18) the challenges before the region can be summed up
as follows:
―The basic tasks before the region, in accordance with the objective set at national level
are (a) attainment of self sufficiency in food (b) a higher level of social consumption
particularly in education, health, nutrition, sanitation, water supply and housing
(c) reduction in infrastructural bottlenecks (d) industrial development and generation of
productive employment and (e) ecological and environmental consideration.
Simultaneously, such resources of the region which enjoy locational advantage will have
to be appropriately exploited for use not only within the region but also for the country at
large‖
It is interesting to compare it with what NER Vision 2020 (2008:2) after twenty three
years has to say ―The challenges to ensuring peace and progress in the region are
formidable. The gap between the region and the rest of the country in terms of various
developmental outcomes, productivities and capacities of people and institutions is large
and growing, and has to be bridged. Even within the region, there are vast differences,
particularly between populations living in the hills and in the plains and between those
living in the towns and villages. Given the vast disparities within the region, a
development strategy will have to be evolved depending upon prevailing resources,
conditions and people‘s needs and priorities. Further, the development strategy for the
various tribes in the region will have to be participatory and should be calibrated in their
own setting. Given the complexity of the task, augmenting investment to accelerate
growth in the region is only a part of the story. The successful transformation of
investments into developmental outcomes requires a variety of strategic initiatives.‖
68The NER vision 2020 document (2008) put forward a strategy for delivering inclusive
development of the region consisting of five interdependent components which are
given as follows :
(i) participatory development articulated through grass-roots planning in which focus
should be to develop the sectors and sub-sectors with comparative advantage;
(ii) increasing the capacity of the people to participate productively in the economic
activities and creation and development of the institutions to design and implement
developmental programmes as preferred by the people;
(iii) promoting the increase of infrastructure, particularly connectivity and transport
infrastructure to facilitate the movement of people and goods within the region and
outside the region and open up markets for the produce in the region, attract private
investments and create greater employment opportunities and choice for the people of the
region;
(iv) ensuring sufficient flow of resources for public investments in infrastructure as well
as implementing a framework to encourage private participation in increasing the
infrastructure level and creating an environment attracting outsiders investments from
within the country as well as foreign investors to improve the physical resources of the
region for the welfare of the people; and
(v) transforming the governance by providing a secure, responsive and
market friendly environment including protecting the property rights of the investors and
ensuring a corruption free administration. Protecting the rights of the tribals for the use of
land and forest resources is particularly important to ensure a sense of belonging and
security to them.
The discussion on the appropriate policy initiatives will be more meaningful when it is
framed against the backdrop of the reasons behind the current state of affairs and the
vision of the people.
The National Committee on the development of backward areas had identified six types
of fundamentally backward areas viz.
i. Area of tribal concentration
69ii. Hill areas
iii. Drought prone areas
iv. Hot and cold deserts
v. Chronically flood affected areas
vi. Coastal areas affected by salinity
Planning Commission asked the committee to prepare a separate report for the north east.
The committee admitted its limitations
―The National Committee has as its members people with deep administrative
knowledge and extensive experience at the field level, however, as far as the North East
is concerned the Committee members have a very limited knowledge of local conditions
with regard to administration and development problems.‖
The Committee felt that the NER (excluding Sikkim) did not fall into a separate
category of backwardness. Three types of fundamental backwardness are found in the
region viz hilly areas, areas of tribal concentration and chronically flood affected areas.
According to Sarma (2005) the major factors constraining economic development of
this region in the last few decades are the five I‘s: initial conditions, infrastructure
deficiency, insurgency, imperfection/distortion in factor and product markets and
indifferent governance.
1. Initial conditions: Disruption of traditional links:
According to the Shukla Commission (1997:5), ―no other part of the country, barring
J&K, has had to bear a comparable burden with severe market disruption, total isolation
and loss of traditional communication infrastructure , all of which has pushed regional
costs and prices well above national norms, transport subsidies notwithstanding‖. The
considerable market disruption, socio economic distancing and retardation that resulted
due to partition are yet to be compensated. This led the Commission to state that redressal
of this market disruption should not be treated as a special favour. Partition literally
compelled all states in the region start from the scratch.
702. Infrastructure deficiency:
The region lacks the basic minimum physical, social and administrative infrastructures
for growth. Physical infrastructure such as power, communications, transports, irrigation
and market access are grossly inadequate. Poor infrastructure is not conducive to
attracting private investment. Although the NER is rich in resources like hydrocarbons,
forest, hydro-electricity, and other minerals, high transportation costs did not allow it to
grow according to the comparative advantages. The connectivity bottlenecks have made
the region perpetually underdeveloped and hence politically volatile.
3. Insurgency:
Except for Sikkim which became a part of India in 1975, there is no state in this region
which has not passed through different phases of insurgency. Insurgency is associated
with high transaction cost. Insurgency has been listed as both effect and cause of
underdevelopment of this region. This has become an excuse for the rent seeking
behavior of bureaucrats and politicians. Substantial amount of money earmarked for
developmental projects have leaked to the insurgents. Not only money for developmental
projects been diverted, an increasing amount of money which could have been
earmarked for developmental projects, are being spent on maintenance of law and order.
4. Imperfect Market:
Large inflow of goods and outflow of savings impede growth by distorting factor and
commodity markets. Due to low production base and heavy dependence on the rest of
the country for their requirements, growth of local demand induces income and
employment generation in the states with larger production base. Low credit deposit ratio
means most of the deposits in the region are invested outside the region.
5. Indifferent governance:
The state governments in the region have not contributed much in mainstreaming the
development process. Except for Tripura and Sikkim, other states in the region have a
poor governance record. Many opportunities thus have been squandered. Consistent
pursuit of clearly defined priorities in a development perspective contributes to growth.
71Development policies with well articulated thrusts pursued over a period of time will
unleash the growth potential.
3.3.1 NER under Planning
In the beginning the development initiatives in the region used to be anchored on
two perspectives: security perspective and perspective based on least interference in
traditional institutions and practices. Upto the third five year plan North East region did
not figure explicitly in the development policy discourse. In the plan the issue of
balanced regional development comes to the center stage. The focus was on how to
secure the fullest possible utilization of the resources of each of these region and so that
it can contribute to its highest potential to the national pool and therefore take its due
share from the benefits accruing from national development. The reason behind
backwardness of regions including the north east by implication was the failure to
secure proper utilization of resources. The second five year plan envisaged an effort to
promote greater mobility of labour between different parts of the country and to organize
schemes of migration and settlement from more to less densely populated areas.
Shortage of labour was considered an important reason for lack of optimum utilization of
the bountiful resources. The Fifth Five Year Plan was a watershed for development in the
North East. The NEC became operational. It was under the Home Ministry reflecting
the obsessive concern for security among the policy makers. The concept of sub plan
was introduced. Central assistance to the hill areas was made more systematic. Even
though the need for central assistance for development of hill areas forming part of
larger composite state as in Assam was recognized as early as the Second FYP yet it was
not systematized. It was recognized that the investments needed for meeting the
infrastructural gaps in communications, transport, power generation and transmission, for
the development of stable and diversified agriculture in place of jhum cultivation,
horticulture, plantation crops and large scale afforestation was immense and there was
no way these states can generate matching resources. This justifies the current practice of
central plan assistance for the special category states.
During the Fifth and Sixth FYP the economic policy of the region was part of
the Hill area development programme which highlighted the issues of difficult terrain,
72agro-climatic conditions and historical lag in economic development and also the
immense growth potential. Since the Seventh FYP it came under the Hill area
development programme component of Special Area Development Programmes. The
programmes during the fifth FYP were beneficiary oriented. The emphasis shifted to eco-
development in the sixth plan. The seventh plan emphasised the development of ecology
and environment aiming at evolving programmes to take care of socio-economic growth,
development of infrastructure and promotion of ecology of the region. The seventh Plan
identified the basic tasks of the region as follows (i) attainment of self sufficiency in food
(ii) viable solution to the problem of shifting cultivation (iii) ecological and
environmental protection (iv) reduction in infrastructural bottlenecks (v) development of
suitable small, village and cottage industries and generation of productive employment
(vi) manpower development.. During the eighth plan the focus was on productive sectors
of the hill economies by modernizing the agricultural practices and small scale industries
at household, cottage and village level.
The thrust areas during the ninth FYP were (i) eco-restoration and eco-
preservation (ii) involvement of the local population (iii) gender sensitive planning
(iv) use of appropriate technology (v) redevelopment of traditional agro-eco systems
based on traditional knowledge and technology (vi) scientific approach to agriculture,
animal husbandry and horticulture in order to raise productivity (vii) development of
ecologically sustainable industries and tourism. Since the mid 90s the NE economic
development began to find place in the mainstream collective psyche.
During the tenth FYP NER appeared as a category in special area
programme. The focus shifted to improving implementation and ensuring better delivery
of results, providing upstream assistance and policy support and strengthening capacity
and public involvement. The Department of Development of the North Eastern Region
(DONER) was set up in September 2001 to cater to the developmental needs of the north
eastern region. The NEC Act 1971 was amended in December 2002 to make Sikkim the
eighth member of the council. Since 2005 NEC has started functioning as a regional
planning body. The preparation of State Development Reports and Human Development
73Reports for each of the states has given the opportunity for critically examining the state
economies in a holistic manner than ever before.
In 1969 the National Development Council classified Assam, Jammu &
Kashmir and Nagaland as special category states enjoying certain privileges in resource
transfer from the centre in terms of higher grant component. The method for transfer of
plan fund to these states was as follows: Out of a given sum of central assistance for the
state plans available in any year, the requirement of funding for aided projects and
special area programmes on hill areas, tribal sub plans, border areas, NEC etc is
deducted as the first charge. Of the balance 30% is set aside for the special category
states leaving 70% for distribution among non special category states according to the
Gadgil-Mukherjee formula. The inter se distribution of this earmarked fund among the
special category states is determined in the light of the previous plan size and special
problems, needs and priorities of each state. The grant-loan composition of the central
Plan assistance for the special category states is 90:10 while for other states it is 30:70.
Gradually all the states in the region became special category states till the
discontinuance of the scheme in 2015 when NITI Aayog replaced the Planning
Commission.
In October 1996 the central government, announced an economic package of Rs 6100
crore for specific projects in the NER. North east sub plan was introduced in all central
ministries for which 10% of their budgets would be earmarked for the region. The high
level Shukla commission examined the backlogs in basic minimum services, and gaps in
important sectors of infrastructure development in the seven states. A detailed report was
submitted in 1997 to eradicate poverty and upgrade infrastructural development where
there was a serious intent of bringing the region on par with the rest of the country
within the next five to ten years. The commission recommended Rs 9395 crore to meet
the gaps in six basic minimum services: Housing for shelter less poor, Rural
Connectivity, Safe drinking water supply, Elementary education, primary health and
PDS. This was a quantum jump as the funding for BMS in all the seven states was
around Rs 418 crores per annum. The Commission made an interesting comment on the
feasibility of such a quantum of funding --
74―Large though the funding requirement may appear, it constitutes only 0.7 of one percent
of GDP. Between 1990-91 and 1994-5 the central Government tax GDP ratio declined
by a full one per cent of GDP from 10.8 percent to 9.8 percent. In other words, resources
of the order of one percent of GDP were given up presumably in favour of the better –off
sections of society as ― incentives‘ in the name of economic reforms. It will be difficult
to argue that it is not feasible to undertake resource mobilization of even a lesser order
and dedicate the same for BMS to the poor and disadvantaged in the Northeast‖( p-15). In
Jan. 2000 the central government further announced a Rs 10,271 crore package.
International Engagement and Opportunities in Act East Policy
Most international trade economists have a perspective of a world in which countries
exchange goods, factors and ideas. Free trade in goods leads to equalization of factor
prices across countries according to the factor-price-equalization theorem. In the
traditional literature on neo-classical growth model, capital and labour play the central
role as two main factors of production. From the perspective of conventional one sector
neo-classical growth theory international linkages do not matter, but from the trade
perspective they are the crucial determinants. It may be argued that greater openness of
an economy is potentially beneficial to all but requires appropriate policy designs to
realize it (Basu, 2006). Stiglitz (2002;4) sums up the empirical findings which vindicate
this perspective ―Opening up to international trade has helped many countries grow far
more quickly than they would otherwise have done. International trade helps economic
development when a country‘s exports drive its economic growth. Export-led growth
was the centerpiece of the industrial policy that enriched much of Asia and left millions
of people there far better off.‖ Trade and infrastructure development in NER may be seen
in this perspective. As the national market centres are far away, markets across the border
can act as the vents for surplus generated in NER. Access to these markets was not
restricted in the pre partition era. Undoubtedly, distance is exogenous, and it is a major
determinant of a region‘s trade prospects.
NER enjoys very special advantages over other parts of India in trade in view of India‘s
Act East Policy (AEP) in general and India‘s economic engagement with her eastern
75neighbours through India-ASEAN FTA and other bilateral FTAs in particular. NER‘s
locational advantage and rich natural resources justify its development as a base for
cooperation not only with the ASEAN but also with neighbouring countries such as
Bangladesh, Bhutan, and Nepal. Regional cooperation centering NER can be extended
through Myanmar to Mekong region, comprising Cambodia, Lao PDR, Thailand, and
Vietnam. NER can emerge in the new geo political set up as a strategic base for
foreign/domestic investors to tap the world‘s largest market in SAARC, BIMSTEC, and
ASEAN. At the same time, it has certain problems, which, if tackled and leveraged in the
right perspective, could yield rich dividends. It is therefore essential to evolve a regional
approach as opposed to individual state approach while framing trade policy for the NER.
It remains a big question as to what extent this can be achieved given the inter state
bickering on state boundaries and ethno nationalism spread over states. On the other hand
Chellaney (2015: xxii) argues that India has little choice but to look east ―because when it
looks west, it sees only trouble. The entire belt to India‘s west from Pakistan to Syria is
a contiguous arc of instability, volatility and extremism. Looking east allows India to join
the economic dynamism and relative political stability that characterizes that region.‖
Over the past several years, a number of regional and sub-regional initiatives have been
taken by countries in South and South East Asia, which would help shape the economic
geography of the region. These include the enhanced cooperation among the members of
the South Asian Association of Regional Cooperation (SAARC) that have agreed to set
up a South Asian Economic Union, the Bay of Bengal Initiative for Multi-sectoral
Technical and Economic Cooperation (BIMSTEC), the Asia-Pacific Trade Agreement
(APTA). Besides, India has adopted the ―Look East‖ policy and is engaged in deepening
economic cooperation with the ASEAN and countries belonging to the East Asia Summit
(EAS), which brings together the ASEAN and six of its partner countries, including
India. Providing fillip to these initiatives is not possible without NER playing a pivotal
role. The Look east policy initiated in the early 90s has become Act East policy in 2014.
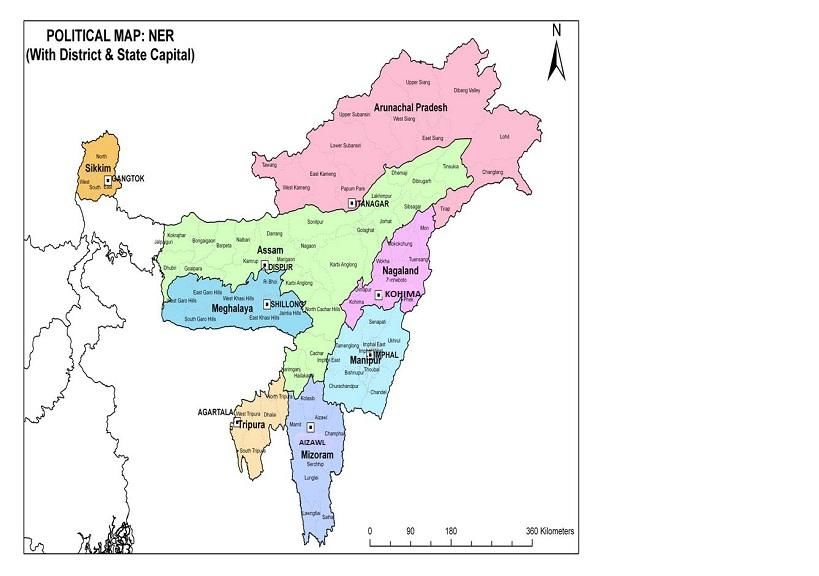
76Figure 3.1: NER as India’s Gateway to the East
MGC**
BCIM SAARC
EAS
ASEAN
(ASEAN+6)
NER
BIMSTEC APTA
SASEC* GMS***
Notes: * South Asia Sub-regional Economic Cooperation (SASEC)
** Mekong-Ganga Cooperation ***Greater Mekong Sub-region (GMS)
The significance of these initiatives is in integrating the region with dynamic markets in
south east and east Asia . it is significant because the stagnation of the region is often
argued to have started in post independent India when the region lost most of its
infrastructure of railways and riverine navigation to the erstwhile East Pakistan and now
Bangladesh. According to Mukherjee (1992) though the history of commerce of the
early northeast is yet to be documented rigorously, there are evidences that there used to
be movement of people, culture and merchandise between North east India and other
parts of the sub continent as well as South China. The region became a remote area in
77independent India. These regional and sub regional initiatives are likely to restore and
expand the linkages. According to Upadhyay (2013) the locational disadvantage
inhibiting growth in this region can be converted into an advantage with the increasing
integration with the world economy. Bigger markets create opportunities for benefitting
from returns to scale and international competition enhances competitiveness through
higher factor productivity. The social capital based on the social, cultural, economic and
psychological bonds along the borders can unleash lots of opportunities.
Sarma (2013:34) argued that ―the landlocked Northeast in the aftermath of partition will
have wider market access, that too with some of the fastest growing South-East Asian
and East Asian economies. This market integration would boost trade with those
countries with the Northeast serving as the gateway. Trade would thus serve as a driver of
rapid economic development of the region‖.
The natural outlet of the Northeast would be reinvigorated. Historically mainland
India‘s trade with south east Asia has been through the maritime route and it still
competes with the use of continental route through the north east. Bezbaruah & Sarma
(2013:60) argues that ―as this continental route has not even been explored yet, it is
difficult to dismiss the route as economically unviable‖. The economics of the region
can undergo a sea change by the prospects of improved connectivity in the region such as
the Trans Asian Railway and Highway projects initiated by UN-ESCAP. No less
important is the growth of self confidence among the entrepreneurs in the region in
diversification in new activities as part of Act East policy.
Supply-side constraints are inhibiting NER‘s two-way trade with its neighbours. India‘s
merchandise trade under Free Trade Agreements – regional and bilateral FTAs - is
expected to increase manifolds and NER is central to India‘s trade integration with
ASEAN. Without improved connectivity, NER wouldn‘t witness higher trade creation
and expansion of its export. Its geography dilutes most of the benefits of trade
liberalization due mainly to higher transaction cost. One suggestion is that the region has
to be linked through alternate access to sea and the remaining part of India across
Bangladesh. The Kaladan multimodal transport project would provide access to the sea,
and trans shipment facility at Chittagong port in Bangladesh and transit through
78You can also read