Going, Going, Gone - Trends and Consequences of Eliminating State Psychiatric Beds, 2016 - Treatment Advocacy Center
←
→
Page content transcription
If your browser does not render page correctly, please read the page content below
Going, Going, Gone

            Trends and Consequences of
Eliminating State Psychiatric Beds, 2016
                             updated for Q2 data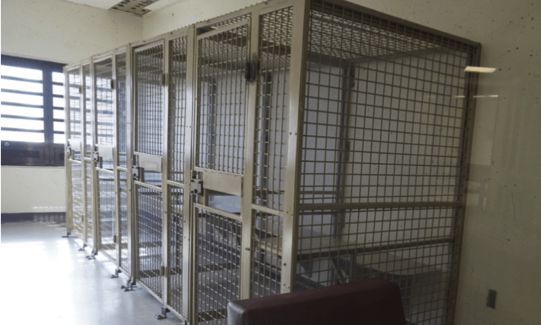
Going, Going, Gone
          TRENDS AND CONSEQUENCES OF
    ELIMINATING STATE PSYCHIATRIC BEDS, 2016

                               Doris A. Fuller
                     Chief of Research and Public Affairs
                         Treatment Advocacy Center

                             Elizabeth Sinclair
                             Research Assistant
                         Treatment Advocacy Center

                      Jeffrey Geller, M.D., M.P.H.
                           Professor of Psychiatry
                         Univeristy of Massachusetts

                        Cameron Quanbeck, M.D.
                                Medical Director
                       Cordilleras Mental Health Center

                                 John Snook
                              Executive Director
                         Treatment Advocacy Center

Going, Going, Gone: Trends and Consequences of Eliminating State Psychiatric Beds,
2016, was developed with generous funding from the Val A. Browning Foundation.

                                 June 2016

      Online at TACReports.org/going-going-gone
                          © 2016 Treatment Advocacy Center
                                  Arlington, Virginia
EXECUTIVE SUMMARY
        The number of state hospital beds that remain to serve the nation’s most ill and potentially
        dangerous psychiatric patients has fallen to its lowest level on record, setting off a domino
        effect of unmet need coast to coast. Largely reserved for those individuals considered unsuc-
        cessfully treated and/or too dangerous for other health care settings, state hospitals today are
        the last resort of the mental health system. When there are no beds for them, people who can’t
        be treated elsewhere instead cycle through other institutions or live on the streets. They crowd
        into emergency rooms and languish behind bars, waiting for beds to open. Some become vio-
        lent or, more often, the victims of violence. They grow sicker and die. The personal and public
        costs are incalculable.

        Ideally, people with serious mental illness never become psychiatry’s equivalent of ICU pa-
        tients; they receive timely and effective treatment long before they are critically ill. But a
        complete and reliable continuum of mental health care does not exist in the United States, and
        available mental health resources are oriented toward patients without serious mental illness.
        Because many individuals with the most severe psychiatric diseases are unable or unwilling to
        accept treatment, and some do not respond to treatment, there continue to be individuals—a
        growing number of people in a country with a growing population—who require the intensive,
        specialized services hospitals provide.

        Those beds are going, going, gone.

        The Treatment Advocacy Center in the first quarter of 2016 surveyed the 50 U.S. states and
        District of Columbia to determine how many state hospital beds remain and whom they serve.
        We found the following:

           • 37,679 staffed beds remain in state hospitals. Adjusted for population growth, this rep-
             resents a 17% reduction in the bed population since 2010, when 43,318 beds remained,
             and a 96.5% drop from peak hospital numbers in the 1950s.1

           • 11.7 beds remain per 100,000 people. This means there are fewer state hospital beds
             per capita than at any time since before the nation stopped criminalizing mental illness
             in the 1850s.2

                                Key State Hospital Bed Trends, 1955-2016

                                                                                                       AS A
                                                                                                   PERCENTAGE
                                                                             PER 100,00           OF HISTORICAL
              YEAR                          NATIONWIDE                      POPULATION+               PEAK*

              2016
              37,679           Total state hospital beds                          11.7                    3.5%
                20,078         Civil beds in state hospitals                       6.2                     *
                17,601         Forensic patients in state hospitals                5.5                     *
              2010
              43,318           Total state hospital beds                          14.1                    4.2%
              2005
              50,509           Total state hospital beds                          16.8                    5.0%
              1955
              558,922          Total state hospital beds                        337.0
        + Adjusted for the growth in U.S. population
        * 1955 data are not available.

                                  Going, Going, Gone: Trends & Consequences of Eliminating State Psychiatric Beds, 2016 n 1
• The United States ranks 29th of 34 Organization for Economic Cooperation and Devel-
                             opment (OECD) countries. Even with all the psychiatric beds outside state hospitals
                             included, the U.S. had only 37% of the OECD average psychiatric bed population of 68
                             beds per 100,000 people.3

                           • Nearly 50% of remaining beds—about 5.5 out of the 11.7—were occupied by forensic
                             patients charged with or convicted of crimes.

                           • Forensic bed demand is exploding. Colorado alone saw a 500% increase in hospital refer-
                             rals for pretrial competency evaluations for criminal offenders from 2004 to 2013.4

                           • State spending reflects the forensic shift. In the past 25 years, the percentage of state
                             hospital budgets spent for forensic treatment has quadrupled.5 It continues to rise.

                           • Despite this historic shift, a majority of states maintain wait lists for their forensic beds,
                             and some lists are months long.6

                           • As more beds are diverted to the forensic population, fewer beds are left for people who
                             haven’t committed crimes. “Boarding” patients in mental health crisis to wait in loud,
                             chaotic hospital emergency rooms has become virtually universal as the number of beds
                             for non-offenders has shrunk.7

                           • A growing number of states are resorting to hospital beds behind bars for criminal offend-
                             ers—psychiatric treatment facilities operated by corrections systems instead of mental
                             health departments. New Hampshire even sends selected civil patients there.

                                         The closing of state-operated psychiatric beds—a trend known as “deinstitu-
   “The mentally ill                     tionalization”—has been ongoing in Western democracies since the mid-20th
                                         century. The United States is considered its leader, having started earlier and
   who have nowhere
                                         reduced beds more drastically than others. The trend was the result of financial
   to go and find little                 incentives, new psychiatric medications and policies driven by the ideal that
   sympathy from                         every patient would be better off in a small community setting than in a larger
                                         facility. The ideal, sound as it may have been, was incompletely realized. The
   those around them                     hospitals closed, but community-based clinics did not replace them, or opened
   often land hard in                    and later were defunded and closed. In many small communities, the clinics
                                         were often not viable to begin with. Meanwhile, the functions the hospitals once
   emergency rooms,
                                         performed for people severely disabled by mental illness—treatment, structure,
   county jails and city                 shelter—were lost, and the people who needed those functions were “transinsti-
   streets. The lucky                    tutionalized” to other large settings, such as jails and prisons.8

   ones find homes                       Yet the march toward extinguishing state beds continues. Going, Going, Gone
                                         is the Treatment Advocacy Center’s fourth survey of state hospital beds in eight
   with family. The
                                         years. Each reported double-digit bed losses, and there’s no sign the next survey
   unlucky ones show                     will be any different until no beds are left to count. Behind the scenes of the bed
   up in the morgue.”                    shortage, gravely ill and suffering people compete for the inpatient beds that re-
                       Liz Szabo         main. Typically the battle is between civil and forensic patients, but a state official
          “A Man-Made Disaster:          in Connecticut told us children and adolescents in psychiatric crisis are backing up
         A Mental Health System
                                         in ERs because juvenile psychiatric beds are being diverted to adults. The reality
         Drowning from Neglect”
       USA Today (May 12, 2014)          that an immeasurable number of people with treatable diseases only get treat-
                                         ment when they get sick enough to commit crimes that send them to jail and then
                                         to a forensic bed should be a source of national shame and outcry for reform.

                       Reducing emergency room boarding, jail bed waits and the steep price tags that come with
                       these results of bed shortages requires reducing bed demand, increasing bed supply or both.
                       As part of this survey, the Treatment Advocacy Center analyzed bed trends in 25 sample states
                       to identify public policies and practices that hold some promise in altering the bed equation.
                       The following recommendations are based on our findings and a review of research in the field.

2 n Going, Going, Gone: Trends & Consequences of Eliminating State Psychiatric Beds, 2016
RECOMMENDATIONS
1. Determine how many psychiatric beds are necessary to meet inpatient need and
set supply targets
In the mid-1950s, there were 337.0 state hospital beds per 100,000 population. This
ratio has fallen continuously to reach the woefully inadequate level of 11.7 beds per
100,000 people found in this survey. Health policy experts converge around a minimum
requirement of 40 to 60 inpatient beds per 100,000 people to meet demand. However,
empirical research to relate any bed target to desired outcomes—much less to differentiate
targets for the many categories of psychiatric need and facilities that meet them—has not
been conducted. The data and technologies exist to develop these targets. In recognition
of the national scope and consequences of the bed shortage and the need to discover a
safe minimum number of psychiatric beds, the federal government should undertake an
assessment of bed need and advance the use of tested tools to develop realistic hospital
bed targets by type, facility and setting.
2. Identify and reform public policies that incentivize bed shortages
Psychiatric bed access is exceptionally sensitive to economic incentives that, for half a
century, have overwhelmingly been directed at reducing the number of mental health
beds in America.9 Averting the extinction of the nation’s last-resort state hospital beds,
slowing the elimination of other psychiatric beds, improving access to beds that already
exist and motivating the creation of enough new beds to meet demand requires reversing
those incentives. A new Medicaid reimbursement rule finalized in April 2016 partially
repeals the discriminatory exclusion of institutions for mental diseases (“IMD Exclusion”)
and is an important step in that direction. But the rule applies only to certain Medicaid
managed care enrollees and addresses only one of the federal policies that contribute to
bed shortages. Others include Medicare reimbursement rates that are lower for psychiatric
treatment than for most other medical and surgical conditions and hospital payment
formulas weighted toward private hospitals. For the benefit of patients, their communities
and taxpayers, Congress should direct and fund appropriate agencies to undertake a
comprehensive review to identify all federal policies that create financial incentives to
close psychiatric beds, assess their economic and other impacts and make evidence-
driven reforms based on the findings.
3. Improve data collection associated with bed shortages and build public policy
on the evidence
Without outcome data, states blindly adopt and perpetuate costly practices that may
contribute to bed shortages, possibly without any offsetting public or individual benefits.
According to the OECD, “The lack of data on costs, quality and outcomes inhibits a
complete assessment of mental health system performance. The result is poor policy
and an inability to direct scarce resources to areas of need.”10 To this end, the National
Institute of Mental Health (NIMH) should fund outcome research to study the impact of
mental health policies on people with serious mental illness. States should identify and
assess how their state policies increase or decrease access to treatment for serious mental
illness, including beds, and the effectiveness of them. The public health departments of
universities should incentivize doctoral and other research projects that contribute to the
body of knowledge and the public good about psychiatric issues, including bed shortages.
Going, Going, Gone: Trends & Consequences of Eliminating State Psychiatric Beds, 2016 n 3THE DOMINO EFFECT: DYING FOR WANT OF A BED
Jamycheal Mitchell died of a heart attack after starving himself in a Virginia jail cell for three months while
waiting for a state hospital bed. He was 24.
Mitchell was arrested in April 2015 for stealing $5.05 worth of snacks from a 7-Eleven. In his delusional
state, he believed it was a relative’s store. Mitchell stopped taking his medication for schizophrenia. After his
arrest, he was evaluated, found incompetent to stand trial and court ordered into a Virginia state hospital
for restoration of his competency. Because no bed was available, he remained in jail, waiting, until he died.
Inconceivably, even starving to death in a cell has ceased to be novel.
• Keaton Farris, diagnosed with bipolar disorder and arrested for attempting to illegally cash a check,
died of malnutrition and dehydration in a Washington state jail cell in April 2015.11
• Raleigh Priester, a U.S. Army veteran with schizophrenia and a long history of arrests and hospitaliza-
tions, died in a Broward County, Florida, jail after losing half his body weight over a five-month period.12
• In North Carolina, Michael Kerr died of dehydration in March of 2014 while in solitary confinement;
the Associated Press reported he was not receiving treatment for his schizophrenia. North Carolina
reached a settlement with his estate a year later.13
The finger-pointing to fix blame for Mitchell’s death in Virginia has been intense and isn’t finished. While
it rages, other inmates continue waiting. A month after Mitchell’s death, Virginia state officials told the
Washington Post that 89 inmates, like Mitchell, had been found officially in need of a bed that wasn’t available.
Their average wait: 73 days.14
4. Increase the use of diversion strategies that reduce hospitalization rates
Tools and strategies exist to intercept and treat people with serious mental illness before
they need the last resort of a state hospital bed. None is implemented universally; some
are barely used at all. The following three evidence-based practices are associated with
reduced emergency room visits and psychiatric hospitalizations. Widely implementing
even these three would help reduce the impact of bed shortages.
a. Assisted outpatient treatment (AOT): A treatment option that utilizes a court order
to require adherence to treatment for mentally ill individuals with a history of treat-
ment nonadherence and rehospitalization or reincarceration, among other criteria
b. Assertive community treatment (ACT, which may be included in AOT plans or inde-
pendent): A multidisciplinary team approach to serving mentally ill patients where
they live
c. Sequential Intercept Model: A conceptual framework for preventing individuals with
mental illness from entering or penetrating deeper into the criminal justice system.
Among the intercepts are practices such as the use of mobile crisis teams and de-
escalation training for law enforcement officers.
And, of course, states must stop closing the beds we still have before they are no longer “go-
ing” but entirely “gone.”
Some states have built high- or medium-security forensic hospitals on prison grounds for
mentally ill inmates. The numbers of such beds are not reported in this survey, nor do we recog-
nize the strategy as a viable practice, even if it arguably could reduce demand for state hospital
beds. Beds behind bars effectively bring the criminalization of mental illness full circle—back to
4 n Going, Going, Gone: Trends & Consequences of Eliminating State Psychiatric Beds, 2016THE DOMINO EFFECT: FEWER BEDS, LONGER WAITS IN THE ER
In 2009, Sacramento County, California, eliminated 50 of the 100 beds in the county’s inpatient facility
and closed its outpatient crisis stabilization unit.* The effect of these actions on the university hospital
emergency room next door illustrates how reducing access to psychiatric treatment in one segment of
the mental health system increases the demand and strain in others.
In this case, access to both inpatient and outpatient resources was eliminated. Reduced treatment options
in the county of 1.4 million people quickly produced more psychiatric emergencies involving sicker people
who increasingly overwhelmed the local emergency room, where they waited longer for treatment and
displaced more nonpsychiatric patients.15
To assess the impact of the bed and service reductions, Arica C. Nesper and colleagues compared
emergency room use at the UC Davis Medical Center in the 8 months before the beds and outpatient
services were closed and the 8 months following. They found the following:
• The number of ER visits requiring psychiatric consultation tripled.
• The average time psychiatric patients spent waiting to be seen by a psychiatric clinician in the ER
increased from an average of 14 hours to nearly 22 hours.
• The average number of psychiatric patients held in the ER longer than 24 hours skyrocketed from
28 patients in the 8 months before the county closures to 322 in the 8 months afterward.
• The number of psychiatric consultations when the most serious symptoms of psychiatric crisis—as-
saultive or suicidal behavior—were the chief complaint ballooned from 58 to 283. The number of
patients presenting with hallucinations rocketed from 18 to 79.
• A smaller percentage of the patients—who now included more severely ill patients—were ultimately
transferred to hospital beds; more were discharged home instead.
• The number of hours that psychiatric patients occupied bed space in the ER per stay rose from
approximately 18 hours per patient to 97 hours, substantially affecting the flow of other patients
through the ER. Care for as many as 13 to 20 nonpsychiatric patients may have been delayed or
“displaced” as a result.
“Ultimately, more than a 5-fold increase occurred in daily ED (emergency department) bed hours occupied
by a patient receiving psychiatry consultation after this decrease in county mental health services,” the
authors concluded.16 In a functional mental health system, public hospitals—state and county facilities
like Sacramento’s—represent one point on a care continuum that also includes outpatient treatment
for patients on the entire spectrum of illness: community services to support stability and prevent
deterioration, hospital and residential beds to respond to acute illness, and medium- and long-term care
to support recovery, among others.
Sacramento’s experience illustrates that if there is one thing more dysfunctional than reducing access to
hospital treatment, it’s reducing access to hospital and community treatment at the same time.
Arica C. Nesper et al.
“Effect of Decreasing County Mental Health Services on the Emergency Department”
Annals of Emergency Medicine (2015)
* In states as large as California, some counties operate public hospitals.
colonial times and the early 19th century, when the mentally ill were routinely jailed or kept in “poor houses.”
Beds behind bars are not counted in this survey because we regard this practice as an inhumane and unaccept-
able public policy for the treatment of disease. We would not call it just to incarcerate a man who crashed his car
because he had a heart attack behind the wheel. Why would a just society incarcerate those with serious mental
illness for the equivalent?
Going, Going, Gone: Trends & Consequences of Eliminating State Psychiatric Beds, 2016 n 5BACKGROUND
State mental hospitals—once called asylums because they were associated with protection—
are remnants of a 19th-century reform movement to restore sanity with treatment and to
provide shelter and humane care for individuals with serious mental illness. Since the mid-20th
century, when state hospitals provided nearly 560,000 beds, a host of medical, social, political
and economic factors have converged to shrink the bed population for adults in the U.S. by
nearly 97%.
At the outset of the hospital construction era in 1850, there were 14 beds per 100,000 people
in America. By 2010, public bed populations in state hospitals had sunk back to 14.1 beds per
100,000 people from their peak of 337.0 per 100,000 people in 1955.17 By the first quarter of
2016, our survey of the states found the ratio had dropped an additional 17% to its lowest level
on record: 11.7 beds per 100,000 people.
To put this in context, the Organization for Economic Cooperation and Development (OECD)
ranks its 34 member nations—which include the United States—by their total psychiatric bed
numbers. The OECD reported an average of 68 psychiatric beds per 100,000 people among its
member states in 2011 or the nearest year available. Including state, county, general, commu-
nity and private psychiatric beds, the United States ranked 29th, with a total combined public
and private bed population of 25 beds per 100,000 people. Only New Zealand, Chile, Italy,
Turkey and Mexico provided fewer beds.18 Given the pace at which the U.S. continues closing
both public and private beds, the ranking today is likely even lower.
State hospitals play a crucial role that is duplicated rarely or unevenly elsewhere in the U.S.
health care system. They treat people in circumstances that are not, or cannot be, adequately
addressed in a community setting. This population includes
• uninsured and indigent patients,
• pretrial defendants being “restored” to competency so they can stand trial,
• criminal defendants found “unrestorable” who remain hospitalized under civil commit-
ment criteria,
• individuals who are violent or dangerous to self or others,
• jail inmates in need of psychiatric evaluation or treatment to restore their competency to
stand trial,
• defendants being evaluated for criminal responsibility in conjunction with an “insanity”
defense or for treatment in lieu of incarceration, and
• convicted prisoners in need of intensive psychiatric care.
The idea behind downsizing the state hospitals that treat these populations was fundamentally
sound: Most psychiatric patients could live safely and be treated successfully in community
facilities, provided such facilities existed. And many have. The rub came when and where the
substitute facilities did not exist—when they were not widely constructed or were constructed
and almost exclusively served more functional clients than state hospitals once did.19 The
further reality that approximately 25% of individuals with psychotic disorders do not respond
to treatment and hence are unable to rejoin the community without substantial support was
left completely unaddressed. In its report on 2010 bed populations, the Treatment Advocacy
Center called the resulting treatment gap for individuals with the most serious psychiatric
diseases “disastrous.” 20
6 n Going, Going, Gone: Trends & Consequences of Eliminating State Psychiatric Beds, 2016Since then, the situation has become beyond disastrous.
• Approximately 6,000 state hospital beds were eliminated from 2010 to early 2016 (see
Table 1). At the same time, the U.S. population grew by approximately 14 million people.
• Sixteen state hospitals in nine states closed or merged from 2010 to 2016. By July 2015,
the number of state hospitals in the United States numbered 195, down from 254 in
1997, a 24% reduction in less than 20 years.21
• County, general and private hospital beds continued to decline in tandem with state hos-
pitals. The Subcommittee on Acute Care of the New Freedom Commission appointed by
President George W. Bush reported in 2004 that the number of inpatient beds per capita
fell 43% from 1990 through 2000 and 32% in nonfederal general hospitals.22 The shrink-
age continues.
• Fewer beds resulted in people in crisis waiting longer for the ones that remained. Nearly
90% of surveyed emergency physicians reported in 2015 that mentally ill patients were
being “held” in their ERs for lack of hospital beds to admit them to, a practice known as
“boarding”23 (see “The Domino Effect: Fewer Hospital Beds, Longer Waits in the ER for
Everyone”).
• 70% of ER physician survey respondents in 2015 said their ERs boarded patients in psy-
chiatric crisis for more than 24 hours; 10% reported boarding them for a week or more.24
Table 1. State Hospital Beds Remaining in 2016
2016 TOTAL 2010 TOTAL NUMBER OF 2016 BEDS RELATION TO
STATE HOSPITAL STATE HOSPITAL BEDS LOST PER 100,000 TARGET BEDS
STATE BEDS BEDS OR GAINED POPULATION PER CAPITA
Alabama 383 1,119 -736 7.9 15.8%
Alaska 80 52 28 10.8 21.7%
Arizona 302 260 42 4.4 8.8%
Arkansas 222 203 19 7.5 14.9%
California 5,905 5,283 622 15.1 30.2%
Colorado 543 520 23 10.0 19.9%
Connecticut 615 741 -126 17.1 34.3%
Delaware 122 209 -87 12.9 25.8%
District of Columbia 282 * * 42.0 84.0%
Florida 2,648 3,321 -673 13.1 26.1%
Georgia 954 1,187 -233 9.3 18.7%
Hawaii 202 182 20 14.1 28.2%
Idaho 174 155 19 10.5 21.0%
Illinois 1,341 1,429 -88 9.3 18.7%
Indiana 818 908 -90 12.4 24.7%
Iowa 64 149 -85 2.0 4.1%
Kansas 451 705 -254 15.5 31.0%
Kentucky 499 446 53 11.3 22.6%
Louisiana 616 903 -287 13.2 26.4%
Maine 144 137 7 10.8 21.7%
Maryland 950 1,058 -108 15.8 31.6%
* District of Columbia bed numbers not collected in 2010
Going, Going, Gone: Trends & Consequences of Eliminating State Psychiatric Beds, 2016 n 7Table 1. State Hospital Beds Remaining in 2016, continued
2016 TOTAL 2010 TOTAL NUMBER OF 2016 BEDS RELATION TO
STATE HOSPITAL STATE HOSPITAL BEDS LOST PER 100,000 TARGET BEDS
STATE BEDS BEDS OR GAINED POPULATION PER CAPITA
Massachusetts 608 696 -88 8.9 17.9%
Michigan 725 530 195 7.3 14.6%
Minnesota 194 206 -12 3.5 7.0%
Mississippi 486 1,156 -670 16.2 32.5%
Missouri 874 1,332 -458 14.4 28.8%
Montana 174 194 -20 16.8 33.7%
Nebraska 289 337 -48 15.2 30.5%
Nevada 296 302 -6 10.2 20.5%
New Hampshire 158 189 -31 11.9 23.7%
New Jersey 1,543 1,922 -379 17.2 34.4%
New Mexico 229 171 58 11.0 22.0%
New York 3,217 4,958 -1,741 16.3 32.5%
North Carolina 892 761 131 8.9 17.8%
North Dakota 140 150 -10 18.5 37.0%
Ohio 1,121 1,058 63 9.7 19.3%
Oklahoma 431 401 30 11.0 22.0%
Oregon 653 700 -47 16.2 32.4%
Pennsylvania 1,334 1,850 -516 10.4 20.8%
Rhode Island 130 108 22 12.3 24.6%
South Carolina 493 426 +67 10.1 20.2%
South Dakota 128 238 -110 14.9 29.8%
Tennessee 562 616 -54 8.5 17.0%
Texas 2,236 2,129 107 8.1 16.3%
Utah 252 310 -58 8.4 16.8%
Vermont 25 52 -27 4.0 8.0%
Virginia 1,526 1,407 119 18.2 36.4%
Washington 729 1,220 -491 10.2 20.3%
West Virgina 260 259 1 14.1 28.2%
Wisconsin 458 558 -100 7.9 15.9%
Wyoming 201 115 86 34.3 68.6%
TOTALS 37,679 43,318 -5,639 11.7 23.4%
8 n Going, Going, Gone: Trends & Consequences of Eliminating State Psychiatric Beds, 2016Behind bars, a parallel treatment gap grew, with equally devastating impact.
• In 44 states and the District of Columbia, a prison or jail holds more individuals with seri-
ous mental illness than the largest remaining state psychiatric hospital.25
• Suicide is the leading cause of death in jails, yet suicide and suicide attempts represent
a small share of the acts of self-harm inmates inflict. Self-mutilation is commonplace, espe-
cially in solitary confinement, where mentally ill prisoners make up most of the population.26
• Jail and prison personnel untrained to be mental health workers are consigned to super-
vising psychotic and otherwise disordered inmates, leading to dangerous conditions and
injuries in both groups.27
• Media reports of resulting tragedies—starvation deaths like Jamycheal Mitchell’s, the al-
leged beating death of mentally ill inmate Michael Tyree by jail guards in California, the
suicide of a man who swallowed razor blades in his cell—are uncommon enough to re-
main shocking but are no longer extraordinary.
• 75% of 39 state hospitals responding to a 2014 industry survey said demand for forensic ser-
vices in their states had increased “a lot” or “moderately” in recent years. Only four states re-
ported no change in forensic service demands; none reported that demand had decreased.28
• 78% of 40 state hospital officials responding to a survey in 2015 reported maintaining
wait lists for forensic beds. The waits were “in the 30-day range” in most states, but three
states reported forensic bed waits of six months to one year.29
• A growing number of states are being sued—some repeatedly—over forensic bed waits or
other conditions involving mentally ill prisoners, and more lawsuits are threatened.
Between the two populations—mentally ill individuals inside and outside the criminal justice
system—a bed shell game with life-and-death implications has ensued. Without enough beds
to go around, states prioritize. Where bed access for patients who have committed crimes is
given priority, bed waits behind bars tend to be shorter, and fewer civil patients are served.
In states where bed access for noncriminal patients is preserved, forensic wait lists swell,
and more civil patients are served. Although the tactic doesn’t typically eliminate bed waits
completely for either population, one population benefits somewhat, at the expense of the
other (see “The Domino Effect: Treating More Forensic Patients Sooner by Treating Fewer
Civil Patients”).
The deplorable state of America’s mental health care is hardly a function of state hospital bed
shortages alone. Private and community bed shortages and a dearth of long-term residential
care options have resulted from discriminatory Medicaid and Medicare reimbursement policies.
State mental health budget cuts, which reached draconian proportions following the financial
crisis, have reduced access to mental health treatment at every stop on the way to state hos-
pitals. Mental health professionals are in dire shortage. Of the nation’s 3,100 counties, 55%
have no practicing psychiatrists, psychologists or social workers.30 Promising early-intervention
treatment models that could improve long-term outcomes of the most serious mental illnesses
rely on community-based mental health services that can’t be provided where providers don’t
exist. At the same time, an estimated 14,000 of America’s 35,000 practicing psychiatrists are
over the age of 55 and heading toward retirement, without new psychiatrists being graduated
at anywhere near a replacement rate;31,32 in states like South Dakota, state hospital bed waits
are more a function of psychiatrist shortages than bed shortages.33 Beyond the public system,
a Mayo Clinic–affiliated psychiatric unit in Wisconsin closed in March 2016 because of psychi-
atric personnel shortages.34
Meanwhile, essential residential and supported housing for patients released from hospitals are
at least as scarce as hospital beds. In November 2015, Virginia’s mental health department
Going, Going, Gone: Trends & Consequences of Eliminating State Psychiatric Beds, 2016 n 9reported that 7% of the bed capacity at one of the commonwealth’s state hospitals was oc-
cupied by “20 individuals who have been clinically ready for discharge for more than 30 days,
but have extraordinary barriers that prevent them from being reintegrated in their community
in a timely manner.” At the same time, 24 individuals were reported to be in jail waiting for one
of those beds for evaluation or treatment to restore competency.35
Comprehensive mental health care reform and practices that address treatment gaps and de-
ficiencies along the entire continuum of care are desperately needed. Until they are in place
and operating, shutting down the last resort for treatment of gravely ill people who endanger
themselves and their communities is premature, inefficient, expensive, inhumane and deadly.
THE DOMINO EFFECT:
TREATING MORE FORENSIC PATIENTS SOONER BY TREATING FEWER CIVIL PATIENTS
Colorado was sued in 2011 over its alleged failure to provide timely competency evaluations and treatment
for pretrial inmates. In 2012, the state and Disability Law Colorado, which had filed the suit on behalf of
affected inmates, reached a compromise meant to ensure that criminal defenders spent less time in jail
waiting for a bed.
Under the settlement, the state Department of Health Services agreed to complete competency evaluations
of pretrial inmates in the jails within 30 days of a court order or to admit them to the state hospital for
evaluation within 28 days. Offenders found incompetent to stand trial were to be admitted to the state
hospital or an in-jail program within 28 days of the finding. Monthly reports to Disability Law detailing
when evaluation or treatment began for each inmate were required.
The settlement agreement had the desired effect of reducing how long forensic patients waited in jail
for competency evaluations in one of the state’s two state hospitals. “The average length of stay for
defendants admitted for competency evaluations was greatly decreased, to 35 days at CMHIP (Colorado
Mental Health Institute at Pueblo) and 38 days at the Colorado Mental Health Institute at Fort Logan
(CMHIFL), as compared to 102 days prior to the lawsuit,” according to an April 2015 analysis of existing
services and future needs reported to the state’s Department of Human Services.36
However, improved conditions for forensic patients came at the expense of civil patients. “A side effect
of the settlement agreement has been fewer beds available for civil commitments,” the report said. “The
percentage of civil referrals being denied admission has increased substantially for both institutes, from
21 percent to 38 percent at CMHIP, largely due to referrals for competency evaluations.” 37
Intensifying the impact on civil patients was the length of stay for pretrial patients who require treatment
to restore their competency to stand trial. “With nearly one-quarter of these individuals staying more
than one year, CMHIP is forced to use a larger and larger portion of its civil beds to serve this population.
The combination of increased admissions and longer lengths of stay is the driving force behind a projected
shortage of beds over the next decade.” 38
The Western Interstate Commission for Higher Education, which conducted the assessment, concluded
Colorado would need to increase its state hospital bed population by 90%—from 545 to 1,033 beds—by
2025 to “keep pace with increasing forensic admissions and to maintain the current civil bed rate,” 39
which ranks 34th in the Treatment Advocacy Center’s current state survey.
Things haven’t improved since then.
In October 2015, Disability Law Colorado filed a motion accusing the Department of Human Services of
submitting “misleading and false data” in four of its required monthly reports and then covering up the
falsifications.40 In early 2016, the legislature began deliberating a bill giving sheriffs specific authority
to use jails for up to 48 hours—longer over weekends and holidays—to contain citizens who had not
committed a crime but were in psychiatric crisis if no hospital bed was available.
10 n Going, Going, Gone: Trends & Consequences of Eliminating State Psychiatric Beds, 2016METHODOLOGY
State hospital bed numbers reported in Going, Going, Gone were collected in the first quar-
ter of 2016 for patients 18 years or older. Data include voluntary and involuntary beds for
patients who enter treatment either through the civil (non-criminal) or the forensic (criminal
justice) systems.
Survey data for both bed classifications were collected in the 50 states and District of Columbia
from three principal sources:
• Official state publications, including state websites, state reports and departmental re-
ports to governors and legislative committees
• Email or telephone interviews with personnel in state mental health departments, state
hospitals, public information offices and other state agencies with access to bed statistics
• Court filings associated with lawsuits against states for their treatment of mentally ill inmates
In states where beds exist but nobody is in them because they are not staffed (e.g., Kentucky,
Minnesota, New York, Nebraska, Texas), the number of beds in operation is reported, not the
beds that are approved but empty. Child and adolescent beds, which account for about 1%
of state hospital budgets,41 were excluded. Residential and geriatric state hospital beds that
were characterized as primarily providing residential care to individuals with Alzheimer’s, senile
dementia and other age-related conditions—again, a small percentage of total beds—were ex-
cluded, as were beds for convicted sexual offenders, who are housed in state hospitals in some
states even though not mentally ill.
States were surveyed for both their forensic hospital bed allocations and patient censuses.
“Allocations” refers to the number of beds that states have been officially designated, budget-
ed and/or reserved for patients who are involved with the criminal justice system. “Census”
refers to actual occupancy. In states where civil beds are being repurposed to meet forensic
demand (e.g., Indiana, Massachusetts, Ohio), forensic bed occupancy typically exceeds fo-
rensic allocations. References to the ratio of forensic to other beds in all cases refer to
occupancy, not allocation.
More detailed forensic bed wait information was solicited from a sample of 25 states in inter-
views conducted during March and April 2016. Sample states were asked for the following data:
• Number of inmates wait-listed for a state hospital bed
• Average (mean) time from being wait-listed for a bed to being admitted to one
• Average length of stay for forensic patients found not guilty by reason of insanity
• Forensic bed occupancy rates for 2015
When necessary and available, media reports were used to validate numbers from official
sources. In each of the sample states, applicable statutes and regulations were reviewed to
identify legal parameters that might govern or influence the classification, number and/or use
of forensic beds.
Since the publication of the Treatment Advocacy Center’s first survey of hospital beds in 2008,
a per capita level of 50 psychiatric beds per 100,000 population has been widely accepted
as a credible measure of bed supply adequacy. No better evidence-based benchmark having
emerged since then, the 50/100,000 number continues to be used for comparative purposes
in this survey.
Going, Going, Gone: Trends & Consequences of Eliminating State Psychiatric Beds, 2016 n 11One strength of this study is that it contains the most complete and current state hospital bed
statistics available, including the numbers and ratios of forensic bed allocations and occupancy
to total bed populations in each state. The 25-state sample goes beyond bed counts alone to
examine bed trends in the context of applicable state laws and regulations affecting them,
which illuminates how public policies can reduce or increase bed demand.
Limitations of the study include inconsistent data sets or timing resulting from variations in the
laws that regulate state hospital beds and/or the techniques states use to collect data and re-
port their statistics. For example, some states maintain real-time bed registries; others report
bed counts weekly, monthly or annually. Forensic bed waits also are tracked and reported dif-
ferently among the states; some report daily totals, while others average waits by the week or
month. The average time inmates spend on a forensic wait list was subject to whether states
prioritized patients and on what basis, such as clinical need or date of court order.
Hospital bed numbers are subject to circumstances that can change daily, even hourly. This
affects the precision of numbers on any given date but does not materially affect the trends
they reveal.
STATISTICS MAY NOT LIE BUT THAT DOESN’T MAKE THEM TOTALLY RELIABLE
States are not always reliable sources of their own data, undermining the precision of state bed surveys,
regardless of who conducts them. The obstacles we encountered in surveying the states for Going, Going,
Gone typically fell into one of three categories.
• State officials are not knowledgeable.
A 2014 National Association of State Mental Health Program Directors (NASMHPD) report on foren-
sic mental health services noted that 41 or 42 respondents said their states recognize the insanity
defense, “including respondents from 3 of the states in which the defense formally has been abol-
ished.”42 Our survey elicited similarly conflicting answers when identical questions were posed to dif-
ferent officials within the same state. We defaulted to the answer that was corroborated elsewhere
(e.g., in a report or on the state website) or came from the official of the highest rank who had direct
knowledge of the subject.
• States report different numbers to different sources.
The state of Pennsylvania reported a total population of 2,495 state hospital beds to the NASMHPD
Research Institute in late 2015, a population of 1,531 on its official website in early 2016 and, at the
same time, a population of 1,334 to the Treatment Advocacy Center. Other states reported similarly
inconsistent statistics. We defaulted to the data state officials personally conveyed to us.
• States choose to withhold or obfuscate the truth.
Our inquiries were not always answered with complete information. In New Hampshire, a state official
hung up on the interviewer. In Illinois, state officials did not pick up the telephone or return calls or
emails left during a two-month period; ultimately, a University of Chicago law professor was recruited
to find a responsive state official for us. In Colorado, Disability Law Colorado filed a motion in federal
court accusing the state of falsifying its court-ordered monthly reports on forensic bed waits.
12 n Going, Going, Gone: Trends & Consequences of Eliminating State Psychiatric Beds, 2016FINDINGS
In 2015, there were an estimated 8.1 million individuals with schizophrenia or severe bipolar
disorder in the United States, about half of them untreated at any given time.43 Because of the
severity of their symptoms when untreated and their heightened risk of being arrested and/or
impoverished as a result, these are the citizens most likely to be admitted to a last-resort bed
in a state hospital, as either civil or forensic patients.
Our 2016 survey of state psychiatric bed populations found the following:
• 37,679 staffed beds remained in state hospitals. This represented a 17% reduction in the
bed population since 2010, when 43,318 beds remained.44
• 11.7 beds remained per 100,000 population. This compares with an average of about 68
beds per 100,000 people in the Organization for Economic Cooperation and Development
(OECD) and marked the lowest per capita state bed availability since the nation began
decriminalizing mental illness in the 1850s.45
• Of the 11.7 beds per 100,000 population, roughly half were available to civil psychiatric
patients—people who had not committed crimes.
• “Boarding” psychiatric patients in emergency rooms while waiting for beds somewhere in
the psychiatric inpatient system was virtually universal.46
• Of the 11.7 beds per 100,000 population, the other half were occupied by forensic pa-
tients admitted to the hospital via the criminal justice system. In two states, Hawaii and
Missouri, all of them were.
• Because far more inmates are in need of or ordered by courts into hospitals than there
are beds for them, they are placed on wait lists in most states, sometimes for months.47
• Those states without long forensic bed waits often have avoided them by diverting civil beds
to forensic uses, leading to longer waits in the ERs where the civil patients accumulate.
• A growing number of states are resorting to hospital beds behind bars—psychiatric treat-
ment facilities operated as part of the state’s penal system.
Survey of the States
Our 2012 survey report, No Room in the Inn found that, in 2010, 11 states continued to pro-
vide at least 20 psychiatric beds per 100,000 population.48 About 51 million people lived in
those states. By the first quarter of 2016, only 2 states continued to provide at least 20 beds
for each 100,000 people: Wyoming and the District of Columbia. They were home to roughly
1.2 million of America’s 321 million residents (see Table 2).
In 16 states, fewer than 10 beds remained per 100,000 people by early 2016: Alabama, Ari-
zona, Arkansas, Georgia, Illinois, Iowa, Massachusetts, Michigan, Minnesota, North Carolina,
Ohio, Tennessee, Texas, Utah, Vermont and Wisconsin.
In 4 states, fewer than 5 beds remained per 100,000 population: Arizona, Iowa, Minnesota
and Vermont. Arizona, Iowa and Minnesota were also at the bottom of the rankings in 2010;
Vermont lost its state hospital to Hurricane Irene in 2012 and only recently restored some of
those beds.
Going, Going, Gone: Trends & Consequences of Eliminating State Psychiatric Beds, 2016 n 13Table 2. State Hospital Bed Populations by State and Rank
2010 TOTAL 2016 TOTAL
STATE 2010 BEDS RANK STATE 2016 BEDS RANK
HOSPITAL PER 100,000 AMONG THE HOSPITAL PER 100,000 AMONG THE
STATE BEDS POPULATION STATES BEDS POPULATION STATES
Iowa 149 4.9 48 64 2.0 51
Minnesota 206 3.9 50 194 3.5 50
Vermont 52 8.3 42–43 25 4.0 49
Arizona 260 4.1 49 302 4.4 48
Michigan 530 5.4 47 725 7.3 47
Arkansas 203 7.0 46 222 7.5 46
Alabama 1,119 23.4 5 383 7.9 44–45
Wisconsin 558 9.8 37 458 7.9 44–45
Texas 2,129 8.5 41 2,236 8.1 43
Utah 310 11.2 27–28 252 8.4 42
Tennessee 616 9.7 38 562 8.5 41
North Carolina 761 8.0 44 892 8.9 39–40
Massachusetts 696 10.6 31 608 8.9 39–40
Illinois 1,429 11.1 29 1,341 9.3 37–38
Georgia 1,187 12.3 26 954 9.3 37–38
Ohio 1,058 9.2 39–40 1,121 9.7 36
Colorado 520 10.3 35 543 10.0 35
South Carolina 426 9.2 39 373 7.5 34
Washington 1,220 18.1 17 729 10.2 32–33
Nevada 302 11.2 27–28 296 10.2 32–33
Pennsylvania 1,850 14.6 20 1,334 10.4 31
Idaho 155 9.9 36 174 10.5 30
Maine 137 10.3 32–35 144 10.8 28–29
Alaska 52 7.3 45 80 10.8 28–29
New Mexico 171 8.3 42–43 229 11.0 26–27
Oklahoma 401 10.7 30 431 11.0 26–27
Kentucky 446 10.3 32–35 499 11.3 25
New Hampshire 189 14.4 21 158 11.9 24
Rhode Island 108 10.3 32–35 130 12.3 23
Indiana 908 14.0 24 818 12.4 22
Delaware 209 23.3 6 122 12.9 21
Florida 3,321 17.7 18 2,648 13.1 20
Louisiana 903 19.9 12 616 13.2 19
West Virgina 259 14.0 23–24 260 14.1 17–18
Hawaii 182 13.4 25 202 14.1 17–18
Missouri 1,332 22.2 8 874 14.4 16
South Dakota 238 29.2 2 128 14.9 15
California 5,283 14.2 22 5,905 15.1 14
14 n Going, Going, Gone: Trends & Consequences of Eliminating State Psychiatric Beds, 2016Table 2. State Hospital Bed Populations by State and Rank, continued
2010 TOTAL 2016 TOTAL
STATE 2010 BEDS RANK STATE 2016 BEDS RANK
HOSPITAL PER 100,000 AMONG THE HOSPITAL PER 100,000 AMONG THE
STATE BEDS POPULATION STATES BEDS POPULATION STATES
Nebraska 337 18.5 14 289 15.2 13
Kansas 705 24.7 4 451 15.5 12
Maryland 1,058 18.3 15–16 950 15.8 11
Oregon 700 18.3 15–16 653 16.2 9–10
Mississippi 1,156 39.0 1 486 16.2 9–10
New York 4,958 25.6 3 3,217 16.3 8
Montana 194 19.6 13 174 16.8 7
Connecticut 741 20.7 10 615 17.1 6
New Jersey 1,922 21.9 9 1,543 17.2 5
Virginia 1,407 17.6 19 1,526 18.2 4
North Dakota 150 22.3 7 140 18.5 3
Wyoming 115 20.4 11 201 34.3 2
District of Columbia * * * 282 42.0 1
TOTALS 43,318 14.1 37,679 11.7
* District of Columbia bed numbers not collected in 2010
In 18 states, sufficient additional beds were added from 2010 to 2016 for the per capita rate
to rise. In no state, however, did the increase boost a state’s ratio to 20 beds per 100,000
popu-lation from the teens or below.* In most states, the increase simply made an
abysmal ratio marginally less abysmal. For example, Arizona’s beds per capita, which ranked
49th among the states in 2010 at 4.1 beds per 100,000 people, rose to 4.4. West Virginia
rose from 14.0 beds per 100,000 to 14.1. Given how fluid jail census numbers are, “growth”
this miniscule is as likely to be a statistical fluke as a sign of any real improvement.
Merely counting beds and reporting their ratio to state populations, however, does not fully
reveal the trends and consequences of the bed shortage.
As the ER boarding data show, when beds are not available, people in psychiatric crisis back up
in hospital emergency rooms or, worse, are discharged with no care at all, a practice known as
“streeting.”49 When beds are not available for mentally ill inmates, their numbers grow in jail
and prison cells, including solitary confinement.
Before deinstitutionalization, jails and prisons held relatively few mentally ill inmates. This
made for few forensic patients for state hospitals to treat. By 2014, a prison or jail held more
individuals with serious mental illness than the largest remaining state psychiatric hospital in
44 states and the District of Columbia. At least 20% of jail and prison inmates were estimated
to suffer from a serious mental illness, though sheriffs around the country occasionally report
populations running as high as 50% in their jails.50
* Wyoming, which reached 34.3 beds in 2016, already ranked 11th among the states in 2010, with 20.4 beds per
100,000 people. District of Columbia was not ranked in 2010.
Going, Going, Gone: Trends & Consequences of Eliminating State Psychiatric Beds, 2016 n 15Table 3. Forensic Bed Populations by State
TOTAL STATE DESIGNATED % OF ALL BEDS CENSUS OF % OF ALL BEDS
HOSPITAL FORENSIC DESIGNATED FORENSIC OCCUPIED
STATE BEDS BEDS FORENSIC PATIENTS FORENSIC
Alabama 383 115 30.0 115 30.0
Alaska 80 10 12.5 10 12.5
Arizona 302 143 47.4 143 47.4
Arkansas 222 126 56.8 156 70.3
California 5,905 4,412 74.7 4,412 74.7
Colorado 543 184 33.9 184 33.9
Connecticut 615 232 37.7 232 37.7
Delaware 122 42 34.4 42 34.4
District of Columbia 282 0 0.0 158 56.0
Florida 2,648 1,124 42.4 1,559 58.9
Georgia 954 641 67.2 641 67.2
Hawaii 202 198 98.0 198 98.0
Idaho 174 55 31.6 55 31.6
Illinois 1,341 802 59.8 896 66.8
Indiana 818 88 10.8 267 32.6
Iowa 64 0 0.0 38 59.4
Kansas 451 200 44.3 200 44.3
Kentucky 499 0 0.0 0 0.0
Louisiana 616 70 11.4 70 11.4
Maine 144 44 30.6 47 32.6
Maryland 950 853 89.8 853 89.8
Massachusetts 608 0 0.0 70 11.5
Michigan 725 210 29.0 384 53.0
Minnesota 194 0 0.0 0 0.0
Mississippi 486 35 7.2 35 7.2
Missouri 874 874 100.0 874 100.0
Montana 174 59 33.9 59 33.9
Nebraska 289 67 23.2 67 23.2
Nevada 296 76 25.7 76 25.7
New Hampshire 158 0 0.0 0 0.0
New Jersey 1,543 200 13.0 471 30.5
New Mexico 229 44 19.2 44 19.2
New York 3,217 720 22.4 720 22.4
North Carolina 892 84 9.4 236 26.5
North Dakota 140 65 46.4 65 46.4
Ohio 1,121 0 0.0 714 63.7
Oklahoma 431 200 46.4 200 46.4
Oregon 653 416 63.7 439 67.2
Pennsylvania 1,334 236 17.7 236 17.7
Rhode Island 130 28 21.5 28 21.5
South Carolina 493 215 43.6 215 43.6
16 n Going, Going, Gone: Trends & Consequences of Eliminating State Psychiatric Beds, 2016Table 3. Forensic Bed Populations by State, continued
TOTAL STATE DESIGNATED % OF ALL BEDS CENSUS OF % OF ALL BEDS
HOSPITAL FORENSIC DESIGNATED FORENSIC OCCUPIED
STATE BEDS BEDS FORENSIC PATIENTS FORENSIC
South Dakota 128 0 0.0 0 0.0
Tennessee 562 0 0.0 100 17.8
Texas 2,236 1,047 46.8 1,216 54.4
Utah 252 100 39.7 100 39.7
Vermont 25 0 0.0 10 40.0
Virginia 1,526 356 23.3 356 23.3
Washington 729 138 18.9 138 18.9
West Virgina 260 0 0.0 95 36.5
Wisconsin 458 349 76.2 349 76.2
Wyoming 201 28 13.9 28 13.9
TOTALS 37,679 14,886 17,601
When inmates require psychiatric evaluation or treatment, the state hospital is the most com-
mon—in many circumstances, the only—facility where they can be admitted. Our survey of the
states found the following with regard to forensic patients (see Table 3):
• In 15 states, more than 50% of the remaining state hospital beds were occupied by
foren-sic patients: Arkansas, California, District of Columbia, Florida, Georgia, Hawaii,
Illinois, Iowa, Maryland, Michigan, Missouri, Ohio, Oregon, Texas and Wisconsin.
• In an additional 19 states, forensic patients occupied 25% to 49% of the state hospi-tal
beds: Alabama, Arizona, Colorado, Connecticut, Delaware, Idaho, Indiana, Kansas,
Maine, Montana, Nevada, New Jersey, North Carolina, North Dakota, Oklahoma, South
Carolina, Utah, Vermont and West Virginia.
• In two states—Hawaii and Missouri—officials reported the state hospitals were essentially
100% dedicated to forensic use.
• In only one state—Mississippi—did forensic patients occupy fewer than 10% of the state
hospital beds.
• Of the roughly 6 forensic beds per 100,000 population, 50.5% of those in our sample
of 25 states were occupied by patients found not guilty by reason of insanity, who may
spend decades or their entire remaining lifetimes in the hospital. This effectively left 3
beds per 100,000 people for mentally ill inmates in need of pretrial services or other in-
patient treatment.
• Three states reported no forensic beds because they provide psychiatric treatment to
inmates entirely in forensic units at state prisons: Kentucky, New Hampshire and South
Dakota. The move to beds behind bars does not guarantee a sufficient supply of beds for
demand: In Kentucky, an average of 37 inmates waited an average of three weeks each
for a bed in the first quarter of 2016.51
• State hospital budgets reflect the shift from civil to forensic treatment. In 1990, 10% of
state psychiatric hospital expenditures were for forensic services; by 2010, the figure had
risen to 40%52 and was still going up (see Figure 1).
Going, Going, Gone: Trends & Consequences of Eliminating State Psychiatric Beds, 2016 n 17Figure 1. Forensic and Sex Offender Expenditures as a Percentage of
State Psychiatric Hospital Expenditures Fiscal Years 2001 to 2010
100%
95%
90%
PERCENTAGE OF STATE PSYCHIATRIC
85%
80%
HOSPITAL EXPENDITURES
75%
70%
65%
60%
55%
50%
45%
40%
35%
30%
25%
20%
15%
10%
5%
0%
2001 2002 2003 2004 2005 2006 2007 2008 2009 2010
STATE FISCAL YEAR
Source: National Association of State Mental Health Program Directors Research Institute. (2012).
FY 2010 State Mental Health Revenues and Expenditures. Retrieved from http://media.wix.com/
ugd/186708_c6beb833346b45429322cc4421d83aa1.pdf
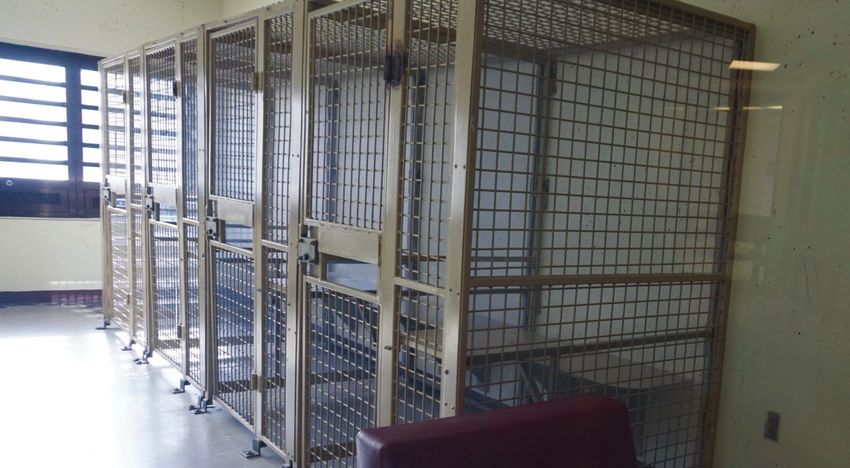
In a bizarre display of how thoroughly mental illness is returning to its status as a criminal
condition, New Hampshire authorizes civil patients who have committed no crime to be treated
inside the state’s Secure Psychiatric Unit—a prison. Figure 2 is a photograph of the cages where
group therapy sessions are conducted for civilly committed patients.
A bill to prohibit the practice was introduced this year but referred for study, which means it
passed no committee or legislative chamber and received no hearing. Meanwhile, over the
state line, a Maine bill to authorize transferring selected patients from the state hospital in
Augusta to a prison psychiatric unit like New Hampshire’s fell short of passage by one vote in
April. The candidate patients also were people who had not been charged with or convicted
of crimes.
Figure 2. Group Therapy Booths for Civil Patients
in the New Hampshire Secure Psychiatric Unit
Source: Nancy West, New Hampshire Center for Public Interest Journalism
18 n Going, Going, Gone: Trends & Consequences of Eliminating State Psychiatric Beds, 2016Families and friends of the mentally ill routinely report that police officers, mental health work-
ers and other families advise that the most reliable way for their loved one to get treatment
is to be arrested. The dwindling number of beds for patients who haven’t committed crimes is
one explanation (see Table 4).
• In only 13 states do at least 10 nonforensic beds remain per 100,000 people: Con-
necticut, District of Columbia, Kentucky, Louisiana, Mississippi, Montana, Nebraska, New
Hampshire, New Jersey, New York, South Dakota, Virginia and Wyoming.
• In 22 states, only 5 to 9 civil beds are available per 100,000 people.
• In 16 states—including the 2 where no civil beds remain—fewer than 5 civil beds remain
for each 100,000 people.
Table 4. State Hospital Bed Population by Legal Status
CIVIL BEDS FORENSIC BEDS TOTAL BEDS
PER 100,000 PER 100,000 PER 100,000
STATE POPULATION POPULATION POPULATION*
Alabama 5.5 2.4 7.9
Alaska 9.5 1.4 10.8
Arizona 2.3 2.1 4.4
Arkansas 2.2 5.2 7.5
California 3.8 11.3 15.1
Colorado 6.6 3.4 10.0
Connecticut 10.7 6.5 17.1
Delaware 8.5 4.4 12.9
District of Columbia 18.4 23.5 42.0
Florida 5.4 7.7 13.1
Georgia 3.1 6.3 9.3
Hawaii 0.3 13.8 14.1
Idaho 7.2 3.3 10.5
Illinois 3.9 5.4 9.3
Indiana 8.3 4.0 12.4
Iowa 0.8 1.2 2.0
Kansas 8.6 6.9 15.5
Kentucky 11.3 0.0 11.3
Louisiana 11.7 1.5 13.2
Maine 7.3 3.5 10.8
Maryland 1.6 14.2 15.8
Massachusetts 7.9 1.0 8.9
Michigan 3.4 3.9 7.3
Minnesota 3.5 0.0 3.5
Mississippi 15.1 1.2 16.2
Missouri 0.0 14.4 14.4
Montana 11.1 5.7 16.8
* Inconsistencies in totals are due to rounding.
Going, Going, Gone: Trends & Consequences of Eliminating State Psychiatric Beds, 2016 n 19Table 4. State Hospital Bed Population by Legal Status, continued
CIVIL BEDS FORENSIC BEDS TOTAL BEDS
PER 100,000 PER 100,000 PER 100,000
STATE POPULATION POPULATION POPULATION*
Nebraska 11.7 3.5 15.2
Nevada 7.6 2.6 10.2
New Hampshire 11.9 0.0 11.9
New Jersey 12.0 5.3 17.2
New Mexico 8.9 2.1 11.0
New York 12.6 3.6 16.3
North Carolina 6.5 2.3 8.9
North Dakota 9.9 8.6 18.5
Ohio 3.5 6.1 9.7
Oklahoma 5.9 5.1 11.0
Oregon 5.3 10.9 16.2
Pennsylvania 8.6 1.8 10.4
Rhode Island 9.7 2.7 12.3
South Carolina 5.7 4.4 10.1
South Dakota 14.9 0.0 14.9
Tennessee 7.0 1.5 8.5
Texas 3.7 4.4 8.1
Utah 5.1 3.3 8.4
Vermont 2.4 1.6 4.0
Virginia 14.0 4.2 18.2
Washington 8.2 1.9 10.2
West Virgina 8.9 5.2 14.1
Wisconsin 1.9 6.0 7.9
Wyoming 29.5 4.8 34.3
TOTALS 6.2 5.5 11.7
* Inconsistencies in totals are due to rounding.
Another reason why the public views law enforcement and jails as the most accessible routes
for mental health crisis intervention are well-publicized developments like these:
• In California, the Tehama County sheriff and Health Services Agency asked the Board of
Supervisors to declare the jail a mental health treatment facility so mentally ill inmates
can be medicated over objection there.53 State law prohibits involuntary medication out-
side a state hospital or designated facility.
• In Colorado, legislation was under consideration to authorize jails to be used in lieu of
hospitals when no bed is available for individuals in psychiatric crisis who have not com-
mitted crimes, for up to 48 hours or longer over weekends and holidays.54
20 n Going, Going, Gone: Trends & Consequences of Eliminating State Psychiatric Beds, 2016You can also read