CHHATTISGARH Health Labour Market Analysis: WHO and State Health Resource Centre, Chhattisgarh - World Health ...
←
→
Page content transcription
If your browser does not render page correctly, please read the page content below
Health Labour
               Market Analysis:
          CHHATTISGARH

                 Jointly prepared by
WHO and State Health Resource Centre, Chhattisgarh
                       for the
Department of Health and Family Welfare, Chhattisgarh

                  September 2019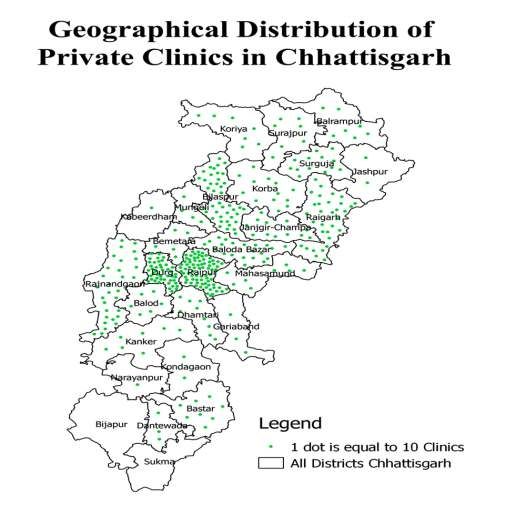
Health Labour
               Market Analysis:
          CHHATTISGARH
                 Jointly prepared by
WHO and State Health Resource Centre, Chhattisgarh
                       for the
Department of Health and Family Welfare, Chhattisgarh

                  September 2019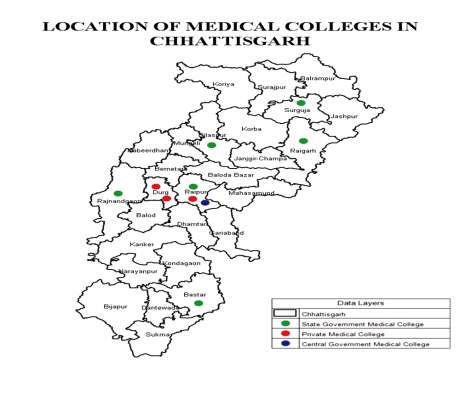
Health Labour Market Analysis: CHHATTISGARH

ISBN: 978-92-9022-781-6

© World Health Organization 2020

Some rights reserved. This work is available under the Creative Commons Attribution-NonCommercial-
ShareAlike 3.0 IGO licence (CC BY-NC-SA 3.0 IGO; https://creativecommons.org/licenses/by-nc-sa/3.0/igo).

Under the terms of this licence, you may copy, redistribute and adapt the work for non-commercial purposes,
provided the work is appropriately cited, as indicated below. In any use of this work, there should be no
suggestion that WHO endorses any specific organization, products or services. The use of the WHO logo is not
permitted. If you adapt the work, then you must license your work under the same or equivalent Creative
Commons licence. If you create a translation of this work, you should add the following disclaimer along with the
suggested citation: “This translation was not created by the World Health Organization (WHO). WHO is not
responsible for the content or accuracy of this translation. The original English edition shall be the binding and
authentic edition”.

Any mediation relating to disputes arising under the licence shall be conducted in accordance with the
mediation rules of the World Intellectual Property Organization.

Suggested citation. Health Labour Market Analysis: CHHATTISGARH. New Delhi, India: World Health
Organization, Country office for India; 2020. Licence: CC BY-NC-SA 3.0 IGO.

Cataloguing-in-Publication (CIP) data. CIP data are available at http://apps.who.int/iris.

Sales, rights and licensing. To purchase WHO publications, see http://apps.who.int/bookorders. To submit
requests for commercial use and queries on rights and licensing, see http://www.who.int/about/licensing.

Third-party materials. If you wish to reuse material from this work that is attributed to a third party, such as
tables, figures or images, it is your responsibility to determine whether permission is needed for that reuse and
to obtain permission from the copyright holder. The risk of claims resulting from infringement of any third-party-
owned component in the work rests solely with the user.

General disclaimers. The designations employed and the presentation of the material in this publication do not
imply the expression of any opinion whatsoever on the part of WHO concerning the legal status of any country,
territory, city or area or of its authorities, or concerning the delimitation of its frontiers or boundaries. Dotted and
dashed lines on maps represent approximate border lines for which there may not yet be full agreement.

The mention of specific companies or of certain manufacturers’ products does not imply that they are endorsed
or recommended by WHO in preference to others of a similar nature that are not mentioned. Errors and
omissions excepted, the names of proprietary products are distinguished by initial capital letters.

All reasonable precautions have been taken by WHO to verify the information contained in this publication.
However, the published material is being distributed without warranty of any kind, either expressed or implied.
The responsibility for the interpretation and use of the material lies with the reader. In no event shall WHO be
liable for damages arising from its use.

Printed in India
Contents

Acknowledgements                                                                    i
Abbreviations and acronyms                                                        iii
Executive summary                                                                 1
Chapter 1: Introduction                                                            4
1.1 Background                                                                     4
1.2 Objectives                                                                     7
1.3 Framework and methods                                                          9
Chapter 2: Adequacy of production and recruitment of MOs in Chhattisgarh          11
2.1   Government MOs                                                              11
2.2   Availability of private doctors                                             19
2.3   Population per doctor in Chhattisgarh                                       21
2.4   Production of MBBS doctors in Chhattisgarh                                  21
2.5   Matching regional and caste category-wise vacancies to production           24
2.6   AMOs                                                                        27
2.7   Dental surgeons                                                             29
2.8   Ayurvedic and homoeopathic doctors                                          30
2.9   Summary and policy recommendations regarding production and adequacy of
      MOs in Chhattisgarh                                                         31
Chapter 3: Adequacy of production and recruitment of specialist doctors in
Chhattisgarh                                                                      33
3.1   Specialists (regular appointments) under DHS                                33
3.2   Specialists (contractual appointments) under DHS                            36
3.3   Availability of specialists                                                 36
3.4   Supply of specialists in Chhattisgarh                                       38
3.5   Policy recommendations                                                      39
Chapter 4: Adequacy of production and recruitment of nurses in Chhattisgarh       41
4.1   Main types of nurse cadres in Chhattisgarh                                  41
4.2   Staff nurses                                                                 41
4.3   Addressing the paradox of having vacancies and a potential overproduction   45
4.4   Policy recommendations                                                      47
4.5   Auxiliary nurse midwife                                                     48
Chapter 5: HR for rolling out the HWCs in Chhattisgarh                            49
5.1 HWCs in Chhattisgarh                                                          49
5.2 Current model for operationalization of HWCs in Chhattisgarh                  50
5.3 Future of the biweekly AMO clinic model in HWCs                               51
5.4 Production capacity for MLHPs                                                 51
5.5 Should Chhattisgarh consider dental surgeons, ayurvedic doctors and
    homoeopathic doctors for MLHP role in HWCs?                                   53
5.6 The primary health care team at HWCs other than MLHPs                         53
5.7 Discussion and recommendations                                                55
Chapter 6: Conclusions and recommendations                                        56
6.1   Key HRH strengths and best practices in Chhattisgarh                        56
6.2   Workforce of the future for Chhattisgarh                                    56
6.3   MOs                                                                         57
6.4   Specialist cadre                                                            59
6.5   Nurses                                                                      60
6.6   HWCs and MLHPs                                                              60
6.7   Key questions                                                               61
6.8   Action points based on discussions on HLMA with Departments of
      Health and Family Welfare and Medical Education, Chhattisgarh               61
References                                                                        63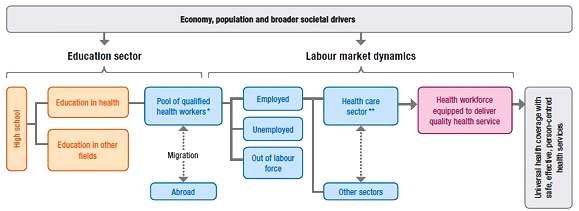

Acknowledgements

We would like to thank the Department of Health and Family Welfare and Medical Education,
Government of Chhattisgarh for their continuous support through the Health Labour Market
Analysis (HLMA) process. The exercise could be completed successfully due to the data
provided by Directorate of Health Services, Directorate of Medical Education and the National
Health Mission State unit, Chhattisgarh. We also thank the deputy directors and officers on
special duty who manage human resources related functions in the above directorates along
with their teams. They provided the necessary data for most of the analysis contained in this
report.

In particular, we thank the following participants from the government, private sector and civil
society who gave their inputs during the stakeholder consultations:

State Health Secretariat Ms Niharika Barik Singh – Secretary, Department of Health and Family
Welfare and Department of Medical Education, Government of Chhattisgarh

National Health Mission                            Dr Priyanka Shukla – Mission Director,
                                                   National Health Mission, Chhattisgarh
                                                   Dr SK Pambhoi – Deputy Director NHM

State Health Directorate                           Dr Deepak Agrawal – Joint Director
                                                   Establishment
                                                   Dr BR Soni – Deputy Director Nursing
                                                   ervices
                                                   Dr KC Urao – Deputy Director Health
                                                   Services
                                                   Dr Kamlesh Jain – State Programme Officer
                                                   HWC
                                                   Mr Prem Verma – OSD AMO/
                                                   Establishment, DHS

State Health Systems Resource Centre               Dr Prabir Chatterjee – Executive Director
                                                   Dr Samir Garg – Chief Programme
                                                   Coordinator

Directorate of Medical Education                   Dr SL Adile – Director of Medical Education

Chief Medical and Health Officer (CMHO) Office         Dr KS Shandilya – CMHO, Raipur

State Nursing Council                              Ms Durgavati Usare – Registrar of State
                                                   Nursing Council

District Hospital                                  Dr Ravi Tiwari – Civil Surgeon
                                                   Dr Rajesh Sharma – Government’s
                                                   interface with IMA

Community Health Centre, Abhanpur                  Dr A Jha – Block Medical Officer

Health & Wellness Centre                           Dr Bharati Sahu – AMO, HWC, Ganaud

Civil society                                      Dr Yogesh Jain – Founder-Director, Jan
                                                   Swasthya Sahyog

Private sector                                     Dr Rakesh Gupta – Indian Medical
                                                   Association, Chhattisgarh

                                               i
Project team
State Health Resource Centre, Chhattisgarh
Dr Samir Garg, Chief Programme Coordinator
Mr Narayan Tripathi, Programme Coordinator
Dr Bhargav Deshpande, Short-term Consultant
Dr Prabir K Chatterjee, Executive Director
World Health Organization
Dr Tomas Zapata – Regional Advisor Human Resources, South East Asia
Dr Pascal Zurn – Coordinator Health Workforce Department, Headquarters
Dr Michelle McIsaac – Labour Economist Health Workforce Department, Headquarters
Dr Dilip Mairembam – Health Systems Country Office for India
Dr Hilde De Graeve – Health Systems Country Office for India
State Health Department
Ms Niharika Barik – Secretary, Health and Family Welfare, Government of Chhattisgarh
Dr Priyanka Shukla – Mission Director, National Health Mission, Chhattisgarh and Director,
Family Welfare, Chhattisgarh
iiAbbreviations and acronyms
AMO assistant medical officer
ANM auxiliary nurse midwife
AMO assistant medical officer
ASHA accredited social health activist
CHC community health centre
CHO community health officer
CHW community health worker
CPHC comprehensive primary health care
CRMC Chhattisgarh Rural Medical Corps
DH district hospital
DHS Directorate of Health Services
DME Directorate of Medical Education
DoHFW Directorate of Health and Family Welfare
GHE government health expenditure
GNM general nurse midwife
GSDP Gross State Domestic Product
HLM health labour market
HLMA health labour market analysis
HR human resources
HRH human resources for health
HW health worker
HWC health and wellness centre
IGNOU Indira Gandhi National Open University
MCI Medical Council of India
MLHP Mid-Level Healthcare Provider'
iiiMO Medical officer
MoHFW Ministry of Health & Family Welfare
MPHW multipurpose health worker
NCD noncommunicable disease
NHM National Health Mission
NPA non-practising allowance
NRHM National Rural Health Mission
NSSO National Sample Survey Organization
NUHM National Urban Health Mission
OOPE out-of-pocket expenditure
PG postgraduate
PHC primary health centre
PSC Public Service Commission
RCH reproductive and child health
RMA rural medical assistant
SHC sub-health centre
SN staff nurse
SNCU special newborn care unit
ST scheduled tribe
THE total health expenditure
TWG Technical Working Group
UHC universal health coverage
WHO World Health Organization
viExecutive summary
The scope of this health labour market analysis was to provide a detailed examination of the
state of the health labour market in Chhattisgarh in order to provide an insight into key human
resources for health and the bottlenecks and opportunities in the State. The report focused on
Medical Officers, specialist doctors, nurses and the roll-out of health and wellness centres.
This analysis was conducted using data made available from the Department of Health. The
macroeconomic situation, production, absorption capacity and distribution aspects were
analysed, with the main focus of this study centred around key policy questions. Based on the
results of the analysis, nine main issues related to the policy questions were highlighted and
recommendations and policy options were proposed.
These recommendations, which are specific to the context of Chhattisgarh, are based on
information and data gathered for this report. They are summarized in the table below.
Issue Recommendation Policy options
MOs and specialist doctors
Unmet need for Promote v Introducing task-shifting from
specialty care diploma/alternative short specialists to MOs in DHs and
training courses and CHCs
Shortage of specialists v MOs (without PG qualification) to be
task-shifting
in DHs and CHCs trained in essential surgeries,
diagnosis and treatment of common
diseases of secondary-level care
and given permission and
incentives to perform these
procedures
v Restart Family Medicine PG
diploma course and recognize it as
specialization under DHS
v Start other multi-skilling courses
v Adopt the NHM flexible norms for
engaging visiting specialists for
fixed days or surgeries
v Greater use of existing mechanisms
like DNB
High vacancy rates of Improve recruitment v Direct recruitments of specialists in
MOs and specialists, process regular appointments of DHS by
especially in rural and modifying selection rules
remote areas v Regular recruitment drives (at least
one annually)
v Campus selection (in and out of the
State)
v Interaction with medical students in
the State during internship
v Better deployment strategy for and
PGs on bond
v Transparent deployment (allocation
of locations of posting) according to
merit
v Facilitate recruitment of regular
posts from outside the State by
introducing flexibility in the selection
process
1Improve supportive v Facilitate enrolment of rural
services and other students
benefits to improve v Improve financial and non-financial
retention in remote areas incentives in less desirable
locations. Provide free hostel
accommodation, transport, etc.
v Ensure career pathway is improved
by serving in rural and remote areas
by the following:
o points in PG entrance for MOs
serving in tribal areas
o sponsor MOs in rural, remote and
tribal areas to attend special PG
family medicine courses (post
MBBS)
o time-bound transfer option for
doctors posted in tribal areas
o compulsory posting (around 20%
part of career) in tribal areas for
every regular MO/specialist
o making at least 3-year service in
tribal areas compulsory for
promotions
AMOs
Lack of coherent Improve administration of v Introducing policy to facilitate
administration AMOs transitioning from contractual to
procedures for AMOs regular AMO
v Creating an attractive career
pathway for this cadre
Improve capacity of v Invest further in their skills
AMOs
Nurses
Inefficiencies in Develop a more effective v Developing fast-track time-bound
recruitment process and transparent recruitment policies to fill vacancies
recruitment process (simplify procedures, reinforce
administrative capacity, have better
coordination between Department
of Health and Ministry of Finance,
make the recruitment and
deployment more transparent, etc.)
v Focus on DME, which has very high
regular nurses vacancies
v Have a regular annual recruitment
drive. This will allow a better match
between demand and supply
v Proactively identify unemployed
nurses and retrain/train them,
including for the roll-out of the health
and wellness centres
v Prioritize recruitment of nurses who
have been trained through
government-sponsored schemes
2Concern for quality Improve accreditation v Strengthen regulation to improve
standards in education and quality control quality of education in private
and training mechanisms for all nursing schools in preference to
quantity
educational institutions
Excess production of v Decide seats in the private sector
nurses leading to poor based on market availability and
remuneration and demand for nurses
unemployment v Start nurse mentoring programmes
High salary difference Reduce the salary gap v Increase the salary of contractual
between contractual and between contractual and nurses
regular nurses regular nurses v Give extra points for experience in
contractual jobs when recruiting for
regular posts
v Convert contractual nurses to
regular cadre after a minimum
length of service
Workforce elements to consider for health and wellness centres (HWCs)
Education and training v Ensuring quality in training of MLHPs, their continuous skill
building on the job and mentoring
Roles and v Clarify role of HWCs, and thereby MLHPs, in curative care, i.e.
responsibilities the approach should be “resolve more and refer some” and not
mainly referral based
v Ensure two ANMs per HWC, completing recruitments of
sanctioned posts of second ANM
v Team-building of HWC workforce
v Dovetail roles between AMOs and nurse MLHPs
v Equitable incentives for ANMs and staff other than MLHPs
v Redefine the role of male MPWs, to align with the required
functions in HWCs
DHS – Directorate of Health Services; DNB – Diplomate of National Board; NHM – National Health Mission; NPA
– non-practising allowance; DME – Director AMO – assistant medical officer; DME – Directorate of Medical
Education; MLHP – Mid-Level Healthcare Provider; HWC – health and wellness centre; ANM – auxiliary nurse
midwive; MPHW – multipurpose health
A set of action points were derived based on discussions on the health market labour analysis
(HLMA) results with the Department of Health. It was further recommended to set up a Technical
Working Group (TWG) to periodically review the progress on the above recommendations.
3Chapter 1: Introduction
1.1 Background
Chhattisgarh is a relatively young state in India. It was carved out of Madhya Pradesh in 2000
and is currently one of the poorest states in India. Chhattisgarh ranked among the bottom three
out of 29 states in India in terms of consumption expenditure in 2011–2012 (1). The area covered
by the State was the most neglected part of Madhya Pradesh. As such, it inherited a rather
underdeveloped health system and large deficiencies in trained human resources for health
(HRH) and infrastructure. The State has a population of around 280 million (2019 figures) and
has 27 districts, divided into five administrative regions called divisions. Chhattisgarh is primarily
an agrarian, rural state, with 77% of its population living in rural areas. Scheduled tribes (STs), a
vulnerable group, make up 31% of Chhattisgarh’s population – almost fourfold the national
average of 8% (2).The State has two kinds of geographies – a central plains region with high
population density and an undulating plateau around its periphery. The Surguja region in the
north and Bastar region in the south form the main tribal regions. The tribal regions pose multiple
challenges in delivering health care and other services – difficult geography, poor infrastructure
and high levels of underdevelopment and poverty.
The State has an unemployment rate of 8.1% (June 2019 figures), similar to the national
average of 7.9% (3). The labour participation rate for women in Chhattisgarh is 39.7%,
compared to 55.6% for men (4). The female labour participation rate of the State is however
higher than the national average of 25.5% (4). Most of the workforce in rural areas is employed in
the informal sector, with only 2% of women and 5% of men having a regular wage (4). In the
urban workforce, 36% of women and 36% of men workers have a regular wage (4). While the
State started almost at the bottom amongst Indian states, it has made significant progress in its
development indicators over the two decades since its formation. The health indices have
improved substantially, especially in reproductive and child health (RCH) and in controlling
some communicable diseases. Indicators for gender equity have improved with increases in
female literacy, school-attainment and reduction in underage marriage of girls. Other social
determinants of health, like nutrition, have also registered improvement. The rate of
improvement has been very encouraging in indicators like women’s body mass index, child
stunting and underweight rates, under-5 and infant mortality rates, maternal mortality ratio
(MMR), antenatal care (ANC) coverage, full immunization, etc. Nevertheless, the mortality
indicators for the State are still poor (5).
The progress made also represents the narrow or selective focus of care that the government
has provided. The government services, including the budgets and human resources (HR) were
highly focused on providing preventive and basic primary curative care for RCH and
communicable diseases. The fact that noncommunicable diseases (NCDs) represent a large
morbidity burden including for the poor has only recently been realized in Chhattisgarh. With
rising importance of NCDs, the State is beginning to recognize that it needs to take up the
responsibility of providing preventive and curative care for NCDs. This change has implications
for the HRH needs of the State. The demand and need for health-care services is growing and
supply is lagging behind. As such, there is a need to identify HRH bottlenecks and opportunities
for the State and identify pragmatic policy solutions to minimize the gap between demand and
supply of health workers (Hws).
India has a pluralistic health-care system, with allopathic services playing a dominant role. The
health system is mixed, with the private providers accounting for 52% of the total health
expenditure in the State (6). The government-run services have greater focus on public health
functions, disease prevention measures and preventive care services like immunization and
ANC care. In health-care services, the focus has been traditionally on primary care for RCH and
on infectious diseases like malaria, diarrhoea, TB and leprosy.
4The public sector provides around half of the inpatient care (55.2%) and (55.3%) outpatient care
(NSSO Seventy-first round) (7). The private sector is also covering almost half of the inpatient
and outpatient care, but it focuses mostly on curative care services. An expanding private sector
is operating in bigger urban areas in the central region of the State.
Chhattisgarh’s per capita total health expenditure is 18% lower than of India (Rs 3375 vs 4116).
As a proportion of Gross State Domestic Product (GSDP), the total health expenditure of
Chhattisgarh is lower than the national average. In terms of government health expenditure, the
per capita spending in Chhattisgarh is 16% lower than the national average. As a proportion of
GSDP, Chhattisgarh’s government health expenditure is lower than national average. However,
the Chhattisgarh Government spends 5.6% of its total spending on health, which is better than
the national average. This shows that though the total spending on health is poor, the state
government is spending a greater share of its budget on health as compared to the national
average (6) (Table 1).
Table 1: Health expenditure of Chhattisgarh vs the whole of India (2015–2016)
Total health expenditure (THE) Government health expenditure (GHE)
Per capita THE THE as % of Per GHE as GHE as GHE as %
in Rs GSDP capita % of THE % of of gross
GHE GSDP government
in Rs expenditure
Chhattisgarh 3375 3.50 1063 31.5 1.10 5.60
India 4116 3.84 1261 30.6 1.18 4.07
Source: National Health Accounts 2015–2016 (NHSRC, 2018)
Out-of-pocket expenditure (OOPE) remains a critical issue in India and Chhattisgarh. OOPE
data on health care in Chhattisgarh shows that 39% of hospitalizations lead to catastrophic
health expenditure at 10% threshold of usual consumption expenditure (NSSO Seventy-first
round) (7). Of the total OOPE, 80% is incurred in the private sector providers and 20% in the
public sector. Since 2009, public funding also finances a large insurance programme for
inpatient care. The entire population of the State is eligible for free coverage under the insurance
programme. It empanels private and public providers for hospital-based care. Studies of the
insurance programmes in Chhattisgarh and India so far indicate their ineffectiveness in
curtailing OOPE. Apart from issues in geographical distribution of the private sector providers,
persistently high OOPE has been recognized as a key problem in literature on the publicly
funded health insurance in Chhattisgarh and other parts of India (8–12). OOPE constitutes
around 60% of THE in Chhattisgarh as well as in the whole ofIndia (Table 2).
Table 2: Out-of-pocket-expenditure in Chhattisgarh and India (2015–2016)
Per Capita OOPE in Rs % GSDP % THE
Chhattisgarh 1971 2.00 58.40
India 2494 2.33 60.59
Source: National Health Accounts 2015–2016 (NHSRC, 2018)
1.1.1 Spending on HRH
According to a recent study in Korba district of Chhattisgarh, around 60% of the government
expenditure on health is for HRH (State Health Resource Centre (SHRC) [in press]). This is
similar to the national level, where around two thirds of government expenditure is on HRH (13).
1.1.2 Contribution of HRH to overall employment
In India, estimates of HWs vary from 2.2 million to 3.7 million, depending upon the data source
and estimation methods (14–16). The total workers in the country are 402 million. Thus, the
5health sector contributes to less than 1% of the total employment in India. Of these, around one
third are expected to be unqualified health-care practitioners. Studies of Chhattisgarh are not
available, but the proportion of unqualified practitioners may be higher than the national
average. Also, the contribution of the health sector to its employment in Chhattisgarh is also
likely to be less than or close to the national average of 1%. The above estimates do not include
community health workers (CHWs), who are partially employed in the health sector.
Chhattisgarh has 70 000 CHWs called mitanins and 50 000 pre-school workers called
Anganwadi workers (AWWs) who also participate in maternal and child health activities.
1.1.3 Public health system
The public health system has the following tiers:
1. A sub-centre is the lowest physical unit catering to a population of 5000 (3000 for tribal
areas) for outreach function, with 1–2 paramedics. The State has 5200 sub-centres, mainly
in rural areas.
2. A primary health centre (PHC) with a physician and inpatient facility (around 6 beds) for a
population of 30 000 population (20 000 for tribal areas). The State has 791 PHCs in rural
areas and 45 in urban slums.
3. A community health centre (CHC) for secondary care (with 30 beds and 4 specialists)
catering to a population of 120 000 (80 000 for tribal areas). The State has 170 CHCs, mostly
situated in small towns surrounded by rural areas.
4. A district hospital (DH) (100 plus beds) for a population of around 1 million. All except one of
the 27 districts of the State have a DH. CHCs and DHs are the first referral units with
selected specialist care providing both outpatient and inpatient care.
5. There are 6 medical college hospitals to provide tertiary health care – each region has at
least one such hospital. Teaching hospitals having super-specialties providing outpatient
care, inward and rehabilitative care. There is also a super specialised hospital of the Central
Government which serves as a centre of excellence in the system (AIIMS, Raipur).
Since its inception as a state, Chhattisgarh has had a significant shortage of doctors and nurses.
When the State was formed in 2000, it had only one medical college. Many doctors chose to
leave this region for Madhya Pradesh at the time of formation of Chhattisgarh. The shortage in
the specialist cadre is particularly severe. There is a widespread perception that the State does
not have enough doctors, especially in government facilities; and that doctors are unwilling to
work in remote and tribal districts. The State follows a reservation system based on caste or
social group categories. There is a perception that not enough qualified doctors and nurses are
available, especially for the ST category. Despite these constraints, the State has committed to
moving towards universal health coverage (UHC) and the current government has included it
prominently in its manifesto. HRH shortages in the public sector are seen as a key stumbling
block to attainment of UHC in Chhattisgarh.
However, the State was a pioneer in innovating in HR cadres. It started a large CHW programme
called Mitanin Programme in 2002 (17). It started a 3-year diploma course to build a cadre of
rural clinicians to run services in PHCs in the face of severe shortage of MBBS doctors in rural
areas (18). It also launched an innovative programme to incentivize and support doctors in rural
and remote areas through a scheme called Chhattisgarh Rural Medical Corps (CRMC) (19–20).
More recently, the HR-led turnaround of DHs in highly remote and conflict-affected areas of
Bijapur and Dantewada has been amongst the first of its nature anywhere in India (21).
An important boost to the system of health care provision came after the commencement of the
National Rural Health Mission (NRHM) in 2006–2007. Under NRHM, the Central Government
started giving additional funds for strengthening primary health-care services by additional HR,
training of HR and improving basic infrastructure and supplies. Currently, the National Health
Mission (NHM) (started in 2013, subsuming the NRHM and National Urban Health Mission)
funds are around 25% of the total state budget. It set up additional programme management
units at state, district and block levels. This structure also decentralized the devolution of power
to the district and block, resulting in shared responsibilities for the provision of care.
6The Directorate of Health and Family Welfare (DoHFW) has two directorates – Directorate of
Health Services (DHS) and the Directorate of Medical Education (DME). DME looks after the
administrative arrangements of medical colleges and their hospitals. It is also responsible for
production of doctors and staff nurses. The public health system at tiers of district and below
comes under the DHS. It also leads a state nodal agency to manage the insurance programme.
Since auxiliary nurse midwife (ANM) schools are part of DHs, their supervision is in hands of
DHS. NHM has a State Programme Management Unit (SPMU) with a Mission Director. It looks
after contractual HR and innovative activities in collaboration with DHS. The State Institute of
Health and Family Welfare (SIHFW) is a registered society which coordinates a large share of in-
service training in the State. State Health Resource Centre (SHRC) is an autonomous society
which coordinates the Mitanin CHW programme and also functions as additional technical
capacity to DoHFW, providing technical assistance for overall health system strengthening in
Chhattisgarh.
The private sector comprises a mix of super-specialty hospitals, small hospitals and private
nursing homes and clinics. The private hospitals are mainly located in urban areas which are
staffed by both full-time private doctors and government doctors working in their off-duty hours.
The State has a Clinical Establishments Act to regulate the private sector. Yet, there are a large
number of informal unqualified providers active in rural and urban areas. Private sector inpatient
facilities and dental clinics have received a big boost through the State’s insurance scheme and
receive around 85% of their claims amount. The private sector also seems to suffer from
“selective care” and a skills shortage. It has been unable to supplement the capacity of the public
the sector by providing services that public sector is not able to provide adequately. The private
sector is gaining ground in Chhattisgarh and it is important to consider the implication of this on
the health labour market (HLM).
More recently, there is a central policy of “Comprehensive Primary Health Care” that has been
initiated in Chhattisgarh. Health and wellness centres (HWCs) have been started for providing a
comprehensive range of primary-care services closer to where people live. The main objective
is to “provide population-based comprehensive primary health-care services closer to the
population where they live and ensure affordable, sustainable and a continuum of care for every
patient” and thus to contribute to the achievement of UHC (22). This reorganization of services
has important implications for the HLM.
A comprehensive study on workforce management for the public health-care system was taken
up in the year 2003 (23). An assessment of HRH in the health department was carried out using
secondary data in 2012 (24). A study of regulatory measures to improve HRH retention was also
carried out (25). This HLMA takes into account the needs of a changing system and builds on the
previous HRH assessments in the State.
1.2 Objectives
Under the leadership of the Department of Health and Family Welfare and Medical Education of
Chhattisgarh (DoHFWME), a set of policy questions leading to policy recommendations were
identified in order to provide further insight into key health workforce challenges in Chhattisgarh
and help to ensure that the health workforce in Chhattisgarh is sufficient to achieve UHC.
To that end, a series of meetings took place during the World Health Organization (WHO)
mission in February 2019 with key stakeholders in Chhattisgarh from the various sections within
DoHFWME and from civil society and the private sector (Table 3).
7Table 3: February 2019 key stakeholder meetings
Organization Persons consulted
State Health Secretariat Ms Niharika Barik Singh – Secretary,
Department of Health and Family Welfare
and Department of Medical Education,
Government of Chhattisgarh
National Health Mission Dr Priyanka Shukla – Mission Director,
National Health Mission Chhattisgarh
Dr SK Pambhoi – Deputy Director NHM
State Health Directorate Dr Deepak Agrawal – Joint Director
Establishment
Dr BR Soni – Deputy Director Nursing
services
Dr KC Urao – Deputy Director Health
Services
State Health Systems Resource Centre Dr Prabir Chatterjee – Executive Director
Dr Samir Garg – Chief Programme
Coordinator
Directorate of Medical Education Dr SL
Adile – Director of Medical Education
Chief Medical and Health Officer Office Dr KS Shandilya – CMHO, Raipur
State Nursing Council Ms Durgavati Usare – Registrar of State
Nursing Council
District hospital Dr Ravi Tiwari – Civil Surgeon
Dr Rajesh Sharma – Government’s
Interface with IMA
Community Health Centre, Abhanpur Dr A Jha – Block Medical Officer
Health & wellness centre Dr Bharati Sahu – AMO, HWC, Ganaud
Civil society Dr Yogesh Jain – Founder Director, Jan
Swasthya Sahyog
PrivatesSector Dr Rakesh Gupta – Indian Medical
Association, Chhattisgarh
Through the discussions with stakeholders, the following key policy questions were identified:
• Is the production of HWs (with a focus on specialists, Medical Officers [MOs] and nurses) in
Chhattisgarh sufficient to meet current demand, and how can the recruitment and
deployment process be improved?
• What are the key health workforce elements to consider for a successful rolling out of the
HWCs in Chhattisgarh?
Based on the policy questions, the report is structured as follows:
– Chapter 1 introduces the context in Chhattisgarh, the policy questions identified and the
health labour market framework.
8– Chapter 2 reviews the production, remuneration, recruitment and retention situation
and policies for Mos.
– Chapters 3 and Chapter 4 adopt a similar approach for medical specialists and nurses,
respectively.
– In Chapter 5, an analysis for a successful rolling out of the HWCs from a health
workforce perspective is presented.
– Finally, a consolidation of policy recommendations is presented in Chapter 6.
1.3 Framework and methods
To answer these policy questions, the analysis in this report adopts a health labour market
(HLM) approach. The HLM can be defined as a dynamic system comprising two distinct but
closely related economic forces: the supply and demand of HWs. This dynamic is central in
determining the level of health employment. Notable factors affecting the supply of HWs are
education and training capacity and output, and migration. Notable factors affecting the demand
for HWs from the public side are budget and socioeconomic factors. A health labour market
analysis (HLMA) captures both these supply and demand side elements.
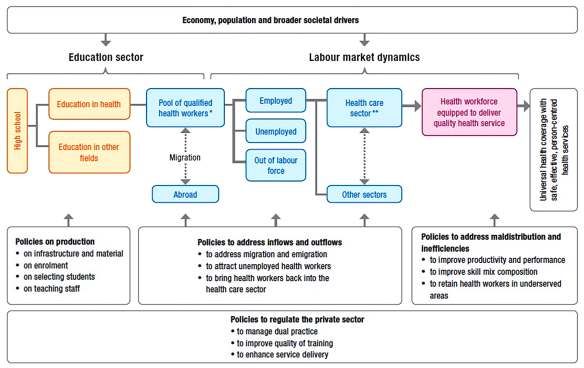
The labour market for HWs is dynamic and multidimensional. Fig. 1 illustrates the HLM
Framework which is the foundation of the labour market analyses conducted earlier, including in
Sri Lanka (26, 27). It comprises of the production of HWs through the education system, the
absorption capacity of HWs by the health system and the analysis of important elements of the
HWs engaged in the health sector (productivity, performance, skill mix and geographic
distribution).
Fig. 1: HLM framework for UHC
Source: Sousa et al., 2013
It is important to understand the absorption of HWs into the health system. In addition, not all
qualified HWs will be actively participating in the HLM. Some may be unemployed, and some will
work in other sectors. Of the pool of HWs engaged in the health sector, productivity,
performance, skill mix and geographic distribution are important elements, particularly if the aim
of the health system is UHC (27).
The HLM is complex and spans the education, finance, labour, public service and health sectors,
among others. Therefore, in order to get a complete picture, a comprehensive set of data is
9required. This is generally supplied by different government and nongovernmental agencies.
Although data on each element of the labour market is useful, the true value of a labour market
analysis lies in its ability to generate an understanding of the entire flow through of the market.
The labour market is dynamic. Time lags are evident; for example, the time between education
and deployment of the health workforce. As such it is important to capture data in a longitudinal
manner; typically, with a 10-year time horizon in mind.
As per the objectives of the study, the analysis focuses on several key concepts: (i)
macroeconomic factors that affect the supply and demand of specialists, doctors and nurses
(these are presented in chapter 1); (ii) the absorption capacity of the Chhattisgarh
government/public healt- care sector and the private health-care sector in the State; and (iii) the
distributional factors related to the nursing and medical workforce in Chhattisgarh.
The information and data used in this analysis were provided by the various sections of
DoHFWME, Chhattisgarh.
Data/information were collected through:
a) Quantitative analysis of secondary data collected from DoHFW. This was the main
source of analysis.
b) Qualitative analysis of stakeholder interviews, in order to confirm and explain the
inferences from the quantitative analysis
In order to strengthen and continue stakeholder’s engagement on health workforce issues and
in particular on the HLMA, the terms of reference of the Technical Working Group has been
submitted.
10Chapter 2: Adequacy of production and
recruitment of MOs in Chhattisgarh
The main issue examined in this chapter is about assessing whether the production and
deployment of doctors in Chhattisgarh is sufficient to meet the current demand in the State. This
chapter also reviews the efforts of Chhattisgarh to recruit the required doctors and the potential
strategies for government to address recruitment and retention issues.
To address this question, the current availability and demand for doctors is examined based on
the HLM framework presented in Fig. 2.
Fig. 2: HLM framework
Source: Global Strategy on Human Resources for Health: Workforce 2030
This chapter focuses on MOs, i.e. those with at least a MBBS. It also includes a more general
overview for the assistant medical officer (AMO) cadre, dental surgeons and ayurvedic doctors.
The State Government’s Department of Health has two directorates under which the doctors
work. One directorate – the DHS – manages the facilities at district level and below. The second
directorate – DME – is responsible for managing the government medical colleges in the State.
2.1 Government MOs
DHS is the main government recruiter of MBBS graduates. DME, on the other hand, mainly
employs specialist doctors for its teaching hospitals, i.e. medical colleges.
In Chhattisgarh, MOs are recruited under three kinds of appointments, i.e. regular, ad hoc and
contractual (Table 4). regular MOs are permanent posts of the State Health Department and are
fully funded by the State budget. Ad hoc MOs are appointments on contract basis but
againstrregular posts, which are done as a contingency measure when regular appointments
are not feasible due to administrative reasons. Contractual positions are approved and funded
by the NHM, in which the Central Government bears 60% of the cost.
2.1.1 MOs under DHS
Table 4: Types of MOs in Chhattisgarh in 2018–2019
Nature of Appointment Number Proportion
regular MO 1180 76%
DMO 125 8%
Contractual MO 252 16%
Total 1557 100%
Source: Data collected from DHS
11Regular appointments are the mainstay of HRH in the Department of Health and offer
advantages of job security and low attrition rates. Ad hoc appointments are just a contingency
measure, meant to be used in exceptional circumstances. In 2018–2019, there were 2079
approved positions for regular MOs.
Contractual appointments involve fewer administrative procedures, offer greater flexibility to
government in terms of recruitment procedures and deciding salaries but usually involve high
attrition rates. Contracts are annual and NHM prescribes annual performance appraisal for
renewal of contracts. In practice, renewal is automatic unless there is an exceptional event of the
concerned programme getting discontinued. Contractual positions are few in number: in
2018–2019, there were 367 contractual positions, as against 2079 regular positions. Thus,
regular appointments are the main mechanism of recruiting MOs under DHS.
2.1.1.1 MOs with regular appointments
Category- and gender-wise distribution of regular MOs for 2018 is given in Table 5. Overall, the
most frequent MO category is general (37%) followed by ST (33%). Of the regular MOs, 26% are
female. Social category-wise breakdown shows that general (unreserved) and ST categories
have relatively higher proportion of female MOs than other categories. Therefore, Table 5
suggests that intersectionality, specifically that between gender and class may be an important
consideration in recruitment.
Table 5: Distribution of regular MOs by gender and caste category
Category Total (1180) Female (308) Male (872)
General 437(37%) 125 (29%) 312 (71%)
Other backward Class (OBC) 153 (13%) 21 (14%) 132 (86%)
Scheduled Caste (SC) 201 (17%) 43 (21%) 158 (79%)
Scheduled Tribe (ST) 389 (33%) 119 (31%) 270 (69%)
Total 1180 (100%) 308 (26%) 872 (74%)
Source: Data collected from DHS
Table 6 gives the division-wise data for 3 years (2016–2017 to 2018–2019) and Table 7 gives
data for regular MO appointments across all the districts .
Table 6: Approved vs working regular MOs by division in Chhattisgarh
Division 2016 2017 2018
MOs MOs MOs
Approved Working Vacant Approved Working Vacant Approved Working Vacant
Raipur and 668 613 55 743 584 159 754 520 234
Durg
(92%) (8%) (79%) (21%) (69%) (31%)
Bilaspur 453 390 63 501 369 132 503 306 197
(86%) (14%) (74%) (26%) (61%) (39%)
Bastar 383 167 216 405 190 215 413 160 253
(44%) (66%) (47%) (53%) (39%) (61%)
Sarguja 369 293 76 399 216 183 409 194 215
(79%) (21%) (54%) (46%) (47%) (53%)
Total 1873 1463 410 2048 1359 689 2079 1180 899
(78%) (22%) (66%) (44%) (57%) (43%)
Source: Data collected from DHS
12Table 6 shows that the total number of MOs working in regular appointments decreased by
19.3% between 2016 and 2018. At the same time, the number of approved regular postings had
increased by 11%, with approximately 200 new postings (primarily in Raipur and Durg). In other
words, the combination of the decreased actual supply of MOs and the increased of approved
posts led to the high vacancy rate. The decrease in number of working regular MOs
demonstrates the challenge of attrition. As demonstrated a little later, the number of regular MOs
near the retirement age suggests that this could be a contributory problem. The contributory
factors associated with this attrition need to be explored further. The vacancy rate in
Chhattisgarh for Regular MOs doubled from 22% in 2016 to 43% in 2018. This suggests that
simply creating new posts will not be sufficient to meet the demand for MOs.
Bastar and Surguja represent the main remote and tribal regions of the State. Three years’ trend
data show that Raipur and Durg divisions put together had the lowest (but still high) proportion of
vacancies, whereas Bastar division had the highest.
At the District level, Table 7 shows that there is a wide geographic variation in the vacancy rate
across districts.
Table 7: Approved vs working regular MOs by district in Chhattisgarh
2016 2017 2018
District
MOs MOs MOs
Approved Working Vacant % Approved Working Vacant % Approved Working Vacant %
Raipur 116 111 5 4% 116 118 -2 -2% 116 138 22 -19%
BalodaBajar 66 71 -5 -8% 69 55 14 20% 70 33 37 53%
Gariyaband 51 47 4 8% 51 36 15 29% 51 33 18 35%
Dhamatari 53 52 1 2% 55 46 9 16% 58 36 22 38%
Kavardha 54 40 14 26% 63 41 22 35% 63 32 31 49%
Mahasamund 57 64 -7 -12% 61 62 -1 -2% 64 48 16 25%
Rajnandgaon 82 50 32 39% 109 66 43 39% 109 63 46 42%
Durg 88 88 0 0% 102 85 17 17% 102 81 21 21%
Balod 67 54 13 19% 67 50 17 25% 69 34 35 51%
Bemetara 34 36 -2 -6% 50 25 25 50% 52 22 30 58%
Raipur and 668 613 55 8% 743 584 159 21% 754 520 234 31%
Durg Division
Bilaspur 115 116 -1 -1% 138 125 13 9% 138 112 26 19%
Mungeli 51 48 3 6% 60 33 27 45% 60 30 30 50%
Korba 71 85 -14 -20% 74 73 1 1% 76 54 22 29%
Raigarh 121 69 52 43% 121 71 50 41% 121 68 53 44%
Janjgir 95 72 23 24% 108 67 41 38% 108 42 66 61%
Bialspur 453 390 63 14% 501 369 132 26% 503 306 197 39%
Jagadalpur 87 32 55 63% 82 47 35 43% 82 44 38 46%
Kondagaon 55 25 30 55% 72 23 49 68% 73 26 47 64%
Bijapur 38 12 26 68% 38 9 29 76% 42 9 33 79%
Kanker 80 56 24 30% 87 60 27 31% 87 47 40 46%
Dantewada 62 19 43 69% 62 23 39 63% 62 20 42 68%
Sukma 37 9 28 76% 39 14 25 64% 42 9 33 79%
Narayanpur 24 14 10 42% 25 14 11 44% 25 5 20 80%
Bastar 383 167 216 56% 405 190 215 53% 413 160 253 61%
Sarguja 66 63 3 5% 66 38 28 42% 76 73 3 4%
Balarampur 71 47 24 34% 82 40 42 51% 82 12 70 85%
Surajpur 85 50 35 41% 85 37 48 56% 85 23 62 73%
Koriya 67 67 0 0% 72 47 25 35% 72 38 34 47%
Jashpur 80 66 14 18% 94 54 40 43% 94 48 46 49%
Sarguja 369 293 76 21% 399 216 183 46% 409 194 215 53%
Division
Total 1873 1463 410 22% 2048 1359 689 34% 2079 1180 899 43%
Source: Data collected from DHS
13In the State, the vacancies against approved MO positions have increased from 410 in 2016 to
899 in 2018. Out of the 479 vacancies increased, 206 were due to newly-created posts and the
remaining were due to doctors leaving the service. Vacancy rates have increased in all divisions
except Bastar where it was already very high, at above 60%.
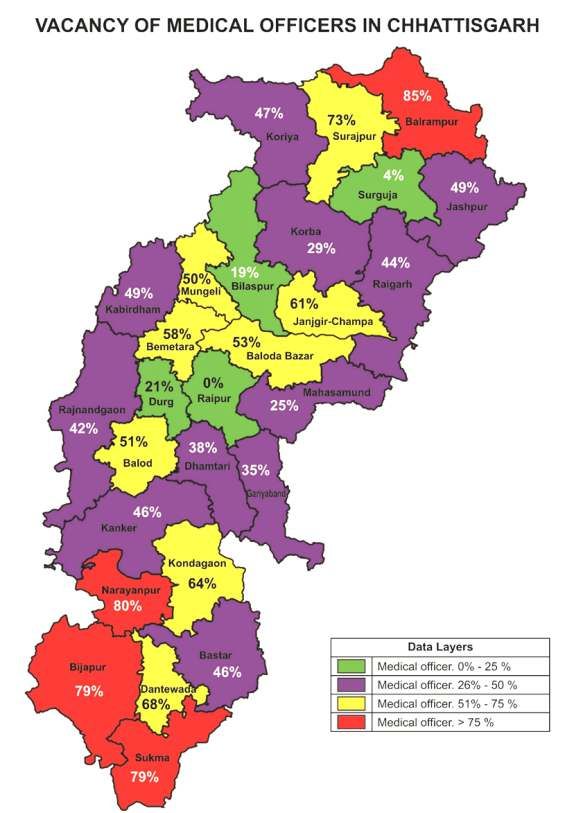
District-wise vacancy rates are given in Fig. 3.
Fig. 3: Map of district-wise vacancy rates of regular MOs – 2018
Source: Data collected from DHS
14Fig. 3 shows that the central areas have lower vacancy rates as compared to the peripheral parts
of the State, which in general have a higher proportion of tribal population.
District-wise data for gender distribution of MOs (regulars) 2018–2019: Fig. 4 shows the district-
wise data for gender distribution. that tThe central or urban districts have relatively higher
number of female doctors, with more than 40% of female doctors in Raipur are female, whereas
districts in tribal areas like the Bastar division (e.g. Narayanpur, Sukma, Bijapur) only haves 11%
of female MOs.
Fig. 4:Gender distribution of MOs (regulars), by district 2018–2019
Table 8 shows the district-wise data for average population approved per MO and population per
regular MO officer posted. In state average, there is one regular MO post approved per 12 287
population, whereas there is one regular MO in position per 21 648 population.
Note: As district-wise approved number of contractual doctors is not specified, this district-wise
analysis does not include contractual doctors.
Table 8: District-wise ratio of population per regular MO 2018
Approved
Population Population Existing
Area Approved Working post of
District (Census density MO/10 000
(sq.km) MO posts MOs MO/10 000
2011) (per sq km) population
population
Durg 1 721 948 2238 769 102 81 0.6 0.5
Dhamtari 799 781 2029 394 58 36 0.7 0.5
JanjgirChampa 1 619 707 4466 363 108 42 0.7 0.3
BalodaBajar 1 305 343 3730 350 70 33 0.5 0.3
Bilaspur 1 961 922 5818 337 138 112 0.7 0.6
Raigarh 1 493 984 5031 297 121 68 0.8 0.5
Surajpur 789 043 2787 283 85 23 1.1 0.3
Bemetara 795 759 2855 279 52 22 0.7 0.3
Mungeli 701 707 2750 255 60 30 0.9 0.4
Balod 826 165 3527 234 69 34 0.8 0.4
Mahasamund 1 032 754 4790 216 64 48 0.6 0.5
Bastar 834 375 4030 207 82 44 1.0 0.5
Balarampur 730 449 3806 192 82 12 1.1 0.2
Rajnandgaon 1 537 133 8070 190 109 63 0.7 0.4
Kabirdham 822 526 4447 185 63 32 0.8 0.4
Raipur 2 160 876 12 383 175 116 138 0.5 0.6
Korba 1 206 640 7145 169 76 54 0.6 0.4
15Jashpur 851 669 6457 132 94 48 1.1 0.6
Kanker 748 941 6424 117 87 47 1.2 0.6
Koriya 658 917 5978 110 72 38 1.1 0.6
Gariyaband 597 653 5823 103 51 33 0.9 0.6
Dantewada 282 479 3411 83 62 20 2.2 0.7
Kondagaon 578 824 7769 75 73 26 1.3 0.4
Sarguja 840 352 16 359 51 76 73 0.9 0.9
Sukma 250 159 5636 44 42 9 1.7 0.4
Bijapur 255 230 6562 39 42 9 1.6 0.4
Narayanpur 139 820 7010 20 25 5 1.8 0.4
Total 25 544 156 151 331 169 2079 1180 0.8 0.5
Source: Data collected from DHS
The districts with highly remote and scattered populations have low population density as shown
in the last few entries of Table 8. These districts have been sanctioned with better ratio of doctor
to population, in order to address the geographical challenges. The geographical distribution of
existing MOs shows that Balrampur district has the lowest availability of regular doctors per unit
population, followed by Surajpur, Balodabazar, Janjgir Champa and Bemetara districts. This
policy aimed at providing more MOs to the areas that needed them the most. Despite this effort,
the number of working doctors in the majority of the difficult areas is still poor. However, the
remote/tribal districts would have been in a worse situation if the sanctioned posts were less.
There are nine new predominantly rural districts (formed in 2013) where the sanctioned strength
of doctors has not got increased adequately.
Current age wise classification of regular MOs: In 2018, 50% of regular MOs in the State were
above the age of 50. Age of retirement is 65 years for regular posts. Data demonstrate that 17%
are close to their retirement age as they are above 60 years of age (Table 9). It also indicates that
recruitments appear to have slowed down in the last two decades.
Table 9: Age distribution of regular MOs
Age category Percentage
Under 30 years 12 (1%)
31– 40 years 260 (22%)
41–50 years 307 (26%)
51–60 years 389 (33%)
Above 60 years 200 (17%)
Age not mentioned 12 (1%)
Total 1180
Source: Data collected from DHS
2.1.1.2 MOs working on ad hoc basis
Since 2010–2012, the State has recruited 125 MOs on contractual basis, but against regular
vacancies. This set of appointments is called ad hoc postings. This was done in a situation when
the Public Service Commission, the official authority who could carry out recruitment of regular
MOs, was unable to perform the function. There is no specific number sanctioned as posts under
this category. It is used rarely and only represents a small proportion of all posts. As indicated,
the Health Department tried to cover a gap by directly recruiting 125 MOs through this type of
contract, instead of depending on the Public Service Commission. The recruited MOs however
could not be given the status of “regular” appointee and had to be classified as “ad hoc”.
Subsequently, the health department was given the official authority to recruit in “regular” MO
posts.
16Fig. 5 shows that the central districts had a bigger share of such appointments.
Fig. 5: Geographical distribution of ad hoc MOs: 2018–2019
Out of the 125 ad hoc MOs, 73% are male and 27% are female. This is similar to the proportion of
females for regular MOs.
2.1.1.3 Contractual MOs
The State has posted 152 contractual MOs, though 200 are approved under NHM. Out of the
152 contractual MOs working in 2019, 25% were female.
Fig. 6 shows the district-wise distribution of contractual MOs. The highest number of contractual
doctors posted among all districts is in Bijapur district. Bijapur, one of the remotest districts is
able to attract doctors through better salaries and other provisions, including accommodation.
Fig. 6: Geographical distribution of contractual MOs 2018–2019
Apart from the above, there are 167 contractual positions of MOs under specific programmes of
NHM – 90 for urban PHCs under the National Urban Health Mission (NUHM) and the remaining
are based in DHs – 54 under special newborn care units (SNCUs), 7 for district early intervention
centres (DEICs) and 16 for intensive care units (ICUs)/high dependence units (HDUs). Around
100 of these posts are filled.
2.1.2 Doctors under DME
Government Medical Colleges have 995 doctors as regular employees (under DME), most of
whom are specialist doctors under regular appointments. The total number of sanctioned
positions of doctors under DME are 1624.
Total availability of government doctors in Chhattisgarh: As shown in Table 1, that State has a
total of 1557 MOs (regular, ad hoc and contractual). Of them, 179 doctors are not working: 16
are suspended, 26 are retired, have 23 resigned, 81 are on long-term absence from service, 11
are not alive, 5 have not joined service after transfer, 6 took voluntary retirement and 11 have
gone for higher studies. In February 2019, the State has added 239 new doctors to its regular
rolls. This gives us the number of currently working MOs in the State as 1617.
17Around 300 MOs are working against the 2-year bond for government service. In addition, there
are 180 specialist doctors in the State. The Central Government has one institution, AIIMS, that
currently employs 305 doctors. Around 100 specialists are working against the 2-year bond for
government service.
Chhattisgarh has many public sector industries (SECL, NMDC, NTPC, SAIL) with their own
hospitals with around 300 doctors. These are not included in the above figures even though they
are on the public sector payroll.
Table 9 summarizes the number of government doctors in Chhattisgarh under various types of
employment. This table includes MOs as well as specialist doctors.
Table 9: Number of Government doctors (including specialists) in Chhattisgarh
Ser No Type of employment Number of doctors
1. Mos under DHS (Sate Government, including contractual appointments 1617
under NHM)
2. Specialists under DHS (Sate Government) 180
3. Doctors under DME (State Government) 995
4. Mos working in DHS under 2-year bond for MBBS education 300
5. Specialists working in DHS under 2-year bond for post-graduation (MD/MS) 100
6. Doctors in AIIMS (Central Government) 305
7. Doctors in hospitals owned by public sector units (industrial organisations 300
owned by Central Government)
Total 3797
Source: Data collected from DHS, DME and AIIMS
Thus, the total number of doctors (including specialists) working in government employment is
estimated to be approximately 3797 (in 2019).
According to Census 2011, State had a population of 25.5 million which was projected to be
around 30 million today. This represents a density of 1.3 government doctors per 10 000
population. However, this does not reflect the skewed geographical distribution, which is also
an area of concern.
How many more MOs the State Government needs currently: Out of the 1617 MOs working with
DHS, 431 have qualification of specialists. Since the State does not have direct recruitment for
specialists, they were recruited as MOs. They are eligible for specialist post after 5 years of
service, but some continue as MOs due to delays in promotion-related procedures. This set of
specialists working as MOs has been discussed in further detail in Chapter 3on specialists.
Around 300 MOs are working on bond. If the MOs with PG qualifications are excluded, the
department effectively has 1396 MOs against 2446 (2079 regular and 367 contractual)
sanctioned posts under DHS. Thus, around 829 more MOs need to be recruited to fill the existing
approved posts under DHS.
In addition, under DME, there are 995 doctors working against 1624 sanctioned positions
(including specialists). Thus, 629 doctors are needed for medical colleges. Most of these are
specialist positions and therefore not counted in the above calculation of recruitment need for
non-PG MOs.
Thus, the total number of doctors (MOs and specialists) that the State Government needs to
recruit against the sanctioned posts is 1458. When the State Government is able to recruit them,
the total number of working government doctors will be 5259, which means around 1.8
government doctors per 10000 population.
182.2 Availability of private doctors
According to the Medical Council of India (MCI), 8322 MBBS doctors are registered in
Chhattisgarh. A rough estimate for the number still working in Chhattisgarh would be around
85%, as some are not practicing within Chhattisgarh anymore. Based on this assumption,
approximately 7000 allopathic doctors are likely to be still working in Chhattisgarh. In addition,
according to key informants from the MO Association of Chhattisgarh, around 1500 doctors
registered in the parent state Madhya Pradesh are expected to be still working in Chhattisgarh –
around 500 in government and 1000 in private sector. These are the doctors who got registered
before 2000, i.e. prior to formation of Chhattisgarh. Thus, the current number of total doctors in
Chhattisgarh is likely to be around 8500. If we deduct the approximate number of allopathic
doctors working with government (3801) the number of doctors (including specialist doctors) in
the private sector is likely to be around 4700, assuming that all the 8322 doctors registered in
Chhattisgarh are still working in the State. This represents a density of 2.9 doctors per 10 000
population.
Under the above assumptions, we estimate that around 55% of the total allopathic doctors in the
State could be working in the private sector. This estimate is below the estimate of the
proportion nationally of private doctors. At national level, around 80% of doctors are estimated to
be working in the private sector and one document of Central Government reports the proportion
to be as high as 89% (11).
The State enacted its Clinical Establishments Regulation Act in 2011. It made it mandatory for
the clinical establishments to register with thegovernment. The number of registered private
clinical establishments of various types in the State is given in Table 10.
Table 10: Number of registered private clinical establishments in the State
Type of Institution Number
Hospital/maternity home/nursing home 955
Clinic (allopathic/recognised indigenous systems of medicine) 3614
Total 4569
Source: Data collected from DHS
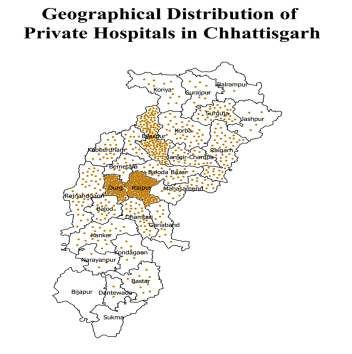
As depicted in Figs. 7 and 8, the bulk of the private sector providers are concentrated in
central/urban districts.
Fig. 7: Distribution of private hospitals throughout the State
19You can also read