An evaluation of the EarthSky en Español Facebook Page and short format videos
←
→
Page content transcription
If your browser does not render page correctly, please read the page content below
An evaluation of the EarthSky en Español
       Facebook Page and short format videos

                Report for EarthSky Communications
                                      November 2014

                                   Knight Williams Inc.

                                Valerie Knight-Williams, Ed.D.
                                   Divan Williams Jr., J.D.
                                    Rachael Teel, MESc
                                     Eric Anderson, B.S.
                                     Roxana Hernandez
                                      Gabriel Simmons
                                       Sauleh Rahbari

This material is based on work supported by the National Science Foundation under grant award No. DRL:1011011.
Any opinions, findings, and conclusions or recommendations expressed in this material are those of the authors
and do not necessarily reflect the views of the National Science Foundation.
Table of Contents
Study 1: Overview of EarthSky en Español Facebook Page audience and engagement metrics............... 3

    Introduction ............................................................................................................................................................... 3

    Findings...................................................................................................................................................................... 4
      1.1 How many Likes did the Facebook Page generate? ........................................................................................... 4
      1.2 Who Liked the Facebook Page?.......................................................................................................................... 5
      1.3 What were the primary referring sites to the Facebook Page? ............................................................................ 7
      1.4 What types of posts were made to the Facebook Page? .................................................................................... 8
      1.5 How many Engaged Users did the Facebook Page draw? ............................................................................... 12
      1.6 What was the Reach of the Facebook Page?.................................................................................................... 13
      1.7 How many Impressions did the Facebook Page generate? .............................................................................. 14
      1.8 What types of posts achieved the greatest Reach and Impressions? ............................................................... 15
      1.9 How many Consumers did the Facebook Page generate? ............................................................................... 16
      1.10 How many Consumptions did the Facebook Page generate? ......................................................................... 17
      1.11 What types of posts drew the most Engaged Users, Consumers, and Consumptions? .................................. 18
      1.12 How much negative feedback did the Facebook Page generate?................................................................... 19

    Conclusions .............................................................................................................................................................. 20
     Challenges and limitations of working with Insights .................................................................................................. 20
     Summary of findings ................................................................................................................................................. 20
     Discussion ................................................................................................................................................................ 23
Study 2: Exploratory study of short-format videos with an EarthSky en Español online audience ........ 26

    Introduction ............................................................................................................................................................. 26

    Evaluation goals ..................................................................................................................................................... 28

    Method ...................................................................................................................................................................... 29
      Videos used for the evaluation ................................................................................................................................. 29
      Evaluation procedure ................................................................................................................................................ 30
      Questionnaires ......................................................................................................................................................... 31
      Data analysis and reporting ...................................................................................................................................... 32

    Sample information ............................................................................................................................................... 33
      Viewer participant demographics/background .......................................................................................................... 33
      Control participant demographics/background ......................................................................................................... 34
      Participants’ use of the EarthSky en Español Facebook Page ................................................................................. 34

    Findings.................................................................................................................................................................... 38
      2.1 How did Viewers rate the videos in terms of overall appeal, content interest, clarity,
          and personal learning value?............................................................................................................................. 39
      2.2 How did Viewers respond to the scientists and science and health information featured in the videos?........... 42
      2.3 How important was it to Viewers that future videos feature Hispanic scientists? ............................................... 45
      2.4 How much did Viewers feel they learned from the videos? ............................................................................... 48
      2.5 What did Viewers identify as the videos’ main messages and what else did they learn of interest? ................. 49
      2.6 What was the impact of the Mosquitoes video on Viewers’ knowledge of mosquitoes as compared to Control
          participants? ...................................................................................................................................................... 55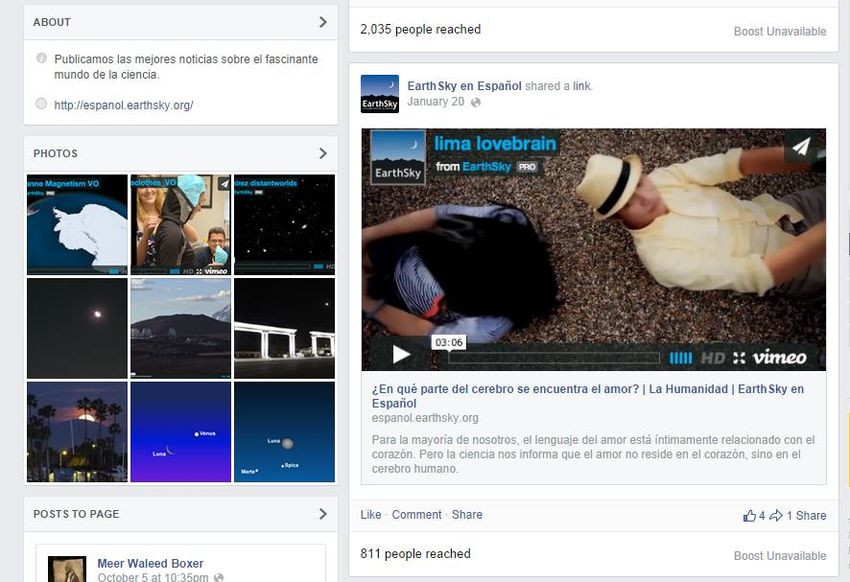
2.7 To what extent were Viewers interested in learning more about information featured in the videos
             and felt they were likely to seek this information out? ....................................................................................... 58
         2.8 Did Viewers share additional feedback on the videos? ..................................................................................... 59

       Conclusions ............................................................................................................................................................ 61
         Summary of findings ................................................................................................................................................. 61
         Discussion ................................................................................................................................................................ 63
References ........................................................................................................................................................ 70

   Knight Williams Inc.                                                                                                                                                                   1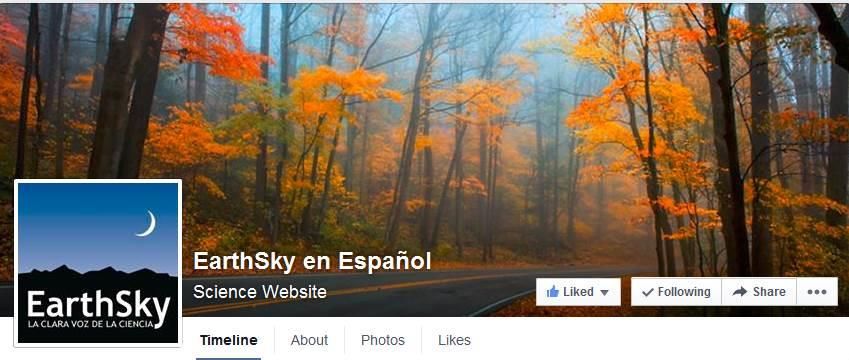
Introduction
In 2010 EarthSky Communications Inc. was awarded a broad implementation grant from the National Science
Foundation (NSF) entitled Proyecto de Implementacion Amplia EarthSky en Español (EarthSky in Spanish Broad
Implementation Project). In partnership with the Spanish media company Univision Communications Inc. and a
national Advisory Committee of Hispanic scientists, educators, and media experts, EarthSky proposed to present
science information and scientist interviews to Spanish-preferring U.S. Hispanics via short video programs
distributed on television and the Internet. The proposal made the case that the project would increase the number
of short format science video programs available to U.S. Latinos via television and online media as well as the
representation of Latino scientists within these media. As reflected in the proposal text below, the project team
expected that the videos would increase viewers’ familiarity with and understanding of the science concepts
presented and motivate them to both engage in conversations with friends or family about what they viewed and
seek out additional information about content of interest:

        This work will bring short-format science video programs to millions of U.S. Latinos - via
        traditional and new media – who might not otherwise be exposed to science. It will increase the
        amount of Spanish-language science content available in mainstream and new media and
        increase the representation of Latino scientists in U.S. media. It can be expected to increase
        familiarity with and understanding of science concepts among U.S. Latinos, while resulting in
        engagement activities such as talking with friends/family about the presented topics and/or
        seeking out additional information. Over the long term, the project should contribute to creating
        more science-informed Latino citizens and inspiring some young Latinos to pursue science as
        a career.

The proposal qualified that while little research existed on the impact of short video programs in either online or
television media, some studies indicated that exposure to science in the media could lead to positive outcomes,
including a 2008 study by Hwang & Southwell that suggested that the simple presence of science-focused local
TV news stories predicts positive beliefs about science. Additionally, the project team pointed to previous
independent evaluations of EarthSky Spanish video products (Jimenez & Russell, 2009) that also suggested
positive outcomes, with focus group participants reporting that EarthSky video products inspired high levels of
engagement and understanding and encouraged them to read more about the topics presented and/or discuss
the content with friends and family.

Under the Broad Implementation grant, EarthSky was able to build on the work completed in prior projects funded
by the NSF and continue working with Univision in order to produce science videos in Spanish for the television
program Detras Del Saber. The Broad Implementation grant also enabled EarthSky to expand the reach of the
videos and the project’s science outreach, in general, to the EarthSky en Español website and Facebook page.

This report presents findings from two separate evaluations of deliverables produced as part of the EarthSky en
Español grant. The evaluations were conducted by the independent evaluation firm Knight Williams Inc., which
specializes in the evaluation of informal science media projects serving diverse audiences. The first evaluation
(Study 1) focused on the impact of the project’s Facebook page by examining the audience and engagement
metrics captured during the final 21 months of the grant period, from 9/1/2012 through 5/31/2014. The second
evaluation (Study 2), involved an exploratory study of the appeal, clarity, and learning value of three short format
STEM videos that aired within a one month period on Detras del Saber and appeared in posts featured on the
EarthSky en Español homepage and Facebook page.

Knight Williams Inc.                                                                                                   2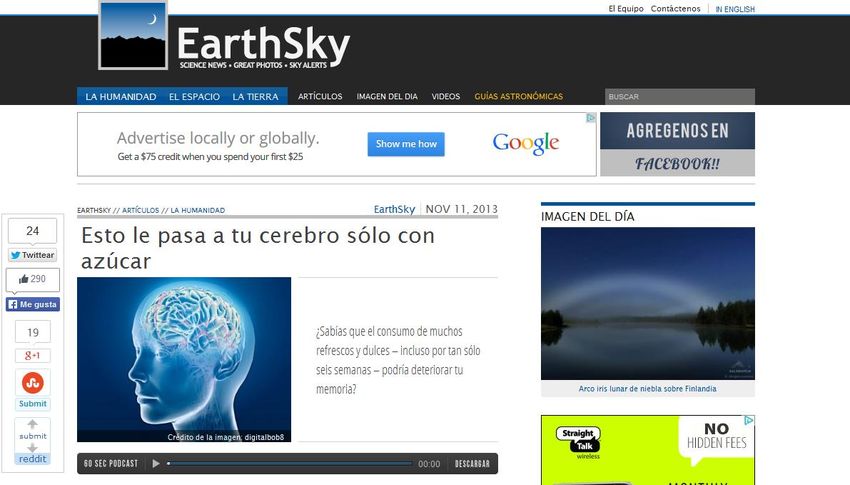
Study 1: Overview of EarthSky en Español Facebook Page
                     audience and engagement metrics
                                               Introduction
EarthSky’s Broad Implementation media project, funded by the NSF in 2010, built upon a prior NSF award
(0639001) which produced, among other media deliverables, a Spanish-language science news and information
website, EarthSky en Español. Through the Broad Implementation award, EarthSky subsequently increased the
amount of Spanish-language STEM content on the website. This new content was largely based on research
conducted by Hispanic scientists and spanned a wide range of topics including astronomy, biology, physics, earth
science, and engineering.

As part of the Broad Implementation NSF award, EarthSky also focused on developing a social media presence
designed to reach and engage Hispanic audiences, primarily through Facebook and Twitter. In December 2010,
three months into the award period, the project initiated a Facebook Page. To help EarthSky en Español better
understand visitor engagement with the Page, the independent evaluation team from Knight Williams Inc.
collaborated with the project team to conduct an evaluation of the Page during the final 21 months of the grant
period, from 9/1/2012 through 5/31/2014.

Study 1 provides a summary of the audience and engagement metrics captured for the Facebook Page during
this 21-month timeframe, based on the metrics made available by Facebook’s analytic service, Insights. The
findings for Study 1 are organized under the following twelve questions:

          1.1    How many Likes did the Facebook Page generate?
          1.2    Who Liked the Facebook Page?
          1.3    What were the primary referring sites to the Facebook Page?
          1.4    What types of posts were made to the Facebook Page?
          1.5    How many Engaged Users did the Facebook Page draw?
          1.6    What was the Reach of the Facebook Page?
          1.7    How many Impressions did the Facebook Page generate?
          1.8    What types of posts achieved the greatest Reach and Impressions?
          1.9    How many Consumers did the Facebook Page generate?
          1.10   How many Consumptions did the Facebook Page generate?
          1.11   What types of posts drew the most Engaged Users, Consumers, and Consumptions?
          1.12   How much negative feedback did the Facebook Page generate?
Knight Williams Inc.                                                                                              3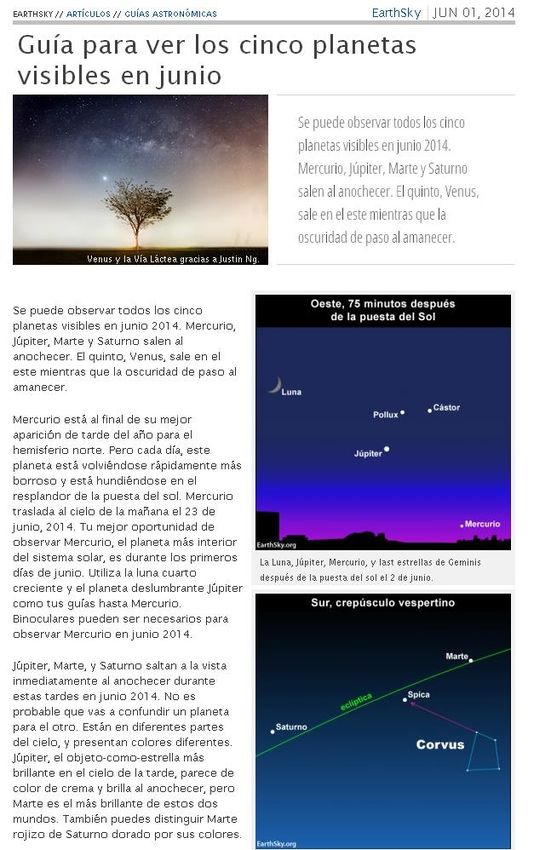
Findings
1.1 How many Likes did the Facebook Page generate?
When a Facebook user “Likes” a Page, it is analogous to subscribing to a magazine or newspaper. The user sees
stories from the “Liked” Page in their News Feed. The chart below shows the number of new Likes and Unlikes1
that the EarthSky en Español Facebook Page generated each month, from 9/1/2012 through 5/31/2014. The chart
also shows the total number of Likes (Total Likes) accumulated over the 21-month timeframe of the evaluation.
Total Likes can be thought of as the total number of people subscribed to the Page, or its direct audience. As
Insights defines Total Likes, it comprises: “The total number of people who have Liked your Page (unique users).”
Distribution of Page Likes and Unlikes
(Monthly new Likes, Unlikes, and Total Likes)
As the chart above shows:
By September 2012, the Facebook Page had already accumulated 19,811 Likes. By the end of the grant
period in May 2014, 21 months later, the number of Likes grew to 34,143, a gain of 73% (14,332 Likes).2
Over the 21-month period, the Page averaged 759 new Likes and 60 Unlikes per month, a ratio of
approximately 13:1.
The Page received the highest number of new Likes during the fall of 2013, peaking in October with a total of
2,016 new Likes. During this month, 94 posts were made to the Page, the 4th highest for the 21-month period.
1 Refers to when a person unsubscribes or unfollows the Facebook Page.
2 For the purposes of this report, “grant period” refers to the 21-month time frame assessed by the evaluation.
Knight Williams Inc. 4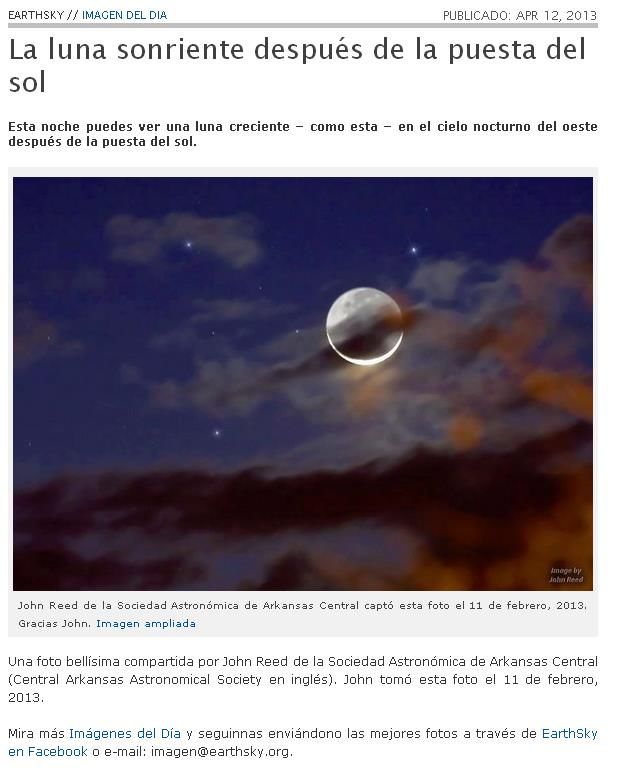
Other highpoints in new Likes occurred in the late fall/early winter period of 2012 and then again in the winter
of 2014, although the number of Likes captured during these periods did not reach the levels recorded in the
fall of 2013.
After the winter of 2014, the number of new Likes per month began to decline, reaching the lowest point in
May, with 125 new Likes. May also marked the end of the grant period, resulting in fewer posts, which in turn
resulted in less activity on the Page. For context, while 94 posts were made to the Page in October 2013, only
6 were made in May 2014. The decline in posts presumably also led to fewer new Likes.
1.2 Who Liked the Facebook Page?
Age and Gender
As noted in section 1.1, the Facebook Page accumulated a total of 14,332 Likes from 9/1/2012 through to
5/31/2014. The chart below shows the gender and age breakdown of visitors who Liked the Page, as of
5/31/2014, at the end of the grant period.
Likes by Age and Gender as of 5/31/2014
MALE AGE FEMALE
65+
55-64
45-54
35-44
25-34
18-24
13-17
As the chart above shows:
A comparable number of male and female visitors Liked the Page (Female total 16,380, Male total 17,530).
Females accounted for 48% of Likes, while males accounted for 51%. (The remaining 1% were users who
declined to provide a gender).
Among both males and females, the highest number of Likes were contributed by 25-34 year olds (33%),
followed by 35-44 year olds (23%), and then 45-54 year olds (16%). The lowest number of Likes in each case
were contributed by those in the youngest (13-17) and oldest (65 years or older) age brackets (5% and 3%,
respectively).
Knight Williams Inc. 5
Country of origin
The chart below shows Likes displayed by country of origin as of 5/31/2014.
Likes by Country (Top 20) as of 5/3/2014
As the chart above shows:
The largest number of Likes came from Venezuela (4,382), approximately 13% of Total Likes for the
Page, followed by Mexico (11%), Argentina (8%), Colombia (8%), and Spain (7%).
The United States was 6th for number of Likes, at 2,317, with approximately 7% of Total Likes for the
Page.
Knight Williams Inc. 6
1.3 What were the primary referring sites to the Facebook Page?
The chart below shows the top ten referring sites to the Facebook Page during the 21-month grant period,
accounting for 3566 views as traffic from referring sites.
Referring Sites to Facebook Page
As the chart above shows:
The top referring site to the Facebook Page was espanol.earthsky.org, with 2,631 referrals.
Google searches originated from various countries also brought referrals, particularly from Mexico (162),
Argentina (118), Colombia (99), and Spain (97).
Knight Williams Inc. 7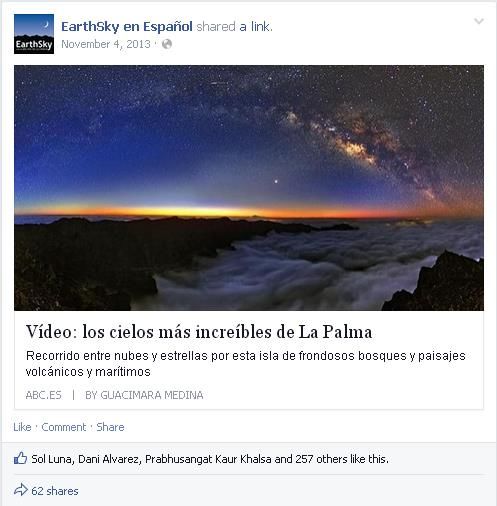
1.4 What types of posts were made to the Facebook Page?
Four types of post were made to the Facebook Page: links to science information via photos (which frequently
linked back to the EarthSky en Español website), links to articles, video links, and status (text only) posts.
Examples of a link to science information via a photo post and a link to an article are pictured below.

      Link to science information via a photo post                                Link to article

Knight Williams Inc.                                                                                             8
Examples of a status (text-only) post and a video link are pictured below.
Status post Video link
Knight Williams Inc. 9The chart below shows the frequency with which the four types of posts were made to the Page over the 21-month period.
Types of posts made to the Facebook Page
As the chart above shows:
Science information via photos (called ‘photos’ in the chart above and hereafter in this report) made up
nearly nine-tenths (88%) of all posts to the Page, with 1157 such posts made.
Links to articles (called ‘links’ in the chart above and hereafter in this report) made up one-tenth of the
posts (10%), with 128 posted to the Page.
There were relatively few video links (2%), with 31 posted over the 21-month period. Status (text only)
posts were the least common type of post (.2%), with only 2 posted over the same period.
Knight Williams Inc. 10The chart below shows the monthly distribution of the three main post types made to the Page over the 21-month
period.3
Post types made to the Page by month
As the chart above shows:
In each case, the number of posts made to the Page increased from September 2012 to May 2013, at which
time the total post count peaked at 123 posts (92 photos, 26 links, and 5 video links).
After May 2013, for each of the three main post types, there was a decreasing trend in post count through
May 2014, with 6 posts in the final month of the project (2 photos, 4 links, and 0 video links).
3 Status posts are not included in the following post charts in the report due to the small number of posts of this type.
Knight Williams Inc. 111.5 How many Engaged Users did the Facebook Page draw?
The chart below shows the number of monthly Engaged Users, or the number of unique people who clicked on,
Liked, commented on, or shared the Facebook Page each month. Using Insights language, Engaged Users refers
to “The number of people who clicked anywhere in your posts (unique users).”
Engaged Users: Monthly Totals
AVG: 12.7
As the chart above shows:
During the 21-month grant period, the Page averaged 12,700 Engaged Users per month.
While the month with the highest number of Engaged Users was September 2013 (20,700), other months also
had relatively high numbers, particularly in late 2012 and again in the spring of 2013.
While most months of the grant period had Engaged User numbers that were around or above the monthly
average of nearly 12,700 users, the numbers generally began to decline in December 2013, through to May
2014, marking the near end of the grant period. The final month had the lowest number of Engaged Users of
all months (1,700).
Knight Williams Inc. 121.6 What was the Reach of the Facebook Page?
The chart below shows the Reach of the Facebook Page, or the number of unique people who saw any content
associated with the Page over the 21-month period. Using Insights language, Reach is the number of unique
users who “received impressions of a Page post.”
Reach: Monthly Totals
AVG: 154
As the chart above shows:
The Page’s average monthly Reach was 154,000 unique users.
The Reach totals were generally highest in the spring of 2013, peaking in April with 256,000 unique users,
although the fall of 2012 and fall of 2013 also recorded numbers that were well above the average monthly
Reach.
While most months generated Reach numbers that were around or above the monthly average of 154,000
unique users, the numbers generally began to decline in December 2013, through to May 2014, marking the
near end of the grant period. The final month had the lowest level of Reach of all months with 22,000 unique
users.
Knight Williams Inc. 131.7 How many Impressions did the Facebook Page generate?
The chart below shows the monthly number of Impressions (total count) of any content associated with the Page.
Using Insights language, Impressions refers to “The number of times a post from your Page is displayed, whether
the post is clicked or not. People may see multiple impressions of the same post. For example, someone might
see a Page update in News Feed once, and then a second time if their friend shares it.”
Impressions: Monthly Totals
AVG: 524
As the chart above shows:
The Page’s average number of Impressions was 524,000 per month over the 21-month period.
The number of Impressions was generally highest during the spring of 2013, peaking in April with
882,000, although the fall of 2012 and the early fall of 2013 also recorded numbers that were well above
the average monthly number of Impressions.
While most months of the grant period had Impression numbers that were around or above the monthly
average of 524,000, the numbers began to decline in December 2013, through to May 2014, marking the
near end of the grant period. The final month had the lowest level of Impressions of all months, with
51,000 unique users.
On average, Impressions values were 3.2 times higher than Reach. This means that Facebook users who
saw content saw the content approximately 3 times on average. Relating this back to how Insights defines
and compares Impressions to Reach, Insights further delineates: “Reach is the number of unique people
who received impressions of a Page post. Reach might be less than impressions since one person can
see multiple impressions.”
Knight Williams Inc. 141.8 What types of posts achieved the greatest Reach and Impressions?
The chart below shows the average Total Reach and average Total Impressions for the three main types of posts
made to the Page over the 21-month period.
Average Total Post Reach and Impressions (Lifetime)
As the chart above shows, among the three post types:
Video links performed the best with respect to Reach and Impressions. The average Reach for video link
posts was 4,255 while the average Impressions was 8,766.
Links performed second best. The average Reach for link posts was 3,506 while the average Impressions
was 6,934.
Of the three main types of posts, photos performed the least well. The average reach for photo posts was
3,237 while the average Impressions was 6,414. Both Reach and Impressions are heavily influenced by
EdgeRank, Facebook’s algorithm for determining what content shows up in a user’s News Feed, or “who
sees what.” Post type is part of the algorithm, as well as the popularity of the content (as determined by
engagement and other factors). The smaller Reach and Impressions for photos can be partially attributed
to this algorithm. For example, during the 21-month period, links generated significantly more shares (on
average) than photos, which, in turn, likely increased the Reach and Impressions of these kinds of posts.
Knight Williams Inc. 151.9 How many Consumers did the Facebook Page generate?
The chart below shows the number of Consumers, or the number of people who clicked on any of the Facebook
Page content, each month. Using Insights language, Consumers refer to: “The number of people who clicked
anywhere in your post without generating a story (unique users).” 4 Insights, in turn, defines stories as “The
number of stories generated about your Page post, by story type, i.e. Likes, comments, and shares (total count).”
Stated more simply, stories amount to any way a person can interact with a Facebook Page, such as Liking it,
Liking a post, tagging the Page, commenting on a post, and sharing a post.
Consumers: Monthly Totals
AVG: 10.5
As the chart above shows:
The Page’s average number of Consumers was 10,500 per month.
The number of Consumers was highest in the late fall/early winter of 2012, peaking in November with 16,600,
although the spring and early fall of 2013 also recorded numbers that were well above the monthly average.
While most months recorded Consumer numbers approximate to or above the monthly average of 10,500, the
numbers steadily declined from December 2013 (6,300) through May 2014 (1,300), marking the near end of the
grant period.
4 Clicks that create stories are included in "Other Clicks." Stories that are created without clicking on Page content (e.g.,
Liking the Page from timeline) are not included (Unique Users). Consumers is limited to posts, so any click on post content
that creates a story (Liking it, etc.) is included as “Other Clicks.”
Knight Williams Inc. 161.10 How many Consumptions did the Facebook Page generate?
The chart below shows the number of Consumptions, or the number of clicks on any Page content, that the Page
generated each month. Using Insights language, Consumptions refer to: “The number of times people clicked
anywhere in your posts (total count).” 5 The three types of Consumption displayed in the chart include: Photo
View, Link Clicks, and Other Clicks. Photo View refers to someone clicking on a photo to view it; Link Clicks refers
to a person clicking on a link to view it; and Other Clicks refers to a person clicking on some other part of a post.
Video was excluded from the chart analysis since nothing was technically posted as a video; rather, videos were
posted as links.
Consumptions by Type
(Photo View vs. Link Clicks vs. Other Clicks)
As the chart above shows:
During the 21-month period, the most Consumptions each month came from Other Clicks.
The number of Photo Views and Other Clicks both peaked in the fall of 2012 and again in the spring and
fall of 2013. In November 2012, the number of Total Consumptions (all three types of Consumptions
combined) was 49,086, and in September 2013 it climbed to a high point of 51,870.
The number of Photo Views and Other Clicks began to decline in December 2013 (Total Consumptions
was 15,530) and generally declined until Total Consumptions reached a low point in May 2014 (2,348),
the end of the grant period.
5 Clicks generating stories are included in "Other Clicks." Stories generated without clicks on Page content (e.g., Liking the
Page in Timeline) are not included.
Knight Williams Inc. 17 The number of Link Clicks was consistently low during the grant period in relation to the other types of
Consumptions, under 5,000 per month.
Considering the Consumer data shown in section 1.9 (approximately 10,500 monthly consumers on
average) with the Consumptions data shown in the chart on the previous page (approximately 29,700
monthly Consumptions on average), the Total Consumption values were 2.8 times higher on average
than the number of Consumers, meaning that each user “consumed” content approximately 3 times on
average.
1.11 What types of posts drew the most Engaged Users, Consumers, and Consumptions?
The chart below shows the total number of Engaged Users, Consumers, and Consumptions for the three main
types of posts made to the Page over the 21-month period.
Number of Engaged Users, Consumers, and
Consumptions by post type
As the chart above shows, photo and video link posts performed similarly on all three metrics, while link posts
performed at a lower level in each case, as follows:
Photo posts had the highest number of Engaged Users and Consumers, and the second highest number of
Consumptions by a narrow margin. The average number of Engaged Users for photo posts was 290, the
average number of Consumers was 244, and the average number of Consumptions was 361.
Video links had the highest number of Consumptions, and the second highest number of Engaged Users and
Consumers. The average number of Engaged Users for video links was 268, the average number of
Consumers was 238, and the average number of Consumptions was 367.
Links had the lowest number of Engaged Users, Consumers, and Consumptions. The average number of
Engaged Users was 209. The average number of Consumers was 170, and the average number of
Consumptions was 261.
Knight Williams Inc. 181.12 How much negative feedback did the Facebook Page generate?
The chart below shows the number of unique users who gave negative feedback during the 21-month period.
Negative feedback can occur in different ways. For example, users have the option when they see a post to hide
all posts from the Page, hide that one specific post, report the post as spam, and Unlike the Page.
Negative Feedback: Monthly Totals
AVG: 104
As the chart above shows:
On average, 104 users provided negative feedback each month.
Negative feedback per month was highest during the fall of 2012 (peaking in November at 268 users) and
then again in the spring of 2013 (peaking in April at 189).
Negative feedback began declining below the monthly average starting in the fall of 2013. It continued to
decline toward the lowest point in April 2014 (2 users), as the end of the grant period approached.
Knight Williams Inc. 19Conclusions
Challenges and limitations of working with Insights
Although useful information was gleaned about the EarthSky en Español Facebook Page using Facebook’s
analytic service, Insights, a number of challenges and limitations were encountered when applying the available
metrics to the current project. The main challenges encountered during the analysis are briefly summarized
below.6
At the time the analysis was conducted, exported data was limited to spreadsheets that cover 180 days or
less for every graph other than Likes. This feature is not well suited to projects that need to combine
continuous data over a 21-month period (or any period of more than approximately 6 months), particularly as
tally categories vary month to month. For example, the number of visitors referred from YouTube may be in
column 10 in one spreadsheet and column 15 in another. Thus, all of this information must be adjusted in
Excel before it can be added together.
The task of combining the spreadsheets to obtain demographic data (for engagement metrics other than
Likes) may not be cost-effective for every project. In the short term, for someone who is actively managing a
Page, Insights is probably a useful service. For the long-term analysis of a Page (as with this project), the
amount of time required to spend with Insights, for reasons described above, may cause a bottleneck in terms
of the depth of analysis.
Time on Page is a less valuable metric for Facebook than for other websites. For example, a user who leaves
a Page open for an hour without clicking anything is less engaged (and contributes less to audience growth)
than a user who stays for 15 minutes and shares 3 videos. However, Time on Page can generally be a useful
metric to supplement other metrics.
Insights does not provide an analysis of post content. Thus, in the short term, Page managers must be able to
assess how posts are received in real time and adjust their outreach strategy on an as-needed basis. For the
long-term analysis of a Page (as with this project), the amount of time required to assess a lengthy history of
individual posts qualitatively (in terms of tone, post content, comment content, and administrator engagement
with Facebook users, among other factors) may not be a cost-effective evaluation strategy.
Summary of findings
EarthSky’s Broad Implementation media project, funded by the NSF in 2010, built upon a prior NSF award
(0639001) which produced, among other media deliverables, a Spanish-language science news and information
website, EarthSky en Español. In addition to using the Broad Implementation award to increase the amount of
Spanish-language STEM content on their website, EarthSky also focused on developing a social media presence
designed to reach and engage Hispanic audiences, primarily through Facebook and Twitter. In December 2010,
three months into the award period, the project initiated a Facebook Page. To help EarthSky en Español better
understand visitor engagement with the Page, the independent evaluation team from Knight Williams Inc.
collaborated with the project team to conduct an evaluation of the Page during the final 21 months of the grant
period, from 9/1/2012 through 5/31/2014. Part 1 provides a summary of the audience and engagement metrics
6 It is important to note that Insights is a free service that is regularly updated, so some of the challenges encountered in this
analysis may no longer apply.
Knight Williams Inc. 20captured for the Facebook Page during this 21-month timeframe, based on the metrics made available by Facebook’s analytic service, Insights. 1.1 How many Likes did the Facebook Page generate? In September 2012, the beginning of the 21-month evaluation period, the EarthSky en Español Facebook Page had 19,811 Likes. By May 2014, the number of Likes had grown to 34,143, a gain of 73% (14,332 Likes). Over the 21-month period, the Page averaged 759 new Likes and 60 Unlikes per month. The Page received the highest number of new Likes during the fall of 2013. Other highpoints occurred in the late fall/early winter period of 2012 and then again in the winter of 2014. After the winter of 2014, the number of new Likes per month began to decline, reaching the lowest point in May 2014. 1.2 Who Liked the Facebook Page? A comparable number of male and female visitors Liked the Page, with females accounting for 48% of Likes and males accounting for 51%. (The remaining 1% were users who declined to provide a gender). Among both males and females, 25-34 year olds contributed a third of Likes (33%), 35-44 year olds contributed just under a quarter of Likes (23%), and 45-54 year olds contributed about one-sixth (16%). Less than a tenth of Likes each were contributed by those in the youngest (13-17) and oldest (65 years or older) age brackets (5% and 3%, respectively). The largest percentage of Likes came from Venezuela (approximately 13% of Total Likes for the Page), followed by Mexico (11%), Argentina (8%), Colombia (8%), and Spain (7%). The United States generated the 6th highest number of Likes (7%). 1.3 What were the primary referring sites to the Facebook Page? The top referring site to the Facebook Page was espanol.earthsky.org, with 2,631 referrals. Google searches originated from various countries (particularly Mexico, Argentina, Colombia, and Spain) also brought referrals. 1.4 What types of posts were made to the Facebook Page? Four types of post were made to the Facebook Page: links to science information via photos (which frequently linked to the EarthSky en Español website and are hereafter called ‘photo’ posts), links to articles (hereafter called ‘link’ posts), video links, and status (text only) posts. Photos made up nearly nine-tenths (88%) of all posts to the Page, and links made up one-tenth of the posts (10%). There were relatively few video links (2%). Status (text only) posts were the least common type of post (.2%). For the three main kinds of posts (photo, link, and video), in each case the number of posts made to the Page increased from September 2012 to May 2013, at which time the total post count peaked at 123 posts (92 photos, 26 links, and 5 video links). After May 2013, for each of the three main post types, there was a decreasing trend in post count through May 2014. 1.5 How many Engaged Users did the Facebook Page draw? Engaged Users refers to the number of unique users who clicked on, Liked, commented on, or shared the Facebook Page each month. During the 21-month grant period, the Page averaged 12,700 Engaged Users per month. While the month with the highest number of Engaged Users was September 2013 (20,700), other months also had relatively high numbers, particularly in late 2012 and again in the spring of 2013. The number of Engaged Users declined significantly from December 2013 through May 2014. Knight Williams Inc. 21
1.6 What was the Reach of the Facebook Page?
Reach refers to the number of unique users who saw any content associated with the Page over the 21-month
period. The Page’s average monthly Reach was 154,000 unique users. Reach totals were generally highest in the
spring of 2013, peaking in April with 256,000 unique users, although the fall of 2012 and fall of 2013 also recorded
numbers that were well above the average monthly figure. Reach declined significantly from December 2013
through May 2014.

1.7 How many Impressions did the Facebook Page generate?
According to Insights, Impressions refers to “The number of times a post from your Page is displayed, whether the
post is clicked or not. People may see multiple impressions of the same post. For example, someone might see a
Page update in News Feed once, and then a second time if their friend shares it.” On average, Impressions
values were 3.2 times higher than Reach, meaning that the Facebook users who saw content saw the content
approximately 3 times on average. The EarthSky en Español Page’s average number of Impressions was
524,000 per month over the 21-month period. The number of Impressions was generally highest during the spring
of 2013, peaking in April with 882,000, although the fall of 2012 and the early fall of 2013 also recorded numbers
that were well above the monthly average. After the early fall of 2013, there was a decreasing trend in
Impressions through May 2014.

1.8 What types of posts achieved the greatest Reach and Impressions?
Of the three main types of posts, video links performed the best with respect to Reach and Impressions, followed
by link posts and photo posts.

Both Reach and Impressions are heavily influenced by EdgeRank, Facebook’s algorithm for determining what
content shows up in a user’s News Feed, or “who sees what.” Post type is part of the algorithm, as well as the
popularity of the content (as determined by engagement and other factors). The smaller Reach and Impressions
for photo posts can be partially attributed to this algorithm. For example, during the 21-month period, links
generated significantly more shares (on average) than photos, which, in turn, likely increased the Reach and
Impressions of these kinds of posts.

1.9 How many Consumers did the Facebook Page generate?
Consumers refers to the number of people who clicked on any of the Facebook Page’s content without creating a
story. (Stories describe any way a person can interact with a Facebook Page, such as Liking it, Liking a post,
tagging the Page, commenting on a post, and sharing a post.)

The Page’s average number of Consumers was 10,500 per month. The number of Consumers was highest in the
late fall/early winter of 2012, peaking that November with 16,600, although the spring and early fall of 2013 also
recorded numbers well above the monthly average. Consumers declined significantly from December 2013
through May 2014.

1.10 How many Consumptions did the Facebook Page generate?
Consumptions are the number of clicks on any Page content, including Photo View, Link Clicks, and Other Clicks.
Photo View refers to someone clicking on a photo to view it; Link Clicks refers to a person clicking on a link to
view it; and Other Clicks refers to a person clicking on some other part of a post, including clicks that generated
stories. Video was excluded from the analysis because nothing was technically posted as a video; rather, videos
were posted as links.

During the 21-month period, the most Consumptions each month came from Other Clicks. The number of Photo
Views and Other Clicks both peaked in the fall of 2012 and again in the spring and fall of 2013, and then generally

Knight Williams Inc.                                                                                             22
declined from December 2013 through May 2013. The number of Link Clicks was consistently low during the grant
period in relation to the other types of Consumptions.
1.11 What types of posts drew the most Engaged Users, Consumers, and Consumptions?
Over the 21-month period, photo posts had the highest number of Engaged Users and Consumers, and the
second highest number of Consumptions by a narrow margin. Video links had the highest number of
Consumptions, and the second highest number of Engaged Users and Consumers. Links had the lowest number
of Engaged Users, Consumers, and Consumptions.
1.12 How much negative feedback did the Facebook Page generate?
Negative feedback can occur in different ways. For example, users have the option when they see a post to hide
all posts from the Page, hide that one specific post, report the post as spam, and Unlike the Page. Over the 21-
month period, on average, 104 users provided negative feedback each month. Negative feedback per month was
highest during the fall of 2012 and again in the spring of 2013. Negative feedback began declining below the
monthly average in the fall of 2013. It continued to decline toward the lowest point in April 2014, near the end of
the grant period approached.
Discussion
The monthly engagement metrics captured by Insights point to some revealing trends in activity. In chronological
order:
The fall of 2012 saw significantly higher than average Engaged Users (unique people who clicked on, Liked,
commented on, or shared the Facebook Page), Reach (unique users who saw any content associated with
the Page), and Impressions (defined by Insights as “the number of times a post is displayed, whether it is
clicked on or not”). The number of Consumptions (defined by Insights as “The number of times people clicked
anywhere in your posts (total count)”) also peaked during this time, and the Page saw the highest number of
Consumers (unique users who click on posts without generating a story). Finally, there was a bump in Page
Likes in the fall of 2012.
The spring of 2013 was another period of growth for the Page. The Page’s Reach and Impressions saw high
points, with both metrics peaking in April. There were also higher than average numbers of monthly Engaged
Users and Consumers during this time, and a peak in Consumptions.
The fall of 2013 had the highest number of Engaged Users and Consumptions of the 21-month period. Also
during this time, the Page’s Reach, Impressions, and Consumers were well above each engagement unit’s
average monthly figure. Additionally, the fall of 2013 through the winter of 2014 saw the largest growth in
terms of Page Likes.
From December 2013 through May 2014, Engaged Users, Reach, Impressions, and Consumers all declined
to figures well below each engagement metric’s respective monthly average. Consumptions per month
declined during this time as well, eventually reaching a Total Consumptions low point in May 2014. From
March 2014 through May 2014, the average number of Likes per month also lowered significantly.
When these and other trends were brought to the attention of the EarthSky en Español project team, the team
provided additional information about the project’s social media outreach efforts. Specifically:
Knight Williams Inc. 23 When asked about the highs and lows of the engagement metrics (general highs in the fall of 2012 and the
spring and fall of 2013, lows from late 2013 through May 2014), an EarthSky team member pointed to two
primary influences:
First, she noted that the success of EarthSky’s online presence is often tied to the night sky, elaborating,
“Some of the highs and lows we're seeing here are likely tied to night sky events. For example, the highs
in the fall of 2012 are probably tied to three meteor showers that occur in the autumn months: the
Orionids in October, the Leonids in November and the Geminids in December. In the April and May of
2013, Venus and Jupiter - the two brightest planets - were near each other with Mercury joining in May
2013 for a planetary trio (three planets fit within a circle with a 5-degree, or smaller). People hear about
these events, or see the planets, for example, in the night sky and come to us looking for information.” In
terms of the night sky event(s) that might have impacted the boost in engagement in the fall of 2013, a
2012 article from the online space news website SPACE.com titled “Look up! 13 Must-See Stargazing
Events in 2013” points to some fall 2013 events that could have helped drive traffic to the Page, including
a penumbral eclipse of the moon on October 18th and a hybrid eclipse of the Sun on November 3rd.7
Second, the team member noted that user engagement with the Page declined toward the end of the
project, as posts became less frequent. Specifically, she said that, “In our experience, media on the
Internet operates within one very strict rule: ‘energy in-energy out.’ The more you post, the more you're
excited about what you're posting, the more people visit the Page, click the like button, and
comment…The Internet is just such a human endeavor. A change in mood can perhaps account for the
steep decline when EarthSky staff learned, beginning in fall 2013, the project would not be continuing.
Some of our staff began looking for other jobs, and we began having to shift people to the Facebook
Page who were perhaps not as experienced or skilled at running it as previous employees had been.
That's probably a natural decline in any project, but, on the Internet - with the ‘energy in-energy out’ rule
operating - it's very noticeable.”
Her informal “energy in-energy out” observation highlights a situation that was also likely compounded by
the algorithm Facebook uses when determining which content to show individual users. As described in
the April 2014 TechCrunch article “Why is Facebook Page Reach Decreasing? More Competition and
Limited Attention,” Facebook’s goal is to show the most engaging posts to each user.8 Though Facebook
looks at more than 100,000 factors when determining what is shown in a user’s News Feed, the five most
powerful determinants are: (1) the interest of the user in the post’s creator; (2) the post’s performance
among other users; (3) the performance of past posts by the creator; (4) the type of post the user
generally prefers; (5) and how recently the post was shared. Thus, a decrease in posts that are shared by
engaging content creators leads to less exposure for future posts, and less engagement with users and
knowledge of user interests.
On a related note, though photos linking to science information were the most common type of post on the
Page (88% of all posts), they had the lowest average Reach and Impressions relative to link and video link
posts. As described in section 1.8, Reach and Impressions are both heavily influenced by Facebook’s
algorithm for determining the content that shows up in a user’s News Feed – thus, as links generated more
shares (on average) than photos, the Reach and Impressions of link posts likely increased as well. However,
the photos that were seen by users were still generally popular, as photos had the highest number of
Engaged Users and Consumers, and the second-highest number of Consumptions (after video links) by a
narrow margin. According to Facebook’s strategic partnerships manager Libby Leffler, “We tell non-profits all
7 For more information, please visit: http://www.space.com/19062-best-stargazing-events-2013.html
8 For more information, please visit: http://techcrunch.com/2014/04/03/the-filtered-feed-problem/
Knight Williams Inc. 24the time: Photos are everything...visual imagery is huge. That can be a photo, a video or and Instagram.” 9
Thus, though EarthSky en Español’s Facebook team may have noticed that their photo posts generated
relatively low Reach and Impressions, it seems they were popular enough in other ways (and applicable to the
subject of the Page and the mission of the non-profit, particularly given that the EarthSky website shares
science information via a photo of the day) to merit a high frequency of posts.
The EarthSky’s en Español’s team member was also asked if she could comment on the Page’s international
popularity. As noted above, the largest number of Page Likes came from Venezuela (13%), Mexico (11%),
Argentina (8%), Colombia (8%), Spain (7%), and the United States (7%). Based on this, the staff member
speculated that a self-supporting Spanish language website may not be able to rely solely on Spanish-
speaking Hispanics in the U.S., adding, “The radio and television aspects of this project did draw U.S.
audiences, because the products were delivered on U.S. radio and television broadcast outlets. But the online
component does seem to have drawn a large international audience. When we originally proposed this project
we provided some evidence that, in Spanish-preferring Hispanic households in the U.S., the radio and
television listening and viewing preferences were generally controlled by the older people in the
house…Online media consumption may be different, since it involves an individual sitting alone at a
computer. Perhaps younger U.S. Hispanics use computers more than their parents and simply don't seek out
information in Spanish. Meanwhile, in other Spanish-speaking countries, people are seeking science
information and hence were drawn to our online products.” Given that more than half of the people who Liked
the Facebook Page were under 44 years of age, her reasoning regarding Internet use, age, and language
preferences may hold some merit, though additional research would be needed to learn more about the
language preferences of different demographics of social media users in the U.S.
9 For more information, please visit: http://mashable.com/2013/03/21/facebook-non-profits/
Knight Williams Inc. 25Study 2: Exploratory study of short-format videos with an
EarthSky en Español online audience
Introduction
EarthSky’s Broad Implementation media project, funded by the NSF in 2010, built upon a prior NSF award
(0639001) which produced, among other media deliverables, a Spanish-language science news and information
website, EarthSky en Español. Through the Broad Implementation award, EarthSky subsequently increased the
amount of Spanish-language STEM content
on the website, and in particular, highlighted
research conducted by Hispanic scientists on
a wide range of STEM topics including
astronomy, biology, physics, earth science,
and engineering.
As part of this effort, EarthSky co-produced
with Univision a series of short-format videos
1-3 minutes in length, many of which
featured interviews with Spanish-speaking
scientists or researchers. These videos were
both distributed through the television
program Detras del Saber on Galavision, a
Univision subsidiary, and posted on the
EarthSky en Español website. Some also
appeared on the EarthSky en Español
Facebook Page. An announcement of the
videos premiere appeared on the EarthSky
website, as captured in the screenshot to the
right.
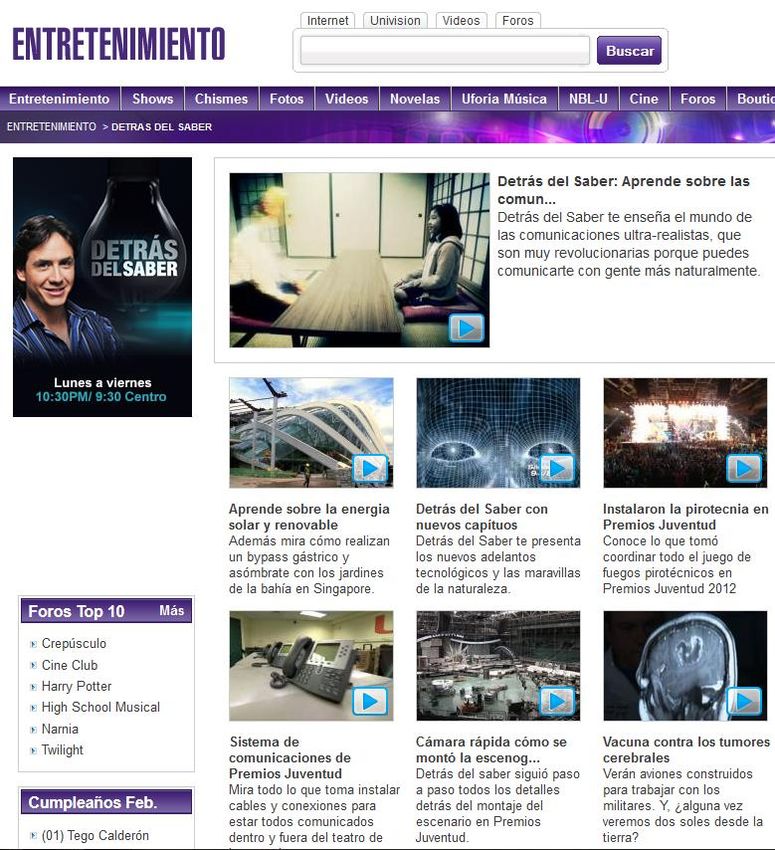
Knight Williams Inc. 26Detras del Saber
Detras del Saber is a half-hour television program that airs in a prime time slot between Mondays and Thursdays.
Described on the Detras del Saber Facebook Page as a “Ciencia-Entretenimiento” genre, the program combines
information and entertainment to explore explanations of how things work. As described in an Univision
announcement of the program’s premiere on Galavision on YouTube in 2010, the program features a host, José
Ramón Blanch, and covers a wide range of STEM topics of personal relevance to viewers:
This is a hosted half-hour show, where information and entertainment come together. Everything has an
explanation, and this is where our viewers will come to find the answers, from the flight of an airplane, to
the building of a wine bottle cork, to the strength bite of a shark. A fast paced and entertaining show,
devoted to illustrate in a visual and practical sense how things work, how things are manufactured. Five
days a week, prime time on Galavision. http://www.youtube.com/watch?v=6K2T-9URfE0
Viewers can find out more about the program in the Entertainment section of the Univision website, as
captured in the screenshot below.
The short format videos that were broadcast as part of Detras del Saber (Behind Knowledge) were inserted as
interstitial segments within the half-hour program format, typically but not always accompanying related
programming content.
Knight Williams Inc. 27Evaluation goals
As part of the NSF award, Knight Williams Inc. conducted an exploratory study of the appeal, clarity, learning
value, and motivational impact of the EarthSky en Español short format videos. To examine the impact of the
videos as experienced by the broadcast and online audiences for whom they were designed, the evaluation team
evaluated a sampling of three videos that aired on Detras del Saber over a one month period with visitors of the
EarthSky en Español homepage and Facebook Page.10
The evaluation specifically explored:
Viewers’ reactions to the three videos in terms of their perceived appeal, clarity, learning value, and
personal relevance;
The extent to which viewers reported an intention to discuss and follow up on topics covered in the videos
as a result of viewing;
The potential learning impact of the short video format as determined by any differences that may be
found between viewers and non-viewers of one of the three videos on a short learning “quiz” addressing
key content featured in the video; and
Whether and how the EarthSky en Español website and Facebook visitors used the Facebook Page as
an informal science education resource.
10 The evaluation, EarthSky, and Univision staff that collaborated on the evaluation considered the opportunities for and
requirements involved in gathering feedback from viewers of the short-format videos as presented on Detras del Saber,
including, for example, extending evaluation invitations to Detras del Saber viewers who visit the social media offerings
related to the series. The team encountered a number of marketing, legal, and logistical requirements that needed to be
addressed in order for this type of evaluation to occur that could not be resolved during the evaluation timeframe. Building
on this experience, the three teams prepared a subsequent proposal to the NSF that built in a timeline and process for this
to occur.
Knight Williams Inc. 28Method Videos used for the evaluation The three videos used for the evaluation include (as internally titled by the project team): Sugar Brain, Love Brain, and Mosquitoes. All three videos were less than 2 minutes in length and featured Spanish-speaking scientists talking about their work or the work of others. Screenshots of scenes from each video are shared below. Mosquitoes highlighted the effects of mosquito bites and prevention as well as the dietary habits of mosquitoes and their role in the ecosystem. Sugar Brain addressed the effects of fructose on the brain and highlighted a research study with mice on the protective functions of Omega-3s. Love Brain focused on the role of the brain in emotions like love and the contributions of the field of neuroscience in furthering our understanding. Knight Williams Inc. 29
You can also read


