STATEWIDE ASSESSMENT PROGRAM INFORMATION GUIDE - 2018-2019 Updated March 5, 2019
←
→
Page content transcription
If your browser does not render page correctly, please read the page content below

Table of Tables/Table of Figures

        STATEWIDE
       ASSESSMENT
         PROGRAM
     INFORMATION
            GUIDE
                                                 2018-2019

Statewide Assessment Program Information Guide
                                                       Updated March 5, 2019
                                                                        1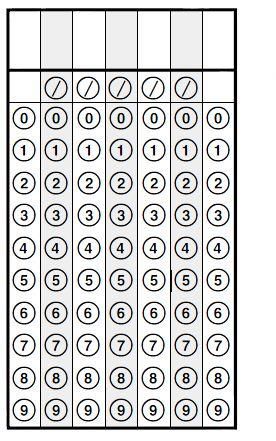
Table of Contents

Table of Contents
1.0    Introduction .......................................................................................................................... 1

2.0 Test Content and Format .................................................................................................... 3
    2.1. Operational, Field-Test, and Anchor Items................................................................... 3
               2.1.1. Test Design ....................................................................................................... 3
               2.1.2. Universal Design ............................................................................................... 3
               2.1.3. Cognitive Complexity/Depth of Knowledge .................................................... 4

3.0 Test Development and Construction ................................................................................ 21
    3.1. Developing Items ........................................................................................................ 22
               3.1.1. Item Writing .................................................................................................... 23
               3.1.2. Committee Reviews ........................................................................................ 24
               3.1.3. Field Testing ................................................................................................... 25
               3.1.4. Statistical Review............................................................................................ 26
               3.1.5. Test Construction ............................................................................................ 26
               3.1.6. Operational Testing ......................................................................................... 27

4.0    Test Administration ........................................................................................................... 35
       4.1. Schedules .................................................................................................................... 35
       4.2. Paper-Based Testing (PBT) ........................................................................................ 35
       4.3. Computer-Based Testing (CBT) ................................................................................. 36
       4.4. Timing ......................................................................................................................... 36
       4.5. Personnel ..................................................................................................................... 38
       4.6. Test Security ............................................................................................................... 38
       4.7. Administration Procedures.......................................................................................... 39
       4.8. Accommodations ........................................................................................................ 40
       4.9. Test Invalidation ......................................................................................................... 41

5.0 Scoring the Assessments .................................................................................................... 42
    5.1. Standard Setting .......................................................................................................... 42
       5.2. Scoring Different Item Types ..................................................................................... 42
               5.2.1. Machine/Electronic Scoring............................................................................ 42
               5.2.2. Handscoring – FSA ELA Writing................................................................... 43
               5.2.3. Automated Scoring Engine ............................................................................. 45

Statewide Assessment Program Information Guide                                                                                                 i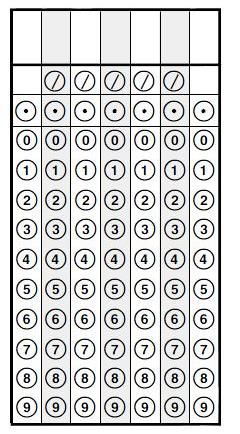
Table of Contents

               5.2.4. Reported Scores .............................................................................................. 45
               5.2.5. IRT Scoring ..................................................................................................... 46
               5.2.6. Process ............................................................................................................ 47

6.0    Reporting Results ............................................................................................................... 50
       6.1. Reports ........................................................................................................................ 50
       6.2. Florida’s PK–12 Education Information Portal .......................................................... 52

7.0    Glossary .............................................................................................................................. 53

8.0    Guide to Useful Resources................................................................................................. 59
       8.1. ELA Writing Resources .............................................................................................. 59
       8.2. Fact Sheets .................................................................................................................. 59
       8.3. Graduation Requirements ........................................................................................... 59
       8.4. Practice Tests .............................................................................................................. 59
       8.5. Technical Reports ....................................................................................................... 60
       8.6. Test Administration Manuals ...................................................................................... 60
       8.7. Test Design Summaries .............................................................................................. 60
       8.8. Test Item Specifications .............................................................................................. 60
       8.9. Schedules .................................................................................................................... 61
       8.10. Standard Setting .......................................................................................................... 61
       8.11. Aggregate Assessment Results ................................................................................... 61
       8.12. Understanding Reports................................................................................................ 61
       8.13. Useful Links ................................................................................................................ 61

Appendix A: Statistical Indicators Used in Data Analysis ...................................................... 63
    Indicator Definitions ............................................................................................................ 63
       Reliability Measures ............................................................................................................ 64

Appendix B: History, Requirements, and Uses ....................................................................... 66
    History of Florida’s Statewide Assessment Program .......................................................... 66
       Overview of State Statute and State Board of Education Rules Governing the
       Statewide Student Assessment Program .............................................................................. 68
       State-Required Uses of Statewide, Standardized Assessment Results ................................ 70
       Primary Statutory Authority for the Statewide Student Assessment Program .................... 71

Statewide Assessment Program Information Guide                                                                                                 ii
Table of Tables Table of Tables Table 1: FSA Percentage of Points by Depth of Knowledge Level ............................................... 4 Table 2: NGSSS Percentage of Points by Cognitive Complexity Level ........................................ 4 Table 3: Grade 4 Text-Based Writing ............................................................................................. 6 Table 4: Approximate Word Count Range for Text or Text Set .................................................... 6 Table 5: Percentages of FSA Reading Text Types by Grade Band ................................................ 7 Table 6: FSA ELA Reading Percentage of Points by Reporting Category .................................... 8 Table 7: Grade 3 FSA Mathematics Percentage of Points by Reporting Category ........................ 9 Table 8: Grade 4 FSA Mathematics Percentage of Points by Reporting Category ...................... 10 Table 9: Grade 5 FSA Mathematics Percentage of Points by Reporting Category ...................... 10 Table 10: Grade 6 FSA Mathematics Percentage of Points by Reporting Category .................... 11 Table 11: Grade 7 FSA Mathematics Percentage of Points by Reporting Category .................... 11 Table 12: Grade 8 FSA Mathematics Percentage of Points by Reporting Category .................... 12 Table 13: FSA Algebra 1 Percentage of Points by Reporting Category....................................... 12 Table 14: FSA Geometry Percentage of Points by Reporting Category ...................................... 13 Table 15: Statewide Science Percentage of Points by Reporting Category.................................. 18 Table 16: NGSSS Biology 1 Percentage of Points by Reporting Category ................................. 18 Table 17: NGSSS Civics Percentage of Points by Reporting Category ....................................... 19 Table 18: NGSSS U.S. History Percentage of Points by Reporting Category ............................. 20 Table 19: FSA English Language Arts – Writing......................................................................... 36 Table 20: FSA English Language Arts – Reading ........................................................................ 37 Table 21: FSA English Language Arts – Mathematics ................................................................ 37 Table 22: FSA End-of-Course Assessments ................................................................................. 37 Table 23: NGSSS Assessments – Reading Retake and Science ................................................... 37 Table 24: NGSSS Assessments – End-of-Course Assessments ................................................... 37 Table 25: Grade 10 ELA Passing Score by Year .......................................................................... 46 Table 26: Algebra 1 EOC Passing Score by Year ........................................................................ 46 Table 27: Statistical Analyses for Test Data and Indicators ......................................................... 65 Table 28: Statewide, Standardized Assessments Statutes and Rules ............................................ 68 Statewide Assessment Program Information Guide iii
1.0 Introduction

1.0 Introduction
The primary purpose of Florida’s K–12 statewide assessment program is to measure students’
achievement of Florida’s education standards. Assessment supports instruction and student
learning. Assessment results help Florida’s educational leadership and stakeholders determine
whether the goals of the education system are being met. Assessments help Florida determine
whether we have equipped our students with the knowledge and skills they need to be ready for
careers and college-level coursework.

Florida’s educational assessments also provide the basis for student, school, and district
accountability systems. Assessment results are used to determine school and district grades
which give citizens a standard way to determine the quality and progress of Florida’s education
system. While assessment plays a key role in Florida’s education system, it is important to
remember that testing is not an end in itself, but a means to an end. Florida’s assessment and
accountability efforts have had a significant positive impact on student achievement over time.

The Statewide Assessment Program Information Guide provides information about the Florida
Standards Assessments (FSA) and the Next Generation Sunshine State Standards (NGSSS)
Assessments, including the considerations governing item and test development, the mechanics
of item and test scoring, and the meaning of the different assessment scores. Such an
understanding can be useful for helping educators, parents, and students know more about the
entire assessment process, including the time and resources that contribute to each phase from
development to score reporting. Much of the information in this guide has appeared in other
publications and on the FDOE website, and, although some of the information about the
assessment program is technical, the guide is written for those without specialized knowledge of
psychometrics or measurement practices. Technical information is presented at the conceptual
level first, as well as in the context of its relevance to the tests. Appendix B provides an overview
of the program’s history, as well as statutory requirements and uses.

The FSA and NGSSS assessments measure student achievement of the standards contained in
the Florida Standards and the Next Generation Sunshine State Standards, respectively. Florida’s
educational standards were developed with the goal of providing all students with an education
based on high expectations. The statewide assessment program also provides feedback and
accountability indicators to Florida educators, policy makers, students, and other citizens. This
guide contains information about the FSA and NGSSS assessments only; the FDOE website
contains information about the Florida Standards Alternate Assessment (FSAA), ACCESS for
ELLs, and the National Assessment for Educational Progress (NAEP).

It is important that statewide assessment development is guided by the active involvement of
Florida educators. FDOE maintains open communication with Florida educators regarding how
the program and the various associated processes and activities might be improved. To ensure
that the statewide assessments are accurate measures of Florida’s standards, Florida educators
are encouraged to become familiar with the process, remain up to date on new developments,
and provide feedback via committee participation. This guide is intended to provide important
background information, including further explanations of the role of educators in the assessment
process.

Statewide Assessment Program Information Guide                                                       1
1.0 Introduction

For some Florida educators, parents, and other stakeholders, much of the information in this
guide may be new; however, the development and implementation of the statewide assessment
program have been shaped by the active involvement of thousands of Florida educators serving
on various committees. Since 1995, educators have guided the development of Florida’s
educational standards, the determination of which standards to assess and how to assess them on
the statewide assessments, and how writing responses should be scored. In addition, all test items
are reviewed and accepted by committees of Florida educators. Other committee participants
include Florida citizens who share a stake in the education of Florida’s children as well as local
and national experts in psychometrics.

This guide is produced in an online format only, and contains links to resources for additional
information throughout.

Statewide Assessment Program Information Guide                                                     2
2.0 Test Content and Format

2.0 Test Content and Format
The FSA and NGSSS assessments are criterion-referenced tests that are intended to measure
whether students have made progress on the English Language Arts Florida Standards, the
Mathematics Florida Standards, the NGSSS Science Standards, and the NGSSS Social Studies
Standards. Statewide assessments are constructed to meet rigorous technical criteria and to
ensure that all students have access to the test content via principles of universal design and
appropriate accommodations.

Statewide assessments are delivered in both computer-based test (CBT) format and paper-based
test (PBT) format, and the item types listed in this section vary based on subject and delivery
mode.

2.1. Operational, Field-Test, and Anchor Items
When taking statewide assessments, all students of the same grade level respond to a common
set of items on each test. These common items are called operational items and count toward
students’ scores. Field-test items are also found on all students’ tests, but do not count toward
students’ scores. Field-test items are administered to students only to gather data on the items.

Anchor items are those which have appeared on a given test in previous years and are used to
ensure that the scores on that test can be equated or made comparable from year to year.

The next three subsections provide additional information about the different content areas and
detail the knowledge and skills assessed, item types, and other subject-specific information for
each area.

2.1.1. Test Design
The Test Design Summaries section lists the range of operational items from each reporting
category that is required on each test form. This document guides item selection and test
construction for FSA and NGSSS assessments to ensure that reporting categories and standards
are correctly represented on each test form.

The Test Item Specifications are based on Florida’s standards and course descriptions and
provide detailed guidance for item writers and reviewers to ensure that FSA items are aligned to
the standards they were intended to measure.

More information about test design is provided in Section 3.0, Test Development and
Construction.

2.1.2. Universal Design
The application of universal design principles helps develop assessments that are usable to the
greatest number of test takers, including students with disabilities and nonnative speakers of
English. To support the goal of providing access to all students, the test maximizes readability,

Statewide Assessment Program Information Guide                                                      3
2.0 Test Content and Format
legibility, and compatibility with accommodations, and test development includes a review for
potential bias and sensitivity issues. FDOE trains both internal and external reviewers to revise
test items, allowing for the widest possible range of student participation. Item writers must
attend to the best practices suggested by universal design, including, but not limited to:
reduction in wordiness,
avoidance of ambiguity,
selection of reader-friendly construction and terminology, and
consistently applied concept names and graphic conventions.
Universal design principles also inform decisions about test layout and design, including, but not
limited to, type size, line length, spacing, and graphics.
2.1.3. Cognitive Complexity/Depth of Knowledge
Statewide assessment items are classified using a model with origins in the works of Dr. Norman
Webb1 on depth of knowledge (DOK). With this system, items are classified on the cognitive
demand inherent in the test item, not on assumptions about the student’s approach to the item.
The three categories—referred to as DOK Level 1, DOK Level 2, and DOK Level 3 for FSA
assessments and low complexity, moderate complexity, and high complexity for NGSSS
assessments—form an ordered description of the cognitive demands an item makes on a student.
Items at the low level of complexity require a simple skill, such as locating details in a text or
solving a one-step problem. At the moderate level, an item can ask the student to summarize a
passage or retrieve information from a graph and use it to solve a problem. At the high level, an
item may require a student to analyze cause-and-effect relationships or justify a solution to a
problem. The distinctions made in item complexity are intended to provide a balance across the
tasks administered at each grade level. The range of the percentage of points in each complexity
level is listed for each assessment in the test blueprints and in the tables below.
Table 1: FSA Percentage of Points by Depth of Knowledge Level
Grade/Subject DOK Level 1 DOK Level 2 DOK Level 3
Grades 3–10 ELA 10%–20% 60%–80% 10%–20%
Grades 3–8 Mathematics 10%–20% 60%–80% 10%–20%
Algebra 1 and Geometry 10%–20% 60%–80% 10%–20%
Table 2: NGSSS Percentage of Points by Cognitive Complexity Level
Grade/Subject Low Moderate High
Grades 5 and 8 Science 10%–20% 60%–80% 10%–20%
Biology 1 10%–20% 60%–80% 10%–20%
Civics 15%–25% 45%–65% 15%–25%
U.S. History 20%–30% 45%–65% 15%–25%
1 Webb, Normal L. and others. “Web Alignment Tool” 24 July 2005. Wisconsin Center for Education Research.
University of Wisconsin-Madison. 2 Feb 2006. http://wat.wceruw.org/index.aspx
Statewide Assessment Program Information Guide 42.0 Test Content and Format
English Language Arts (ELA)
In grade 3, students participate in FSA ELA Reading. In grades 4 through 10, the FSA ELA test
includes two components, which are combined to provide a whole-test FSA ELA scale score: (1)
A text-based Writing component in which students respond to one writing task by writing an
essay, and (2) A reading and language component in which students respond to reading passages
and other texts; in grades 7–10, students also respond to audio and multimedia content. Writing
and Reading component item responses contribute to an overall ELA score. In this document, the
term ELA is used when referring to the combined Reading and Writing assessments; ELA
Reading is used when referring to only the Reading test form or items; and ELA Writing is used
when referring only to the text-based Writing task.
ELA Writing
The Writing component of the grades 4–10 ELA assessments consists of one text-based
constructed-response item (students read a variety of texts and respond to a prompt). There is no
Writing component at grade 3. The rubrics used for the scoring of the FSA Writing component
are based on the Writing and Language strands of the Language Arts Florida Standards.
To offer students a variety of texts on the FSA ELA Writing tests, authentic and copyrighted
passages and articles appear as they were originally published, as requested by the publisher
and/or author. While these real-world examples do not always adhere to strict style conventions
and/or grammar rules, inconsistencies among passages should not detract from students’ ability
to understand and respond to the text-based writing task.
Once students read the provided texts, they respond to a prompt. There are two possible writing
modes at each grade level. For grades 4 and 5, the prompt will ask for the writer’s opinion or ask
the writer to inform/explain. For grades 6–10, the prompt will ask the writer to provide an
argument or to inform/explain. Students will draw upon the texts to provide evidence and
information to support their claims or explanations.
Grades 4–6 students take a paper-based ELA Writing test. They read the texts and prompt in
their test and answer books and provide a handwritten response on up to three lined pages.
Grades 7–10 students take a computer-based ELA Writing test. They read the texts and prompt
in a secure, online environment. They then provide a typed response in a text box.
While the ELA Writing component is one category that contributes to the overall ELA score
(Text-Based Writing), there are three domain scores awarded for each response. The sum of
these subscores is the total score for the writing reporting category (10 raw score points).
The three domains for each grade level are:
Purpose, Focus, and Organization (4 points)
Evidence and Elaboration (4 points)
Conventions of Standard English (2 points)
Table 3: Grade 4 Text-Based Writing shows a description of a Grade 4 student response that
scored 8 points out of 10 possible points.
Statewide Assessment Program Information Guide 52.0 Test Content and Format
Table 3: Grade 4 Text-Based Writing
Conventions of Standard
Purpose, Focus, and Organization Evidence and Elaboration
English
(4 points possible) (4 points possible)
(2 points possible)
4 out of 4 possible points. 3 out of 4 possible points. 1 out of 2 possible points.
The response is fully sustained and The response provides The response demonstrates a
consistently focused within the adequate support/evidence partial command of basic
purpose, audience, and task; it has a for the controlling idea/ conventions. The response may
clearly stated controlling idea/ writer’s opinion that include various errors in usage
opinion and effective organizational includes the use of sources, and inconsistent use of correct
structure creating coherence and facts, and details. punctuation, capitalization,
completeness. sentence formation, and spelling.
More detailed information may be found in the ELA Writing scoring samplers and rubrics on the
FSA Portal.
ELA Reading
FSA ELA Reading is based on the standards found in the Reading, Literature, and Language
strands of the English Language Arts Florida Standards. FSA ELA Reading employs a wide
variety of written material to assess students’ reading comprehension as defined in the Florida
Standards. FSA ELA Reading is composed of approximately 6–8 reading passages with sets of
6–11 items based on each passage. There are two types of reading passages: informational and
literary. In order to assess student mastery of grammar and standard English conventions,
students are also asked to evaluate and correct grade-level errors in a “draft” essay.
Informational passages provide readers with facts about a particular subject and may include
magazine and newspaper articles, editorials, and biographies. Literary passages are written
primarily for readers’ enjoyment and may include short stories, poems, folk tales, and selections
from novels. Most passages are selected from published sources, although some may be written
expressly for the FSA. As students progress beyond the early grades, they will read informational
text with increasing frequency in and out of school. The percentage of informational text
students will encounter on the FSA also increases as they progress through grades. Likewise, the
range of words per passage increases across grade levels.
Table 4 suggests an approximate word count range for a text or text set.
Table 4: Approximate Word Count Range for Text or Text Set
Range of
Grade
Number of Words
3 100–700
4 100–900
5 200–1000
6 200–1100
7 300–1100
8 350–1200
9 350–1300
10 350–1350
Statewide Assessment Program Information Guide 62.0 Test Content and Format
Table 5 shows the percentages of FSA Reading text types by grade band.
Table 5: Percentages of FSA Reading Text Types by Grade Band
Grade Band Literary Informational
3–5 50% 50%
6–8 40% 60%
9–10 30% 70%
For all grade levels tested, FSA ELA assesses what students know and are able to do in the broad
reporting categories listed below. More detailed explanations can be found in the Achievement
Level Descriptions. The difficulty of the concepts assessed on FSA ELA progresses
systematically from grade to grade, as does the complexity of the text presented to the student at
each grade level.
Grade 3
Key Ideas and Details
Students read closely to comprehend, analyze, and summarize essential information and
concepts, referencing evidence from the text to support inferences and conclusions.
Craft Structure
Students interpret literal and nonliteral meanings of words/phrases. They determine how
text structures and text features impact meaning. They distinguish personal point of view
from that of the narrator or author.
Integration of Knowledge and Ideas
Students integrate and analyze content presented in diverse media formats. They analyze
treatment of similar themes or topics.
Language and Editing
Students demonstrate command of the conventions of Standard English grammar, usage,
capitalization, punctuation, and spelling. Items may ask the student to evaluate and
correct errors which focus on grammar and usage or capitalization, punctuation, and
spelling. Items should assess on-grade-level errors; however, once a language standard is
introduced, grade-appropriate items may be written to assess continued mastery of
standard conventions of English.
Grades 4–5
Key Ideas and Details
Students read closely to comprehend, analyze, and summarize essential information and
concepts, citing textual evidence to support inferences and conclusions.
Craft and Structure
Students interpret connotative and figurative meanings of words/phrases. They analyze
how text structures and text features impact the text. They determine the effects of point
of view or purpose.
Integration of Knowledge and Ideas
Students integrate and evaluate content presented in diverse media formats. They analyze
the treatment of similar themes or topics and how the author uses reasons and evidence to
support points.
Statewide Assessment Program Information Guide 72.0 Test Content and Format
Language and Editing
Students demonstrate command of the conventions of Standard English grammar, usage,
capitalization, punctuation, and spelling. Items may ask the student to evaluate and
correct errors which focus on grammar and usage or capitalization, punctuation, and
spelling. Items should assess on-grade-level errors; however, once a Language Standard
is introduced, grade-appropriate items may be written to assess continued mastery of
standard conventions of English.
Text-Based Writing
Students draw relevant evidence from various texts to support a claim or controlling idea.
They produce clear and coherent writing with development, organization, and style
appropriate to task, purpose, and audience.
Grades 6–10
Key Ideas and Details
Students read closely to understand information. They cite textual evidence to support
inferences/conclusions. They analyze development and interaction of central ideas,
themes, individuals, events, or supporting ideas. They summarize key concepts.
Craft and Structure
Students interpret connotative and figurative meanings of words/phrases. They analyze
how word choice affects meaning/ tone and how text structures impact the text. They
determine the effects of point of view or purpose.
Integration of Knowledge and Ideas
Students integrate and evaluate content presented in diverse media formats. They
evaluate arguments for claims, validity, relevance, and sufficient evidence. They analyze
treatment of similar themes or topics.
Language and Editing
Students demonstrate command of the conventions of Standard English grammar, usage,
capitalization, punctuation, and spelling. Items may ask the student to evaluate and
correct errors which focus on grammar and usage or capitalization, punctuation, and
spelling. Items should assess on-grade-level errors; however, once a Language Standard
is introduced, grade-appropriate items may be written to assess continued mastery of
standard conventions of English.
Text-Based Writing
Students draw relevant evidence from various texts to support a claim or controlling idea.
They produce clear and coherent writing with development, organization, and style
appropriate to task, purpose, and audience.
Table 6: FSA ELA Reading Percentage of Points by Reporting Category
Key Ideas Integration of Language
Grades Craft and Structure
and Details Knowledge and Ideas and Editing
3–10 15%–25% 25%–35% 20%–30% 15%–25%
Statewide Assessment Program Information Guide 82.0 Test Content and Format
Mathematics
FSA Mathematics is based on the Mathematics Florida Standards and the Florida Course
Descriptions. FSA Mathematics is administered to students in grades 3–8, and two mathematics
FSA EOCs, Algebra 1 and Geometry, are administered to students enrolled in and completing
the respective course (or an equivalent course).
Reference sheets and calculators are provided for certain assessments. More information about
these resources can be found in the Calculator and Reference Sheet Policies for Florida
Standards Assessments (FSA) Mathematics Assessments document.
For all grade levels and subjects tested, FSA Mathematics assesses what students know and are
able to do in the broad reporting categories listed below. More detailed explanations can be
found in the Achievement Level Descriptions.
Grade 3
Operations, Algebraic Thinking, and Numbers in Base Ten
Students represent and solve problems involving multiplication and division. They
understand properties of multiplication and the relationship between multiplication and
division. They multiply and divide within 100. They solve problems involving the four
operations, and identify and explain patterns in arithmetic. They use place value
understanding and properties of operations to perform multi-digit arithmetic.
Numbers and Operations—Fractions
Students develop understanding of fractions as numbers.
Measurement, Data, and Geometry
Students solve problems involving measurement and estimation of intervals of time,
liquid volumes, and masses of objects. They represent and interpret data. They
understand concepts of area and relate area to multiplication and addition. They
recognize perimeter as an attribute of plane figures and distinguish between linear and
area measures. They reason with shapes and their attributes.
Table 7: Grade 3 FSA Mathematics Percentage of Points by Reporting Category
Operations, Algebraic
Numbers and Measurement, Data,
Thinking, and Numbers
Operations—Fractions and Geometry
in Base Ten
48% 17% 35%
Grade 4
Operations and Algebraic Thinking
Students use the four operations with whole numbers to solve problems. They gain
familiarity with factors and multiples. They generate and analyze patterns.
Numbers and Operations in Base Ten
Students generalize place value understanding for multi-digit whole numbers. They use
place value understanding and properties of operations to perform multi-digit arithmetic.
Statewide Assessment Program Information Guide 92.0 Test Content and Format
Numbers and Operations—Fractions
Students extend understanding of fraction equivalence and ordering. They build fractions
from unit fractions by applying and extending previous understandings of operations on
whole numbers. They understand decimal notation for fractions and compare decimal
fractions.
Measurement, Data, and Geometry
Students solve problems involving measurement and conversion of measurements from a
larger unit to a smaller unit. They represent and interpret data. They understand concepts
of angle and measure angles. They draw and identify lines and angles and classify shapes
by properties of their lines and angles.
Table 8: Grade 4 FSA Mathematics Percentage of Points by Reporting Category
Numbers and Numbers and
Operations and Measurement, Data,
Operations Operations—
Algebraic Thinking and Geometry
in Base Ten Fractions
21% 21% 25% 33%
Grade 5
Operations, Algebraic Thinking, and Fractions
Students write and interpret numerical expressions. They analyze patterns and
relationships. They use equivalent fractions as a strategy to add and subtract fractions.
They apply and extend previous understandings of multiplication and division to multiply
and divide fractions.
Numbers and Operations in Base Ten
Students understand the place value system. They perform operations with multi-digit
whole numbers and decimals to hundredths.
Measurement, Data, and Geometry
Students convert like measurement units within a given measurement system. They
represent and interpret data. They understand concepts of volume and relate volume to
multiplication and addition. They graph points on the coordinate plane to solve real-
world and mathematical problems. They classify two-dimensional figures into categories
based on their properties.
Table 9: Grade 5 FSA Mathematics Percentage of Points by Reporting Category
Operations, Algebraic Numbers and Operations Measurement, Data,
Thinking, and Fractions in Base Ten and Geometry
39% 28% 33%
Grade 6
Ratio and Proportional Relationships
Students understand ratio concepts and use ratio reasoning to solve problems.
Expressions and Equations
Students apply and extend previous understandings of arithmetic to algebraic
expressions. They reason about and solve one-variable equations and inequalities. They
represent and analyze quantitative relationships between dependent and independent
variables.
Statewide Assessment Program Information Guide 102.0 Test Content and Format
Geometry
Students solve real-world and mathematical problems involving area, surface area, and
volume.
Statistics and Probability
Students develop understanding of statistical variability. They summarize and describe
distributions.
The Number System
Students apply and extend previous understandings of multiplication and division to
divide fractions by fractions. They compute fluently with multi-digit numbers and find
common factors and multiples. They apply and extend previous understandings of
numbers to the system of rational numbers.
Table 10: Grade 6 FSA Mathematics Percentage of Points by Reporting Category
Ratio and
Expressions Statistics & The Number
Proportional Geometry
and Equations Probability System
Relationships
15% 30% 15% 19% 21%
Grade 7
Ratio and Proportional Relationships
Students analyze proportional relationships and use them to solve real-world and
mathematical problems.
Expressions and Equations
Students use properties of operations to generate equivalent expressions. They solve real-
life and mathematical problems using numerical and algebraic expressions and equations.
Geometry
Students draw, construct, and describe geometrical figures and describe the relationships
between them. They solve real-life and mathematical problems involving angle measure,
area, surface area, and volume.
Statistics and Probability
Students use random sampling to draw inferences about a population. They draw
informal comparative inferences about two populations. They investigate chance
processes and develop, use, and evaluate probability models.
The Number System
Students apply and extend previous understandings of operations with fractions to add,
subtract, multiply, and divide rational numbers.
Table 11: Grade 7 FSA Mathematics Percentage of Points by Reporting Category
Ratio and
Expressions and Statistics & The Number
Proportional Geometry
Equations Probability System
Relationships
25% 21% 23% 16% 15%
Statewide Assessment Program Information Guide 112.0 Test Content and Format
Grade 8
Expressions and Equations
Students work with radicals and integer exponents. They understand the connections
between proportional relationships, lines, and linear equations.
Functions
Students define, evaluate, and compare functions. They use functions to model
relationships between quantities.
Geometry
Students understand congruence and similarity using physical models, transparencies, or
geometry software. They understand and apply the Pythagorean Theorem. They solve
real-world and mathematical problems involving volume of cylinders, cones, and
spheres.
Statistics and Probability and the Number System
Students investigate patterns of association in bivariate data. They know that there are
numbers that are not rational and approximate them by rational numbers.
Table 12: Grade 8 FSA Mathematics Percentage of Points by Reporting Category
Statistics & Probability
Expressions and Equations Functions Geometry
and The Number System
30% 25% 27% 18%
Algebra 1
Algebra and Modeling
Students perform operations on polynomials. They understand the relationship between
zeros and factors of polynomials. They use mathematical structure of expressions. They
create, solve, and reason with equations and inequalities. They choose and use
appropriate mathematics to model situations.
Functions and Modeling
Students understand the concept of a function. They interpret functions and key features
in a context. They analyze and graph functions. They build a function that models a
relationship. They construct linear, quadratic, and exponential functions. They solve
problems using functions.
Statistics and the Number System
Students extend the properties of exponents to rational exponents. They use properties of
rational and irrational numbers. They summarize, represent, and interpret data for one-
and two-variable data. They interpret linear models.
Table 13: FSA Algebra 1 Percentage of Points by Reporting Category
Statistics and
Algebra and Modeling Functions and Modeling
The Number System
41% 40% 19%
Statewide Assessment Program Information Guide 122.0 Test Content and Format
Geometry
Congruence, Similarity, Right Triangles, and Trigonometry
Students understand congruence and similarity in terms of transformations. They prove
and use geometric theorems. They demonstrate geometric constructions. They define
trigonometric ratios. They solve problems involving right triangles. They use congruence
and similarity criteria for triangles.
Circles, Geometric Measurement, and Geometric Properties with Equations
Students prove and apply theorems about circles. They find arc lengths and areas of
sectors. They derive the equation of a circle. They use coordinates to prove theorems and
to solve problems algebraically. They explain and use volume formulas.
Modeling with Geometry
Students apply geometric concepts in modeling situations.
Table 14: FSA Geometry Percentage of Points by Reporting Category
Circles, Geometric
Congruence, Similarity, Right
Measurement, and Geometric Modeling with Geometry
Triangles, and Trigonometry
Properties with Equations
46% 38% 16%
FSA ELA Reading and Mathematics Item Types
All tests contain traditional multiple-choice items, and the following list contains all additional
possible item types that may appear on FSA ELA Reading and Mathematics tests. If a CBT item
type is modified in any way so that it may be presented on a paper-based form, that information
is included in the descriptions below.
Any of the item types may be combined into a single item with multiple parts called a multi-
interaction item. The student will interact with different item types within a single item. Each
part could be a different item type. For paper-based assessments, this item type may be replaced
with a modified version of the item that can be scanned and scored electronically, or replaced
with another item type that assesses the same standard and can be scanned and scored
electronically.
Grades 3–6 Paper-Based ELA Item Types
1. Multiple-Choice: Students select one correct answer from four answer choices.
2. Editing Task Choice: The student reads a short passage with underlined words and phrases.
The student selects the correct word or phrase that should replace the underlined word or
phrase from a set of options. One option will always be correct “as is.”
3. Selectable Text: Excerpted sentences from the text are presented in this item type. These
items may have one or two parts. In a two-part selectable text item, Part A might ask the
student to make an analysis or an inference, and Part B might require the student to select the
text to support the answer in Part A.
4. Multiselect: The student is directed to select a specific number of correct answers from
among the options provided. These items are different from multiple-choice items, which
prompt the student to select only one correct answer.
Statewide Assessment Program Information Guide 132.0 Test Content and Format
5. Evidence-Based Selected Response (EBSR): In this two-part item, the student is directed to
select the correct answers from Part A and Part B. Typically Part A is multiple-choice,
whereas Part B may be either multiple-choice or multiselect. Part A often asks the student to
make an analysis or an inference, and Part B requires the student to use the text to support the
answer in Part A.
6. Table Match: This item type presents options in columns and rows. Options may include
words, phrases, sentences, quotations, line/paragraph/passage numbers, or images. The
student is directed to select a box that matches a correct option from a column with a correct
option from a row. Typically, there is only one correct option per row or column, though the
number of correct answers may vary.
7. Multimedia: Enhanced content may include multimedia elements such as images, charts,
graphics timelines, etc. Multimedia elements may appear within passages (stimuli) or test
items. Any of the item types described above may be used to assess the multimedia content.
Grades 3–6 Paper-Based Mathematics Item Types
1. Multiple-Choice: Students select one correct answer from four answer choices.
2. Equation Editor/Gridded-Response: Students enter a value into a grid. Grade 3 grids have
number and fraction bar bubbles, grades 4 and 5 grids have number, fraction bar, and decimal
point bubbles, and grade 6 grids have number, fraction bar, decimal point, and negative sign
bubbles. For examples of grids on grades 7 and 8 and EOC Mathematics paper-based
accommodations, see the paper-based practice tests on the FSA Portal.
Grade 3 Grades 4 and 5 Grade 6
3. Editing Task Choice: The student fills in a bubble to indicate the correct number, word,
or phrase that should replace a blank or a highlighted number, word, or phrase.
4. Selectable Hot Text: Excerpted sentences from the text are presented in this item type. The
student fills in bubbles to indicate which sentences are correct.
5. Multiselect: The student is directed to select all of the correct answers from among the
options provided. These items are different from multiple-choice items, which prompt the
student to select only one correct answer.
Statewide Assessment Program Information Guide 142.0 Test Content and Format
6. Matching: This item type presents options in columns and rows. The student is directed to
select a box that matches a correct option from a column with a correct option from a row.
Typically, there is only one correct option per row or column, though the number of correct
answers may vary.
Grades 7–10 Computer-Based ELA and Mathematics Item Types
1. Multiple-Choice: Students select one correct answer from four answer choices.
2. Editing Task Choice: The student clicks a highlighted word or phrase, which reveals a drop-
down menu containing options for correcting an error as well as the highlighted word or
phrase as it is shown in the sentence to indicate that no correction is needed. The student then
selects the correct word or phrase from the drop-down menu. For paper-based assessments,
the item is modified so that it can be scanned and scored electronically. The student fills in a
bubble to indicate the correct word or phrase.
3. Editing Task: The student clicks on a highlighted word or phrase that may be incorrect,
which reveals a textbox. The directions in the text box direct the student to replace the
highlighted word or phrase with the correct word or phrase. For paper-based assessments,
this item type will be replaced with another item type that assesses the same
standard/reporting category and can be scanned and scored electronically.
4. Hot Text
a. Selectable Hot Text: Excerpted sentences from the text are presented in this item type.
When the student hovers over certain words, phrases, or sentences, the options are
highlighted. This indicates that the text is selectable (“hot”). The student can then click an
option to select it. These items may have one or two parts. In a two-part hot text item,
Part A may ask the student to make an analysis or an inference, and Part B may require
the student to use the text to support the answer in Part A. In other cases, the two parts
may function independently. For paper-based assessments, a “selectable” hot text item is
modified so that it can be scanned and scored electronically. In this version, the student
fills in a bubble to indicate a selection.
b. Drag-and-Drop Hot Text: Certain words, phrases, or sentences may be designated
“draggable” in this item type. When the student hovers over these areas, the text is
highlighted. The student can then click on the option, hold down the mouse button, and
drag the option to a graphic organizer or other format. For paper-based assessments,
drag-and-drop hot text items will be modified or replaced with another item type that
assesses the same standard/reporting category and can be scanned and scored
electronically.
5. Open Response: The student uses the keyboard to enter a response into a text field. These
items may require entering a numerical value or can usually be answered in a sentence or
two. For accommodated paper-based assessments, this item type may be replaced with
another item type that assesses the same standard/reporting category and can be scanned and
scored electronically.
6. Multiselect: The student is directed to select a specific number or all of the correct answers
from among the options provided. These items are different from multiple-choice items,
which allow the student to select only one correct answer. These items appear in the online
and paper-based accommodations.
Statewide Assessment Program Information Guide 152.0 Test Content and Format
7. Evidence-Based Selected Response (ELA only): In this two-part item, the student is
directed to select the correct answers from Part A and Part B. Typically Part A is multiple-
choice, whereas Part B may be either multiple-choice or multiselect. Part A often asks the
student to make an analysis or an inference, and Part B requires the student to use the text to
support the answer in Part A. These items appear in the online and paper-based assessments.
8. Graphic Response Item Display (GRID): The student may select numbers, words, phrases,
or images and use the drag-and-drop feature to place them into a graphic organizer or other
format. This item type may also require the student to use the point, line, or arrow tools to
create a response on a graph. For paper-based assessments, this item type may be replaced
with another item type that assesses the same standard/reporting category and can be scanned
and scored electronically.
9. Table Match: This item type presents options in columns and rows. Options may include
numerical values, words, phrases, sentences, quotations, line/paragraph/passage numbers, or
images. The student is directed to click a box that matches a correct option from a column
with a correct option from a row. Typically, there is only one correct option per row or
column, though the number of correct answers may vary. These items appear in the online
and paper-based assessments. For paper-based assessments, the item is modified so that it
can be scanned and scored electronically. The student fills in a circle to indicate the correct
selection.
10. Multimedia (ELA only): Technology-enhanced content may include multimedia elements
such as audio clips, slideshows, or animations. Multimedia elements may appear within
passages (stimuli) or test items. Any of the item types described above may be used to assess
the multimedia content. For paper-based assessments, multimedia content may be modified
or replaced by paper-based items or stimuli that assess the same reporting category.
11. Equation Editor (Mathematics only): The student is presented with a toolbar that includes
a variety of mathematical symbols that can be used to create a response. Responses may be in
the form of a number, variable, expression, or equation, as appropriate to the test item. For
paper-based assessments, this item type may be replaced with a modified version of the item
that can be scanned and scored electronically or replaced with another item type that assesses
the same standard and can be scanned and scored electronically.
12. Table Item (Mathematics only): The student types numeric values into a given table. The
student may complete the entire table or portions of the table depending on what is being
asked. For paper-based assessments, this item type may be replaced with another item type
that assesses the same standard and can be scanned and scored electronically.
CBT and PBT ELA and Mathematics Practice Tests are on the FSA Portal and include examples
of all item types listed above. The Practice Tests Guide provides an overview of the item types
that students may see on the practice tests and general guidelines on how to respond to items.
Science
Florida’s Science assessments are based on the benchmarks found in the Science NGSSS and the
Florida Course Descriptions. The Statewide Science Assessment is administered to students in
grades 5 and 8, and the NGSSS Biology 1 EOC Assessment is administered to students enrolled
in and completing the course (or an equivalent course).
Statewide Assessment Program Information Guide 162.0 Test Content and Format
The Grades 5 and 8 Statewide Science Assessments include multiple-choice items only. For both
grade levels tested, the Statewide Science Assessment tests what students know and are able to
do in the broad reporting categories listed below. More detailed explanations can be found in the
Achievement Level Descriptions.
Grade 5
Nature of Science
Students evaluate investigations and experiments, organize data, identify the control
group in an experiment, interpret data and analyze information, and distinguish between
observations and opinions.
Earth and Space Science
Students distinguish among objects in our solar system, identify categories of rocks and
characteristics of minerals, differentiate between physical weathering and erosion,
identify characteristics associated with different climate zones, and identify factors that
affect weather.
Physical Science
Students identify basic forms of energy; identify familiar forces; trace the conversion of
electric energy into other forms of energy; and distinguish relationships among mass,
force, and motion.
Life Science
Students identify the function of human body organs, compare life cycles of Florida
plants and animals, identify adaptations in animals and plants that allow them to survive,
and trace energy through a food chain.
Grade 8
Nature of Science
Students identify test and outcome variables in an experiment, differentiate between
experiments and investigations, analyze information to make inferences or predictions,
differentiate between replication and repetition, and distinguish between theories and
laws.
Earth and Space Science
Students relate the positions of the Sun, Moon, and Earth that result in tides, moon
phases, and eclipses; identify Earth changes due to weathering, erosion, and plate
tectonics; and recognize that the Sun’s energy influences global atmospheric patterns.
Physical Science
Students classify substances by physical properties, differentiate between physical and
chemical change, distinguish between kinetic and potential energy, and differentiate
contact forces and forces acting at a distance.
Life Science
Students identify functions of the human body systems, classify organisms, identify ways
genetic variation contributes to the scientific theory of evolution, determine probabilities
for genotypic and phenotypic combinations, and distinguish relationships among
organisms in a food web.
Statewide Assessment Program Information Guide 172.0 Test Content and Format
Table 15: Statewide Science Percentage of Points by Reporting Category
Grade Nature of Science Earth and Space Science Physical Science Life Science
5 17% 29% 29% 25%
8 19% 27% 27% 27%
Biology 1
The Biology 1 EOC Assessment measures student achievement of the NGSSS in science, as
outlined in the Biology 1 course description. The test consists of multiple-choice items that
measure what students know and are able to do in the broad reporting categories listed below.
More detailed explanations can be found in the Achievement Level Descriptions.
Molecular and Cellular Biology
Students compare prokaryotic and eukaryotic cells, differentiate between mitosis and
meiosis, relate the structure and function of the four major categories of biological
macromolecules, and differentiate the processes of photosynthesis and cellular
respiration.
Classification, Heredity, and Evolution
Students identify evidence that supports the scientific theory of evolution, classify
organisms into domains or kingdoms, identify scientific explanations of the origin of life,
determine conditions required for natural selection, and analyze patterns of inheritance.
Organisms, Populations, and Ecosystems
Students relate structure and function of organs and tissues in plants and animals; identify
the structures and functions of organs in the human reproductive system, vascular system,
central nervous system, and immune system; evaluate factors contributing to changes in
population size; determine consequences of the loss of biodiversity; and evaluate the
impact of biotechnology.
Table 16: NGSSS Biology 1 Percentage of Points by Reporting Category
Category Percentage
Molecular and Cellular Biology 35%
Classification, Heredity, and Evolution 25%
Organisms, Populations, Ecosystems 40%
Social Studies
Florida’s Social Studies assessments are based on the benchmarks found in the NGSSS and the
Florida Course Descriptions. The NGSSS Civics and U.S. History EOC assessments are
administered to students enrolled in and completing the respective course (or an equivalent
course).
Civics
The Civics EOC Assessment measures student achievement of the NGSSS in social studies, as
outlined in the M/J Civics course description. The test consists of multiple-choice items that
measure what students know and are able to do in the broad reporting categories listed below.
More detailed explanations can be found in the Achievement Level Descriptions.
Statewide Assessment Program Information Guide 18You can also read