Education on Wheels Seizing Cost and Energy Efficiency Opportunities in Student Transportation
←
→
Page content transcription
If your browser does not render page correctly, please read the page content below
Education on Wheels
  Seizing Cost and Energy Efficiency
Opportunities in Student Transportation
                     Paul W. Bennett, Ed.D
                Director of Schoolhouse Consulting
      Adjunct Professor of Education at Saint Mary’s University

                          Derek M. Gillis
                 Independent Research Consultant
Coordinator of GPI Atlantic’s YouthRide! Research and Action Project

                           January 2015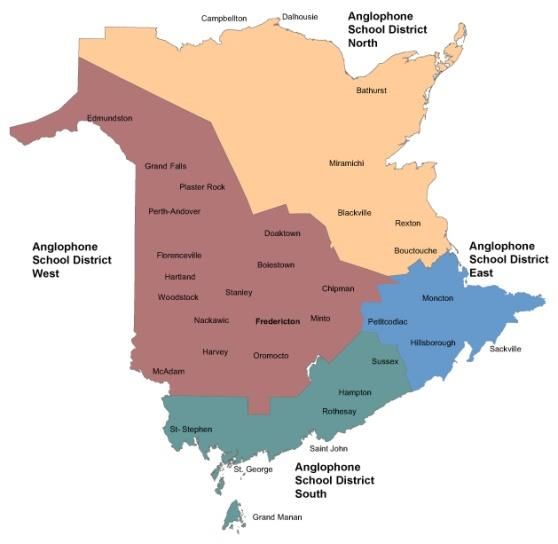
Education on Wheels: Seizing Cost and Energy Efficiency Opportunities in Student Transportation

The Atlantic Institute for Market Studies (AIMS)
AIMS is a Canadian non-profit, non-partisan think tank that provides a distinctive Atlantic
Canadian perspective on economic, political, and social issues. The Institute sets the benchmark
on public policy by drawing together the most innovative thinking available from some of the
world's foremost experts and applying that thinking to the challenges facing Canadians.

AIMS was incorporated as a non-profit corporations under Part II of the Canada Corporations
Act and was granted charitable registration by Revenue Canada as of 3 October 1994. It received
US charitable recognition under 501(c)(3), effective the same date.

287 Lacewood Drive, Second Floor, Suite 204
Halifax, Nova Scotia, Canada B3M 3Y7
Telephone: (902) 429-1143
Email: aims@AIMS.ca
Website: www.AIMS.ca

Board of Directors

Chairman: John Risley
Former Chairman: John F. Irving
President and CEO: Marco Navarro-Genie
Vice-Chair: Laura Araneda (New Brunswick)
Vice-Chair: David Hooley (Prince Edward Island)
Vice-Chair: Leo Power (Newfoundland and Labrador)
Secretary: Fae Shaw
Treasurer: Elaine Sibson

Directors: Paul Antle, Lee Bragg, Robert Campbell, Stephen Emmerson, Richard Florizone,
Nelson Hagerman, Douglas Hall, Mary Keith, Dennice Leahey, Scott McCain, Todd McDonald,
Jonathan Meretsky, Jonathan Norwood, Don Mills, Bob Owens, Jason Shannon, Maxime St.
Pierre, Peter Woodward

Advisory Council

George Bishop, Angus Bruneau, George Cooper, Ivan Duvar, Peter Godsoe, James Gogan,
Frederick Hyndman, Bernard Imbeault, Phillip Knoll, Colin Latham, Norman Miller, James
Moir, Jr., Gerald L. Pond, Cedric E. Ritchie, Allan C. Shaw, Joseph Shannon

Board of Research Advisors

Advisors: Charles Colgan, J. Colin Dodds, Morley Gunderson, Doug May, Jim McNiven, Robert
Mundell

2                                   © 2015 Atlantic Institute for Market Studies
Education on Wheels: Seizing Cost and Energy Efficiency Opportunities in Student Transportation

Table of Contents
About the Authors............................................................................................................................4

Overview: Seizing the Opportunities in Student Transportation.....................................................5

Student Transportation: Identifying the Hidden Policy Issues........................................................6

Getting to School: Growth of the Student Transportation System................................................10

Provincial Funding and the Operational Framework.....................................................................14

Current Funding and Cost Management Concerns........................................................................18

Critical Issues.................................................................................................................................20

Promising Practices: Toward Sustainability and Energy Efficiency.............................................23

Conclusion and Recommendations................................................................................................27

References......................................................................................................................................32

3                                             © 2015 Atlantic Institute for Market Studies

Education on Wheels: Seizing Cost and Energy Efficiency Opportunities in Student Transportation

About the Authors
Paul W. Bennett, Ed.D., is Founding Director of Schoolhouse Consulting and Adjunct Professor
of Education, Saint Mary’s University, Halifax, NS. Over a professional career spanning four
decades, Dr. Bennett has researched and written eight books, conducted policy studies, produced
many major research reports, and published numerous articles in the popular and academic press.
This research report is his sixth education policy paper prepared for the Atlantic Institute for
Market Studies (AIMS) over the past five years.

Dr. Bennett is well versed on student transportation matters. As an elected Ontario Public School
Trustee (1988-97), he chaired the Transportation Committee at the York Region Board of
Education, Ontario’s fourth largest school board. From 1993 to 1997, he initiated and co-chaired
the York Region Joint Board Consortium on Transportation Services, one of the first of its kind
in the country. That initiative won him two recognition awards, including one from the Ontario
School Bus Operators Association. Since then, Paul has always taken an active interest in student
transportation issues. His two most recent books, Vanishing Schools, Threatened Communities
(2011) and The Last Stand (2013) both focused on rural decline, educational consolidation, and
school closures–and explored the impact of long school bus rides on today’s students.

Derek M. Gillis is an independent Halifax research consultant specializing in sustainable
transportation research, program development, coordination, youth and adult education and
community engagement. Derek coordinated GPI Atlantic’s Youth Ride! Research and Action
Project, engaging 37 youth to investigate and share their own perspectives about access to
transportation in non-urban communities and how it relates to well-being and connection to
community.

Mr. Gillis is dedicated to addressing public/community transit issues as an active board member
of Community Transit-Nova Scotia, currently advocating and advancing more viable community
transportation solutions. He developed vehicle fleet and fuel management programs, efficient
driving education, and drive less initiatives with The Clean Foundation (formerly known as
Clean Nova Scotia) between 2009 and 2013. More recently, he has been working for
CarShareHFX.

4                                   © 2015 Atlantic Institute for Market Studies
Education on Wheels: Seizing Cost and Energy Efficiency Opportunities in Student Transportation

Overview: Seizing the Opportunities in Student Transportation
Public schools in most of Maritime Canada simply do not operate anymore without a ready fleet
of yellow buses. More and more of our school tax dollars are going to provide services outside
the classroom in the form of “Education on Wheels,” otherwise known as daily student
transportation.

Annual busing costs have risen at a time of significantly declining student enrolments. From
1987 to 2014, judging from the published figures, student transportation costs in New Brunswick
have doubled from $31.3 million (CEA, 1987) to $58.7 million (School Bus Fleet, 2014). More
is being spent to transport a shrinking student population that plummeted from 120,600 to
102,579 (14.9%) in the recent ten year period from 2002-3 to 2011-12 (NB Data Points 2013). In
Nova Scotia, over the past five years, student transportation costs (actual operating costs for full-
time students) have risen from $64.2 million to $71.2 million, an increase of 10.9 percent at a
time when overall P-12 enrolment shrunk by 8.3 percent from 131,159 to 120,340 students.

While mounting student transportation costs is fast becoming a major challenge for provincial
education authorities and school boards, the critical issues remain shrouded in mystery and
largely hidden from the public. School transportation policy is essentially driven by provincial
grants and the official 3.6 km/2.4 km/1.6 km ‘Walk Limit Standard’ entrenched in the long-
standing regulations.

School closures and consolidation are routinely implemented as cost reduction measures without
any real disclosure of the impact on school board or provincial school busing costs. Small school
advocates and community activists who ask questions about the added costs to taxpayers are
assured that it is either of no concern or that more students can simply be added to existing bus
routes. Given the escalating costs identified in this report, those rationalizations no longer
suffice. With some 68 percent of all Nova Scotia students riding the buses and some regional
boards busing over 90 percent of their pupils, it is time to blow the whistle.

School board initiatives aimed at containing costs by fiddling with local busing regulations and
enforcing walking distances have little effect because daily home-to-school student
transportation, driven largely by school closures and fuel costs, is taking a bigger and bigger bite
out of provincial education spending.

Student transportation is a hidden public policy issue that now requires attention by both
provincial auditors and utility review boards. In response to our investigation into student
transportation, the Nova Scotia Department of Education and Early Childhood Development
went to extraordinary lengths over two months to collect the province-wide data and summarize
it for use in this report. Assembling reliable data was a formidable challenge in the absence of
any requirement for full public disclosure of the scale and cost of operations.

Fortunately, critical policy research in Ontario has identified the most potentially productive
points of investigation: the impact of provincial subsidies, preferential purchasing arrangements,
and oligopolistic market tendencies, sharing of services, and a whole range of further cost and
energy efficiencies. The establishment of joint board consortia in Ontario, mandated province-

5                                   © 2015 Atlantic Institute for Market Studies
Education on Wheels: Seizing Cost and Energy Efficiency Opportunities in Student Transportation

wide in 2006, now provides us with concrete examples of its short and longer-term cost and
management effectiveness benefits.

Better managing the bus fleet and achieving cost reductions are only one side of the public policy
issue. Nova Scotia’s Chief Medical Officer of Health, Dr. Robert Strang, has urged policy-
makers to look at the impact of school consolidation and busing on the health of children and
youth. Community advocacy groups such as Community Transit-Nova Scotia and the Ecology
Action Centre share this concern and support public policy initiatives promoting active, healthy
transportation alternatives. A comprehensive audit of student transportation might open the door
to community planning more focused on establishing walkable schools in healthier local
communities.

Student transportation needs to be factored into public policy discussion about containing
education costs and creating liveable, walkable communities. School consolidation, provincial
subsidization of student busing, the disappearance of smaller community schools, the role of
joint board consortia, and other proven cost and energy efficiencies are all critical issues
awaiting to be addressed in Maritime provincial school systems.

School budgets are under more pressure than ever before and the focus should be on ensuring
that scarce resources are spent in the classroom to the greatest possible extent. Now is the time to
seize the cost and energy efficiency opportunities in the previously neglected domain of student
transportation services.

Student Transportation: Identifying the Hidden Policy Issues
Transporting students to school is consuming more and more of the costs of public education in
provincial school systems (Drummond 2012, 220-4; Monteiro and Atkinson 2012). In Nova
Scotia over the past five years, student transportation costs (actual operating costs for full time
students) have risen from $64.2 million to $71.2 million, an increase of 10.9 percent (Nova
Scotia 2014b), at a time when overall enrolment in primary and secondary education continues to
decline. Although transportation costs are fast becoming a major challenge for provincial
education authorities and school boards, the critical issues remain shrouded in mystery and
largely hidden from the public. School transportation policy is essentially driven by provincial
grants and official walk limit standards entrenched in long-standing regulations. School board
initiatives aimed at containing costs by fiddling with local busing regulations and enforcing
walking distances have little effect when “Education on Wheels” is taking a bigger and bigger
bite out of provincial education spending, as Table 1 shows for Nova Scotia (Nova Scotia
2014b).

School closures and consolidation are routinely implemented as cost-reduction measures without
any real disclosure of the impact on school board or provincial school busing costs. Small-school
advocates and community activists who ask questions about the added costs to taxpayers are
assured either that it is of no concern or that more students can simply be added to existing bus
routes (Bennett 2013, 29-32). Behind the scenes, school boards claim that costs are “at the
breaking point,” and lobby fiercely for increased grant support to maintain or augment their bus
fleets. As a 2008 Alberta School Boards Association report quipped, it is “the stone in

6                                   © 2015 Atlantic Institute for Market Studies
Education on Wheels: Seizing Cost and Energy Efficiency Opportunities in Student Transportation

everybody’s shoe” (ASBA 2008, 3). Yet, in the case of Nova Scotia, closing schools and putting
more students on buses has only compounded the problem. Five years ago three in five students
(62.8 percent) were bused to school each day; by the 2013-14 school year, two-thirds (68.1
percent) of the province’s students rode the buses (see Table 2) and travelled longer average
daily distances (Nova Scotia 2014b).

Table 1: Student Transportation Expenditures, by School Board, NS, 2009-14
Source: Nova Scotia 2014b

Today, student transportation is a major public expenditure, particularly in Atlantic Canada,
where rural school districts still predominate and a high proportion of students are transported to
school each day. Yet school bus expenditures, funded mostly through provincial grants, have
rarely, if ever, been audited and remain largely unexplored by researchers. A 1987 Canadian
Education Association (CEA) study provided an overview of the national picture, covering 158
school boards, and documented wide variations in the operation, regulation, and funding of bus
fleets from one province to another. In the case of the four Atlantic provinces, the CEA reported
that $99.3 million was spent during 1986-87 on pupil transportation, representing from 5.40
percent to 7.03 percent of total provincial education budgets (CEA 1987). In comparative school
board data, the study identified expanding student bus transportation as closely connected with
the process of school consolidation in rural and remote school districts.

Comparative analysis of Canadian student transportation is a challenge in the absence of a
federal presence in education and the limitations of the published data. A North American trade
magazine, School Bus Fleet, provides annual summaries of Canadian pupil transportation data by
province, so there is some basis for comparison. Its reports from 2007 to 2014 include New
Brunswick and Nova Scotia, and report on the number of school buses, number of students
transported, total kilometres of service, and, on a limited basis, provincial funding levels. In New
Brunswick, from 1987 to 2014, student enrolment significantly declined but annual busing costs
almost doubled from $31.3 million (CEA, 1987) to $58.7 million (School Bus Fleet, 2014). In

7                                   © 2015 Atlantic Institute for Market Studies
Education on Wheels: Seizing Cost and Energy Efficiency Opportunities in Student Transportation

    June 2013, the magazine reported that Nova Scotia had a total school bus fleet of 1,376, 149 (or
    10 percent) more than six years earlier. (School Bus Fleet 2007–14), even though school
    enrolment has plummeted. Official Nova Scotia Education Department data covering the
    province’s eight school boards for the 2009-14 period contradict the School Bus Fleet’s
    information, showing slightly fewer buses (1,073 to 1,100), but report much higher costs per
    student transported and a growing proportion of all students (5.3 percent more) dependent on
    daily bus transportation (Nova Scotia 2014b).

    Table 2: Student Population & Students Bused, by School Board, NS, School Years 2009-14
    Source: Nova Scotia 2014b

             School Boards
(number of students; percentage based in          2009–10          2010–11         2011–12      2012–13   2013–14
              parenthesis)

                                                  14,882           14,415          14,079       13,585    13,341
Annapolis
                                                  (85.1)           (83.0)          (82.7)       (87.5)    (84.8)

                                                  16,312           15,307          14.575       13,977    13,673
Cape Breton-Victoria
                                                  (N/A)            (44.0)          (44.7)       (48.6)    (49.0)

                                                  22,196           21,750          21,295       20,954    20,423
Chignecto
                                                  (76.3)           (77.2)          (77.8)       (78.7)    (82.3)

Conseil Scolaire Acadien Provincial               4,227            4,316           4,415        4,556     4,718
(CSAP)                                            (95.0)           (97.0)          (85.9)       (86.8)    (94.2)

                                                  51,388           50,480          49,552       49,027    48,596
Halifax
                                                  (42.8)           (44.7)          (46.4)       (47.5)    (50.4)

                                                  7,347            7,307           6,949        6,864     6,681
South Shore
                                                  (91.6)           (90.4)          (93.1)       (91.6)    (92.4)

                                                  7,382            7,289           6,988        6,804     6,633
Strait Region
                                                  (96.2)           (96.0)          (95.7)       (96.2)    (95.9)

                                                  7,425            6,938           6,680        6,401     6,275
Tri County
                                                  (80.0)           (83.8)          (89.1)       (90.7)    (90.0)

                                                  131,159          127,802         124,533      122,168   120,340
Totals
                                                  (62.8)           (63.9)          (64.7)       (66.3)    (68.1)

    Student transportation trends in the Maritimes tend to be at odds with the recent pattern across
    North America. Looking at the entire US kindergarten to grade 12 (K-12) student population,
    slightly over half (55.3 percent) of the 25.3 million students in 2004 were transported on school
    buses at public expense (SRSNP 2014; Vincent et al. 2014). A 2009 study of how US elementary

    8                                   © 2015 Atlantic Institute for Market Studies
Education on Wheels: Seizing Cost and Energy Efficiency Opportunities in Student Transportation school students get to school demonstrates that, although the proportion of K-12 students bused has remained at about 39 percent over the past forty years, the proportion driven by parents has jumped from 12 percent to 45 percent. Most significantly, the proportion of US students walking or bicycling to school has dropped from 48 percent to only 13 percent (NCSRS 2011). Such a pattern is not as evident in Maritime cities such as Halifax, Saint John, Moncton, and Fredericton. In the Halifax Regional School Board, for example, 24,509 of 48,596 students (50.4 percent) were bused during the 2013–14 school year, about 7.6 percent more than five years earlier. For small-town and rural Maritime children, going to school in those distinctive yellow buses still predominates, with most school districts busing between 80 and 95.9 percent of their students to and from school each day from September to June (MacIntyre 2014; Nova Scotia 2014b). Over the past thirty years, provincial authorities and school boards outside of the Maritime region have become much more attuned to student transportation costs and the potential for cost efficiencies. The sharing of bus services between school boards and with other educational institutions surfaced in the mid-1980s, mainly in Ontario and rural Alberta. “Joint Consortia for Transportation Services” were established in four or five coterminous public and separate Ontario school board districts, including York Region and Sudbury School District. The Ontario School Bus Operators Association, based in Toronto, joined in the collaboration when a number of boards began pushing for cost efficiencies. Such initiatives were accompanied by business plans incorporating computerized route scheduling, the enforcement of walking distances, and the combining of routes, bulk purchasing, double runs, and staggered school times. In 2002, the Ontario Education Equality Task Force recommended that the province create eight to ten joint transportation “service boards.” In 2006–07, the Ontario Ministry of Education took action, requiring school boards across the province to develop partnerships and combine school board transportation departments into separate, fully integrated transportation organizations. The Student Transportation Reform initiative compelled all of the province’s seventy-two boards to embrace the cooperative student transportation model and to combine in common, coterminous geographical areas (Ontario 2014). In the initial phases of coterminous sharing, millions of tax dollars were saved, but the entry of dominant bus industry players such as Laidlaw and Stock and preferred supplier arrangements tended to reduce price competition over time. In June 2011, an Ontario task force report identified the problem of competitive procurement and revealed that school bus costs (for 800,000 students) had reached $845 million, representing 4 percent of the province’s education budget. Based on such findings, economist Don Drummond included reducing student transportation costs by 25 percent in his February 2012 report recommending province-wide austerity measures (Drummond 2012, R 6-17). That recommendation likely was based on the findings of Ministry of Education Effectiveness & Efficiency Reviews conducted since 2008 that point out further potential cost savings among Ontario’s eighteen consortia operations (Deloitte 2008). A research study produced for the June 2012 Canadian Transportation Research Forum provides a valuable critical economic market analysis of Canadian school bus transportation. Researchers Joseph Monteiro and Benjamin Atkinson offer an overview of student transportation province by province, and then examine the school bus industry in some detail, providing an authoritative analysis of its structure, services, operations, market conditions, and concentration. They also 9 © 2015 Atlantic Institute for Market Studies
Education on Wheels: Seizing Cost and Energy Efficiency Opportunities in Student Transportation

examine provincial regulations to determine their effect on oligopolistic competition and entry
into the industry. Monteiro and Atkinson identify the need to further examine the effect of the
subsidization of pupil transportation, the privatization of school bus services, and costs relative
to the primary mission of public education systems. They draw attention to the serious potential
for collusion among bus operators and “bid rigging” in the awarding of contracts (Monteiro and
Atkinson 2012).

Critical Public Policy Questions: Student transportation is a hidden public policy issue that
requires attention by both provincial auditors and utility review boards. In response to our
investigation into student transportation, the Nova Scotia Department of Education and Early
Childhood Development went to extraordinary lengths over two months to collect province-wide
data and summarize it for use in this report (see Tables 1 and 2). That laborious exercise alone
amply demonstrates that assembling reliable data is a formidable challenge in the absence of the
requirement for full public disclosure. Fortunately, critical policy research in Ontario has
identified the most potentially productive points of investigation: the effect of provincial
subsidies, preferential purchasing arrangements, oligopolistic market tendencies, the sharing of
services, and a whole range of further cost and energy efficiencies. Rising levels of expenditures
for student busing at a time of falling enrolment raises red flags, as does the total absence of
public disclosure and accountability.

Better management of the bus fleet and achieving cost reductions are, however, only one side of
the public policy issue. Nova Scotia’s Chief Medical Officer of health, Dr. Robert Strang, has
urged policymakers to look at the effect of school consolidation and busing on the health of
children and youth (Strang 2014). Community advocacy groups such as Community Transit-
Nova Scotia and the Ecology Action Centre share this concern, and support public policy
initiatives promoting active, healthy transportation alternatives. A comprehensive audit of
student transportation might open the door to community planning focused more on establishing
walkable schools in healthier local communities.

The critical question to be investigated is: Why is student transportation rarely factored into
public discussion about containing education costs and creating liveable, walkable communities?
Simply asking that question would open up a needed policy debate about school consolidation,
provincial subsidization of student busing, the disappearance of walkable schools, the role of
joint board consortia, and the potential for both cost and energy efficiencies. That is the
overarching objective of this study.

Getting to School: Growth of the Student Transportation System
Most schools in Atlantic Canada simply cannot run without daily school bus transportation. It
was not until 1986, however, that school boards became concerned enough about rising cost
pressures to cooperate with the CEA in supporting a national survey of the state of K-12 student
transportation. During the 1986-87 school year, the CEA managed to survey 158 school boards
across Canada to generate previously undocumented information about provincial and school
board policy regulations, funding formula, capital replacement rates, ridership levels, and
comparative costs (CEA 1987, 7-23). In the case of the four Atlantic provinces, the CEA study
reported that a total of $99.3 million was being spent in 1986–87 on student transportation,

10                                  © 2015 Atlantic Institute for Market Studies
Education on Wheels: Seizing Cost and Energy Efficiency Opportunities in Student Transportation

representing approximately 6 percent of total board expenditures. Total operating costs were
$36.6 million (5.7 percent) in Nova Scotia, $27.3 million (7.03 percent) in New Brunswick,
$23.7 million (5.7 percent) in Newfoundland and Labrador, and $7.7 million (6.6 percent) in
Prince Edward Island (32-3, 37, 40-9). With the data aggregated, policymakers finally had at
their disposal a set of benchmarks to chart and assess changes in the pattern and growth of
student transportation costs.

School bus transportation policies and practices across Canada in 1986-87 were all over the map
from one province to another and even from one school board to another. The CEA survey
results nonetheless were valuable because they exposed, for the first time, the crazy-quilt pattern
of student transportation funding and great inconsistencies in daily home-to-school busing
services. Provincial funding formulas and walking distances varied, but costs were normally
shared by the provinces and school boards. Many school boards still owned their own fleets of
buses, but growing numbers, mostly in urban areas, were contracting out the service to
commercial bus operators. In New Brunswick (and Manitoba), it was noted that the provincial
governments paid 100 percent of the cost of school buses (CEA 1987, 5). Much of the focus of
student transportation in provinces such as Nova Scotia was on securing capital bus purchase
grants and covering debt-servicing costs. Overall, student transportation was revealed to be a
grant-driven, rather than student-numbers-determined, education support service. Educational
decisions were being made that dictated changes, necessitated more busing, and entailed
absorbing more costs. The CEA study reported little or nothing about the challenge of
implementing busing regulations or maximum walking distances, or minimizing the constant
demand for “special arrangements.” Nor was there much evidence of special education
transportation, which, starting in the 1990s, became an important driver of rising costs per
student. The study did, however, identify the main differences among the four Atlantic provinces
some thirty years ago, which it is useful to review.

In Nova Scotia, a review of student transportation in the mid-1980s resulted in a significant
change in funding arrangements, moving from a per student formula, based on registered
numbers as of September 30, to a block grant formula based on projected transportation
operating expenses (CEA 1987, 34). Starting in 1987, Nova Scotia school boards received
operating grants “equal to 100 percent of the year’s projected transportation operating expenses.”
Projected costs increased 4.0 percent under the new formula, and the funding included
allocations for co-curricular and extracurricular school trips. School boards also received
financial assistance to help cover the debt-servicing costs, as at September 30, 1982, of acquiring
and paying for buses. The Capital Bus Purchase Grant, or Bus Rate, was set at $4,150 per unit, or
one-tenth of the cost of purchasing a school bus that meets certain standards (D250 standards) of
the Canadian Standards Association, ensuring the structural integrity of buses and meeting other
standards regulated by the Nova Scotia Board of Commissioners of Public Utilities. The new
grant formula also allowed for “spare buses” as “an integral part of the fleet” (CEA 1987, 34).

In New Brunswick, in the mid-1980s, school bus transportation was far more centralized and
directly managed by provincial authorities as a result of major changes, beginning in 1984, that
transferred authority and decision making to the province. “The Department of Education”, the
CEA study reported, now ran all aspects of student transportation, and “all school bus drivers
work for the Department.” Starting in the 1984–85 school year, increasing numbers of school

11                                  © 2015 Atlantic Institute for Market Studies
Education on Wheels: Seizing Cost and Energy Efficiency Opportunities in Student Transportation

boards were simply given no budget for student transportation. Although the Department of
Education managed the student services, the provincial Department of Transportation took over
“the total operation of student transportation vehicles” (CEA 1987, 32). The province thus began
to wield considerable control over school transportation services. Beginning in September 1987,
the Department of Transportation billed each school board directly “a fixed rate per kilometre for
the operation, maintenance and repair of its fleet.” In terms of capital costs, the province reported
allocating $4 million and purchasing “approximately 100 buses a year.” In a modest attempt to
encourage cost efficiencies, school districts that reduced their yearly mileage were permitted to
“keep the money” they saved through such measures (32-3).

In Newfoundland and Labrador and Prince Edward Island, provincial student transportation
policies and funding regulations reflected a few other peculiarities. In both provinces, a 1.6 km
walking limit was explicitly stated in the regulations and set as the determinant of approved
provincial funding. In the 1986-87 school year, some 30 percent of Newfoundland and
Labrador’s “student conveyance” was still provided by board-owned and operated buses, and
unlike Nova Scotia, the province reimbursed the boards for only 90 percent of approved costs.
The CEA noted that school boards in Prince Edward Island bought buses or contracted out the
service with “a budget provided by the Department of Education” (CEA 1987, 34, 35-6).

School busing in the mid-1980s was most prevalent in predominantly rural school districts. Of
158 school boards across Canada that participated in the CEA survey, 18 reported busing over 80
percent of their registered students; 10 of these school boards were located in Atlantic Canada,
most of them in New Brunswick. The top two school busing leaders were New Brunswick’s
District 36, Dalhousie, at 99.5 percent of all students, followed by Nova Scotia’s Conseil
Scolaire Acadien Clare-Argyle, Meteghan, at 97.1 percent. A Newfoundland and Labrador
district, RCSB Conception Bay, ranked seventh with 89 percent of students bused; Prince
Edward Island’s Regional Board in Montague came ninth, at 83.4 percent; and two other Nova
Scotia boards, Hants West (DSB) Windsor, and Guysborough DSB, finished sixteenth and
seventeenth, respectively, with 80.8 percent and 80.3 percent of their students bused (CEA 1987,
13). In virtually every case, the proportion of students bused in these rural districts is much
higher today. For the entire Chignecto-Central Regional School Board in Nova Scotia,
encompassing the towns of Amherst, Truro, New Glasgow, and surrounding areas, the current
publicly acknowledged figure is 82.3 percent of all students. By the standards of 1986-87, six of
Nova Scotia’s eight school boards today would break the 82 percent level, putting them in the
top ten in terms of busing among Canadian school boards (Nova Scotia 2014b).

Thirty years ago the sharing of student transportation services to reduce costs was still in its
infancy. The CEA report identified nine school board initiatives as either exemplary or
promising. Six of the nine were Ontario joint transportation or sharing projects, in places such as
Ottawa, London, and Niagara South. Two of the Ontario initiatives, in Nipissing–Pembroke and
Kent County, served mostly rural and small-town students. Most of the identified projects were
in the pilot stages, a few of them involving modest numbers of students. Only one Maritime
education authority was listed as showing any progress in sharing student transportation services.
That one jurisdiction was the Regional Board in Bathurst, New Brunswick, where, for pragmatic
reasons, French students rode the English board’s public school buses (CEA 1987, 15–16). From
these tentative initiatives emerged an Ontario movement that surfaced in the 2005-06 school year

12                                  © 2015 Atlantic Institute for Market Studies
Education on Wheels: Seizing Cost and Energy Efficiency Opportunities in Student Transportation

    and led to the reorganization of all seventy-two of that province’s remaining school boards into
    just eighteen joint board consortia for student transportation services (Ontario 2014).

    Over the period from 1986 to 2007, the Canadian school bus industry grew significantly in
    number of firms and total revenues, which rose from $640 million to $1.602 billion, an increase
    of 150.4 percent (Monteiro and Atkinson 2012, 3). From 2001 to 2007, while total K-12
    enrolment across Canada declined by 4.5 percent, total school bus industry revenue reportedly
    rose by 9.9 percent (Statistics Canada 2014). School bus services (including chartered buses)
    generated $1.529 billion in revenue in 2007, of which only $38.6 million was accounted for by
    the Atlantic region. Privately run buses far outnumbered in-house school district buses in the
    total Canadian fleet. At the time of the acquisition of Laidlaw by the United Kingdom’s First
    Group in February 2007, about 30,000 school buses, or three out of every four vehicles, were
    owned by private contractors (School Bus Fleet 2007).

    School bus fleets in the Atlantic provinces in 2007 remained provincially funded and still mostly
    publicly owned, unlike in Ontario and Quebec. In New Brunswick, the province operated 1,100,
    or 89.9 percent, of its 1,223-unit bus fleet. Some 92,000, or 84 percent, of New Brunswick’s
    109,464 student population was bused over 26,000 km of roadways, funded by $52.5 million in
    provincial grants. That same year, Nova Scotia’s fleet of 1,227 buses was 73.7 percent publicly
    operated and the balance, some 404 vehicles, was operated by private contractors (Monteiro and
    Atkinson 2012, 2–3, 4). The entry of Stock Transportation into the Nova Scotia market in 1996
    through the Halifax Regional School Board marked a shift to national, rather than local, bus
    contractors. Today, Stock Transportation (owned since 2002 by global transportation giant
    National Express Group, PLC, of the United Kingdom) operates more than 3,400 school buses in
    Ontario and Nova Scotia (Stock Transportation 2014)

    Table 3: School Bus Fleet Operations, NS, 2009-14
    Source: School Bus Fleet, June, 2009-14

                                                   2009          2010         2011       2012         2013     2014

Number of School Buses                             1,227         1,377        1,377      1,377        1,376    992*

      Publicly Owned                               823           844          844        844          901      346

      Privately Operated                           404           533          533        533          475      646

Number of Students Transported Daily               90,200        89,000       89,000     89,000       89,000   87,358

Annual Route Distance                              19            19           19         19           19       23.4

*The published 2014 data for number of buses is incomplete, likely because of missing data from one of
the regional school boards

    13                                  © 2015 Atlantic Institute for Market Studies
Education on Wheels: Seizing Cost and Energy Efficiency Opportunities in Student Transportation As Table 3 shows, since 2010 Nova Scotia’s school bus fleet has remained essentially the same size even though total student enrolment has continued to plummet in seven of the eight regional school boards. School closures and consolidation have reduced the total number of public schools from 425 to 398, but the number of students bused has remained almost constant, and the annual route distance has jumped from 19 million km to 23.4 million km. The Chignecto-Central Regional School Board is typical of “Education on Wheels,” with 16,800 (82.3 percent) of its 20,423 students in the 2013-14 school year riding the buses each school day. Four of the province’s other regional boards bus from 85 to 96 percent of their students to school each day (Nova Scotia 2014b). Closing smaller, mainly rural schools and busing more students each year to larger primary to grade 8 consolidated schools or primary to grade 12 regional education centres only results in more students on buses and longer bus runs, adding to the associated costs of fuel and maintenance. New Brunswick’s student transportation data also demonstrate the constancy of the size of the bus fleet in the face of a continuing decline in enrolment. From 2009 to 2014, the total number of buses rose from 1,156 to 1,237, while the number of students bused dropped from 85,000 to 74,055. Total provincial funding for pupil transportation peaked in 2013 at $58.7 million, when the numbers bused stood at 79,000, some 6,000 fewer than in 2009. Rising school bus costs since 2006 have been driven, in part, by New Brunswick’s firm commitment to “inclusion” or the integration of most disabled students into widely scattered regular classrooms (Bennett 2012). Separate vehicles are used almost exclusively to integrate special needs pupils into regular classrooms in every school in the province. Of the 1,118 buses reported in 2013, only 49 (4.4 percent) were privately owned. In short, New Brunswick school busing continues to consume close to $58 million a year, while the province is slowly abandoning private contracting in favour of fully funded publicly owned buses (School Bus Fleet, June, 2009-14). Provincial Funding and the Operational Framework Nova Scotia In Nova Scotia, student transportation is the responsibility of school boards, and mandated and funded by the Department of Education and Early Childhood Development. School boards are committed to ensuring that transportation is provided in accordance with section 64 of the Education Act and the following provincial and regional acts and policies: the Motor Vehicle Act; the Motor Carrier Act; Department of Transportation and Infrastructure Renewal; Department of Education Special Education Policy; Utility Review Board Regulations; School and Bus Cancellation Policies; Regional Codes of Conduct; and Creating School Populations Policy. Section 64 of the Education Act reads: “General Responsibilities and Powers of School Boards - Duties and powers: 64 (2) (g) subject to the regulations, provide and pay for the conveyance of students to and from school.” Section 6 of the Regulations, Transportation of Students, subsection (1) specifies the minimum distance from school: A school board pursuant to clause 64(2)(g) of the Act shall make provision for the transportation of students either by providing the service itself, or making arrangements with some other person for such service, if: 14 © 2015 Atlantic Institute for Market Studies
Education on Wheels: Seizing Cost and Energy Efficiency Opportunities in Student Transportation

        (a) one or more students reside more than 3.6 km from the school to which they are to be
        transported; or
        (b) one or more students, because of special needs, require transportation irrespective of
        the distance; and
        (c) the school board determines that transportation of the students is necessary.

Although Nova Scotia’s regulations specify 3.6 km as the walk limit standard, several school
boards in the province have reduced the distance to 2.4 km for elementary students, and in some
jurisdictions to 1.6 km and 0.8 km, where the built environment does not adequately support
student safety in terms of active transportation, such as community walkability and safe routes
for bicycles and scooters.

Figure 1: Nova Scotia School Boards, 2014

Ironically, the purpose of the Education Act is “to provide for a publicly funded school system
whose primary mandate is to provide education programs and services for students to enable
them to develop their potential and acquire the knowledge, skills and attitudes needed to
contribute to a healthy society and a prosperous and sustainable economy” (1995-96, c. 1, s. 2).
To that end, section 72 of the Act reads: “The Minister shall make grants to school boards as
determined by the regulations with respect to services provided pursuant to Section 64.”
Essentially, provincial grants cover 100 percent of the cost to contract and/or deliver student
transportation services to and from public schools. Today, most schools in Atlantic Canada
simply cannot run without the support of daily student transportation, currently provided by a
growing school bus industry — an industry mandated to deliver services described exclusively as
“the conveyance of students.” Currently, there are two separate student transportation systems in
Nova Scotia, one for francophone students and districts and another for anglophones, despite
apparent geographic overlap and/or route duplications. As Figure 1 shows, the Conseil Scolaire
Acadien system is province-wide and runs alongside seven coterminous systems.

15                                  © 2015 Atlantic Institute for Market Studies
Education on Wheels: Seizing Cost and Energy Efficiency Opportunities in Student Transportation The Department of Education and Early Childhood Development consists of several operational units. The Corporate Services branch handles the conveyance of students, with support from the Facilities Management and Statistics and Data Management divisions. The Corporate Services branch “provides a range of services to the department, school boards, the Nova Scotia Community College, universities, public libraries, and other related organizations to assist the Department in meeting its mandate. Services include the key areas of financial management and control, facilities and transportation, information technology, statistics and data management, and the distribution of learning resources and related products.” The Facilities Management division “provides for administration of policies and programs related to: school planning, school operations, pupil transportation, and the development and implementation of evaluation policies and procedures to examine and assess effectiveness of school capital programs and school conveyance systems. It acts as a liaison with school boards concerning school capital projects, pupil transportation and school building operations.” And Statistics and Data Management “provides student, teacher, school and board information to support the monitoring, management and improvement of the education system. This information is used to address the needs of stakeholders, to support decisions made within the department, to assist in formulating effective policies and to make decisions with respect to school board funding” (Nova Scotia 2014a). At the school board level, boards, superintendents, and supporting staff are responsible for the appropriate administration of transportation services and the management of transportation policy, regulations, and procedures. Halifax Regional School Board contracts out its transportation services, and contractors “are responsible for the maintenance and safe operation of all company-owned vehicles, allocation of routes to company drivers and compliance by the drivers in conforming to scheduled routes and times aligned with board policy” (HRSB 2014). All other school boards in Nova Scotia currently own or lease, manage, and maintain their school bus fleets, and contract out supplementary transportation services as needed. Within each board, a department is assigned to administer and manage the conveyance of students between schools and home. Titled Operational Services, Facilities Management, or Transportation Department, staff includes a director, facilities manager, coordinator of pupil transportation, and pupil transportation foreman at bus depots. The responsible departments maintain and hire service contracts and bus drivers. New Brunswick Similar to Nova Scotia, New Brunswick’s Education Act (section 53) authorizes conveyance for students enrolled in the public school system. Regulation 2001-51 under the Act is the legislation governing the operation of the pupil transportation system. Meanwhile, the Motor Vehicle Act establishes rules for school bus driver classification and standards for vehicle maintenance and traffic rules. The Department of Education and Early Childhood Development, in cooperation with school districts, is responsible for the administration of a safe, efficient, and dependable pupil transportation system. Departmental objectives include: 16 © 2015 Atlantic Institute for Market Studies
Education on Wheels: Seizing Cost and Energy Efficiency Opportunities in Student Transportation
o Coordinate the development/revision of administrative policies and the production
of support material/documentation in the area of pupil transportation
management.
o Provide and define training requirements for all potential and regular bus drivers,
as well as promote safety and proper conduct on school buses with the
collaboration of local school administrations.
o Maintain a close link with educational services to ensure that school
transportation plays its support services role in the education system.
o Maintain data and pertinent information to determine school districts’ budget
allocation for school bus operation and analysis. (New Brunswick 2010)
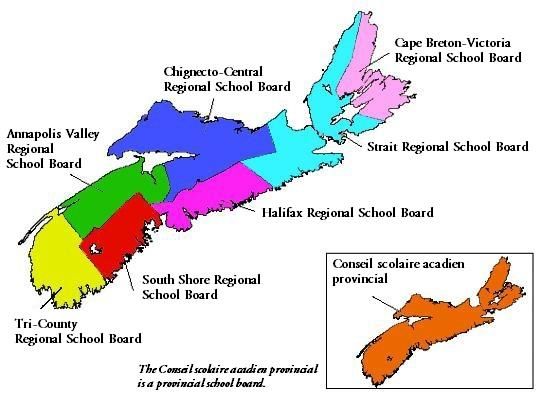
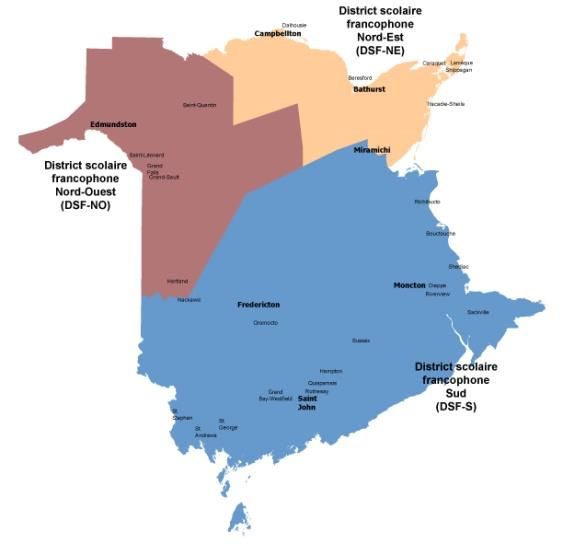
Similar to Nova Scotia, there are two separate student conveyance systems operating throughout
the province, one for francophone students and school districts, and another for anglophones,
despite apparent geographic overlap and/or potential route duplications (see Figure 2).
Figure 2: Public School Districts, New Brunswick, 2012–14
Anglophone Francophone
Prince Edward Island
School transportation in Prince Edward Island, while funded by the province, is run by the
school districts. Until 2012, Prince Edward Island was neatly divided into three school boards:
Eastern District (English), Western District (English), and the French Language Board. In
September 2012, the Eastern and Western districts were merged into one province-wide English
Language School Board. The new unified school board enrols some 20,000 students and
employs over 2,300 teachers and support staff. “Bringing the English school boards together,”
PEI education minister Alan McIssac announced on June 1, 2012, “will provide a more focused
and aligned approach for service delivery, reduce duplication, improve efficiencies and role
clarity” (Prince Edward Island 2012). Although the two English boards merged services, the
separate French Language Board continues to operate a parallel school bus service.
17 © 2015 Atlantic Institute for Market StudiesEducation on Wheels: Seizing Cost and Energy Efficiency Opportunities in Student Transportation Current Funding and Cost Management Concerns The need to curtail student transportation costs has surfaced periodically as a public policy issue in the Atlantic provinces. Whenever the issue is raised, provincial ministers of education are quick to point to the cooperative approach taken to cost reduction through the bulk purchasing of new school buses. In September 2003, Nova Scotia education minister Jamie Muir was proud to announce the purchase of sixty-four new school buses for the 2004–05 school year under a bulk purchase plan involving the four Atlantic provinces. The total purchase price of $4.5 million included four buses for the physically handicapped and was intended to replace older vehicles under a policy that recommends buses be replaced every twelve and a half years. The new buses were allocated to six different school boards outside Halifax Regional Municipality. The Education Department claimed that bulk purchasing was very cost effective, shaving $10,000 off the cost of each bus and saving Nova Scotia taxpayers about $640,000 (Nova Scotia 2003). Cooperative purchasing of school buses is only one of many policy measures used elsewhere to achieve cost efficiencies. Where provincial governments adopt austerity agendas, seek to reduce administration, and focus more spending on the classroom, school boards are more inclined to consider and embark upon more innovative approaches, such as privatizing school bus service and sharing services among school boards. In Ontario and Quebec, school boards have opted increasingly to contract out student transportation services. Since the late 1980s, leading Ontario school boards such as those in Ottawa and York Region have, on their own, established regional bus transportation authorities, merging the services of their public, separate, and French boards. In January 1994, the two fast-growing York Region boards formed a Joint Board Consortium and merged their school busing services. Under a new organization, Student Transportation Services York Region, they adopted the motto “Better Together,” established a single headquarters, merged dozens of bus routes, and saved taxpayers some $1 million a year in the initial three-year implementation period (York Region Board of Education 1994, 6). The impact of public subsidization and management of pupil transportation on escalating expenditures has come under close scrutiny. As long ago as 1973, researcher Marvin R. Brams identified state or provincial grant subsidy programs based upon distance as favouring rural over urban school systems (Brams 1973). US school busing expert Geoffrey Segal, testifying at a 2004 South Carolina transportation hearing, demonstrated that student transportation service was best provided at the local, rather than at the state (provincial), level. Unlike more bureaucratic state authorities, local school districts were seen to exhibit more flexibility in the provision of innovative student transportation services. Local school districts, Segal testified, were more likely to generate competitive bids, to embrace contracting out, and to look to privatization to achieve significant cost savings (Segal 2004). Four of six authoritative research studies from 1979 until 1996 demonstrated that private contractors were more efficient and cost effective than maintaining in-house district operations. In 1993, KPMG Peat Marwick examined thirty school districts in Washington and Oregon that had privatized student transportation services, and found that, in terms of both cost and quality, such a policy was superior. These research findings have given impetus to school boards in Ontario, Quebec, and Alberta to seek to achieve greater efficiency and cost reductions. 18 © 2015 Atlantic Institute for Market Studies
Education on Wheels: Seizing Cost and Energy Efficiency Opportunities in Student Transportation

A number of studies of school bus management practices have also identified some of the
potential pitfalls of the privatization of school bus services. In a 2004 study focusing on
Minnesota, Sheryl Lazarus claims that larger private contractors secured control of the most
profitable contracts in urban and suburban areas, shunning the less profitable opportunities in
rural school districts (Lazarus 2004). More recently, Owen Thompson has examined student
busing over a six-year period in Minnesota, and concludes that, after a period of privatization,
reverting to in-house student transportation operations could reap savings of from 15 to 20
percent (2011, 334). Contracting out bus services might introduce more competition and, at least
initially, reduce average costs per student. On the other hand, Canadian researchers Joseph
Monteiro and Benjamin Atkinson have documented the oligopolistic control exercised by large
bus contractors such as Laidlaw and the increasing prevalence of “bid rigging” in the awarding
of contracts (2012, 11–12).

Table 4: Pupil Transportation by School Districts, New Brunswick, 2009–10

Although collusion and bid rigging are against the law, three cases of such activity in school bus
transportation have arisen since 1978, all confined to Ontario and Quebec. In the most often-
cited legal case, four school bus companies — Charterways, Travelways, Lorne Wilson, and
Arthur Elen — were convicted and fined for bid rigging in Peel Region on May 25, 1981. Such
practices are much more likely to happen in Ontario and Quebec, however, where almost all of
the school bus business is contracted out to private companies in a market dominated by First
Student and Stock Transportation (Monteiro and Atkinson 2012, 5, 13fn8). Corporate
concentration in the private bus industry was greatly advanced on October 1, 2007, when
FirstGroup PLC acquired Laidlaw International. The $3.6 billion deal combined North
America’s two largest private school bus operators — Laidlaw Education Services and First

19                                  © 2015 Atlantic Institute for Market Studies
Education on Wheels: Seizing Cost and Energy Efficiency Opportunities in Student Transportation

Student Inc. — giving the new owners a total of 60,000 school buses, or 40 percent of the school
bus contractor market (School Bus Fleet 2007).

Merging English public school and English Catholic separate school bus operations has grown in
popularity since the 1980s, driven by shared service initiatives in Ontario, Alberta, and
elsewhere. Since 2006, the Ontario Transportation Reform strategy has further extended the
practice to incorporate French-language school services. Nevertheless, running parallel English
and French student transportation services remains widespread throughout most of Canada’s
provinces. In the case of New Brunswick, for example, student transportation reflects the
dominant policy framework of clearly segregated anglophone and francophone sectors (see
Table 4). Although their geographic areas overlap and some sharing is practised, the two systems
remain separate, as does their financial reporting.

Critical Issues
School districts looking to shed expenditures and balance budgets are often tempted to look to
student transportation services for some of the cost savings. In June 2013, the Loudoun County
school board, in Leesburg, Virginia, facing a $34 million budget reduction, responded by
attempting to enforce its existing walking-distance policy, a move that compelled some 4,000
additional students to walk to school. The controversial decision was publicly justified as one of
making tough choices. “We are not in the transportation business. We are in the education
business,” Leesburg school trustee Bill Fox stated. “And so, if we have to reduce the level of
services someplace, it’s going to be in something like transportation, not in classroom services”
(Barnes 2013). A year later, in June 2014, the Coquitlam School District in British Columbia,
staring at a $13.4 million budget deficit, took the same action, cutting service to 1,500 students in
Coquitlam, Port Coquitlam, and Port Moody, reportedly to save $600,000 in education tax
dollars (Bankay 2014).

The Micropolitics of Student Entitlements

In Atlantic Canada, reining in school busing costs by enforcing walking-distance policies has
proved next-to-impossible. A few school boards have either threatened or attempted, mostly
without success, to cut busing for strictly budgetary reasons (CBC News New Brunswick 2009).
For example, facing a $10 million budget reduction in fiscal year 2012/13, the Halifax Regional
School Board cut a $125,000 program that provided Metro Transit passes for 225 high schoolers
(CTV Atlantic 2012). Fierce parental opposition in elementary schools and determined political
advocacy by locally elected school district members usually have succeeded, however, in beating
back such school-level cost-reduction initiatives.

Student walking-distance policies are always a bone of contention, since they represent the limit
of provincial grant support for students. Provincial school boards, spearheaded by the Alberta
School Boards Association, have long claimed that the official walk limits are “unrealistic in
today’s society” (ASBA 2008, 14). The vast majority of school boards, in fact, have
implemented student walk limits that are shorter than provincial standards. Local boards now
differentiate walk limits based on the age of students and safety concerns such as the presence of
high traffic arteries or major highways. Since the expansion of special education and the rise in

20                                  © 2015 Atlantic Institute for Market Studies
You can also read