Retail and Centres Study - Plymouth City Council
←
→
Page content transcription
If your browser does not render page correctly, please read the page content below
Roger Tym & Partners   t: 01392 210868
                                     11-15 Dix's Field      e: 01392 210869
                                     Exeter                 e: exeter@tymconsult.com
                                     Devon EX1 1QA          w: www.tymconsult.com
Part of Peter Brett Associates LLP

Plymouth City Council
Retail and Centres Study

Final Report May 2012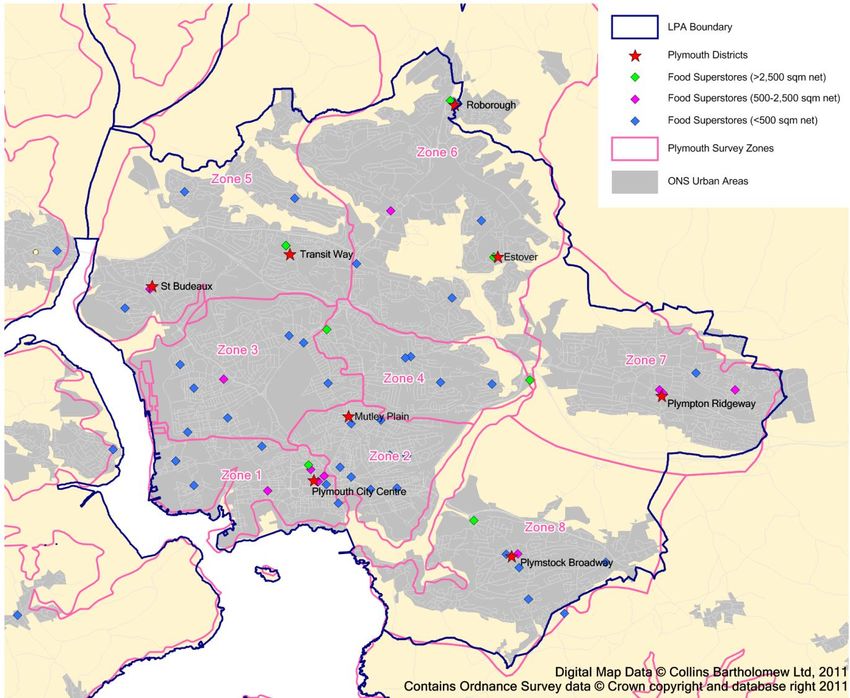
Plymouth Retail and Centres Study

 Unless alternative contractual arrangements have been made, this report remains the property of
 Roger Tym & Partners until fees have been paid in full.
 Copyright and other intellectual property laws protect this information. Reproduction or
 retransmission of the information, in whole or in part, in any manner, without the prior written
 consent of the copyright holder, is a violation of copyright law.

Job Number - 25345
Plymouth Retail and Centres Study
CONTENTS
1 INTRODUCTION ................................................................................................................. 2
Context ................................................................................................................................ 2
Report structure................................................................................................................... 3
2 POLICY CONTEXT AND THE ECONOMY.......................................................................... 4
National Planning Policy Framework ................................................................................... 4
PPS4 ................................................................................................................................... 5
Practice Guidance ............................................................................................................... 5
The Requirements of the Current and Emerging Regional and Sub Regional Policy ........... 5
Economic context .............................................................................................................. 11
Source: Experian Retail Planner 9, September 2011, Appendix 3 ............................................... 19
*Special Forms of Trading **adjusted SFT includes internet, mail order and markets. .................. 19
3 CURRENT PERFORMANCE OF RETAIL CENTRES ....................................................... 20
Introduction........................................................................................................................ 20
Centre Healthchecks ......................................................................................................... 20
4 CURRENT PATTERNS OF RETAIL SPENDING .............................................................. 31
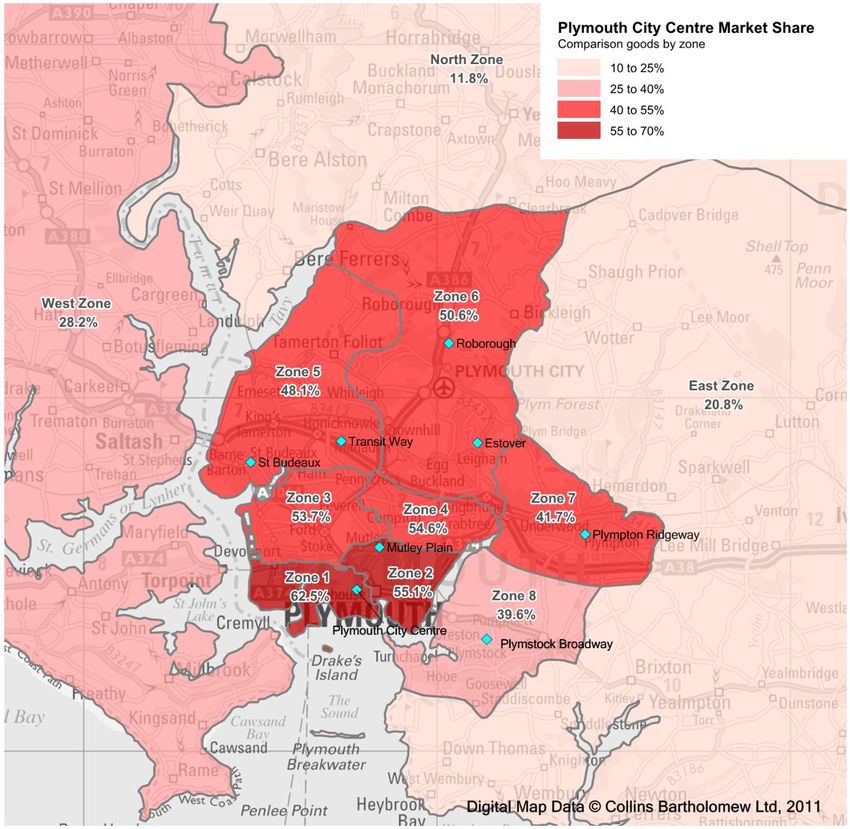
Comparison Goods Spending Patterns.............................................................................. 31
Convenience Goods Spending Patterns ............................................................................ 38
Summary ........................................................................................................................... 40
5 ASSESSMENT OF NEED FOR RETAIL FLOORSPACE IN PLYMOUTH ......................... 42
Assessment of Quantitative Retail Need............................................................................ 42
Findings in Relation to Quantitative Need .......................................................................... 46
Assessment of Qualitative Retail Need .............................................................................. 47
Summary ........................................................................................................................... 51
6 STRATEGY AND RECOMMENDATION ........................................................................... 53
Introduction........................................................................................................................ 53
Context .............................................................................................................................. 53
Hierarchy of Centres.......................................................................................................... 54
Plymouth City floorspace strategy ..................................................................................... 56
Threshold Policy for Implementation of the Impact Test..................................................... 72
Summary ........................................................................................................................... 73
APPENDICES
Volume 2: Appendix – Retail Expenditure and Capacity Tables
Volume 3: Appendix – Retail Impact Assessment
Plymouth Retail and Centres Study
1 INTRODUCTION
1.1 Plymouth City Council commissioned Roger Tym & Partners (part of Peter Brett
Associates) to undertake this study in June 2011. This study is intended to build on the
previous Retail Study completed by Cushman and Wakefield (C&W) in 2006.
1.2 This study updates and strengthens the evidence base, to inform the continued
development of Plymouth’s spatial plan, particularly the proposed review of the Plymouth
Core Strategy and the forthcoming Derriford and Seaton AAP, and to enable the Council to
deal confidently with emerging opportunities and proposals.
1.3 The broad objectives of the study are to:
Advise on the capacity of further development (food and non-food goods) within
Plymouth City between 2011 and 2016, 2021 and 2026 and 2026 and 2031.
To review the vitality and viability health check of the main centres
To test impact of new development on existing and new centres
1.4 The methodology follows a five stage process of qualitative review and performance
assessment, survey of spending patterns, quantitative analysis, impact assessment and
development strategy.
1.5 An empirical survey of households has been undertaken to help understand the current
patterns of retail expenditure, which covers an area within and beyond the boundary of
Plymouth City, including parts of north and west Devon and east Cornwall. 2000 completed
telephone interviews were conducted. The survey of households explores the pattern of
resident expenditure on retail goods and leisure visits. The household survey is used to
assess the impact of recent developments on expenditure, market share and assist with the
forecasting of current and future floorspace requirements.
1.6 The Government published the National Planning Policy Framework in March 2012. The
study had been largely completed before the publication of the NPPF and therefore refers
to the requirements set out in PPS4. However, it is considered that for plan making the
NPPF follows the same policy thrust set out in PPS4 regarding retail. Therefore the study
is compliant with the requirement, as originally set out in Policy EC1 of Planning Policy
Statement 4 (PPS4) 2009, and in paragraphs 160 and 161 of the NPPF Framework, to
prepare robust evidence including an assessment of the need for retail floorspace and the
capacity of centres for its accommodation and that this study remains a robust and valid
evidence base to assist with plan policy making and development management decisions.
Context
1.7 Understanding the context for this study is crucial. Since the C&W study was undertaken,
there have been some very significant changes in both planning and the economy. These
include:
PPS4 and its practice guidance, published in December 2009 and in the case off PPS4
now replaced by the NPPF.
Final Report | May 2012 2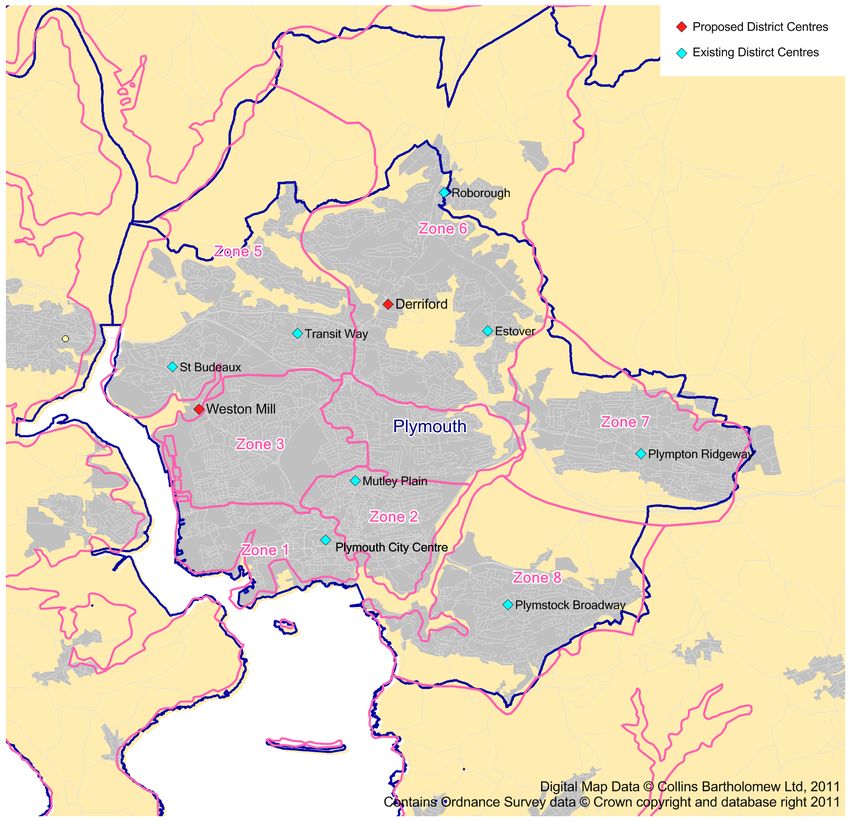
Plymouth Retail and Centres Study
The Coalition Government announced its intention to abolish regional strategies, which
has a knock on effect in respect of the regional hierarchy of centres and requirements
for housing and employment growth.
The downturn in the economy, the resultant slow down of consumer expenditure growth
and uncertain recovery timescales.
The banking crisis, the associated lack of development finance and the viability
challenges facing town centre redevelopments.
The continuing changes in consumer preferences, including the increase of e-tailing
and the polarisation of retailing (i.e. larger stores and centres are becoming more
dominant).
1.8 These changes have implications for both the quantitative outputs within the Plymouth
Retail and Centres Study and the policy direction of its recommendations, and therefore
have consequences for Plymouth’s future strategic policies.
1.9 Throughout the report we set out the main changes that have taken place since the last
report was published, emphasising the impact that the economy has had on our
assumptions and the main outputs.
Report structure
1.10 The remainder of this report is structured as follows:
Section 2 provides an overview of national, regional and local policy and the retail
environment and economy
Section 3 describes the current performance of the main centres and retailing areas in
Plymouth
Section 4 sets out our analysis of the current patterns of retail spending, drawing on the
telephone survey of households
Section 5 provides our analysis needs in the retail sector (to 2031)
Section 6 sets out our recommendations
Final Report | May 2012 3
Plymouth Retail and Centres Study
2 POLICY CONTEXT AND THE ECONOMY
2.1 The following section briefly summarises the national planning policy and the local planning
and retail / economic strategies that frame this study. Although PPS4 has now been
replaced by the NPPF, the study was based on PPS4 principles and continues to reference
them, therefore the short summary of PPS4 remains as context. It should also be noted that
at this time the good practice guide which accompanied PPS4 remains in place.
National Planning Policy Framework
2.2 The National Planning Policy Framework (NPPF) was published in March 2012. The NPPF
sets out the Government’s key economic, social and environmental objectives and the
planning policies required to deliver them.
2.3 Paragraph 16.1 of the NPPF states that local planning authorities should develop an
evidence base in order to assess:
The need for land or floorspace for economic development, including both the
quantitative and qualitative needs for all foreseeable types of economic activity over the
plan period, including for retail and leisure development
The existing and future supply of land available for economic development and its
sufficiency and suitability to meet identified needs.
The role and function of town centres and the relationship between them, including any
trends in performance of centres
The capacity of existing centres to accommodate new town centre development.
Planning for town centres
2.4 With regard to ensuring the vitality of town centres, NPPF paragraph 23 states that local
planning authorities should:
Recognise town centres as the heart of their communities and pursue policies to
support their viability and vitality
Define a network and hierarchy of centres that is resilient to anticipated future
economic changes
Promote competitive town centres that provide customer choice and a diverse retail
offer and which reflect the individuality of town centres
Allocate a range of suitable sites to meet the scale and type of retail, leisure,
commercial, office, tourism, cultural, community and residential development needed in
town centres.
Allocate appropriate edge of centre sites for main town centre uses that are well
connected to the town centre where suitable and viable town centre sites are not
available.
Set policies for the consideration of proposals for main town centre uses which cannot
be accommodated in or adjacent to town centres
Where town centres are in decline, local planning authorities should plan positively for
their future to encourage economic activity.
Final Report | May 2012 4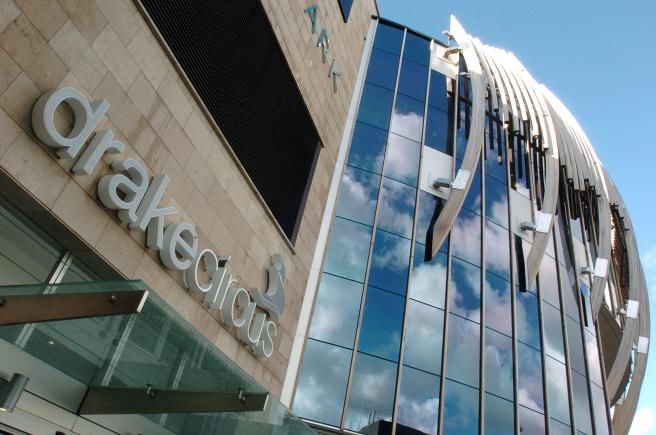
Plymouth Retail and Centres Study
PPS4
2.5 The Government’s objectives were set out in PPS4 Planning for Sustainable Economic
Growth and were to achieve sustainable economic growth by:
Building prosperous communities by improving the economic performance of cities,
towns, regions, sub regions and local areas
Reducing the gap in economic growth rates between regions, promoting regeneration
and tackling deprivation
Delivering more sustainable patterns of development
Promoting the vitality and viability of town and other centres as important places for
communities
Raising the quality of life and the environment in rural areas by promoting thriving,
inclusive and locally distinctive rural communities.
2.6 Policies EC3 to EC5 are plan making policies regarding town and other centres. Regional
Planning Bodies (RPBs) and Local Planning Authorities (LPAs) are required to:
Set out a strategy for the management and growth of centres over the plan period
Promote competitive town centre environments and provide consumer choice
Identify a range of sites to accommodate identified need.
Practice Guidance
2.7 “Planning for town centres: practice guidance on need, impact and the sequential
approach”, was published in December 2009 alongside PPS4. It supports the
implementation of national policy, but does not set out new policy. The main objectives of
the Practice Guidance are:
To promote development in Town Centres
To provide advice on preparing need and impact assessments and assist in determining
planning applications
To illustrate how a sequential approach can be applied
To encourage a greater degree of consistency and transparency to assist in preparation
of need and impact assessments
2.8 The Practice Guidance states that consideration of need, sequential site assessments and
impact assessments should be undertaken regionally to inform the RSS and locally to
prepare the LDF. It recognises the importance of identifying need, both quantitative and
qualitative. Throughout this study we have taken into account the principles set out in the
Practice Guidance.
The Requirements of the Current and Emerging Regional and Sub
Regional Policy
Regional Planning Guidance 10
2.9 The current Regional Spatial Strategy is Regional Planning Guidance 10 (RPG10)
published in 2001. It provides a broad development strategy for the South West Region up
Final Report | May 2012 5Plymouth Retail and Centres Study
to 2016. The RSS presents a vision and 12 key objectives which include improving
economic competitiveness; promoting economic development in locations where it can best
contribute to meeting local needs; addressing variations in prosperity through regeneration,
meeting people’s requirements for jobs and facilities; and improving accessibility.
2.10 RPG10 presents a number of policies pertinent to retail and Town Centre uses. In
particular, the RPG seeks to develop the local economic and service functions of towns and
limit the expansion of out of town shopping destinations.
2.11 In particular Policy EC6 outlines a range of more specific provisions in relation to Town
Centres and the location of retail development. It covers the following:
Locate larger retail, leisure, commercial and public facilities in the centres of the Primary
Urban Areas (Plymouth is one of 11 PUA in the South West) and in other designated
centres for growth specified in the spatial strategy
Ensure that such development is located where it will contribute to the regeneration and
environmental improvement of Town Centres
Ensure the protection of the vitality and viability of existing centres, including suburban
centres
Ensure that development is located where it can help to reduce the need to travel,
encourage journeys by modes other than the private car
Regional Spatial Strategy for the South West
2.12 The Regional Spatial Strategy (RSS) was to provide planning guidance for the South West
for the period up to 2026. Its aim was to manage the change and development in the South
West that will be needed to support a growing population and economy. The RSS was
intended to inform and guide the spatial planning policy for Local Development Frameworks
(LDFs).
2.13 The South West Regional Assembly (SWRA) approved the draft RSS in March 2006.
Following an Examination in Public (EiP), and an independent Panel Report, the Secretary
of State published ‘Proposed Changes’ which were subject a public consultation period.
The RSS was due to be published in June 2009, but was further delayed. It has not been
finalised following the establishment of the Coalition Government and their pledge to
withdraw such Strategies.
Core Strategy (April 2007)
2.14 Plymouth has an adopted Core Strategy (April 2007) which establishes an overarching
planning vision and framework up to 2021.
2.15 Plymouth is the second largest city in the South West – the other being Bristol in the north
of the region. The Core Strategy determines that Plymouth has the scope to ‘continue to
accommodate significant change in a sustainable way – with opportunities within or very
well related to the main urban area and its major transport routes.’ With this in mind it is the
aim for Plymouth to become the economic hub of the far South West.
Final Report | May 2012 6Plymouth Retail and Centres Study
2.16 This existing opportunity for change will help accommodate Plymouth’s growth agenda
which seeks to increase the population from 246,100 in 2005 to 300-350,000 in 2026 (but
with a mind to outside factors such as the national and global economy).
2.17 The spatial distribution of growth is clearly directed at the City Centre and waterfront
regeneration areas with additional take up in ‘opportunity sites’ to the east and north of the
city. The need for an appropriate range, mix and type of development are to be considered
in all growth (Strategic Objective 7: Delivering adequate shopping provision). Within the City
Centre there is an identified need to expand the range of retailers and to modernise
premises.
2.18 Within the City Vision there is scope for new centres at Derriford, Devonport, Weston Mill,
Millbay and Plymstock. These have been identified in order to address current gaps in
community level retail provision and to support the needs of an increasing population under
the growth agenda. Overall the City will encompass a total of 100,000 – 170,000 sq m (net)
of new comparison floorspace.
2.19 In terms of meeting this future need, the City Centre is the ‘priority location for
accommodating new floorspace’. This remains the stated priority for the term of the plan.
(Policy CS06 City Centre). However, a secondary centre at Derriford will be an additional
location for retail investment once the performance of the City Centre is established.
2.20 The Core Strategy seeks to establish a ‘proactive strategy for shopping, focussed on
directing new retail development such that it contributes to delivering the City Vision,
improving existing retail facilities, addressing deficiencies in the retail hierarchy and
planning for future growth.’ Key to this is vitality and viability, genuine choice, a quality
environment and a mix of activity.
2.21 There is an established hierarchy of shopping centres (further detailed in Section 3) in
relation to comparison shopping. The City Centre is the dominant centre with additional
district, local and out of centre areas. The opposite is the case in relation to convenience
provision.
Final Report | May 2012 7Plymouth Retail and Centres Study
2.22 Floorspace requirement is identified within the Core Strategy as follows:
Table 2.1 Core Strategy Convenience floorspace estimated expenditure increases
Estimated growth
2006 to 2011 to 2016 to 2021 to 2026
(2003
prices)
Total available
expenditure
£383.2m £17.22m £37.48m £79.95m £116.91m.
(main food & top
up expenditure)
Food stores at the ‘Beyond 2011 it is concluded that there will be a
Derriford, Devonport, growing capacity for additional floorspace, as a
Plymstock Quarry and function of expenditure growth per capita and
Measures to
Weston Mill centres will be expenditure growth. This assumes a constant market
meet this growth
sufficient to meet this share going forward as it is unlikely the current market
increase in available share can be much improved save for the east side of
expenditure the city.’
Table 2.2 Core Strategy Comparison floorspace requirements (City wide) 1
Estimated requirement:
2006
to 2011 to 2016 to 2021 to 2026
(2003 prices)
Plymouth catchment
- about £1.245 bln
Plymouth City -
£917.87m (73.7%
Total
market share of
available £158.43m £428.77m £859.27m £1,442.54m
catchment
expenditure
expenditure)
City Centre -
£637.05m,
or 51.1%.
Estimated 105,756sq.m. – 164,880sq.m.
22,631sq.m. – 56,866sq.m. –
net 71,854sq.m. –
36,775sq.m 92,407sq.m.
floorspace 267,930sq.m
requirements
2.23 A summary of proposed new shopping centres within the retail hierarchy and related
requirements (Policy CS07 Plymouth Retail Hierarchy) is provided below:
1
Note: ‘These calculations assume constant market shares, having assumed an uplift for Drake Circus of 7.5%. The
floorspace bands suggested are based on typical trading densities for High Street and retail warehouse type
development respectively’. Also it is noted that the figures are dependent upon population growth forecasts and that
current demand for floorspace is weak (Plymouth City Council Core Strategy, 2007)
Final Report | May 2012 8Plymouth Retail and Centres Study
Derriford District Centre: a new centre, a major foodstore with complementary
comparison goods shopping, residential, office, leisure and food and drink uses. Impact
assessment will be used to ensure future development does not affect the role of the
City Centre. This will support the Council’s bi-polar economy vision and the proposed
growth in population.
Weston Mill District Centre: medium sized foodstore (1,500-2,000 sq m net),
complementary comparison goods shopping.
Devonport Local Centre: to support the regeneration of Devonport and the creation of
a new community on MoD land
Millbay Local Centre: to support the creation of a new community in Millbay and to be
linked to tourism and leisure
Plymstock Quarry: to support the new neighbourhood
Laira Embankment Retail Park: a new retail destination of appropriate scale, size,
quality and accessibility to improve this city gateway
City Centre and University Area Action Plan (adopted April 2010)
2.24 The adopted Area Action Plan seeks to work with the existing City Centre taking on board
the overall structure created by the Abercrombie and Watson Plan, respecting the heritage
and historic buildings, whilst seeking to address those physical areas of the centre that do
not function in terms of supporting the retail heart of the city.
2.25 The Vision for the City Centre is:
‘To reinforce the City Centre’s role as a vibrant and thriving regional destination, providing
high quality shopping, recreation, cultural, civic, education and commercial facilities,
well connected to surrounding neighbourhoods, as well as being a safe place of quality
in which to live
2.26 The AAP seeks to address a set of main issues:
Poor distribution of anchor stores
Small size of units
Dominance of ‘shopping’
Low quality buildings
Low density development
Lack of activity outside of core shopping hours
2.27 A number of key development opportunities are highlighted within the plan, including:
The creation of new arcades, linking existing main streets, to increase the number and
variety of units / uses (for example, Cornwall Street/New George Street)
A new development to support a new anchor store (Armada Way /Cornwall Street)
Redevelopment of Cornwall Street (east) and remainder of Cornwall Street (west)
West End: strengthening of this area to enable an increase in retailing floorspace (within
areas of low density development), and to increase the type of offer Plymouth provides
by enabling social and cultural activities, including evening uses. :
Final Report | May 2012 9Plymouth Retail and Centres Study
Additional uses around Royal Parade (south) in the ‘Leisure and Civic District’, to
include a new hotel and other leisure and entertainment uses and some additional retail
units
Derriford and Seaton Area Action Plan, pre-submission consultation
(February 2011)
2.28 Derriford is identified as Plymouth’s northern gateway and has a key arterial route (the
A386) running through it. Despite having key employment and academic institutions located
in Derriford (for example the University College of St Mark and St John, Plymouth
International Medical and Technology Park, Derriford Hospital, Tamar Science Park) the
area only has a population of 4,000.
2.29 The area experiences a range of issues, including:
Fragmented urban form
Poor connections to surrounding neighbourhoods
Limited services / retailing
Congested infrastructure (particularly at peak times)
2.30 The pre submission Area Action Plan outlines the Council’s plans to create the bi-polar
economy, as outlined within the Core Strategy, which will seek to address/provide:
A better linked and better serviced community meeting the needs of current and future
residents and businesses
New services and shopping facilities for the north of the City
Additional employment land (6,000 new jobs)
New housing (a contribution towards Plymouth’s growth agenda)
Improve infrastructure
2.31 In terms of retail provision, this draft document details the following:
A new Major District Centre at Derriford (proposal DS17):
Total amount of floorspace that could be provided (maximum) is 30,000sq m by 2026
Phase One (by 2016) could incorporate 10,000 sq m, to include a food store of
approximately 5,000 sq m (gross) and 5,000 sq m of complementary ancillary retail
units of varying sizes
When local needs are determined and impact upon the City Centre established, the
completed Derriford District Centre could include food store provision of up to 14,000 sq
m (one or more operators) and approximately 13,000 sq m of comparison/fashion units
and approximately 3,000 sq m of ancillary service units.
2.32 Also indicated is a new Local Centre at Seaton, comprising of up to 2,000 sq m (gross) of
A1 to A5 retail including a small supermarket and further local retail provision at the North
West Quadrant (east of A386) comprising of around 820 sq m (gross) of A1 to A5 uses, up
to a total of 1,500 sq m by the end of the plan period.
Final Report | May 2012 10Plymouth Retail and Centres Study
Summary
2.33 There is an adopted policy direction for the future development of retail provision within
Plymouth. The key document is the Core Strategy which frames the overall policy direction,
seeking to ensure a strong and vibrant City Centre through enabling further development in
key City Centre locations; namely those that are currently under-utilised / have low density
development in order to complement and strengthen the existing offer. In addition the Core
Strategy recognises the important role of district centres and seeks to ensure that future
provision matches local community requirements.
2.34 A key policy direction contained within the Core Strategy is also that of the need to create a
bi-polar economy through the creation of a new district centre at Derriford. Located to the
north of the City Centre and identified as an area for further population and employment
growth, Derriford is seen as a key opportunity for additional, complementary retail growth.
The Derriford and Seaton Area Action Plan has been through the pre-submission stage,
and is timetabled to go through a second pre-submission consultation during the summer of
2012.
Economic context
2.35 In this section we set the context of the retail study in light of the current economic
downturn and current retail trends and shopping behaviour.
Downturn in the Economy
2.36 The study has been prepared during a period of economic downturn in the UK, in marked
contrast to the previous study which was prepared during an economically strong period for
the country. The current sustained downturn in the economy and recent period of recession
has had clear changes on the retail landscape in the UK, with a number of high profile
retailers entering administration, and discount-end retailers increasing in representation.
The downturn also affects consumer spending, with a greater reluctance to spend amongst
consumers on non-essential goods. As a result, the forecast levels of spending growth are
subdued, particularly for the short term. We illustrate the difference in spending growth in
section 5.
2.37 The economic downturn has also resulted in investors being more cautious. Developers
are looking to play competing centres against each other to secure the best deal for their
outlet or scheme. Nationally, many planned large new retail developments have been
suspended until the economy returns to stability. For example, we are aware of schemes in
Oxford, Bradford, Sheffield and Guildford which have been put on hold.
2.38 An additional significant implication of the economic downturn has been reduced house
building rates across the country. The effect of this slowdown is that we expect population
growth, in the short term at least, to be more muted than previously forecast. This is
reflected in the base year population forecasts used in this study. The short term slowdown
in population growth will have implications for the quantitative need for additional retail
floorspace in the catchment area, and in particular the timing of when this need is likely to
arise.
Final Report | May 2012 11Plymouth Retail and Centres Study
2.39 However, there are some signs that momentum is returning to the retail market, especially
for schemes which include some of the stronger performers in the market. There is also
considerable development activity by foodstore operators, which has continued throughout
the economic downturn. There is evidence of this within Plymouth, with Tesco recently
obtaining planning consent for a redeveloped store on Transit Way and other operators
likely to submit applications for new or expanded stores in the next 12 months. There has
also been a planning application submitted by Tesco for a new foodstore in Saltash, just
outside the city.
2.40 PPS4 states that assessment of need should be based on realistic inputs into forecasting,
and accordingly this study takes into account the likely length of the downturn, based on the
most up-to-date forecasts of population and expenditure growth.
Polarisation Trend in the UK
2.41 A significant and long term trend is the continuing polarisation by retailers towards larger
schemes in larger centres which is driven by a number of factors. Retailers recognise that
greater efficiency can be achieved by having a strategic network of large stores offering a
full range, rather than having a large network of smaller stores, and are therefore
increasingly seeking to serve larger population catchments from larger stores. It is also
driven by consumers, who are becoming more discerning and are increasingly prepared to
travel further.
2.42 There is therefore a concentration of comparison goods expenditure in a smaller number of
larger centres. Indeed CB Richard Ellis estimates that half the population currently shops in
just 70 or so major locations, down from 200 locations 30 years ago2.
2.43 The growth of the dominant foodstores and decline in unit numbers poses similar
challenges for district and local centres which rely on their convenience/service base. A
clear picture is emerging of a network of large dominant superstores, and corresponding
decline/diversification in the traditional smaller centre. Again, CB Richard Ellis suggest that
‘half the population now shop for main groceries in less than 1,000 of the country’s 10,000+
main grocery stores: the majority located out-of-town’3.
Trends in key retail sectors
Clothing & Footwear
2.44 Clothing and footwear is the second largest area of town centre retail spending in the UK
after food and grocery. The sector remains relatively strong, despite a number of high
profile administrations. However, recent research has indicated that price remains the
second highest loyalty driver in the sector (behind range of goods4), suggesting that the
pressures on disposable income remain pertinent to the sector.
2
Source: CB Richard Ellis, UK Retail Briefing
3
Source: CB Richard Ellis, UK Retail Briefing
4
Verdict Research ‘How Britain Shops: Clothing’, 2011
Final Report | May 2012 12Plymouth Retail and Centres Study
2.45 Clothing & footwear retailers have benefited from a raft of new shopping centre space and
town centre rejuvenation over the last few years. At the same time, as they are seeking to
expand and complement their town centre portfolios, town centres do remain the biggest
sales channel for the sector. Some clothing retailers continue to open new trading
floorspace despite the economic downturn, or upgrade existing retail floorspace (for
example, in Plymouth, Next moved from a small store to occupy the much larger store in
Drake Circus); however others such as Arcadia Group (which owns Burton, Dorothy
Perkins, Evans and Top Shop) are seeking to reduce presence in centres as leases expire.
Lower-middle market clothing retailers such as New Look and H&M continue to trade
successfully.
2.46 Forecasts for the sector over the study period indicate that growth will continue, but it is
likely to be directed towards ‘value retailers’ and ‘premium players’, rather than the middle
market. In 2000, 28 per cent of consumers shopped in ‘value’ retailers. By 2010, this had
increased to 57 per cent. However, ‘premium players’ look set to play an increasingly
important role in the sector – since the onset of the recession, the number of shoppers
regularly buying at premium stores such as Crew Clothing and White Stuff has increased by
6.2 per cent (equivalent to an extra 3.2 million adults) 5.
Bulky Goods
2.47 The poor performance of the DIY sector in recent years has been well-documented and is
set to continue in the short-term. New store openings by DIY store operators are relatively
limited. The Focus DIY chain, which has almost 200 stores across the UK, entered
administration in May 2011, reflecting the ongoing difficulties in this sector.
Department Stores
2.48 There has been a lot of new shopping centre space available for department stores during
the last few years. This new space, coupled with the big players revamping existing stores,
has led to department stores increasing their share of town centre sales from 7.4% in 2002
to 7.8% in 2007. However, expansion plans of many department stores were subsequently
put on hold on account of the recession, and only now are beginning to come back on
stream, and the retailers with higher operating margins remain reluctant to open new space.
2.49 Driven by market saturation for full line department stores in many areas, major department
store operators are now willing to take on smaller format stores. For example, John Lewis
are trialling a number of ‘John Lewis At Home’ stores, which typically operate from retail
park locations, and focus solely on the home furnishings element of a full-line John Lewis
department store.
2.50 Despite the economic downturn, department stores continue to open new stores, typically in
areas where there is a gap in the market. For example, John Lewis have signed to open
new stores in Birmingham, Leeds, Exeter and Stratford (East London), whilst Debenhams
have opened stores in Wakefield and Newbury.
5
Barclays Corporate (with Verdict Consulting), ‘Current and Future Opportunities for the UK Clothing Industry’, 2011
Final Report | May 2012 13Plymouth Retail and Centres Study
Electricals
2.51 Major electrical specialists such as Currys have been withdrawing from town centres as
they concentrate on Internet operations and relocating out-of-town, where they can be
accommodated in larger-format stores. Town centre electrical stores are now smaller, and
often have a greater focus on home entertainment goods, such as cameras, personal
computers and audio and video equipment; and personal music players. DSGi, the owners
of Currys and PC World, have in some cases sought to combine the retail offer of two
standalone stores into one unit, usually branded ‘Currys Megastore’. The company has also
undertaken a rebranding and modernisation of many of their stores.
2.52 This shift to out-of-centre locations, together with the reduction in electrical store numbers
and the increase of electrical items sales online, has resulted in the amount of space
occupied by them in town centres falling by 3.9% over the five years to 2009. At the same
time, sales densities have increased due to the arrival in town centres of higher density
retailers, who operate from smaller stores and sell higher value products.
2.53 The substantial investment in DSGi in their stores has been triggered by the arrival of a new
competitor in this sector in the form of BestBuy. An established name in the US, BestBuy
recently opened a number of UK stores, including in Derby and Nottingham. However, the
presence of BestBuy in the UK retail market has been short-lived, and it was confirmed in
November 2011 that all UK BestBuy stores would imminently cease operations, following
poor trading performance since their launch.
2.54 The poor performance of BestBuy is a clear indicator that the electricals sector is not
immune from the economic downturn. As noted above, DSGi are choosing not to renew the
leases of many of their town centre Currys Digital stores once they have expired, and the
Comet chain continues to struggle with poor performance in the UK.
Convenience Sector
2.55 Large foodstores (those with a net selling space of at least 25,000 sq.ft / 2,300 sq. m) have
been the primary driver of growth in the convenience sector. Growth in floorspace of large
foodstores has continued throughout the economic downturn, with typically a 3-4 per cent
increase in floorspace per year. Floorspace in smaller stores (supermarkets, Co-Ops and
convenience stores less than 25,000 sq.ft net) has shown marginal decline, whilst the
floorspace in food specialists (such as butchers, bakers and greengrocers) has reduced by
between 2 and 3 per cent per year. A summary of these trends is provided in Table 2.3.
Publications by the New Economics Foundation have highlighted the decline in small,
specialist retailers, identifying that between 1994 and 2002, the number of independent
businesses selling food, tobacco and beverages fell by almost 30,000.
Table 2.3 Convenience floorspace in the UK by retailer type, 2000-2010
Sector Superstores Smaller stores Food specialists
Total floorspace, 45,760,000 57,924,000 22,166,000
2000 (sq.ft net)
Total floorspace, 54,608,000 57,010,000 18,267,000
Final Report | May 2012 14Plymouth Retail and Centres Study
2005 (sq.ft net)
Total floorspace, 65,528,000 54,358,000 16,526,000
2010 (sq.ft net)
Source: Verdict Research UK Food & Grocery Retailers 2010, page 59
2.56 The convenience sector appears to have been largely unaffected by the economic
downturn, and indeed has often been the beneficiary of floorspace becoming available in
town and City Centres as a result of comparison goods retailers entering administration. For
example, Iceland acquired 57 former Woolworths stores in early 2009, with Tesco also
acquiring a number of stores to be converted into ‘Metro’/’Express’ format stores. However,
Verdict Research considers that expenditure growth in the convenience sector is likely to
slow down in the short term:
‘Growth in expenditure on food & grocery products has slowed significantly in 2010 and in
the short term it is set to be subdued comparative to the sector’s recent performance.
Competitive pressures in the sector are set to intensify which, coupled with emerging
consumer trends towards online and convenience retailing, is forcing a strategic rethink for
retailers. They will need to adjust strategies and propositions to ensure returns are
maximised as new market dynamics emerge.’
(Verdict Research UK Food &Grocery Retailers 2010, page 2)
2.57 Asda acquired the Netto chain of supermarkets in 2010, and plans to convert all acquired
Netto stores over to Asda branding during 2011 and 2012. The first of the new format ‘Asda
Supermarket’ stores opened in Worksop in May 2011. Morrisons are on an ambitious drive
to increase their market share in the south west, especially given their major investment in
a new distribution and packing facility in Bridgwater. At the higher end of the grocery
market, Waitrose are currently embarking on a sustained programme of store openings
outside its traditional south east
2.58 Operators are also continuing to open larger format stores – we have noted above the
recent planning consent for a new Tesco store in Plymouth as an example of this, although
it is understood that Tesco may be moving away from these very large format stores, so
whether this trend continues remains to be seen. Operators are also investing heavily in
smaller ‘Express’ format stores in town and City Centre locations. For example, in the year
ending 2010/11, Tesco added 155 Express stores to its store portfolio, compared to 37
‘Extra’/large format Tesco stores. Verdict expects the trend towards smaller, more flexible
format to continue in the short term:
‘In responding to emerging consumer trends it is also imperative that grocers pursue
balanced and flexible space expansion. While grocers continue to face hurdles and
narrowing opportunities for new outlets in out-of-town locations, each of the Big Four has
aggressive expansion plans in the pipeline, not least Tesco (2.4 million sq ft in 2010/11) and
Sainsbury (2.5 million sq ft in the two years to March 2011). However, as the race for space
intensifies, format flexibility will be essential. Indeed, we expect smaller formats will
increasingly form the focus of expansion plans. Expansion plans will be focused on
convenience stores to capitalise on emerging consumer shopping habits. Moreover,
compared to larger stores, convenience stores have less stringent planning laws.’
Final Report | May 2012 15Plymouth Retail and Centres Study
(Verdict Research UK Food &Grocery Retailers 2010, page 3)
2.59 The major foodstore operators have been seeking to diversify into non–food markets.
Furthermore, out-of-centre space is cheaper than comparable space in town centres,
making it easier for out-of-centre superstores to compete on price, while adjacent parking
makes them much more convenient for bulkier household goods. The expansion of
foodstore operators’ non-food offers via their out-of-centre superstores – thereby providing
a convenient one-stop shop for most food and non-food needs - represents a significant
threat to high street retailers. Both Tesco and Asda, in addition to their supermarkets,
operate a number of standalone non-food stores (‘Tesco Home Plus’ and ‘Asda Living’
respectively) which tend to occupy space at purpose-built out-of-town retail parks.
Sales densities
2.60 In the pre recession years growth of retail expenditure outstripped supply of floorspace
leading to growth in sales densities. This was exaggerated by the impact of the relaxation of
Sunday trading and the 24 hour stores and the replacement of older stores with more
efficient modern floorspace.
2.61 However the recent and future expansion of the numbers of stores and the reduction in
expenditure growth as previously discussed will be at the expense of sales densities. As
Verdict states in its 2011 grocery report
‘Retailers are diluting the benefits of increased space by encroaching on existing store catchment areas,
while consumers are spending less and volumes are suffering. Though we forecast that sales densities at
current prices will continue to rise, we expect real sales densities at constant prices to decline between
2011 and 2015’
2.62 This downward trend is expected to continue, especially with consumers demanding
improved shopping environments which inevitably require more space. Therefore these
decreases in sales densities will increase the future need for greater space.
E-tail
2.63 UK internet and non store based retail sales have increased at a rapid pace in recent years.
The increase in e-retail is due to convenience, lower prices than those in stores and
shoppers are able to search out bargains including second-hand goods. In 2006 shoppers
spent a total of £13.7bn on non store retail activity - by this year (2012) this is expected to
have risen to £39.4bn6, the majority of which is made up of online sales. Growth rates have
also been much higher with the gap widening over the past few years. Therefore, whilst
sales in traditional High Streets have suffered as a result of the economic downturn, online
sales have consistently increased.
2.64 At the same time, the internet is becoming more complex and competitive, and retailers
must adapt to this retailing climate. The growth of Marketplace websites is changing the
dynamics of the market and further intensifying competition. While unfavourable economic
conditions are forcing retailers to scale back on physical retail space, their online operations
6
Experian Retail Planner Briefing Note 2011
Final Report | May 2012 16Plymouth Retail and Centres Study
allow them to reach a much wider customer base. There has also been recent growth in
the ‘Click & Collect’ method of online shopping — whereby a customer orders and pays for
the desired product online, and then collects it from the nearest large branch of the retailer.
This approach is currently being rolled out by retailers including Tesco, Sainsbury’s, Asda,
Next, House of Fraser and John Lewis, amongst others.
2.65 The growing number of high street clothing and footwear retailers who have established an
online presence, are likely to continue to benefit from broadening their offers to rival both
the depth and breadth of those in store. There is evidence to suggest that the online
clothing sector remains buoyant despite the economic downturn. In February 2010, it was
reported that online shopping in this sector posted a 34 per cent year-on-year increase.
2.66 In January 2011 the Interactive Media in Retail Group (IMRG) revealed that consumers in
the UK spent £58.8bn online during 2010, an increase of 18 per cent on the previous year.
In the busiest month for online (and general retail) spending, December, an equivalent of
£111 per person was spent online, an increase from £89 per person the previous year.
2.67 In January 2012 IMRG stated that Britons spent £68.2 billion on the internet in 2011, an
increase of almost £10 billion on 2010. This is equivalent to £2,180 for every adult in the
country. During December 2011 shoppers in the UK a total of £7.9bn online during
December, equivalent to £155 per person, up from £111 the previous year.
2.68 Table 2.4 shows the year-on-year growth in key online sectors between December 2008
and December 2009, and also between December 2009 and December 2010. It shows that
whilst growth in some sectors such as electricals and gifts may be levelling out, other
sectors such as clothing and beers, wines & spirits are continuing to post extremely strong
levels of online growth.
Table 2.4 Growth in online spending in key sectors, 2008-2010
Sector Change in online spending, Change in online spending,
December 2008 to December December 2009 to December 2010
2009
Beers, wines and spirits +21% +36%
Clothing, footwear and +18% +40%
accessories
Electricals +39% +8%
Gifts +70% +22%
Health and beauty +39% +19%
Source: IMRG Press Releases, 22 January 2010 and 21 January 2011, via www.imrg.org.
Final Report | May 2012 17Plymouth Retail and Centres Study
2.69 Current forecasts from Experian7 suggest that online shopping on convenience goods is
likely to increase throughout the study period, but in the case of comparison goods, peak at
17.0 per cent between the years of 2016 and 2017, and then marginally decrease
throughout the rest of the study period. In the period to 2017, Experian consider that non-
store retailing will increase at a faster pace than total retail sales. Experian comments that
‘Our assumption that after 2018 internet shopping grows in line with total retail sales reflects
the maturing of the market as the number of computer-literate adults reaches saturation
point’. The outputs of this study specifically take into account this anticipated growth of
online shopping, and, based on Experian guidance, we remove the proportion of total
expenditure which is expected to be diverted towards online shopping before presenting the
final quantitative floorspace requirements for the City.
2.70 Figure 2.1 shows the growth in online spending on convenience and comparison goods
throughout the course of the study period, based on forecasts provided by Experian.
Experian advise however that ‘The calculation of how demand for retail floorspace will be
affected by the rapid expansion of SFT remains a key issue. While it is undeniable that the
challenge to traditional store-based shopping is growing, two factors temper the threat.
Since the non-store retailing figures include supermarkets and other retailers that
source internet goods sales from store space, the share of non-store retailing is over-
stated from the point of view of those interested in physical retail outlets, particularly for
convenience goods.
Even if non-store retailing outpaces store-based shopping as assumed over the next
few years, store-based shopping is still expected to continue to expand at an annual
average of over 2% per annum in per capita terms from 2014 to 2028 (Experian
emphasis in bold).
2.71 Reflecting the first bullet point in the above paragraph, Experian also present adjusted
comparison and convenience goods forecasts, which remove internet goods sourced from
physical store space. This is, broadly speaking, 50 per cent of the total convenience goods
SFT forecast and 25 per cent of the total comparison goods forecast. This is also shown in
Figure 2.1 below. We use the adjusted convenience goods rates as the basis of our
quantitative capacity assessment for the amount of comparison and convenience goods
floorspace which is expected to be required in the City.
2.72 However, based on these uncertainties, we recommend that updated forecasts of internet
spending should be taken into account in any update to the findings of this report which the
Council undertakes over the plan period.
7
The most recent forecasts from Experian are set out in Experian Retail Planner 9, September 2011. We have used this
document as the reference point for all Experian forecasts mentioned in this study.
Final Report | May 2012 18Plymouth Retail and Centres Study
Figure 2.1 - Forecast of non-store retailing (Special Forms of Trading) market share to
2026
18.00%
16.00%
14.00%
12.00%
Proportion of 10.00%
total sales to SFT
(%) 8.00%
6.00%
4.00%
2.00%
0.00%
2014
2025
2009
2010
2011
2012
2013
2015
2016
2017
2018
2019
2020
2021
2022
2023
2024
2026
Comparison goods SFT (unadjusted) Convenience goods SFT (unadjusted)
Comparison goods SFT (adjusted) Comparison goods SFT (adjusted)
Source: Experian Retail Planner 9, September 2011, Appendix 3
*Special Forms of Trading **adjusted SFT includes internet, mail order and markets.
Final Report | May 2012 19Plymouth Retail and Centres Study
3 CURRENT PERFORMANCE OF RETAIL CENTRES
Introduction
3.1 Plymouth has a clear retail hierarchy and this is established within strategy documentation
(namely the Core Strategy). Three tiers of retail centres exist: City Centre, District Centres
(seven) and Local Centres with additional ‘out of centre’ retailing locations
3.2 The hierarchy has been monitored over time and modified according to on the ground
changes in provision. Preparatory work undertaken to inform the development of the
Shopping Centres Supplementary Planning Document has more recently identified a more
detailed hierarchy incorporating City Centre, major district, districts, local centres and
neighbourhood centres. This addresses the aim of developing a bi-polar economy utilising
the dominant presence of the City Centre and creating a new major district to the north of
the city at Derriford.
Centre Healthchecks
3.3 A review of previous retail studies and reports provides information on the state of the City
and district centres in terms of their general ‘health’ in relation to vitality and viability, their
appearance, diversity of uses and outstanding issues in relation to their functionality. A
summary of this review is provided as follows.8 The following map highlights the location of
the city and district centres.
8
Note: healthcheck information for the City Centre is slightly dated (2006) in as much as it pre-dates the Drake Circus
development which was completed later that year. Supplementary information has therefore been taken from the City
Centre & University Area Action Plan 2006-2021). District Centre healthcheck information is more current following the
Plymouth District and Local Centres Study, Cushman and Wakefield 2010).
Final Report | May 2012 20Plymouth Retail and Centres Study
Figure 3.1 Plymouth City and District centres
City Centre
3.4 The City Centre layout is founded upon a masterplan vision created by Abercrombie and
Watson following the destruction of the majority of the Centre’s built environment during the
Second World War. The Centre is based upon a grid pattern – east west (Royal Parade,
New George Street, Cornwall Street, Mayflower Street), and north south (Armada Way to
The Hoe).The grid pattern was designed to build upon the waterfront setting and aimed to
create a vista from the north along the central Armada Way boulevard to the Hoe and the
waterfront area.
3.5 This layout continues to form the basis of the Centre, the main additions being the Armada
Centre (which sits within the grid layout) and the more recent development of Drake Circus,
a new 52,000sqm mixed use development at the eastern edge of the City Centre to the
east of Cornwall Street and New George Street. This is an enclosed shopping complex and
is a departure from the existing built structures.
Final Report | May 2012 21Plymouth Retail and Centres Study
3.6 The City Centre provides a strong comparison offer. There is a predominance of national
multiple retailers within the centre – including House of Fraser, Debenhams, BHS, Marks &
Spencer, Primark, Boots and Next. However, there is also a good representation of
independent outlets.
3.7 The completion of Drake Circus in 2006 (an additional 70 units) has helped move Plymouth
up the Retail Rankings (MHE) from 35th in 2003/04 to 17th in 2008.
Current Retail Provision
3.8 2011 GOAD data provides the most current information in terms of retail provision within
the City Centre (Table 3.1)
Table 3.1
Type of retail provision UK average, 2010 Plymouth % Difference to UK
average
Convenience goods 17.49 9.51 -7.98
retailers
Comparison goods 47.53 63.51 15.98
retailers
Services 22.94 11.34 -11.60
Employment, careers, Post 0.98 0.60 -0.38
Offices and information
Vacant units (all 11.06 15.04 3.98
categories)
3.9 Key features of this data are as follows:
Plymouth has a strong comparison goods offer in terms of its current retailers, with a
16% higher share in this type of use than the UK average. This remains a consistent
trend as reflected in the previous Plymouth Retail Study
Convenience goods provision and Service provision within the City Centre are
consequently both lower than the UK average (8% and 11.6% respectively)
Vacancy Rates
3.10 The recent GOAD data records vacancy levels at 15% (4% higher than the UK average). A
brief review of the City Centre alongside Property Agency interviews shows that vacancies
are highest in the west of the centre (secondary and tertiary retail).
3.11 The Business Improvement District (BID) initiative also collates vacancy data and has a
differing figure – 11.3% (excluding Drake Circus) and 10.7% (including Drake Circus) –
showing the high occupancy rate of Drake Circus. The reason for the difference across the
two data sets can be attributed to a) timescales (GOAD April 2011, BID report from May to
Final Report | May 2012 22Plymouth Retail and Centres Study
September 2011) and b) a slight difference in the boundaries used by GOAD and the
Plymouth BID initiative (the former being slightly larger).
Recent Developments and Future Plans
3.12 Since the development of Drake Circus (2006) there has been an element of
reconfiguration of the high street – a shifting of individual retailer location. This combined
with the added impact of the recession has led to a lowering of rental values which has
resulted in some secondary and tertiary uses being in a position to negotiate on properties
aligned with what were the prime pitches of the City Centre prior to 2006. For example
along Armada Way and between the junction of Armada Way and New George Street /
Cornwall Street. The City Centre still holds capacity for further growth in terms of physical
development. This is due in part to the existing grid structure and some expansive areas of
low density development, and also the need for modernisation of elements of the existing
retail stock. The ‘City Centre and University Area Action Plan highlights the following areas:
Core Retail District: potential for new shopping areas to increase the number and
variety of units / uses including a new anchor store
Drake Circus/ New George Street – creation of an arcade of higher value retailers and
other uses linking Cornwall Street and New George Street
Redevelopment of Cornwall Street (east) and remainder of Cornwall Street (west),
61,000 sqm retail – smaller units which could also accommodate independent retailers.
To include two new modern car parks
Corner of Armada Way and Cornwall Street: new anchor department store, 25,000 sqm
West End: additional retailing, evening, social and cultural activities including:
▫ re-development of Colin Campbell Court: could be convenience or small scale
comparison in the form of a tight knit pattern of streets
▫ greater diversity and visual prominence of Indoor Market, introduction of higher
value boutique style shops
Hotel, leisure, entertainment, additional retail units to the south of Royal Parade
(Leisure and Civic District)
3.13 In general, the size of retail premises available within Plymouth is limited. This is most
notable when comparing the size of premises occupied by national retailers; in Plymouth
their floorspace take-up is much smaller than in comparable City Centres. Small unit size
remains an issue and impacts upon future change in the national multiples representation
within the City Centre.
3.14 However, retailer requirements (as indicated by Focus) report a sharp drop in requirements
from 2005 to 2010 – which mirrors the economic downturn. Local property agents indicate
that current demand is even more limited than estimated with only a small number of
requirements. Several agents indicated that at the present time movement in the primary
retail market is greatly dampened with no known current interest from national multiples.
There is more movement within the secondary retail market.
3.15 One prominent local agent reported that the size of units within the City Centre prime retail
area still pose an issue, with no shops having a depth of greater than 30m (other than the
Final Report | May 2012 23You can also read