CIT Y BIODIVERSIT Y INDEX - KOCHI - ICLEI E-LIB
←
→
Page content transcription
If your browser does not render page correctly, please read the page content below
Kochi Municipal Corporation

         C i t y B i o d i v e r si t y
         Index – Kochi
           Supported by                         Supported in India by                         Prepared under   Project Implemented in Kochi by

Supported by:

                                              Ministry of Environment,
                                              Forest and Climate Change
                                              Government of India

based on a decision of the German Bundestag
Prepared under the BMU supported INTERACT-Bio Project. INTERACT-Bio is implemented by ICLEI – Local Governments for Sustainability and supported by the German Federal Ministry for the Environment, Nature Conservation and Nuclear Safety (BMU) through the International Climate Initiative (IKI). Project implemented in India by: ICLEI-Local Governments for Sustainability, South Asia Year of Publishing: 2020 Copyright ICLEI South Asia (2020) No part of this booklet may be disseminated or reproduced in any form (electronic or mechanical) without prior permission from or intimation to ICLEI South Asia. Permission and information may be sought at (iclei-southasia@iclei.org). Suggested Citation: ICLEI South Asia. (2020). City Biodiversity Index of Kochi Municipal Corporation. Prepared under the BMU supported INTERACT-Bio project. Prepared by: Rithika Fernandes, Alex C J, Sony R K and Monalisa Sen Design: Sasi Madambi Contact ICLEI-Local Governments for Sustainability, South Asia C-3 Lower Ground Floor, Green Park Extension, New Delhi-110016 Tel: +91–11–4974 7200; Email: iclei-southasia@iclei.org
City Biodiversity Index – Kochi

   Contents

Acronyms------------------------------------------------------------------------------------------------------------------- 4
Background--------------------------------------------------------------------------------------------------------------- 5
Summary of the Scores------------------------------------------------------------------------------------------------- 6
Geophysical Characteristics---------------------------------------------------------------------------------------------------------------- 7

PART 1 – Kochi City Profile--------------------------------------------------------------------------------------------- 7
Demography----------------------------------------------------------------------------------------------------------------------------------- 8
Economy----------------------------------------------------------------------------------------------------------------------------------------- 8
Biodiversity------------------------------------------------------------------------------------------------------------------------------------ 9
Administration of Biodiversity -----------------------------------------------------------------------------------------------------------13
Native Biodiversity--------------------------------------------------------------------------------------------------------------------------15
Indicator 1: Proportion of Natural Areas in the City-----------------------------------------------------------------------------------------------15

PART II: Indicators of the Index on Cities’ Biodiversity------------------------------------------------------- 15
Indicator 2: Connectivity Measures or Ecological Networks to Counter Fragmentation-------------------------------------------------17
Indicator 3: Native Biodiversity in Built Up Areas (Bird Species)-------------------------------------------------------------------------------20
Indicator 4 - 8: Change in Number of Native Species----------------------------------------------------------------------------------------------21
Indicator 9: Proportion of Protected Natural Areas-----------------------------------------------------------------------------------------------24
Indicator 10: Proportion of Invasive Alien Species------------------------------------------------------------------------------------------------25
Indicator 11: Regulation of Quantity of Water-----------------------------------------------------------------------------------------------------27
Indicator 12: Climate Regulation: Carbon Storage and Cooling Effect of Vegetation-----------------------------------------------------29
Indicator 13: Recreational Services-------------------------------------------------------------------------------------------------------------------31
Indicator 14: Educational Services---------------------------------------------------------------------------------------------------------------------34
Indicator 15: Budget Allocated to Biodiversity-----------------------------------------------------------------------------------------------------35
Indicator 16: Number of Biodiversity Projects Implemented by the City Annually-------------------------------------------------------37
Indicator 17: Policies, Rules and Regulations – Existence of Local Biodiversity Strategy and Action Plan--------------------------39
Indicator 18 : Institutional Capacity - Essential Biodiversity Related Functions-----------------------------------------------------------40
Indicator 19 : Institutional Capacity - Inter-Agency Co-Operation----------------------------------------------------------------------------41
Indicators 20 : Participation and Partnership - Formal or Informal Public Consultation------------------------------------------------42
Indicators 20 : Participation and Partnership - Institutional Partnership-------------------------------------------------------------------43
Indicators 22: Education and Awareness - Is Biodiversity or Nature Awareness included in the School Curriculum--------------44
Indicators 23: Education and Awareness - Number of Outreach or Public Awareness Events ------------------------------------------45

Annexure 1 - References--------------------------------------------------------------------------------------------- 47
Annexure 2 - Species Lists-------------------------------------------------------------------------------------------- 49

                                                                                                                                                            3
City Biodiversity Index – Kochi

    Acronyms

 ABD                     Area Based Development
 ABS                     Access and Benefit Sharing
 AMRUT                   Atal Mission for Rejuvenation and Urban Transformation
 BMU                     Federal Ministry for the Environment, Nature Conservation, and Nuclear Safety
 CBI                     City Biodiversity Index
 CBSE                    Central Board of Secondary Education
 CDP                     City Development Plan
 c-hed                   Centre for Heritage, Environment and Development
 CMFRI                   Central Marine Fisheries Research Institute
 CNHS                    Cochin Natural History Society
 CoP                     Conference of Parties
 CSML                    Cochin Smart Mission Limited
 CSO                     Civil Society Organisation
 CUSAT                   Cochin University of Science and Technology
 EIA                     Environmental Impact Assessment
 EPIP                    Export Promotion Industrial Park
 ICLEI South Asia        ICLEI - Local Governments for Sustainability, South Asia
 ICSE                    Indian Certificate of Secondary Education
 IKI                     International Klimate Initiative
 INTERACT-Bio            Integrated subnational action for biodiversity: Supporting implementation of National
                         Biodiversity Strategy and Action Plans through the mainstreaming of biodiversity
                         objectives across city-regions
 IT                      Information Technology
 ITeS                    Information Technology enabled Services
 IUCN                    International Union for Conservation of Nature
 KINFRA                  Kerala Industrial Infrastructure Development Corporation
 KMC                     Kochi Municipal Corporation
 KSSP                    Kerala Shastra Sahitya Parishad
 MULT                    Multi-user Liquid Terminal
 NbS                     Nature based Solutions
 NBSAP                   National Biodiversity Strategy and Action Plan
 NGO                     Non Governmental Organisation
 PBR                     People’s Biodiversity Register
 PCCF                    Principal Chief Conservator of Forests
 SBB                     State Biodiversity Board
 SCBD                    Secretariat for the Convention on Biological Diversity
 SPV                     Special Purpose Vehicle
 ULB                     Urban Local Body

4
City Biodiversity Index – Kochi

     Background

T   he City Biodiversity Index (CBI), also known as the Singapore Index was developed after the ninth
    meeting of the Conference of Parties (CoP) in 2008, when it was acknowledged that cites and local
bodies have a role to play in the implementation of a country’s National Biodiversity Strategy and Action
Plan (NBSAP). The purpose of the index was to consolidate the available biodiversity-related indicators
at the local level, which could then help cities to evaluate and benchmark their biodiversity conservation
efforts.

The CBI scoring is quantitative in nature. A total of 23 indicators make up the index, measuring a city’s
native biodiversity, the ecosystem services provided and biodiversity governance. Scores range between
zero to four points for each indicator, with a maximum overall score of 92. The index is meant to allow the
city to visualize their progress in conserving biodiversity with every application of the index. The first year
is considered the baseline against which cities can then chart their subsequent evolution.

According to the Secretariat for the Convention on Biological Diversity (SCBD)1, some of the benefits
that cities derived from the application of the index include “a) the process facilitated capacity-building
in biodiversity conservation, b) the indicators also function as biodiversity conservation guidelines, and
c) assistance in setting priorities for conservation actions and budget allocation through quantitative
scoring”.

The City Biodiversity Index for Kochi was developed under the Integrated subnational action for
biodiversity: Supporting implementation of National Biodiversity Strategy and Action Plans through
the mainstreaming of biodiversity objectives across city-regions or INTERACT-Bio project. Funded by
the Federal Minister for the Environment, Nature Conservation, and Nuclear Safety, (BMU) through the
International Klimate Initiative (IKI), the four-year project is being implemented by ICLEI South Asia
in collaboration with the Centre for Heritage, Environment and Development (c-hed) in Kochi. Kochi
Municipal Corporation is a project partner.

1.   Secretariat of the Convention on Biological Diversity (2014). City Biodiversity Index user’s manual on the Singapore Index on Cities’
     Biodiversity (also known as the City Biodiversity Index). Available from https://www.cbd.int/subnational/partners-and-initiatives/city-
     biodiversity-index. Accessed online on 20 April 2020

                                                                                                                                                 5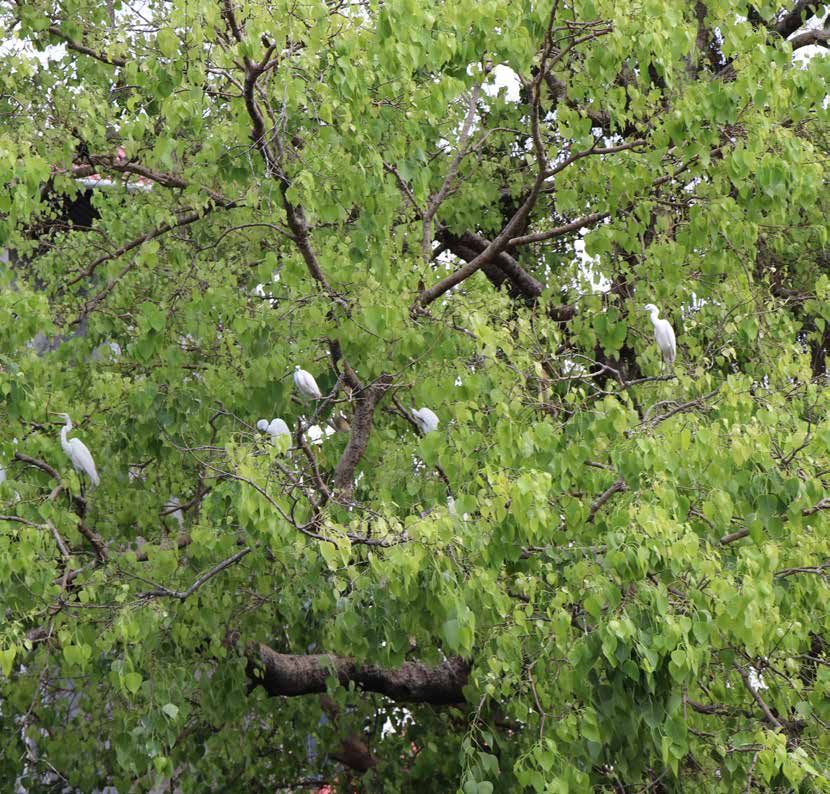
City Biodiversity Index – Kochi
Summary of the Scores
T he Kochi City Biodiversity Index, 2020 has been prepared based on the SCBD endorsed user manual for
CBI updated in 2014 (SCBD, 2014). The city scored a total of 45 out of 72 for the 18 indicators. Since this
was the baseline year the indicators 4-8 were not considered in the analysis, thus reducing the maximum
possible score from 92 to 72.
The first section on “Native Biodiversity in the City”, contributed to a score of 17 out of 20 as only 5
indicators were taken into consideration. This is a robust score and contributes significantly to the
overall score. It is important to highlight that the city scores 17 points in this section primarily because
of the contribution of Kochi’s backwater area which cover a significant percent of the overall area of
the city.
Indicators 11-14 which relate to “Ecosystem Services Provided by Biodiversity in the City” contribute
a total of 6 out of a possible 16 points. Once again the score in this section is primarily due to the
contribution of the backwater area to the various indicators. Urbanisation and industrial activities
are responsible for a shrinking of green spaces and the deteriorating health of the city’s green-blue
infrastructure.
Indicators 15-23 which correspond to “Governance and Management of Biodiversity in the City”
contributed to a score of 22 out of 36 points. This indicates that though the city needs to strengthen
mechanisms in biodiversity governance and management, concrete steps such as the development
a Local Biodiversity Strategy and Action Plan (LBSAP), including biodiversity concerns into their
municipal budget etc. are being taken up proactively.
5
4
3
2
1
0
Indicator 10
Indicator 11
Indicator 12
Indicator 13
Indicator 14
Indicator 15
Indicator 16
Indicator 17
Indicator 18
Indicator 20
Indicator 21
Indicator 22
Indicator 23
Indcator 19
Indicator 1
Indicator 2
Indicator 3
Indicator 9
Figure 1: Kochi Municipal Corporation City Biodiversity Index 2020 at a Glance
6
City Biodiversity Index – Kochi

  PART 1 – Kochi City Profile

The city of Kochi (76°14’E and 76°21’ E and 9°52’ N and 10°1’ N) is the largest urban agglomeration of
Kerala and is situated in the district of Ernakulam (refer Figure 2). It is spread over an area of 107.13 km2
(Government of Kerala, 2006). Kochi has a tropical climate with intense solar radiation and abundant
precipitation. The annual variation of temperature in Kochi region ranges between 22°C and 32°C, and
a more or less uniform temperature exists throughout the year. Rainfall varies from 1,500 mm to 2,000
mm during the south-west monsoon and 400 to 700 mm during the north-east monsoon. The maximum
annual rainfall in the region is around 3,000 mm. The humidity is high all-round the year because of the
nearness to the sea and due to the large area of backwaters in the region (ICLEI South Asia, n.d.).

                                                                                  Source: ICLEI South Asia, 2018

Figure 2: Location Map of Kochi showing the municipal boundaries and the wards of the city

Geophysical Characteristics
Kochi’s location makes it a natural harbour with the city spanning the backwaters, covering the northern
end of a peninsula, several islands and a portion of the mainland. Kochi’s west is bordered by the Arabian
Sea. Elevation of land area varies between -1 to 27 m and most of the city is at an elevation less than 12m.
The city has a coastline of 48 km.

The current metropolitan limits of Kochi include the mainland Ernakulam, Fort Kochi, the suburbs of
Edapally, Kalamassery and Kakkanad to the northeast,Tripunithura to the southeast, and a group of islands
closely scattered in the Vembanad Lake.

                                                                                                                     7
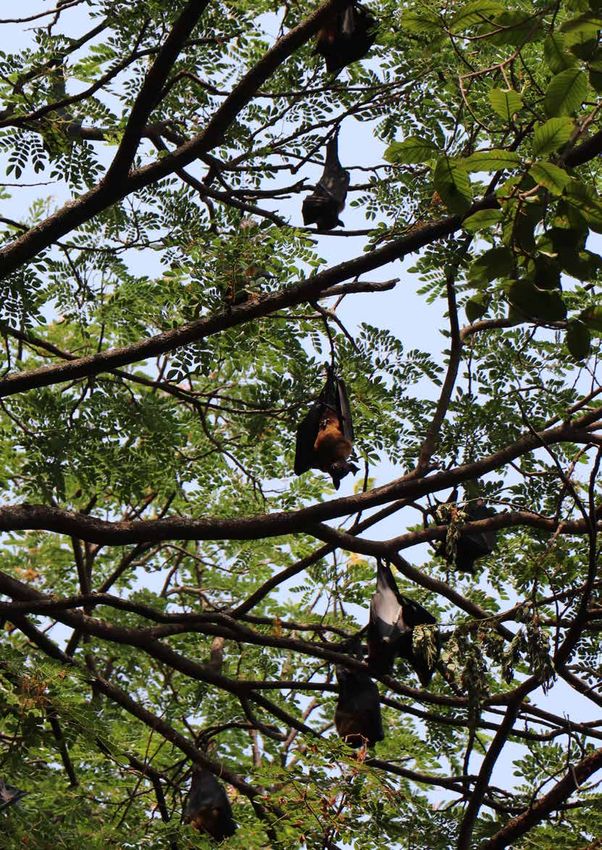
City Biodiversity Index – Kochi

An ecologically sensitive area, the Mangalavanam Bird Sanctuary is located in the heart of the city. It has
a wide range of mangrove species and is a nesting area for several migratory birds and a roosting spot
for large colonies of the Indian Flying Fox. Kochi’s water needs are entirely dependent on ground water
and the two rivers flowing through the district viz., Periyar and Muvattupuzha. Periyar serves the entire
northern part of the city whereas Muvattupuzha River covers the western part.

Demography
With a population of 601,574 as recorded in 2011, the city of Kochi has Kerala’s highest population density
with 5,620 people per sq. km (Census, 2011). In the decade of 2001-11, the city recorded a growth rate
of 0.11 percent. According to the Development Plan (Department of Town and Country Planning, 2010),
the projected population growth within the planning area is expected to be 1.37 million in 2021 and
1.43 million in 2026. The city being an industrial nucleus sees a daily influx of workers (0.25 million) who
commute within a radius of about 100 km. Taking this into account, the total population is estimated to be
2.17 million in 2021 and 2.53 million in 2026 in the City Development Plan (CDP) area.

Kochi has significant Hindu, Christian, and Muslim population. A sizable number of Tamil workers fill low-
wage economic niches. The city’s long history of international trade makes it unusually cosmopolitan, with
many linkages to the Gulf States, Europe, and North America (MoUD and World Bank, 2010).

Kochi scores high on human resource indicators such as education levels and literacy. The city has a
literacy rate of 97.36 percent, which is one of the highest in the country (Census, 2011). The city area has 70
schools, five colleges, a regional study centre of the Mahatma Gandhi University, the Law College and the
Marine Campus of the Cochin University of Science and Technology (CUSAT).

Economy
Kochi, also known as the Queen of the Arabian Sea for its scenic beauty, is a trading port and was the
spice trading centre of the world in the 14th century (Government of Kerala, 2006). To this day, the city is
an important tourist site which attracts the maximum number of domestic and international tourists in
Kerala, while also being a significant economic and trading hub within the state (ICLEI SA, n.d.). The city is
home to the only stock exchange in Kerala, and has also witnessed considerable investment for industrial
growth. Its port provides round the year anchorage, operates as an international container trans-shipment
terminal, houses oil refineries, and supports commercial maritime businesses. The Southern Naval
Command of the Indian Navy is also based here. Other economically important nodes found here include
the Cochin Special Economic Zone (SEZ) and Kerala Industrial Infrastructure Development Corporation
(KINFRA)-Export Promotion Industrial Park (EPIP).

Kochi city contributes 14.47 percent to the state’s GDP, out of which construction and manufacturing
together contribute 37.01 percent and trade, tourism and hospitality together provide another 20.03
percent. Kochi is recognized as one of the seventeen major industrial cities of India as per the World Bank
(2009).

Kochi’s growth and development priorities according to its CDP (Government of Kerala, 2006) are to
enhance its citizen’s quality of life. To do this the Corporation has emphasized on the need to develop
dependable urban services. Within the CDP itself, proposals mainly target the urban basic services sector,
which includes Water Supply, Sewerage, Drainage, Solid waste disposal system, Traffic and Transportation
with special emphasis to the urban poor. The overall vision, considering the city’s natural assets, human
resources, medical facilities available and cultural heritage, is to develop Kochi as a world health care
centre, tourism destination and an IT and ITeS centre.

8
City Biodiversity Index – Kochi
Within the City’s Local Biodiversity Strategy and Action Plan, which has been developed by ICLEI
South Asia, the city has envisioned sustainable development. “Kochi city will conserve its biodiversity,
maintain the uninterrupted flow of ecosystem services, and ensure sustainable, safe and climate resilient
development by managing its mosaic of ecosystems through a participatory planning approach”.
The major drivers of change in terms of biodiversity within the city are the following
1. Rapid urbanisation
2. Solid waste and effluent discharge
3. Increase in invasive species
4. Land use change (including land conversion, reclamation, encroachment)
5. Lack of strict enforcement of laws
Biodiversity
The coastal region, Vembanad backwaters, estuary, mangroves, wetlands, fresh water ponds, Pokkali paddy
fields, other mixed cultivation, home gardens and public open spaces are the major biodiversity habitats of
Kochi city (Figure 2).
Kochi lacks a comprehensive biodiversity profile although a People’s Biodiversity Register (2019) (PBR) has
recently been developed for the Corporation area.
The register identified the following wild faunal species
Crustaceans – 6 species
Birds - 10 species
Reptiles – 7 species including 3 snakes
Amphibians – 1 species
Molluscs – 3 species
Mammals – 9 (wild species - 3)
Aquatic wild fauna – 14 species
zz Non fish – 9 species
zz Fish – 26 species
It also identified the following numbers of wild floral species
Climbers - 7 species
Tubers – 8 species
Shrubs – 10 species
Trees – 20 species
In terms of agrodiversity, 5 tubers, 3 spices, 1 cereal, 4 vegetables, 1 oilseed, 6 fruit species are cultivated.
45 medicinal plants, 12 ornamental and 13 timber species were documented.
The scientifically available data is limited to several study reports on Mangalavanam bird sanctuary, known
as the lungs of Kochi city, which is situated in the centre of the Kochi Corporation area (Jayson and Easa,
1999; Azeez and Bhupathy, 2006; Madhusudhanan and Jayesh, 2011). The other available references
9
City Biodiversity Index – Kochi

are the faunal diversity of the South Kochi (Thevara) by Abin and Samson (2014) and the Environmental
Impact Assessment (EIA) report of the Multi-user Liquid Terminal (MULT) project of Cochin Port (WAPCOS,
2015). Some of the information presented in the following section has been extrapolated from the district
data.

Flora: An inventory of the flora of the Ernakulam district was prepared by Sunil et al. (2015). A total of
1,706 species belonging to 158 families and 866 genera have been documented during the study period
2012–2015. Poaceae is the largest family comprising 161 species followed by Papilionaceae (94 species),
Euphorbiaceae (88 species), Cyperaceae (79 species), Rubiaceae (77 species), Acanthaceae (65 species),
Asteraceae (54 species), Orchidaceae (47 species), Scrophulariaceae (41 species) and Convolvulaceae
(34 species). Out of these 306 species are endemic to either the Western Ghats or Peninsular India and
108 species find a place in the IUCN Red List. 35 species of wild relatives of cultivated crops like piper,
rice, ginger, nutmeg have been documented. A total of 56 invasive alien species belonging to 27 families
and 48 genera have been documented. Ernakulam district is also rich in wetland plant species including
mangroves and coastal species. Out of the 16 true mangroves of Kerala, 14 are found in the district.

In Mangalavanam, the total number of plant species reported was 25 including four species of true
mangroves. The vegetation of the Mangalavanam is dominated by Avicennia officinalis, Rhizophora
mucronata and Acanthus ilicifolius. True mangrove and mangrove associate species such as Derris
trifoliata and Acrostichus aureum are also present here (Jayson and Easa, 1999; Azeez and Bhupathy, 2006;
Madhusudhanan and Jayesh, 2011).

A study of tree species in Subhash Bose Park, Kochi in 2017 (ICLEI South Asia, 2018) identified 66 species of
trees in the park. Another study of avenue trees of Fort Kochi and Mattancherry which is under preparation
by ICLEI South Asia has documented 82 species in the area (ICLEI South Asia, unpubl.) From the EIA of the
MULT project of Cochin port (2015) which surveyed a major part of the Kochi Municipal Corporation (KMC),
91 tree species were reported.

Fauna: An invertebrate survey conducted in South Kochi (Thevara) reported 44 species of butterflies
belonging to 36 genera and five families (Abin and Samson, 2015). Of these, 45 percent belong to
Nymphalidae family followed by Papilioniadae (20 percent), Pieridae and Hespariidae (14 percent), and
Lycanidae (7 percent). The study also reported 10 dragonfly species belonging to nine genera and two
families as well as five damselflies belonging to three genera of the Coenagrionidae family. A spider
survey reported 49 species of spiders belonging to 39 genera and 13 families (ibid). The vertebrate survey
conducted in Thevara, south Kochi reported 44 species of fishes belonging to 40 genera of 35 families, four
species of amphibians belonging to four genera of three families, 14 species of reptiles belonging to 13
genera of 10 families, 57 species of birds belonging to 46 genera of 29 families and 10 species of mammals
belonging to 10 genera of seven families (ibid).

Azeez and Bhupathy (2006) documented 17 species of butterflies from Mangalavanam, of which 10
species belong to the Nymphalidae family, four species to the Papilioniadae family and three species to
the Pieridae family. A spider survey conducted in Mangalavanam during 2005 reported 16 families, 40
genera and 51 species from there. Araneidae is the dominant family constituting 12 species from eight
genera. Salticidae was represented by 11 species from 10 genera. At the species level, Pisaura gitae was
the dominant species (Sebastian et al., 2005). During the field survey in Mangalavanam by SACON (2004),
a total of 74 species of vertebrates were recorded. It included two species of amphibians (Limnonectes
limnocharis and Bufo melanostictus), five species of reptiles (Calotes versicolor, Hemidactylus frenatus,
Mabuya carinata, Sphenomorphous sp., and Xenochropis piscator), and five of mammals (Pteropus giganteus,
Kerivoula picta, Lutra sp., Bandicota indica and Funambulus sublineatus). The dominant vertebrate fauna

10
City Biodiversity Index – Kochi

observed was birds. A total of 398 birds belonging to 62 species were observed during the survey.
Aquatic forms numbering 20 species contributed to a majority of the bird population. In earlier records of
Mangalavanam (Jayson and Easa, 1999), the total number of bird species visiting the area was 72.

Vembanad Lake and its wetlands is the largest Ramsar site on the south west coast of India, and forms
shallow estuarine network running parallel to the coastline of Kerala opening into the Arabian Sea, at
Kochi and at Azhikode. Several economically important fish species are found in the lake such as cichilids,
cyprinids, mullets, cat fish, crustaceans such as penaeids and crabs. 80 species of fin fishes, five species of
penaeid shrimps, three species of palaemonid prawns and two species of crabs were reported (Asha et al.,
2014) from this ecosystem.

The Pokkali system of rice cultivation (paddy and prawn culture) was carried out in the city region but now
the majority of these wetlands have been converted to other urban land-use, or some part is permanently
used for prawn culture. Coconut is the commonly cultivated tree in the city region. Home gardens in the
area also act as a good reservoir of biodiversity. One study in the nearby panchayats recorded 56 species of
plants in 168 surveyed home gardens (Sankar et al., 2000).

Perhaps in terms of area, the largest study conducted was the Environmental Impact Assessment Study for
Multi-User Liquid Terminal Project (MULT) at Puthuvypeen, Cochin Port in 2015. The assessment identified
about 50 species of marine/estuary fish species, eight species of prawn, four species of crab and two
species of clams (EIA – MULT, 2015). It also identified 91 flora, two species of amphibians, nine species of
reptiles, 43 bird species and nine mammalian species.

Another citizen science platform, iNaturalist (inaturalist.org), which is a joint initiative of the California
Academy of Sciences and the National Geographic Society, was also referred to.

                                                                                                                      11
City Biodiversity Index – Kochi Figure 3: Natural Asset Map showing the main ecosystems of Kochi 12
City Biodiversity Index – Kochi

Table 1: Area wise distribution of natural assets (inside KMC boundary)
 Sl. No. Land Class                     Area in ha
 1       Backwater (inland)                          82
 2       Beach                                       13
 3       Canal                                       34
 4       Coconut cultivation                         38
 5       Fallow (Paddy field)                        85
 6       Inland fish culture                         45
 7       Mangrove                                   119
 8       Marsh                                      289
 9       Mixed cultivation                          234
 10      Open Green Spaces                           34
 11      Parking ground                              11
 12      Playground                                  79
 13      Pond                                          6
 14      Pond (Wetland Remnant)                      32
 15      Prawn culture                               27
 16      River                                      122
 17      Sparse vegetation                          106
 18      Tree patch                                 199
         Total                                   1,555

Administration of Biodiversity
Krishnan et al. (2012) detail out five types of biodiversity governance models that aid in conservation,
sustainable use, and fair and equitable sharing of biological resources across different landscapes in India.
Of the five models, two – territorial forests and protected areas, fall under the protected area type of
biodiversity governance models. The other three – autonomous community efforts, co-management of
forests and decentralized governance of biodiversity, are considered more closely under community based
conservation.

In Kochi the following institutions at the state and the city level, are responsible for biodiversity related
activities.

Kerala Forest Department: This department is headed by the Principal Chief Conservator of Forests
(PCCF),who is assisted by other PCCFs, Additional PCCFs and Chief Conservator of Forests. The department
is concerned with responsibilities like production, conservation, protection, development, working plans,
research, budget, planning, policy, eco-development and tribal welfare, social forestry and community
forestry, forest management information systems, human resource management, vigilance and
administration. The Forest Department maintains Mangalavanam bird sanctuary and Vembanad Lake.

Kochi Municipal Corporation (KMC): KMC was notified in 1967, formed by the amalgamation of the three
ancient Municipalities of the state, viz. Ernakulam, Mattancherry and Fort Kochi, the Willingdon Island and
four panchayats viz. Palluruthy, Vennala, Vytiila and Edappally and the small islands of Gundudeepu and
Ramanthuruth. The city is divided into 74 administrative wards, from which members of the Corporation
Council are elected for a period of five years. The functions of KMC includes major civic services including
roads, street lighting, SWM, slum improvement. For more information please see
https://cochinmunicipalcorporation.kerala.gov.in/

                                                                                                                    13
City Biodiversity Index – Kochi Biodiversity Management Committee (BMC): Under the Biological Diversity Act, 2002, every local body has to constitute a BMC for the purpose of promoting conservation, sustainable use and documentation of biological diversity. An important function of the BMC is the preparation of a PBR that contains comprehensive information on availability and use of local biological resources, and any other traditional knowledge associated with them. The BMC, is supposed to serve as the guardian of all biological resources and traditional knowledge. Kochi’s BMC was formed in 2018 and has developed the PBR of Kochi. For more information please see https://keralabiodiversity.org/index.php/activities/biodiversity-management- committees-bmcs Table 2: BMC members of Kochi Municipal Corporation Sl. No Name Designation 1 Soumini Jain Chairperson 2 C. K. Peter Member 3 K. J. Sohan Member 4 C. Rajan Member 5 Jalaja Mani Member 6 Seena Gokulan Member 7 V. P. Chandran Member 8 R. Rahesh Kumar Secretary Centre for Heritage, Environment and Development (c-hed): c-hed is an autonomous institution, functioning as the research and development wing of the Kochi Municipal Corporation, in the fields of Urban Development and Governance, Environment, Tourism, Culture and Heritage. Sanctioned by the Government of Kerala and established in the year 2002 by the city administration, c-hed has been an integral part of the planning efforts and development aspirations of the Kochi Municipal Corporation. c-hed, has been playing the role of a knowledge partner and resource centre for the city. It has been imparting academic support for the budget preparation and economic planning of the city. In terms of the environment it envisages and implements various schemes focusing conservation activities ensuring that the developmental activities do not impact the environment of the city. c-hed also manages three parks of Kochi i.e. Subhash Bose Park (Ernakulam), Nehru Park (Fort Kochi) and Koithara Children’s park (Panambilly nagar), on behalf of KMC. For more information please visit: http://www.c-hed.org/ Cochin Smart Mission Limited (CSML): CSML is a Special Purpose Vehicle (SPV) formed for the sole purpose of implementation of the smart city mission at the city level in Kochi. The SPV plans, appraises, approves, releases funds, implements, manages, operates, monitors and evaluates the Smart City development projects. Some biodiversity related projects that the CSML is involved in are development of parks and open areas under the Area Based Development (ABD), restoration of various canals in the city and improvement of sanitation within the city. For more information please visit: http://csml.co.in/ Department of Agriculture Development and Farmers’ Welfare, Kerala: This state department is responsible for agriculture development through promotion of scientific methods of cultivation and welfare of farmers of the State through various policies and programmes. The department includes a wide network of offices from the state level to Panchayat level, Departmental Farms and various other institutions. Kochi Corporation Krishi Bhavan looks after matters related to agriculture and horticulture in partnership with the Municipal Corporation. For more information please visit: https://keralaagriculture. gov.in/ 14
City Biodiversity Index – Kochi

  PART II: Indicators of the Index on Cities’ Biodiversity

Native Biodiversity

Indicator 1: Proportion of Natural Areas in the City

The natural areas defined by the Singapore Index Manual are “Natural areas comprise predominantly
native species and natural ecosystems, which are not, or no longer, or only slightly influenced by human
actions, except where such actions are intended to conserve, enhance or restore native biodiversity.” This
definition of natural areas has been followed as closely as possible when it comes to selection of natural
areas. However, it was not possible to only consider areas which are free from most human activities.
Income inequality, a high population density, and limited infrastructural outreach means that while
there are native and natural ecosystems occurring within a city, public access to these areas cannot be
completely restricted.

 Methodology
 As per the CBI user manual

 Principle for calculation of the indicator
 (Total area of natural, restored and naturalised areas) ÷ (Total area of city) × 100%

 Scoring Range: (based on the CBI user manual)
 0 point:   20.0%

City Data
To calculate the proportion of natural areas in the city, a natural asset map (Figure 3) which was developed
under the INTERACT-Bio project was referred to. Table 1 below shows the various classes of natural assets
identified within the natural asset map of Kochi. Several of these categories do not fit into the definition
of natural areas laid out in the Singapore Index such as beach, coconut cultivation, paddy fields, inland
fish and prawn culture, mixed cultivation, open green spaces, parking lots, playground. Beach area was
excluded since there is significant construction and tourism activities that take place here.

The main areas that fall under natural areas are- Mangrove patches, including Mangalavanam Bird
Sanctuary, Backwaters which are declared under the Ramsar Convention, Ponds and Wetland Remnant
Ponds, Marshes and the River.

                                                                                                                     15
City Biodiversity Index – Kochi
Table 3: Natural assets (inside KMC boundary) used in the calculation of Indicator 1
Sl. No. Land Class Area in ha Area in Sq. Km.
1 Backwaters (inland) 82 0.82
2 Mangrove 119 1.19
3 Marsh 289 2.89
4 Pond 6 0.06
5 Pond (WR) 32 0.32
6 River 122 1.22
7 Sparse vegetation 106 1.06
Total 756 7.56
The natural asset map only considers the inland area of the backwaters rather than the total area of
backwaters under the jurisdiction of the city. The total area of backwaters under the jurisdiction of Kochi
city as per the Land Use Board of Kerala is 16.57sq.km. Therefore in the calculation of this indicator the area
of all the land classes in Table 3 are considered except S No 1 or backwaters (inland). The total backwater
area has also been added to the calculation as below,
(Total area of natural, restored and naturalised areas) ÷ (Total area of city) × 100%
Total area of natural, restored and naturalised areas as calculated from the Natural asset map and total
backwater area is 6.74 + 16.57 sq. km. = 23.31 sq. km.
Total area of the city = 94.88 sq. km.
RESULT: 24.57% SCORE: 4
Recommendations to Maintain Score
As previously stated, the high score for this indicator is because of the presence of the backwaters,
the Vembanad Lake, which is a RAMSAR site. That being said, despite being declared as a RAMSAR
site, the backwaters suffer from threats such as pollution and land reclamation (Thomson et al., 2001)
across the city.
The city needs to take greater ownership for the protection of this ecosystem (backwaters) which can
come through strategies and actions that have been formulated in the LBSAP. Strict environmental
regulation especially over industries and construction activities, needs to be exercised.
16City Biodiversity Index – Kochi
Indicator 2: Connectivity Measures or Ecological Networks to Counter Fragmentation
Methodology
As per the CBI user manual
Principle for calculation of the indicator
1
Atotal * ( 1
A 2 + A22 + A32 + ... + An2)
Where:
l A is the total area of all natural areas
total
l A to A are areas that are distinct from each other (i.e. more than or equal to 100m apart)
1 n
l
n
is the total number of connected natural areas
This measures effective mesh size of the natural areas in the city. A1 to An may consist of areas that are
the sum of two or more smaller patches which are connected. In general, patches are considered as
connected if they are less than 100 m apart.
Scoring Range: (based on the CBI user manual)
0 point: < 200 ha
1 point: 201 - 500 ha
2 points: 501 - 1000 ha
3 points: 1001 - 1500 ha
4 points: > 1500 ha
City Data
There are 303 polygons (patches) which can be merged with the backwaters (Figure 4) and river and can be
considered a single unit as per the 100m proximity rule. The total area of this big patch (A1) is 2148.03 ha.
There are 147 patches which are outside the 100m buffer of this big patch. As per the 100 m proximity tool
these 147 patches merge into 92 patches (A2 – A93)
Atotal = 2216. 20 ha
The values of A1 to A93 are given in the excel file
As per the final calculation
Indicator 2 = 1/2216 ha X (4614134.664 ha2) = 2082.003 ha
RESULT: 2082.003 ha SCORE: 4
17City Biodiversity Index – Kochi
Source: ICLEI South Asia, 2019
Figure 4: Patches of natural areas which can act as ecological corridors within the boundary of KMC
18City Biodiversity Index – Kochi
Recommendations to Maintain Score
The city can work towards maintaining this score by supporting restoration around these natural
areas and strengthening local protection mechanisms by involving citizens. A cohesive vision for the
same has also been envisioned in the LBSAP, which the city needs to put into implementation.
19City Biodiversity Index – Kochi
Indicator 3: Native Biodiversity in Built Up Areas (Bird Species)
Methodology
How to calculate indicator
Number of native bird species in built up areas where built up areas include impermeable surfaces like
buildings, roads, drainage channels, etc., and anthropogenic green spaces like roof gardens, roadside
planting, golf courses, private gardens, cemeteries, lawns, urban parks, etc. Areas that are counted as
natural areas in indicator 1 should not be included in this indicator.
Scoring Range: (based on the CBI user manual)
0 point: < 19 bird species
1 point: 19 - 27 bird species
2 points: 28 - 46 bird species
3 points: 47 - 68 bird species
4 points: > 68 bird species
City Data
A detailed and comprehensive inventory of bird diversity in Kochi is absent although, pockets of the city
have been surveyed as indicated in Part 1. For the purpose of calculating indicator 3, the citizen science
platform developed by Cornell Lab of Ornithology, eBird (2019) was referred to. Birds sighted within the
municipal corporation limits were considered. Sightings from Mangalavanam Bird Sanctuary and the
backwaters were excluded, as per the guidelines of the CBI manual. This type of exclusion of sightings
is possible using e-bird’s mapping tools. Furthermore, the list generated was also checked for common
urban birds by birding experts of the city.
The total number of bird species identified through this method was 94 of which 81 were resident which
corresponds to a score of 4.
A list of the birds considered is given in Annexure 2, Table 8.
RESULT: 81 SCORE: 4
Recommendations to Maintain Score
In order to sustain this score, the city needs to ensure the maintenance of its natural and naturalized
spaces which provide a mosaic of habitats and resources for birds of the city. This has also been
emphasised in the LBSAP through policy recommendations.
20City Biodiversity Index – Kochi
Indicator 4 - 8: Change in Number of Native Species
Methodology
How to calculate indicator
The change in number of native species is used for indicators 4 to 8. The three core groups are:
l Indicator 4 : Vascular plants
l Indicator 5 : Birds
l Indicator 6 : Butterflies
These groups have been selected as data are most easily available and to enable some common
comparison.
Cities can select any two other taxonomic groups for indicators 7 and 8 (e.g., bryophytes, fungi,
amphibians, reptiles, freshwater fish, molluscs, dragonflies, beetles, spiders, hard corals, marine fish,
seagrasses, sponges, etc.)
The above data from the first application of the Singapore Index would be recorded in Part I: Profile of
the City as the baseline.
Net change in species from the previous survey to the most recent survey is calculated as:
Total increase in number of species (as a result of re-introduction, rediscovery, new species found, etc.)
minus number of species that have gone extinct.
Scoring Range: (based on the CBI user manual)
0 point: Maintaining or a decrease in the number of species
1 point: 1 species increase
2 points: 2 species increase
3 points: 3 species increase
4 points: 4 species or more increase
City Data
Apart from isolated studies compiled by organisations and academicians (please refer Part 1 and details
in Table 4) and citizen science platforms (eBird and iNaturalist), there has not been a comprehensive
compilation of the biodiversity of Kochi. Species lists which were compiled for the purpose of the CBI are
provided in Annexure 2.
Indicators 4, 5, and 6 as directed by the CBI correspond to the taxonomic groups Vascular Plants, Birds and
Butterflies. Taxonomic groups considered for Indicators 7 and 8 are Mammals and Spiders.
Since this is the baseline year for the species count, the city will not receive a score on the indicators 4-8
and it will be excluded from the overall calculation.
21City Biodiversity Index – Kochi
Table 4: Studies on biodiversity for various ecosystems of Kochi
Ecosystem Assessed Study Taxa Assessed Results (species no.)
Mangalavanam Jayson and Easa, 1999 Flora (Mangroves and Flora: 25
Trees), Birds, Fish, Fish: 7
Reptiles, Mammals. Reptiles: 4
Birds: 42
Mammals: 5
SACON, 2004 Flora, Butterflies, Birds, Flora: 25
Reptiles, Amphibians, Butterflies: 17
Mammals Amphibians: 2
Reptiles: 5
Birds: 62
Mammals: 5
Sebastian et al., 2005 Spiders 51
Azeez and Bhupathy, Birds 32
2006
Madhusudhanan and Flora 23
Jayesh, 2011
Thevara Abin and Samson, 2015 Butterflies, Spiders, Butterflies: 44
Dragonflies and Spiders: 49
Damselflies, Fish, Dragonflies: 10
Amphibians, Birds, Damselflies: 5
Reptiles, Mammals Fish: 44
Amphibians: 4
Reptiles: 14
Birds: 57
Mammals: 10
Abin and Samson , 2017 Birds 73
Kochi City Region Environmental Impact Flora, Crustaceans, Flora: 91
Assessment (EIA) report, Molluscs, Fish, Crustaceans: 12
2015 of the Multi-user Amphibians, Reptiles, Molluscs: 2
Liquid Terminal (MULT) Birds, Mammals Fish: 50
project of Cochin Port Amphibians: 2
Reptiles: 9
Birds: 43
Mammals: 9
Vembanad Lake (entire Asha et al., 2014 Fin Fish, Crustaceans Fin Fish: 80
lake including both Crustaceans: 10
North and South Zones)
Subhash Park ICLEI South Asia, 2019 Trees 66
Fort Kochi and ICLEI South Asia, unpubl. Trees 82
Mattancherry
Entire Kochi eBird Birds 167 (resident and
migratory)
22City Biodiversity Index – Kochi
Ecosystem Assessed Study Taxa Assessed Results (species no.)
Entire Kochi BMC, personal Wild and Domesticated Crustaceans: 6
communication, 2019 Biodiversity Birds: 10
Reptiles: 7
Amphibians: 1
Mollusc: 3
Mammals: 9
Non fish aquatic sp.: 9
Fish: 26
Wild Flora: 45
Crops: 5 tubers, 3 spices,
1 cereal, 4 vegetables, 1
oilseed, 6 fruit species
are cultivated.
Medicinal Plants: 45
Ornamental Plants: 12
Timber Plants: 13
Entire Kochi region iNaturalist Several Taxa Plants: 345
Fungi: 20
Molluscs: 14
Spiders: 79
Insects: 522
Fish: 9
Reptiles: 17
Birds: 164
Mammals: 11
RESULT: Since this is the baseline year for the species count,
the city will not receive a score on the indicators 4-8 and it will be
excluded from the overall calculation.
23City Biodiversity Index – Kochi
Indicator 9: Proportion of Protected Natural Areas
Methodology
How to calculate indicator
(Area of protected or secured natural areas) ÷ (Total area of the city) × 100%
Scoring Range: (based on the CBI user manual)
0 point: < 1.4%
1 point: 1.4% - 7.3%
2 points: 7.4% - 11.1%
3 points: 11.2% - 19.4%
4 points: > 19.4%
City Data
As detailed in Part 1 of the index, the governance models for biodiversity in India are of five types which
fall under two main streams- State driven conservation and Community based conservation. Therefore,
the natural areas that receive protection in the city are Mangalavanam which is a Bird Sanctuary. The
backwaters of the Vembanand Lake which is a Ramsar site was also considered as a protected area since it
requires the cooperation of various levels of government to ensure its protection.
The total area of Mangalavanam is 0.027 sq.km.
The total area of the Vembanad Lake or backwaters which falls under the jurisdiction of KMC is 16.57sq.km
Therefore the total area which is protected in the city corporation jurisdiction is 16.597 sq.km.
(Area of protected or secured natural areas) ÷ (Total area of the city) × 100%
Indicator 9= (16.597) ÷ (94.88) × 100% = 17.49% which corresponds to 3 points.
RESULT: 17.49% SCORE: 3
Recommendations to Improve Score
The city can improve its score for this indicator by increasing local protection to its natural areas. The
score for this indicator is based primarily on state driven conservation efforts. The city can encourage
more community based conservation through the Biodiversity Management Committee and can
designate Biodiversity Heritage Sites under the Biological Diversity Act, 2002.
24City Biodiversity Index – Kochi
Indicator 10: Proportion of Invasive Alien Species
Methodology
How to calculate indicator
(Number of invasive alien species) ÷ (Number of native species) × 100%
Scoring Range: (based on the CBI user manual)
0 point: > 30.0%
1 point: 20.1% - 30.0%
2 points: 11.1% - 20.0%
3 points: 1.0% - 11.0%
4 points: < 1.0%
City Data
In India, the most well documented taxa in terms of alien species are flowering plants. This taxa was thus
selected for the purpose of calculation of indicator 10. Due to lack of data on species lists of most taxa at
the city level for Kochi, it was decided to refer to district lists. The inventory of the flora of the Ernakulam
district which was prepared by Sunil et al. (2015) was referred to. A total of 1,706 species belonging to 158
families and 866 genera were documented during the study period 2012–2015. The study also reported a
total of 56 invasive alien species belonging to 27 families and 48 genera from the district.
Unfortunately, a detailed floristic study within KMC jurisdiction has not been conducted and hence, the
city lacks a comprehensive floral profile. In order to overcome this difficulty, the inventory of flora of the
Ernakulam district was reviewed by Dr. C. Jose, a subject matter specialist, who identified the species that
could occur within the municipal jurisdiction based on his knowledge and field surveys (Annexure 2,
Table 9). A total of 490 species of flowering plants occur in KMC of which 253 species are non-indigenous
including introduced plants, naturalized plants, alien/ invasive plants, transformers and weeds. Native
species numbered 237 of the total species.
Sankaran et al. (2013) reported 82 invasive plant species in the State of Kerala and conducted a risk
assessment by grouping these invasive species into high, medium, low and insignificant risk. This resource
was referred to in the preparation of an invasive species list for Kochi city, by comparing species reported
in Sankaran et al. (2013) with a local list developed. The list was vetted by local experts. 39 invasive species
were identified in the KMC area of which 14 are of high risk, 8 are of medium risk, 7 pose a low risk and
the rest 10 are insignificant (Annexure 2, Table 13). Invasive species which fell under the category of
insignificant impact were not considered for the purpose of this indicator calculation.
Table 5: Habit wise distribution of flowering plants of KMC
Items Tree Shrub Herb Climber Total
Species 157 119 149 58 483
Exotic 71 78 73 26 248
Native 86 41 76 32 235
Invasive species 2 7 10 10 29
25City Biodiversity Index – Kochi
Thus to calculate Indicator 10, we have,
Indicator 10 = (Number of invasive alien species) ÷ (Number of native species) × 100%
Number of invasive alien species = 29
Number of native species = 235
Indicator 10 = (29/235) X 100 = 12.34%
RESULT: 12.34% SCORE: 2
Recommendations to Improve Score
As per the risk assessment (Annexure 2, Table 13), the city government along with the BMC, should
focus on developing strategies and action plans to address the high and medium risk species.
Distribution maps of invasive species should also be prepared. Partnerships with academic
institutions, NGOs and CSOs will be of great benefit to the city in tackling the issue.
26City Biodiversity Index – Kochi
Indicator 11: Regulation of Quantity of Water
Methodology
How to calculate indicator
(Total permeable area) ÷ (Total terrestrial area of the city) × 100%
Scoring Range: (based on the CBI user manual)
0 point: < 33.1%
1 point: 33.1% - 39.7%
2 points: 39.8% - 64.2%
3 points: 64.3% - 75.0%
4 points: > 75.0%
City Data
Chithra (2016), measured the total impervious area of the Greater Cochin Area. This area includes Kochi
City and the surrounding urbanizing area, which comprises 330 sq. km extending from 9º 49’N to 10º14’N
and 76º 10’E to 76º31’E.
The analysis showed that the impervious coverage of 53.74 km2 in 1990 increased to 154.63 km2 by 2014,
while there was a corresponding decrease of pervious areas from 183.70 km2 to 87.25 km2 during the same
period. It was also found that this change is not only contributed by conversion of pervious lands into built
up area, but also by reclamation of the backwaters.
The area under the jurisdiction of KMC is only 94.88 sq km. Therefore, an accurate calculation from the
aforementioned source is not possible. However, if the application of the overall percent can be assumed
to the jurisdiction, then the percent of permeable area is 26% which would arrive at a score of 0.
Alternatively, using the Natural Asset Map (Figure 3) to calculate the total permeable area, we have the
following land classes which can be considered (Table 6).
Table 6: Land classes used in the calculation indicator 11
Sl. No. Land Class Area in ha Area in sq. km.
1 Beach 13 0.13
2 Canal 34 0.34
3 Coconut cultivation 38 0.38
4 Fallow (Paddy field) 85 0.85
5 Inland fish culture 45 0.45
6 Mangrove 119 1.19
7 Marsh 289 2.89
8 Mixed cultivation 234 2.34
9 Open Green Spaces 34 0.34
10 Open ground 11 0.11
11 Playground 79 0.79
12 Pond 6 0.06
13 Pond (WR) 32 0.32
14 Prawn culture 27 0.27
27City Biodiversity Index – Kochi
Sl. No. Land Class Area in ha Area in sq. km.
15 River 122 1.22
16 Sparse vegetation 106 1.06
17 Tree patch 199 1.99
Total 1,473 14.73
We also consider the area of the backwaters found in the city’s jurisdiction which is 16.57 sq.km.
Total permeable area= area of Backwaters (16.57 sq.km.)+ Beach + Canal+ Coconut cultivation+ Fallow
(Paddy field)+ Inland fish culture+ Mangrove+ Marsh+ Mixed cultivation+ Open Green Spaces+ Open
ground+ Playground+ Pond+ Pond (WR)+ Prawn culture+ River+ Sparse vegetation+ Tree patch= 31.3 sq
km.
Total terrestrial area = 78.31 sq. km
Proportion of permeable area = 39.97% which scores 2 points.
RESULT: 39.97% SCORE: 2
Recommendations to Improve Score
The city should look into Nature based Solutions (NbS) or a mix of grey and green infrastructure
that can improve the percolation of rainwater into the ground within feasible built-up areas. Strict
enforcement of installation of rainwater harvesting structures as per the Water Policy of Kochi (2015)
can also improve the capture of rainwater and reduce run-off. Increasing the proportion of vegetated
(trees, shrubs and herbs) surface areas in the city through targeted greening activities will also
support the regulation of water especially along the natural drainage.
Policy and legal instruments are effective tools that can also be used to restrict construction in eco-
sensitive zones of the city, especially within or near the natural drainage areas.
28City Biodiversity Index – Kochi Indicator 12: Climate Regulation: Carbon Storage and Cooling Effect of Vegetation Methodology How to calculate indicator (Tree canopy cover) ÷ (Total terrestrial area of the city) × 100% Scoring Range: (based on the CBI user manual) 0 point: < 10.5% 1 point: 10.5% - 19.1% 2 points: 19.2% - 29.0% 3 points: 29.1% - 59.7% 4 points: > 59.7% City Data This indicator has been calculated from the Natural Asset Map (Figure 3), taking into account the following land uses- Coconut Cultivation, Mangroves, Mixed Cultivation, Open Green Spaces, Parking Ground, Sparse Vegetation, Tree Patches (Table 1). As per a field exercise during the development of the Natural Asset Map, it was found that approximately half the areas of Open Green Spaces, Open Ground and Sparse Vegetation land classes have trees, and therefore only 50% of their areas have been considered. Table 7: Land use classes which comprise various types of vegetation which have a role in carbon storage and cooling Sl. No. Land Class Area in ha Tree Cover in ha 1 Coconut cultivation 38 38 2 Mangrove 119 119 3 Mixed cultivation 234 234 4 50% Open green spaces 34 17 5 50% Open ground 11 5.5 6 50% Sparse vegetation 106 53 7 Tree patch 199 199 Therefore the total tree cover in the city of Kochi is 665.5 ha or 6.655 sq. km. The total terrestrial area of the city is 78.31 sq. km. (Tree canopy cover) ÷ (Total terrestrial area of the city) × 100% (6.655) ÷ (78.31) × 100%= 8.498% which is less that
City Biodiversity Index – Kochi

     Recommendations to Improve Score

     The city can improve their score for this indicator through a mix of activities related to conservation
     and restoration of its green spaces. Plantation of native tree species should be actively taken up by
     KMC. Community participation is key in ensuring the success of programmes and strategies towards
     the same. The municipal corporation can also introduce policies that encourage the enhancement
     and maintenance of home gardens in the city. Active support from the NGOs working in the city can
     be taken up.

30
City Biodiversity Index – Kochi
Indicator 13: Recreational Services
Methodology
How to calculate indicator
(Area of parks with natural areas and protected or secured natural areas)/1000 persons
Scoring Range: (based on the CBI user manual)
0 point: < 0.1 ha/1000 persons
1 point: 0.1 - 0.3 ha/1000 persons
2 points: 0.4 - 0.6 ha/1000 persons
3 points: 0.7 - 0.9 ha/1000 persons
4 points: > 0.9 ha/1000 persons
City Data
Indicator 13: This is calculated as area of parks with natural areas and protected or secured natural
areas/1000 persons
The parks that are present in Kochi’s Corporation area are detailed in Table 8.
Table 8: Parks in KMC jurisdiction
Sl. No. Name Ward No
1 Nehru Park 1
2 Mahaboob Park 2
3 Mattanchery Children’s Park 5
4 YMCA Children’s Park 8
5 P R Mathew Park 21
6 Santham Colony Park 22
7 Nazareth Triangle Park 25
8 Thamarakkulam Park 28
9 Pallath Raman Park 28
10 Priyadarshini Park 29
11 Vathuruthy Park 30
12 Navy Environmental Park 30
13 Edappilly Ragavan Memorial Park 37
14 Changambuzha Park 37
15 Senior Citizen Park 41
16 Kunnara Park 49
17 Kumaranasan Nagar North Park 54
18 Jawahar Nagar North Park 54
19 Girinagar Park 55
20 Panampilli Nagar Park 56
21 LIG Park 56
31City Biodiversity Index – Kochi
Sl. No. Name Ward No
22 Silver Park 56
23 GCDA Children’s Park 56
24 Koithara Children’s Park 60
25 Kasthurbha Nagar Park 60
26 Subhash Chandra Bose Park 62
27 Childrens Walkway Park 63
28 Residential Park 63
29 KMC Park 63
30 Girinagar North Park 63
31 Vyloppillli Smaraka Park 65
32 Kochi Refineries Park 66
33 Indira Priyadharshini Children’s Park 66
34 Shevan Kartha Park 66
The total area of parks, along with natural areas and protected or secured natural areas is 34 ha, excluding
Mangalavanam Bird Sanctuary which is a protected area. Including the Sanctuary which is accessible to
the public, the total area of parks comes to 36.74 ha. Fort Kochi which is ward 1 has a small beach area
which has also been considered in the calculation.
Outside of these terrestrial recreational spaces, the backwaters of Kochi span an area of 1,657 ha, have a
number of activities for tourists and the locals to avail, such as house boat renting, boat rides, tours, cruises
and recreational fishing. This was also considered in the calculation of the indicator. Thus we have the
following land classes which have been considered below:
Table 9: Land classes used in the calculation of Indicator 13
Land class Area in ha
Parks/ Open Green Spaces 34
Mangalavanam Bird Sanctuary 2.74
Beach 13
Backwaters 1,657
Total 1,706.74
(Area of parks with natural areas and protected or secured natural areas)/1000 persons = 1706.74/1000
Using this calculation to score Indicator 13, we have 1.7 ha which results in a score of 4 points.
Again, it is important to note that the sheer area of the backwaters contributes to the high score for this
indicator.
RESULT: 1.7 ha SCORE: 4
32You can also read