CITY OF OAKLAND PUBLIC LANDS POLICY - A CALL TO CREATE COMPLETE COMMUNITIES By Carline Au - JUST CITIES
←
→
Page content transcription
If your browser does not render page correctly, please read the page content below
SPRING 2015

CITY OF OAKLAND
PUBLIC LANDS POLICY
A CALL TO CREATE COMPLETE COMMUNITIES

By Carline Au

                                                  1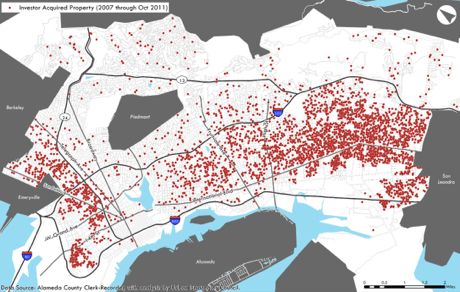
SPRING 2015

Author

Carline Au

Professional Report Submitted in partial satisfaction of the requirements for the degree of Master of City Planning in the
Department of City and Regional Planning at the University of California, Berkeley

Professional Report Committee

Karen Chapple, Professor of City and Regional Planning at UC Berkeley
Carolina Reid, Assistant Professor of City and Regional Planning at UC Berkeley

Acknowledgements

Thank you to Karen Chapple and Carolina Reid for their valuable comments throughout the development of this report.

Thank you to the following individuals who participated in an interview for this project.

Abigail Thorne-Lyman, BART
Adam Maloon, Northern California Land Trust
Allan Donnelly, MKThink
Carolyn Bookhart, Resources for Community Development
Dawn Phillips, Causa Justa
Esperanza Pallana, Oakland Food Policy Council
Gloria Bruce, East Bay Housing Organization
Hui-Chang Li, City of Oakland
James Golde, City of Oakland
Jeffrey Levin, East Bay Housing Organization
Liz Musbach, East Bay Regional Parks District
Margaretta Lin, City of Oakland
Maryann Sargent, City of Oakland
Max Cadji, Phat Beets Produce
Rebecca Tuden, City of Oakland
Steve King, Oakland Community Land Trust
Yassi Eskandari-Qajar, Sustainable Economies Law Center
Valerie Zekas, Northern California Land Trust

Cover photos: (Top to bottom, left to right) CartoDB, Carline Au, Carline Au, OaklandNorth.net

                                                                                                                             2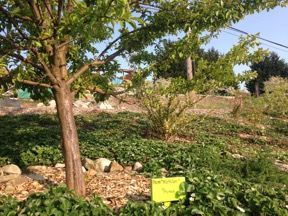
SPRING 2015

Contents
 1. Executive Summary             4

 2. A Changing Oakland                5

           Overview of gentrification and displacement in Oakland

           Public Lands

 3. Overview of Demographic, Economic, and Housing Changes             10

           Demographics

           Housing Cost Burden

           Foreclosures in Oakland

           Formation of a Public Lands Policy

 4. Overview of practices governing publicly owned land         16

           City of Oakland

           Redevelopment Successor Agency

           City of Oakland Surplus Lands

           BART

           AC Transit

           Oakland Unified School District

           East Bay Regional Parks District

           State of California

           Others

 5. Maps          27

           Major Development Projects 2014

           Opportunity Sites Identified in Housing Element 2015-2023

 6. Recommendations              32

           Affordable Housing Production

           Urban Agriculture

           Open Space and Environmental Stewardship

           Local Economic Development

           Broader Efforts

 6. Appendix            45

           Appendix A - Ordinance Updating and Revising the City’s Real Property Acquisition and Disposition Laws

           Appendix B - List of Long Range Property Management Plan Sites

           Appendix C - City of Oakland’s Surplus Properties Process

           Appendix D - Major Development Projects Approved or Under Construction 2014

           Appendix E - Publicly Owned Opportunity Sites Identified for Residential Development (Housing Element 2016-2023)

                                                                                                                              3
SPRING 2015

1.   Executive Summary
While many cities nationwide are sluggishly recovering from the Great Recession and trying to
stabilize their housing markets, rents and home prices are at their highest in many Bay Area cities,
creating an affordable housing crisis. Oakland is experiencing a surge of investment that is certain to
catalyze changes in its physical and economic character. With new transit investment raising
property values in the surrounding area and new services attracted by the rising neighborhood
incomes, we are seeing the loss of cultural institutions, affordable housing and neighborhood-
serving businesses in the City of Oakland. Without adequate public sector protections and
regulations, longtime residents are often displaced or excluded from the benefits of new
development.

Despite this challenge, one opportunity for the City of Oakland is its
2,400 publicly owned parcels totaling over 10,000 acres of land. Public
land included in this inventory belongs to public agencies spanning
multiple administrative levels, from municipal to federal. These parcels
provide an opportunity to address concerns about affordable housing
and/or displacement, since the city or public agencies could target
those lands for development to create “complete communities” and to
meet current residents’ needs. This report asks, how can the city
develop an effective public lands policy to create complete
communities?                                                                  How to use the Maps:
                                                                              1. Go to cdb.io/1NWVTLb
This report is calling for the City to pursue an inclusive public lands       2. Click on a parcel or icon to
policy that serves a variety of public needs: affordable housing, open
                                                                                 find out more information
space, urban agriculture, and local economic development. Political
support and action is crucial—the public sector must play a major role           (address, zoning, size)
in intervening against displacement and ensuring equitable                    3. Layers can be turned on and
development in all neighborhoods.                                                off
                                                                        4. Zoom is available
To inform the development of an effective public lands policy that
promotes equitable development of complete communities, this
professional report will (1) discuss Oakland’s changing demographics
and housing crisis, which has jeopardized neighborhood stability, (2)
summarize practices governing publicly owned land, (3) map all publicly
owned lands, and (4) make recommendations gathered from interviews with community-based
organizations and model policies from municipalities nationally.

The goals of this report are two-fold: to make important connections between land-holding public
agencies, and support advocacy efforts in promoting equitable development in the City of Oakland.

                                                                                                                4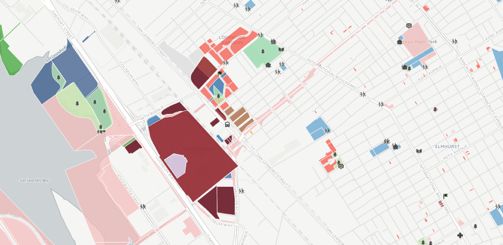
SPRING 2015

2.       A Changing Oakland

While many cities nationwide are sluggishly recovering from the Great Recession and
trying to stabilize their housing markets, rents and home prices are at its highest in many
Bay Area cities, creating an affordable housing crisis. Oakland is experiencing a surge of
investment that is certain to catalyze changes in its physical and economic character.
Coming in second in the nation only to Denver, rents in Oakland have soared 12.1 percent
over the last year, even beating San Francisco's price hikes.1

With new transit investment raising property values in the surrounding area and new
services attracted by the rising neighborhood incomes, we are seeing the loss of cultural
institutions, affordable housing and neighborhood-serving businesses in the City of
Oakland. Without adequate public sector protections and regulations, longtime residents
are often displaced or excluded from the benefits of new development. This has created a
precarious environment in which Oakland teachers, nurses, firefighters, transit operators,
social workers, and government workers struggle to find affordable housing and sustain a
reasonable cost of living. In San Francisco, some community-based nonprofit organizations
are being displaced from the communities they serve and some locally owned businesses
can't survive as commercial rents soar.2 With the scarcity of available large office spaces in
San Francisco and the Peninsula, technology tenants are looking for leasing opportunities
in Oakland. The trend of tenants moving to the East Bay started with non-profits and grew
to professional services like law and engineering firms. Industry experts are anticipating
tech is next.3

Despite this challenge, one opportunity for the City of Oakland is its 2,400 publicly owned parcels
totaling over 10,000 acres of land. Public land included in this inventory belongs to public
agencies spanning multiple administrative levels, from municipal to federal. These parcels provide
an opportunity to address concerns about affordable housing and/or displacement, since the city
or public agencies could target those lands for development to create “complete communities”
and to meet current residents’ needs. Creating complete communities and stabilizing
neighborhoods call for a comprehensive vision of both economic growth and economic inclusion;
sustainable and equitable economic development means striving to leverage economies that
offer opportunity to all.4 This report asks, how can the city develop an effective public lands policy
to create complete communities?

Political support and action is crucial—the public sector must play a major role in intervening
against displacement and ensuring equitable development in all neighborhoods.
This report is calling for the City to pursue an inclusive public lands policy that serves a variety of

1   Van Romburgh, Marlize. “Oakland rents are second fastest-rising in the U.S.” San Francisco Business Times. 11 Feb. 2015.
2Smooke, Joseph and Dyan Ruiz, Dyan. “Five Reasons Why San Francisco Must Not Give Up Public Land for Market-Rate
Development.” Truthout, 3 Apr. 2015.
3   Torres, Blanca. “Oakland looking more and more like the new SoMa for tech leasing.” San Francisco Business Times. 5 Aug. 2014.
4   Chapple, Karen. (2015). Planning sustainable cities and regions: towards more equitable development.

                                                                                                                                     5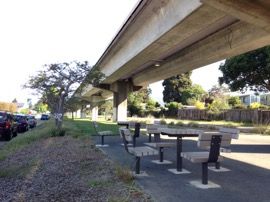
SPRING 2015

public needs: affordable housing, open space, urban agriculture, and local economic
development. Since some of these uses are amenities that have the potential to increase
displacement (e.g. open space, grocery stores), the city will need to enact complementary
policies, such as affordable housing preservation and rent stabilization policies, while engaging in
a public lands disposition process.

The goals of this report are two-fold: to make important connections between land-holding public
agencies, and support advocacy efforts in promoting equitable development in the City of
Oakland.

GENTRIFICATION AND DISPLACEMENT

Causa Justa, a grassroots advocacy organization based in Oakland, defines gentrification
as a “profit-driven racial and class reconfiguration of urban, working-class and communities
of color that have suffered from a history of disinvestment and abandonment.”5 The
process is characterized by declines in the number of low-income, people of color in
neighborhoods that begin to cater to higher-income workers willing to pay higher rents.6
Gentrification is driven not just by new households that are affluent relative to the existing
residents, but by private developers, landlords, businesses, and corporations, and
supported by the government through policies that facilitate the process of displacement,
often in the form of public subsidies.
As discussed in Causa Justa’s Development Without Displacement report, gentrification
and displacement present a host of individual, family, and community-level health
challenges for longtime residents in gentrifying neighborhoods and displaced residents
including the following:
       •    Relocation to neighborhoods with fewer health-promoting resources, public
            transportation access, jobs, healthy food, and amenities. Outlying parts of the
            region may be strained as they face a sudden influx of residents needing services,
            infrastructure, and affordable housing.
       •    Impacts on existing residents include increased rents, fear of landowners evicting
            tenants out of their homes through intimidation, buy-out offers, and eviction
            notices.
       •    As housing prices increase and the cultural fabric of neighborhoods change,
            gentrification can result in the closure of needed services and institutions that are
            vital for existing residents’ wellbeing.
       •    For children, displacement is destabilizing to their social networks and routines, and
            can result in declining school performance.
       •    At the community level, displacement can result in severe social, economic, and
            political fragmentation. Residents who are dispersed from other members of their

5   Causa Justa, (2014). Development Without Displacement: Resisting Gentrification in the Bay Area.
6Chapple, Karen. (2009). Mapping Susceptibility to Gentrification: The Early Warning Toolkit. Center for Community Innovation at UC
Berkeley.

                                                                                                                                      6
SPRING 2015
community may have less political power as voting blocs are diluted and
communities become less organized, inhibiting their ability to advocate for needed
changes to ensure long-term health and well-being.
Displacement can happen in a variety of ways and in both the public and private housing
market, including residents being forcibly relocated in order to make way for renovation of
their housing, landlords raising rents to unaffordable levels, and tenants being evicted so
landlords can rent or sell their units for a higher price. While gentrification may bring much-
needed investment to neighborhoods, including new stores and commercial services, as
well as upgrades to infrastructure and amenities such as parks, displacement prevents
these changes from benefitting those who need investment the most. Creating complete
communities and stabilizing neighborhoods call for a comprehensive vision of both
economic growth and economic inclusion; sustainable and equitable economic
development means striving to leverage economies that offer opportunity to all.
Creating complete communities via public lands is not going to be enough without
protections for existing residents. In a 2011 report written by a coalition of community-
based nonprofit organizations entitled A Bay Area Agenda for Investment Without
Displacement, planning in the Bay Area must strengthen and stabilize communities
vulnerable to gentrification and displacement.7 The report promotes investments in
community assets to meet low-income families’ needs, such as development that
“promotes cultural and community cohesion, recognizes and strengthens existing
community assets, and privileges localized needs, community benefits, and priorities
identified through inclusive neighborhood-based planning.” It also recommends creating
“complete communities in areas that currently lack access to essential resources (e.g.
healthy food, banks, and pharmacies) and infrastructure (e.g. street lights, sidewalks, bus
shelters, and playgrounds) through targeted economic and physical development
strategies driven by a community-based identification of local needs, rather than top-down
planning.”
PUBLIC LANDS
The City of Oakland owns over 2,400 publicly owned parcels totaling over 10,000 acres of
land. Public land included in this inventory belongs to public agencies spanning multiple
administrative levels, from municipal to federal8 . This accounts for more than a third of
Oakland’s total 56.1 square miles (35,904 acres) of land, as shown in Table 19. Since
publicly-owned land may be sold or transferred for any number of purposes, communities
that wish to use publicly-owned land for affordable housing development, urban
7Asian Pacific Environmental Network (APEN), Causa Justa::Just Cause, Council of Community Housing Organizations (CCHO),
PolicyLink, Public Advocates, Urban Habitat. (2011). A Bay Area Agenda for Investment Without Displacement.
8 County of Alameda Assessor’s Office, February 2014; ownership data of “tax-exempt public agencies” does not provide vacancy status.
9 159 parcels included this inventory are less than 1,000 square feet. These parcels may not be developable (e.g alleys, utility easements).
7SPRING 2015
agriculture, open space, or local economic development will need to clearly articulate that
as a priority. Without a clear articulation of how lands get disposed and what constitutes as
“surplus lands,” land-holding public agencies risk squandering its resources. Therefore, a
contribution of this report is to provide an overview of the property disposition process of
each land-holding public agency and to identify whether the agency considers land
transfers for community and public objectives and offers a public bidding process. That
way, the public can better monitor public lands, particularly those that become “surplus.”
Oakland is a city in crisis that needs to dispose of its resources strategically. Now more than ever,
there is a real opportunity to shape how public lands get disposed in a socially, economically, and
environmentally sustainable way. It is imperative that the city enacts inclusive policies to promote
equitable development and stabilize neighborhoods vulnerable to gentrification and
displacement.
To inform the development of an effective public lands policy that promotes equitable
development of complete communities, this professional report will (1) discuss Oakland’s
changing demographics and housing crisis, which has jeopardized neighborhood stability, (2)
summarize practices governing publicly owned land, (3) map all publicly owned lands, and (4)
make recommendations gathered from interviews with community-based organizations and
model policies from municipalities nationally. Although this report focuses on city-level strategies
and policymaking, many of these strategies will involve coordination and decision-making
between public agencies and across cities.
8SPRING 2015
Table 1. Publicly Owned Land by Ownership and Zoning
Residential Commercial Industrial Civic Center
Parcels Open Space Total Acres
Allowed Allowed Allowed Zone
AC Transit 8 2 3 0 3 0 32.1
Alameda
County Flood 3 3 3 0 0 0.4
Control
Amtrak 8 1 2 0 6 0 19.1
BART 100 57 82 3 31 0 58
City of Oakland 1146 595 323 367 166 4 6649.3
City of Oakland
Housing 347 343 324 0 4 4 139.4
Authority
County of
32 22 26 0 5 0 153
Alameda
East Bay
Municipal Utility 117 85 25 8 23 0 483.2
District
East Bay
Regional Park 108 16 0 80 8 2 841.2
District
Federal Land 14 2 12 0 12 0 13.3
Oakland Unified
177 165 108 4 2 6 505.5
School District
Peralta
Community 26 9 1 9 1 7 187.1
College District
Redevelopment
Successor 88 76 82 1 24 0 65.1
Agency
State of
269 176 158 4 81 0 251.1
California
UC Regents 19 19 3 0 0 0 748.6
Grand Total 2462 1571 1152 476 366 23 10146.4
9SPRING 2015
3. Overview of Demographic, Economic, and Household Changes
The City of Oakland is undergoing dramatic demographic and economic shifts that are associated
with gentrification, displacement, and the unprecedented foreclosure of homes. With the arrival
of higher-income residents willing to pay a lot more for rent, many landlords are carrying out
forcible evictions and new buyers are displacing former residents of low-income neighborhoods.
The foreclosure crisis, which predominantly impacted neighborhoods of West and East Oakland,
attracted investors to purchase thousands of homes, changing the character and tenancy of
Oakland’s neighborhoods. Locals are losing the possibility for homeownership as well as asset
accumulation in these formerly affordable neighborhoods. The loss of land (and land rent) for
low-income and population of color necessitates a systematic public lands disposition process
and complete communities strategy.
DEMOGRAPHICS
Census data from 2000 and 2013 shows Oakland’s population of color falling by almost 12
percent, with the African-American population decreasing over 28 percent. Families with children
were forced out of the city during that time, and their number shrank by 14 percent. A significant
indicator of gentrification-related demographic change is an increase in educational attainment,
which shows a 25 percent growth in Oakland.
Table 2 provides citywide demographic data and the percentage change between 2000 and
2013.10
Table 2. City of Oakland’s Demographic Change 2000-2013
2000 2013 % Change
Population of color 68.8% 60.7% -11.8%
Black Population 35.4% 25.4% -28.2%
Homeowner household 41.4% 40.2% -2.9%
At least a bachelor's degree (age 25+) 30.9% 38.5% 24.6%
Median household income (in 2013 $) $55,998 $54,394 -2.9%
Households with one or more people under 18 33.5% 28.9% -13.7%
10 2000 U.S. Census & 2013 1-Year American Community Survey.
10SPRING 2015
HOUSING COST BURDEN
Skyrocketing rent and home prices across the Bay Area are causing an affordability crisis in
Oakland. Also, declining incomes as a result of the recession created further housing cost burden.
The percentage of low-income households that are severely rent burdened—spending 50 percent
or more of their income on housing—increased dramatically since the year 2000. Extremely low
income (ELI) and very low income (VLI) households are considered to be “worst case needs,” who
are at risk of becoming homeless. ELI household who pay half or more their incomes for housing
are at greatest risk of becoming homeless because of their precarious financial circumstances.11
Not surprisingly, cost burdens are most pronounced for those with the lowest incomes.
11 City of Oakland Housing Element 2016-2023.
11SPRING 2015
Figure 1. % of Oakland Renters by Income Paying
Renters 50% or More of Income on Rent
The percentage of severely rent-burdened ELI
households rose from 56 percent to 65 65.4%
2000 2011
percent. The change was even more dramatic 55.6%
for VLI households, who jumped from 16
percent severely rent burdened to 32 percent.
Figure 1 illustrates the increase in rent burden 31.9%
across all household levels since 2000.12
15.9%
8.1%
2.6%
0-30% AMI 31-50% AMI Very 51-80% AMI
Extremely Low Low Income Low Income
Income
Homeowners
Figure 2. % of Oakland Homeowners by Income
Severely cost-burdened households are more Paying 50% or More of Income on Housing
pronounced among homeowners than among
renters in the VLI and low income household
levels. The percentage of severely rent- 61%
58.6% 2000 2011
burdened ELI households rose from 58 52.2%
percent to 61 percent. The change was more
dramatic for VLI and low income households, 34.7%
38.5%
who jumped from 35 percent to 52 and 18
percent to 39 percent severely rent burdened, 18.2%
respectively. Figure 2 illustrates the increase in
cost burden among homeowner households
across all household levels since 2000.13
0-30% AMI 31-50% AMI Very 51-80% AMI
Extremely Low Low Income Low Income
Income
12 2000 & 2007-11 CHAS data; rent includes contract rent and utility expenses.
13 2000 & 2007-11 CHAS data; housing costs include mortgage payment, taxes, insurance, and utilities.
12SPRING 2015
Residential Sales and Rental Prices
According to Zillow research, the median home value in Oakland is $518,900 compared to the
statewide median of $457,000. Over the past year, Oakland overall home values saw an increase
of 15.7 percent, compared to countywide increases of 12.7 percent.14 Between 2011 and 2015,
Oakland’s rental price per square foot has experienced a 34 percent growth, as shown in Figure
3.15 Figure 4 illustrates a gradual progression of residential sales price per square foot from 1996
to 2006, a sharp decrease between 2007 and 2013, and a sudden uptick beginning in year
2013.16
Figure 3. Rental Price Per Square Foot (2011-2015)
2.3
Zillow Rent Index Price Per Square Foot
2
1.7
1.4
1.1
0.8
0.5
1
7
1
20 7
20 1
20 7
20 1
20 7
1
4
0
20 4
20 0
20 4
20 0
20 4
20 0
-0
-0
-0
-0
-0
-0
-0
-0
-0
-0
-1
-0
-1
-0
-1
-0
-1
11
11
12
12
13
13
14
14
15
11
11
12
12
13
13
14
14
20
20
20
20
20
20
Figure 4. Residential Sales Price Per Square Foot (1996-2015)
500
400
Sales Price Per Square Foot
300
200
100
0
97
01
02
07
11
12
96
00
03
04
05
06
10
13
14
15
98
99
08
09
19
20
20
20
20
20
19
20
20
20
20
20
20
20
20
20
19
19
20
20
14 Zillow. (2015). Oakland, CA Profile.
15 Zillow Rent Index PSF for City of Oakland.
16 Zillow Real Estate Research, Zillow Home Value Index for City of Oakland.
13SPRING 2015
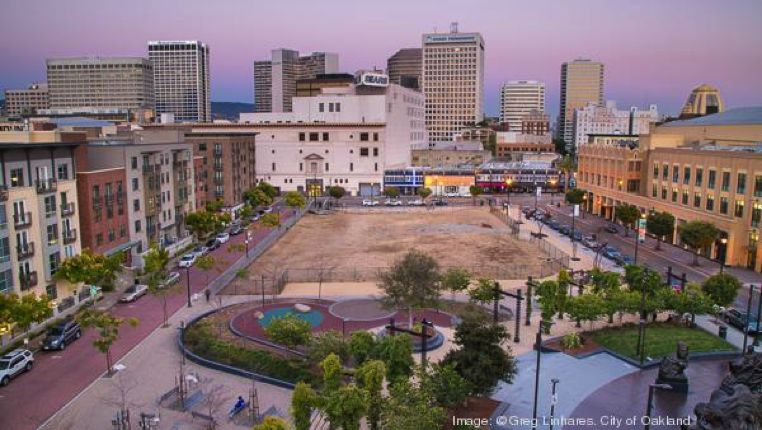
FORECLOSURES IN OAKLAND
Since 2007, there have been over 10,500 completed foreclosures in the City of Oakland. An
analysis conducted by the Urban Strategies Council, a nonprofit organization based in Oakland,
found that 62 percent (6,523) of the 10,508 completed foreclosures were either still owned by a
financial institution or had been acquired by an investor. As of October 2011, investors had
acquired 42 percent of all properties that went through foreclosure in Oakland. Of these
properties acquired by investors, 93 percent were located in the low-income flatland
neighborhoods of the city, as shown in figure 5. Further, only ten out of the top 30 most active
investors are located in Oakland, creating an extremely speculative real estate investment pipeline
in the city and ultimately draining local wealth and impeding efforts towards neighborhood
stabilization post-recession.17
The report contends that the spike in non-local ownership and non-owner occupied housing
presents concerns related to the extraction of wealth from low-income and people of color, in
addition to ongoing property maintenance and management issues. “Given the nearly exclusive
focus of investor activity in West and East Oakland, a range of apprehensions emerge regarding
shifting tenure, neighborhood succession, and the displacement of residents. Embedded in all of
these issues is the underlying question about the strategies and intentions of both banks and
investors in Oakland,” the report states.
Figure 5. Investor Acquired Property (2007-October 2011)
17 King, Steve, Urban Strategies Council. (2012). Who Owns Your Neighborhood? The Role of Investors in Post-Foreclosure Oakland.
14SPRING 2015
FORMATION OF A PUBLIC LANDS POLICY
There are thousands of parcels in the city owned by public agencies spanning multiple
administrative levels, from municipal to federal. These parcels provide an opportunity to address
concerns about affordable housing and/or displacement, since the city or public agencies could
target those lands for development to create “complete communities” and to meet current
residents’ needs. According to the U.S. General Services Administration, “landholding agencies
must survey the real property under their custody or control to identify property that is not utilized,
underutilized, or not being put to optimum use. Disposal agencies must have adequate
procedures in place to promote the effective utilization and disposal of such real property.”18 Yet
many agencies do not have a clear articulation of how lands get disposed and what constitutes
“surplus lands.” At all levels, institutional criteria and a more transparent public process are
needed to evaluate what sites are held for government use, future development, and surplus uses.
Another theme incessantly reiterated by many stakeholders who provided input for this report was
the conviction that public lands be retained to advance public good and purpose in perpetuity. A
land trust model could serve this purpose; however, one of the key barriers to the expansion of
CLTs in the Bay Area is the high cost of land. This is where responsible stewardship of public lands
can make a significant impact on combating displacement and creating complete communities to
meet community needs.
The next section will provide an overview of current property disposition policies and laws
governing publicly owned land.
18 U.S. General Services Administration, Subchapter C—Real Property.
15SPRING 2015
4. Overview of practices governing publicly owned land
The section will summarize the land disposition practices and laws governing land from the
following public agencies: City of Oakland, Oakland’s Redevelopment Successor Agency (now
branded as the Project Implementation Division), BART, Oakland Unified School District, AC
Transit, East Bay Municipal Utilities District, East Bay Regional Parks District, Peralta Community
College District, and Caltrans.19 The purpose of this section is to understand the property
disposition process by each land-holding public agency. Table 4 summarizes each agency’s
consideration to transfer land for community and public objectives and whether it offers a public
bidding process. That way, the public can better monitor public lands, particularly those that
become “surplus.”
CITY OF OAKLAND (1146 PARCELS)
The current rules governing the acquisition and disposition of real property by the City are
scattered in a series of about a dozen stand-alone ordinances and resolutions adopted over the
past 40 years. These ordinances and resolutions are not codified in the Municipal Code nor are
they otherwise easily available to the public.
In January 2015, the City Council adopted recommendations from the City’s Attorney Office to
reconcile the city’s property laws and to merge their ordinances and resolutions governing the
purchase, sale and lease of real property into a single ordinance that would be codified in the
Oakland Municipal Code. The ordinance also updated and revised the city’s real property
acquisition and disposition laws.20 A comprehensive list of changes is provided in Appendix A.
Currently, the City owns more than a thousand properties. These properties fall into a wide variety
of categories, including:
• Land that has been deliberately acquired for a specific facility or purpose (e.g., site for a fire
station, park, corporation yard, etc.);
• Properties acquired for future development;
• "Remnant" parcels, which are irregular parcels left over from road construction or other
capital projects;
• Bequests and donations of property;
• Property that was previously developed for a city facility;
• Parcels that are jointly administered with other government agencies.
19Although this research has identified 15 land-owning public agencies in the City of Oakland, not all public agencies answered requests
for interviews or have land disposition processes.
20 Oakland Municipal Code 2.42.
16SPRING 2015
The vast majority of the City's properties are dedicated for a civic purpose, which means only a
small fraction of these properties will be eligible for sale or lease.
Process for disposition of property for development
As defined in the City’s disposition for development policy:
“The City Administrator markets the real property by issuing a public and competitive NODO
to potential developers and other interested parties. The NODO requests potential developers
and other interested parties to submit written purchase or leasing and development proposals
for the property.
The City Administrator may elect to waive the competitive NODO process and negotiate a
disposition transaction with a selected developer, if the City Administrator determines that (1)
disposition through a competitive NODO process is impractical, or (2) disposition through a
process other than a competitive NODO process is otherwise in the best interests of the City.
The City Administrator must explain the basis for any such waiver when he or she presents the
proposed disposition to the City Council, and the City Council shall make findings in support of
any waiver of the NODO process as a condition to approving any transaction (emphasis
added)
In evaluating development proposals for real property under this article, the City Administrator
may consider, without limitation, in addition to price, any of the following factors:
• The value of the proposed use of the real property to the community and the City as a
whole
• The compatibility of the proposed development and use with current zoning and
community plans applicable to the real property
• The compatibility of the proposed development and use with the character of the
surrounding neighborhood
• The experience, capacity and financial resources of the proposed developer
• The quality of project design
• The environmental sustainability of the proposed development
• Community and public objectives achieved by the proposed development, such as
creating jobs, expanding the tax base, providing other fiscal benefits, providing needed
commercial or social services, providing or improving needed infrastructure, increasing,
improving or preserving the stock of housing affordable to low and moderate income
households, eliminating physical or economic blight, and contributing to the economic
vitality of the neighborhood.
• Other factors, as the City Administrator may deem applicable.”21
21 Oakland Municipal Code Chapter 2.41.
17SPRING 2015
The ordinance gives broad authority to the City Administrator to The sale of a city-owned
sell or lease city-owned property for development based on a parcel just east of Lake Merritt
variety of factors. To encourage faster development, the City has generated a tremendous
Administrator also has the authority to waive a competitive amount of pushback from
NODO/RFP process and negotiate a disposition transaction with housing advocates and
a developer. Many community advocates are standing against
neighbors because “the city
the practice of selling public sites to market-rate developers and
did not extract affordable
entering into exclusive negotiating agreements without a
housing out of the project
competitive NODO process. As a recent example, the sale of a
and gave no consideration to
city-owned parcel just east of Lake Merritt has generated a
affordable housing nonprofit
tremendous amount of pushback from housing advocates and
developers.”
neighbors because “the city did not extract affordable housing
— EBHO Policy Director,
out of the project and gave no consideration to affordable
Jeffrey Levin
housing nonprofit developers,” said East Bay Housing
Organization (EBHO) Policy Director, Jeff Levin.22
CITY OF OAKLAND’S REDEVELOPMENT SUCCESSOR AGENCY (88 PARCELS)
The City of Oakland’s Redevelopment Agency was dissolved as of February 1, 2012 and the
Redevelopment Successor Agency has been created to carry out the activities of the former
redevelopment agency, which is now housed within the Project Implementation Division. The
Project Implementation Division are the City staff implementing the Long Range Property
Management Plan (LRPMP) and issuing RFPs for lands the City wants developed.23
The Oakland Redevelopment Successor Agency (ORSA) has prepared a long-range property
management plan (LRPMP) for 88 parcels, which are comprised of 36 properties (table 3). The
LRPMP divides the properties into four categories: 1) properties retained for governmental use; 2)
properties retained to fulfill an enforceable obligation; 3) properties retained for future
development; and 4) properties to be sold by ORSA. The majority fall under the category of
“property held in retention for future development.
22 Interview with EBHO’s Policy Director Jeffrey Levin.
23 From City of Oakland Website, Project Implementation Division.
18SPRING 2015
Table 3. Long Range Property Management Plan Sites
Number of
Use of Property Examples
Properties
Sunshine Court, 13th Street BART Entry,
Governmental Use 4
Amtrak Station, Leona Creek Right of Way
Property Held to fulfill an Enforceable
2 Fox Theater, Sears Parcels
Obligation
1800 San Pablo Avenue, 23rd & Valdez,
Property held in Retention for Future Uptown Parcel 4, Telegraph Plaza Garage,
25
Development Foothill & Seminary, Fruitvale Transit Village
Phase II, Coliseum City sites
Oak Center Remainder Parcels, 1606 & 1608
Held for Sale 5 Chestnut Street, 822 Washington, Franklin 88
Parking Garage, 8th & Filbert
See appendix B for complete list of Long Range Property Management Plan Sites.
Property disposition process
The property disposition process for former redevelopment property follows the same parameters
as city-owned parcels, as outlined in the previous section. The City’s intended schedule going
forward for disposing of land owned by the Oakland Redevelopment Successor Agency (ORSA) is
every three months.24 Currently, there are four parcels that are currently out for a RFP or in
exclusive negotiation with a private developer, including 1911 Telegraph located in Downtown.25
1911 Telegraph is the first of the properties on the LRPMP up for sale. Next to the Fox Theater, 1911 Telegraph Avenue will
certainly anchor the Uptown neighborhood and attract an iconic project. There is also no height limit on the 1-acre site,
according to Kelley Kahn, Oakland's special projects director. The RFP hinted at the preference towards hotel development to
meet the short supply of hotels in the area. Plus, it would provide the city with transient occupancy tax revenue (TOT). At the
closing of the application in December 2014, three out of eight of the developers proposed hotels. Bridge Housing, a nonprofit
housing developer, is teaming up with a private developer to build the hotel component of its mixed-used plan to also
construct affordable housing on the site.
RFP Selection Criteria for sale of 1911 Telegraph Avenue
30 points - Experience of Developer Team, including
Architect and Key Individuals
10 points - Financial Capacity
30 points - Project Design
15 points – Project financial feasibility
15 points - Community and Public Objectives
100 points total
24 E-mail communication with City of Oakland’s Project Implementation Division.
25 City of Oakland RFP Application for 1911 Telegraph Avenue. Application closed December 2015.
19SPRING 2015
CITY OF OAKLAND SURPLUS PROPERTIES
“After a property has served its purpose and becomes surplus to core city business activities—and
is deemed not suitable for the City lease portfolio—the Surplus Property Disposal Program
prepares it for marketing and administers the sale. This is generally accomplished through a
competitive bidding process, generating revenue for city operations or other beneficial uses,” the
City website states.26
In early 2014, the California State Assembly passed AB 2135 (California Surplus Lands Act), a
legislation that gives affordable housing development projects the right of first refusal to obtain
surplus land held by local governments. It also gives project developers more time to negotiate
the purchase of these surplus lands, stipulates that the land can be sold for less than fair market
value, requires that housing projects that are 100 percent affordable are given first priority, and
codifies that if there are no affordable housing bids and the surplus property is transferred to
residential development then 25 percent of the units must be affordable.27
At the time of this writing, the City of Oakland has 4 surplus properties—all of which are zoned
single-family residences in the East Oakland Hills. However, the City has indicated it will release a
list of potential surplus sites later this year.
There are 4 city-owned parcels currently out for a RFP or in exclusive negotiation with a private
developer, all of which are not considered “surplus lands” and therefore not subject to the State’s
Surplus Lands Act, a requirement of first consideration for affordable housing. Without a local
inclusionary housing ordinance, it is difficult to push for affordable housing on those sites.
Appendix C will provide details about the City’s surplus properties process.
BART (99 PARCELS)
BART currently does not have a master plan to guide the development of its properties and no
policy to dispose of land. However, BART “generally favors long-term ground leases, rather than
the sale of property, as the standard disposition strategy for joint development projects, except in
cases where alternative approaches are required to achieve specific development objectives or
where other strategies would generate greater financial returns to the District.”28 On July 14, 2005,
the BART Board adopted a Transit-Oriented Development (TOD) Policy. The BART Strategic Plan
identifies three Station Area planning objectives:
1. Promoting Transit-Oriented Development on BART property
2. Encouraging Transit-Oriented Development within walking distance of each BART
station
26 City of Oakland. Surplus Property Disposal Program.
27 AB 2135 www.leginfo.ca.gov.
28 BART. (2005). Transit-Oriented Development Policy.
20SPRING 2015
3. Advocating for Smart Growth and Transit-Oriented Development throughout the Bay
Area and beyond
In Oakland, BART has a strong objective to support Oakland’s specific plans and is a member of
stakeholder and technical advisory groups. Staff is working with city and private partners on land
use plans near several stations including West Oakland, Lake Merritt, 19th Street Oakland,
Coliseum/Oakland Airport. Developers are in construction on the affordable housing phase of
development on BART property at MacArthur. BART is developing short- and long-term strategies
for all of its real estate holdings based on information gleaned from a portfolio analysis,29 although
it is unclear whether this will be an internal or public document.
Property disposition process
BART does not tend to sell real property. Under a ground lease option, BART (1) issues a Request
for Qualifications (RFQ) to identify developers, (2) negotiates the detailed terms with the
developer(s), and (3) enters into a development agreement.30
OAKLAND UNIFIED SCHOOL DISTRICT (177 PARCELS)
The OUSD Board of Education approved an asset management policy that stated that the district
would develop a plan to manage its assets at the system-level and that school buildings should
first and foremost be used to educate children in Oakland. Property disposition is a low-priority
option.
Properties that are not being used to educate students, provide core administrative services, or
leased by community-based partner organizations, shall be leased to other entities unless the
Board of Education declares the property surplus and approves the sale of any such property.31
In April 2014, The Board of Education established the 7- 11 Committee to guide the reuse,
repurposing and disposition of school buildings and vacant sites not needed for school
purposes.32
Property Disposition Process
Property disposition is rare; however, OUSD currently retains 5 vacant properties (four former
school sites and one former administrative building).
OUSD’s top priority for these sites is to find a use for the former school sites for charter schools, or
to use them in other ways to educate Oakland students.
29 BART FY 2015 Budget Pamphlet.
30 Interview with BART Planning and Development staff.
31 OUSD Board Policy 7350, adopted August 2013.
32 OUSD Board Resolution No. 1314-1108.
21SPRING 2015
In the event that OUSD wants to do something other than use a facility to educate children, they
would:
• Assess potential buyers/lessees/partners for the facility
• Determine the value of the property
• Determine the type of facility use agreement (long-term lease, short-term lease, joint use
agreement, sale, etc.)
• Deputy chief of facilities presents information to OUSD’s 7-11 Surplus Property Advisory
Committee
• 7-11 committee makes a recommendation of disposition to the Superintendent and
Board of Education
• Board education votes on disposition
It is unclear whether the transfer of OUSD school sites give priority to community or public
objectives.
AC TRANSIT (8 PARCELS)
AC Transit does not own many real properties and thus its disposition process primarily applies to
tangible personal equipment.33 AC Transit likely currently occupies the 8 parcels for
administrative use and for its parking fleet.
EAST BAY MUNICIPAL UTILITY DISTRICT (117 PARCELS)
According to the Land Use FAQ on the EBMUD website, “occasionally EBMUD sells surplus
property. Under California law, it must first be offered to other public agencies and then to the
general public.”34 It is unclear whether the disposition process considers a public or community
objective.
Property Disposition Process
EBMUD’s “practice is to sell surplus real estate in the manner which brings the most revenue to the
agency. Usually the process involves competitive bidding. When parcels are sold by competitive
bid, the sale is advertised in local newspapers and by mailers to interested parties.”
EAST BAY REGIONAL PARKS DISTRICT (108 PARCELS)
33 AC Transit, Board Policy 356, “Disposition Of Surplus Equipment, Supplies, And Other Tangible Personal Property Of The District.”
34 East Bay Municipal Utility District. Land Use FAQ.
22SPRING 2015
The East Bay Regional Parks District does not have a policy to dispose of any lands and is more
likely to acquire lands or joint-develop public lands for open space, resource conservation, trails
access, and recreation.35
As stated in the EBRPD Master Plan,
“The District seeks to acquire parklands and trails over the years based on the features they
contribute and work together for optimum public use, which may include natural resources,
historic or cultural resources, interpretive and educational opportunities, scenic value, access
and transportation, or, in the case of trails, a needed link in the regional parks system.” The
District Board, with the participation of the citizen-based Park Advisory Committee (PAC),
annually reviews undedicated land holdings to determine which may be suitable for parkland
dedication in perpetuity.36
PERALTA COMMUNITY COLLEGE DISTRICT (26 PARCELS)
Under Board Policy 6550 Disposal of Property, “the Chancellor is delegated authority by the Board
of Trustees to declare as surplus such personal property of the District as is no longer useful for
District purposes… All sales of surplus personal property shall be reported to the Board on a
periodic basis.”37
The Administrative Procedure states,
“The District can sell or lease real property belonging to the community college district if both
of the following conditions are met:
1. The property is sold or leased to another local governmental agency, or to a nonprofit
corporation that is organized for the purpose of assisting one or more local governmental
agencies in obtaining financing for a qualified community college facility; and
2. The financial proceeds are expended solely for capital outlay purposes relating to a
qualified community college facility.”
Property Disposition Process
The Administrative Procedure states,
“The District can also exchange for value, sell for cash, or donate any personal property
belonging to the District without complying with the preceding procedures if all of the
following criteria are met:
35 Interview with EBRPD Land Acquisition staff.
36 East Bay Regional Parks District 2013 Master Plan.
37 Peralta Community College District. Board Policy 6550 “Disposal of Property.”
23SPRING 2015
1. The District determines that the property is not required for District purposes, that it
should be disposed of for the purpose of replacement, or that it is unsatisfactory or not
suitable for school use.
2. The property is exchanged with, or sold or donated to, a school district, community
college district, or other public entity that has had an opportunity to examine the
property proposed to be exchanged, sold, or donated.
3. The receipt of the property by a school district or community college district will not be
inconsistent with any applicable district wide or school site technology plan of the
recipient district.”
STATE OF CALIFORNIA (269 PARCELS)
Lands owned by the State of California serve a variety of purposes, from environmental protection
(e.g. Department of Fish and Wildlife), schools (e.g. California State Universities), to transportation
(e.g. Department of Motor Vehicles, Caltrans, California Highway Patrol).
Ownership data from the County of Alameda’s Assessor Data does not indicate a separate field for
responsible departments (e.g. Caltrans). The State has different policies governing state-owned
lands, depending on the departments within the State for their business and operational needs.
Since most of the state’s lands in Oakland are in the transportation right-of-way as viewed on the
map, this section will only look at Caltran’s excess land policy.
Property Disposition Process
As stated in Caltrans' Excess Lands FAQ,
“Excess land is property that Caltrans originally acquired for a transportation project or other
operational need such as a maintenance station. The property becomes excess when the
Department determines that it will no longer be necessary for a transportation project or other
operational need.
Excess land is sold at auction, either by an oral public auction or a sealed bid auction. Under
certain circumstances, excess property may be offered for sale directly to adjoining property
owners. It may also be offered for direct sale to public agencies if the property is to be used
for a public purpose. There is a minimum bid, though sometimes it may be unannounced.
Proceeds from the sale of excess land are deposited in to the State Highway Account and used
for future transportation projects.”38
OTHER AGENCIES
38 CA Department of Transportation. Excess Lands “Frequently Asked Questions.”
24SPRING 2015
Property disposition processes and surplus lands policies were not found for Alameda County,
Alameda County Flood Control District, UC Regents, the State of California, and federal lands.
Agency representatives did not respond to any requests for information at the time of this writing.
Based on this report’s research of property disposition policies, many public agencies are doing a
unsatisfactory job making this information publicly accessible. Transparent and publicly-accessible
procedures should be put in place to promote the effective utilization and disposal of real
property.
Table 4 provides a summary of property disposition policies.
25SPRING 2015
Table 4. Summary of Agency Property Disposition Policies
Property Disposition Process
Considers Community and
Public Agencies Public Objectives Offers Public Bidding Process
AC Transit Unclear Information cannot be found
Alameda County Flood Control Information cannot be found Information cannot be found
Amtrak Information cannot be found Information cannot be found
Yes (applicable for ground
BART Yes leases)
Caltrans Yes Sometimes
City of Oakland Yes City Administrator’s discretion
City of Oakland Housing Authority Yes Information cannot be found
County of Alameda Yes Unclear
East Bay Municipal Utility District Unclear Yes
East Bay Regional Park District Yes Not applicable
Federal Land Unclear Information cannot be found
Oakland Unified School District Unclear Unclear
Peralta Community College District Yes Yes
Redevelopment Successor Agency Yes City Administrator’s discretion
UC Regents Unclear Information cannot be found
26SPRING 2015
5. Maps
The goals of the maps are to show the distribution of publicly
owned land within the City of Oakland and to strengthen
advocacy efforts related to public land capture. It is
recommended that users go to this link for map interaction39:
http://cdb.io/1NWVTLb
Map layers shown:
• Community assets How to use the maps:
1. Go to cdb.io/1NWVTLb
• Major Development Projects in the pipeline as of 2. Click on a parcel or icon to
December 2014
find out more information
• Long Range Property Management Plan Sites (address, zoning, size)
3. Layers can be turned on and
• Public opportunity sites for residential development
off
identified in the Housing Element (2015-2023)
4. Zoom is available
• Publicly Owned Land by Ownership
COMMUNITY ASSETS
Community assets in this inventory include BART stations, parks, hospitals and clinics, schools,
libraries, and recreation centers.
2014 MAJOR DEVELOPMENT PROJECTS
A growing economy has brought a surge of development in Oakland. Based on the inventory
analyzed in this research, nearly 10,000 residential units will be constructed. However, with no
inclusionary housing ordinance in place, the City of Oakland cannot extract affordable units from
these projects. The pipeline of nearly 50 major development projects predominantly located in
Oakland’s waterfront, Downtown, Uptown, West Oakland, and near BART stations represent an
opportunity to plan for the disposition of publicly owned land dedicated to affordable housing
and amenities that serve a public purpose and to promote equitable development.
Major developments on former publicly-owned sites include40 41:
1. Brooklyn Basin (formerly known as Oak to Ninth Ave)
Public Agency: Port of Oakland (City of Oakland)
39 Maps created using CartoDB, a shareable web mapping platform.
40 Retrieved from City of Oakland “Active Major Development Projects-November 2014”
41 Ellson, Michele. “The Development Report: Meanwhile, in Oakland.” The Alamedian, 21 January 2014.
27SPRING 2015
Size: 65 acres
Developers: Signature Properties, Zarsion Holdings Group of Beijing and Reynolds and Brown
What’s being built: 3,100 new homes; 200,000 square feet of commercial space; and 30 acres of
public open space
Affordable housing component: 15% (465 affordable units)
Expected Completion: 2021
2. Oakland Army Base
Public Agency: Port of Oakland (City of Oakland)
Size: 160 acres
Developers: CCIG Prologis; City of Oakland
What’s being built: 1.5 million square feet of industrial space
Expected Completion: 2019
3. MacArthur BART Transit Village
Public Agency: BART
Size: 7 acres
Developers: Bridge Housing
What’s being built: 624 residential units; 42,500 square feet of commercial space
Affordable housing component: 14%
Expected Completion: 2021
4. Clay & 12th Street
Public Agency: City of Oakland
Developer: Strada
What’s being built: 250 residential units
Affordable housing component: none
Status: In negotiation
5. Valdez & 23rd Street
Public Agency: City of Oakland
Developer: Thompson-Dorfman
What’s being built: 281 residential units; 12,000 square feet of commercial space
Affordable housing component: none
Status: In negotiation
6. Lake Merritt Boulevard Apartments
Public Agency: City of Oakland
Developer: UrbanCore
What’s being built: 298 residential units
28SPRING 2015
Affordable housing component: none
Status: Approved
See Appendix D for all major development projects that were approved or under construction in 2014.
Certainly, the City’s approved specific plans have stimulated development interest: Broadway
Valdez District Specific Plan, Lake Merritt Station Area Plan, West Oakland Specific Plan, Harrison
Street/Oakland Avenue, Central Estuary, and International Boulevard and Transit-Oriented
Development Plan. Planning is underway for Coliseum City (East Oakland), which have spurred
significant real estate interest and speculation. Figure 6 shows publicly owned lands near the
Coliseum area.
Figure 6. Publicly owned lands near the Coliseum area.
Coliseum City
There are about a dozen LRPMP sites (former
redevelopment properties) slated for future development in
Coliseum City, an area stretching from the Coliseum to the
airport planned for sports facilities, hotels, retail, and a
technology business center. Community residents and
organizations have advocated for increasing the amount of
affordable housing called for in the Coliseum City Specific
Area Plan. Since much of the land near the Coliseum is
publicly owned, it can lower the cost of affordable housing
development. It is imperative that the city enacts anti-
displacement strategies to ensure existing residents can stay
in their communities and that public investment and new Source: JRDV
amenities benefit low-income and communities of color.
29SPRING 2015
OPPORTUNITY SITES – HOUSING ELEMENT 2015-2023
There are 221 opportunity sites (344 individual parcels) identified for residential development in
the City’s Housing Element 2015-2023. Of the total 221 sites, 49 are publicly owned and scattered
throughout Downtown, Lake Merritt, Fruitvale, Coliseum area, and Eastmont. These parcels are
vacant, highly underutilized, or surface parking lots. Figures 7 and 8 show publicly owned
opportunity sites by ownership and current use, respectively.
See Appendix E for complete list of publicly owned opportunity sites.
Figure 7. Ownership of Publicly Owned Opportunity Sites Identified for Residential Development
30SPRING 2015
Figure 8. Current Use of Publicly Owned Opportunity Sites Identified for Residential Development
31SPRING 2015
6. Recommendations
The following recommendations are gathered through interviews with local community-based
organizations and model policies from municipalities around the United States. This report is
calling for the City to pursue an inclusive public lands policy that serves a variety of public needs
to create complete communities: affordable housing, open space, urban agriculture, and
economic development. Political support and action is crucial—the public sector must play a major
role in intervening against displacement and ensuring equitable development in all
neighborhoods. Long-term and strategic stewardship of public lands should be expanded to the
county-level in order to coordinate policies and funding among public agencies. The following
looks at each public need in turn.
AFFORDABLE HOUSING PRODUCTION
With the loss of redevelopment and the exhaustion of past state affordable housing bond funds,
California has virtually no resources to construct affordable housing. Fast-rising rents and a
shortage of affordable housing in the Oakland could be addressed through a public lands policy.
There are over 1500 publicly owned parcels that permit residential uses in the city, which could be
used to help achieve its affordable housing goals.42
1. Offer public lands for constructing affordable housing as a city priority.
Case Studies: Arlington County (Va.), Montgomery County (Md.) and the City of Alexandria
(Va.), Washington, DC.
These cities are seeking to incorporate affordable homes on more types of pubic properties –
from surplus property sites to the grounds of new fire stations, libraries and community
centers. Offering land in these contexts at a discount to developers that agree to include a
significant share of affordable homes helps make new affordable homes more financially
feasible. Washington DC’s Disposition of District Land for Affordable Housing Act of 2013
requires that all new multifamily residential developments on city-owned land include at least
20-30% affordable housing.43
Key criteria for choosing suitable sites44:
• Clear of legal encumbrances (such as environmental or historic preservation restrictions
• Clean (free of environmental contamination)
42 Based on City of Oakland’s zoning that permits residential uses (RM, RD, RH, CBD, CN, CC).
43 Disposition of District Land for Affordable Housing Act of 2013. Enacted by the Washington DC Council.
44Robert Hickey and Lisa Sturtevant. (2015). Public Land and Affordable Housing in the Washington DC Region: Best Practices and
Recommendations. Center for Housing Policy and the National Housing Conference.
32You can also read