Integrated Implementation Plan 2013-2018 - TheJournal.ie
←
→
Page content transcription
If your browser does not render page correctly, please read the page content below
Integrated
Implementation
Plan
2013-2018

National Transport Authority
Dún Scéine,
Harcourt Lane,
Dublin 2.
National Transport Authority
Integrated Implementation Plan Draft                        1

Contents
1        Introduction and Background                    4
         1.1 Introduction                               4
         1.2 Content of an Implementation Plan          5
         1.3 Plan Process                               5

2        Travel in the Greater Dublin Area              6
         2.1 Greater Dublin Area                        6
         2.2 Population                                 6
         2.3 Employment                                 7
         2.4 Means of Travel                            8
         2.5 Journey time                              10
         2.6 Departure time                            12
         2.7 Car ownership                             12
         2.8 Summary and Main Conclusions              14

3        Transport Challenges and Objectives           16
         3.1 Transport and the Economy                 16
         3.2 Public Transport and Society              16
         3.3 Transport and the Environment             17
         3.4 General Objectives                        17

4        Scope of the Implementation Plan              20
         4.1 Approach                                  20
         4.2 Structure                                 20

5        Overall Infrastructure Investment Programme   22
         5.1 Introduction                              22
         5.2 Overall Programme Approach                23
         5.3 Environmental considerations              23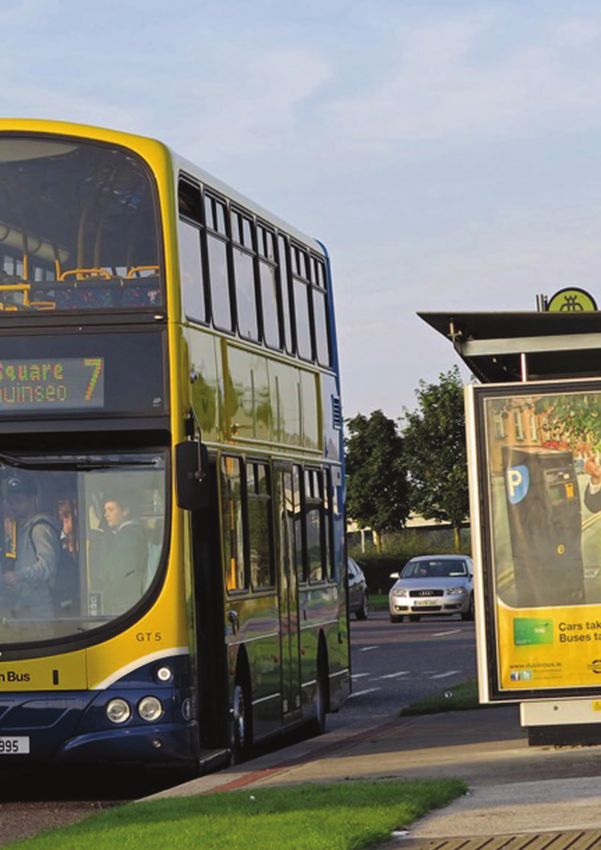
2 National Transport Authority
6 Bus Investment 24
6.1 Background 24
6.2 Objectives of Bus Investment 24
6.3 Proposed Investment Areas 24
6.4 Bus Fleet 25
6.5 Bus Stops and Shelters 25
6.6 General Bus Network Improvements 26
6.7 Bus Rapid Transit 27
7 Light Rail Investment 30
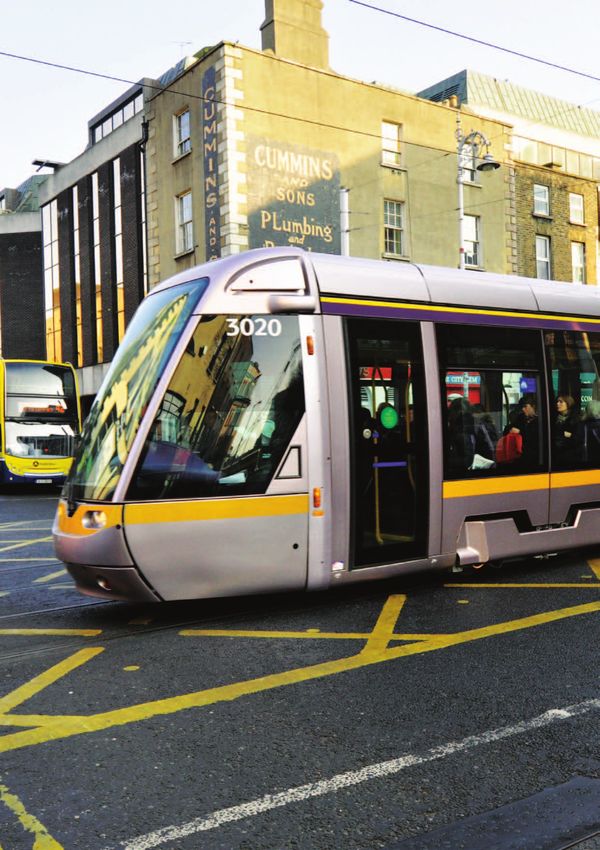
7.1 Background 30
7.2 Objectives 30
7.3 Proposed Investment Areas 31
7.4 Luas Cross City 31
7.5 Fleet and Network Enhancement 31
8 Heavy Rail Investment 32
8.1 Background 32
8.2 Objectives 33
8.3 Proposed Investment Areas 33
8.4 City Centre Resignalling Project 33
8.5 Phoenix Park Tunnel Link 33
8.6 Level Crossing Programme 34
8.7 Ticketing and Revenue Systems 34
8.8 Central Traffic Control (CTC) 35
8.9 Station Improvement and Other Enhancements 35
8.10 Network Development 36
9 Integration Measures and Sustainable Transport Investment 38
9.1 Background 38
9.2 Objectives 38
9.3 Proposed Investment Areas 39
9.4 Cycling / Walking 39
9.5 Traffic Management 40
9.6 Safety 41
9.7 Integration Measures 41
Integrated Implementation Plan Draft 3
10 An Integrated Service Plan 42
10.1 Introduction 42
10.2 Bus Service Network 42
10.3 Rail Services 45
10.4 Taxis and Hackneys 47
11 Integration and Accessibility 48
11.1 Leap card 48
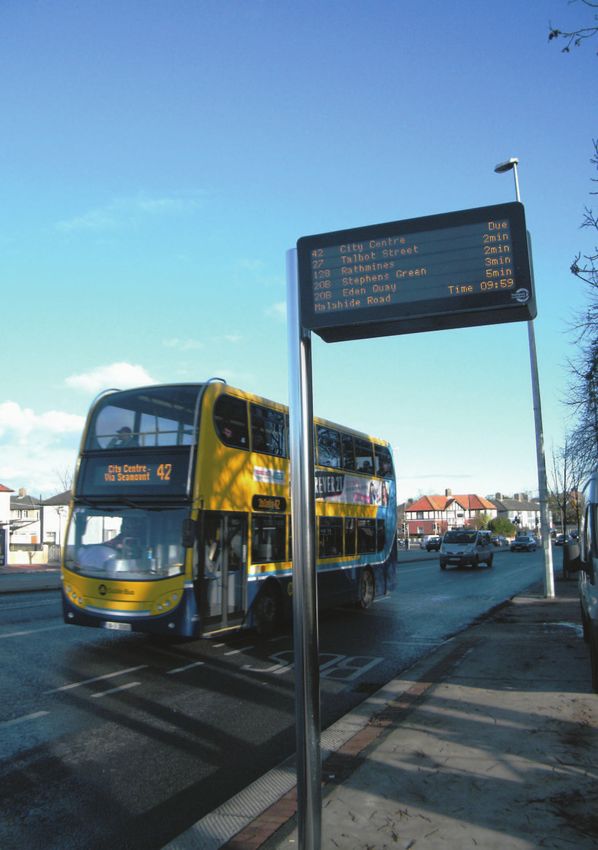
11.2 Real Time Passenger Information 49
11.3 Journey Planning 49
11.4 Fares 49
11.5 Optimising Interchange 50
11.6 Public Transport Brand 50
11.7 Accessibility 51
12 Integration of Land Use and Transport 54
12.1 Background 54
12.2 Need for Land Use and Transport Integration 54
12.3 Key Principles for the Integration of Land Use and Transport 55
12.4 Summary 56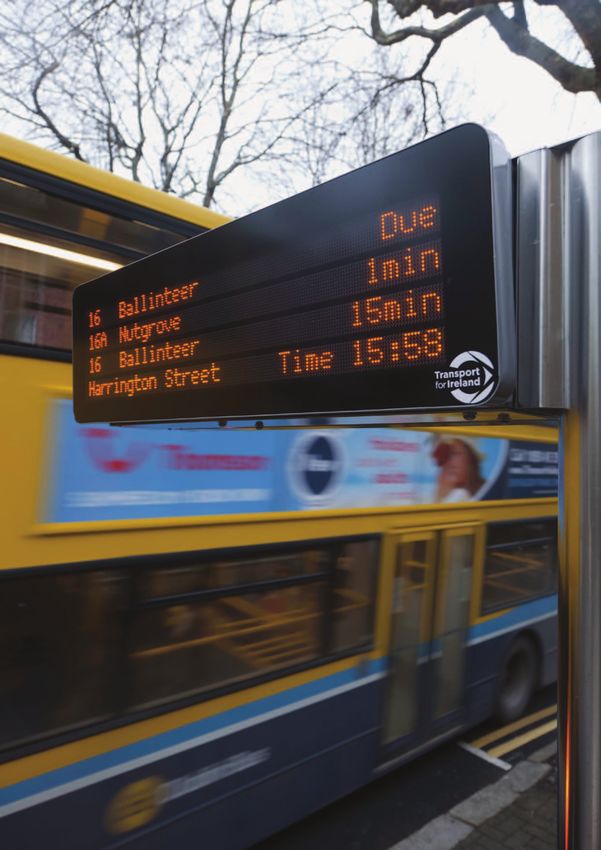
4   National Transport Authority

    1. Introduction and Background
    1.1 Introduction                                         Within the Greater Dublin Area (GDA) the Authority
                                                             carries additional responsibilities including:
    The National Transport Authority (the “Authority”)
    is a statutory body established by the Minister for      cc   strategic planning of transport;
    Transport on 1 December 2009.                            cc   development of an integrated, accessible public
                                                                  transport network;
    The Authority was set up under the Dublin
    Transport Authority Act 2008. Its roles and functions    cc   promoting cycling and walking;
    are set out in that Act, the Public Transport            cc   provision of public transport infrastructure
    Regulation Act 2009 and, also, the Taxi Regulation            generally including light rail, metro and heavy
    Act 2003.                                                     rail; and
    At national level, the Authority has responsibility      cc   effective management of traffic and transport
    for securing the provision of public passenger land           demand.
    transport services. This includes the provision of
                                                             The GDA includes the local authority areas of Dublin
    subsidised bus and rail services through contracts
                                                             City, Fingal, Dun Laoghaire-Rathdown, South Dublin,
    with Bus Éireann, Dublin Bus and Irish Rail, and light
                                                             Kildare, Meath and Wicklow.
    rail services directly itself or through assignment to
    the RPA. The Authority has national responsibility       On behalf of the Department of Transport, Tourism
    for the State’s rural transport programme and also       and Sport, the Authority also manages the following
    licenses public bus passenger services delivered         programmes:
    by private operators. Regulation of the national
    taxi industry falls also to the Authority. Other         cc   Regional Cities Public Transport Programme;
    areas of national responsibility include integrated      cc   Accessibility Programme;
    information systems for public transport customers
                                                             cc   Smarter Workplaces and Smarter Travel Campus
    and management of the Integrated Ticketing
                                                                  travel programme;
    Scheme for Ireland (the Leap Card system). Allied
    with these national functions, the Authority is the      cc   Green Schools travel programme; and
    enforcement body for passenger rights in relation to     cc   Initiatives to integrate rural, health and school
    rail, buses and coaches, and ferries.                         transport services.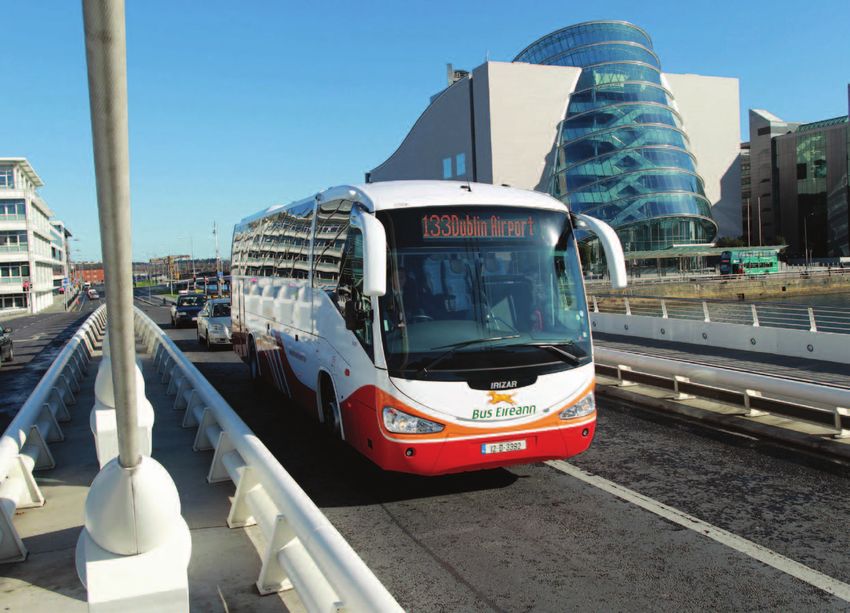
Integrated Implementation Plan Draft - Introduction                                                             5

1.2 Content of an Implementation Plan                   1.3 Plan Process
The Authority is required to prepare an integrated      The following process is outlined in the Act for the
implementation plan (the “Plan”) in accordance          preparation of a Plan:
with Section 13 of the Dublin Transport Authority
                                                        cc   Taking direction from the Minister, the Plan
Act 2008 (the “Act”). This Plan is required to
                                                             should have regard to any proposals received
comprise the following:
                                                             from public transport authorities and operators
cc   an infrastructure investment programme,                 and the need to ensure the most beneficial,
     identifying the key objectives and outputs to be        effective and efficient use of Exchequer
     pursued by the Authority over the period of the         resources;
     Plan;
                                                        cc   The Authority is required to have regard to
cc   the actions to be taken by the Authority to             written guidance on multi-annual funding from
     ensure the effective integration of public              the Minister;
     transport infrastructure over the period of the
                                                        cc   During the preparation of the integrated
     Plan;
                                                             implementation plan, the Authority is required
cc   an integrated service plan, identifying the key         to consult with and consider the views of
     objectives and outputs to be pursued by the             stakeholders and invite public submissions on
     Authority in relation to the procurement of             the Plan; and
     public passenger transport services over the
                                                        cc   The Authority is required to submit a draft Plan
     period of the Plan;
                                                             to the Minister for approval. The Minister may
cc   the actions to be taken by the Authority to             approve the draft, approve with modifications,
     ensure the effective integration of public              require resubmission in a modified form or
     passenger transport services over the period of         refuse to approve it.
     the Plan; and
cc   such other matters as the Authority considers
     appropriate or as may be prescribed by the
     Minister for Transport, Tourism and Sport (the
     “Minister”).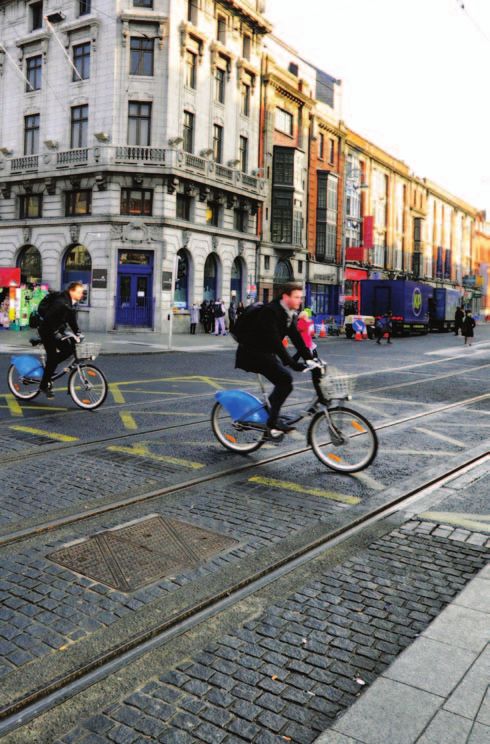
6   National Transport Authority

    2 Travel in the Greater Dublin Area
    2.1      Greater Dublin Area                           Table 1 - Changes in population by GDA
                                                           County and nationally since 2006
    The Greater Dublin Area (GDA) comprises the
    counties of Meath, Wicklow, Kildare, South Dublin,     County                  2006            2011    % Change

    Dun Laoghaire Rathdown, Fingal and Dublin City.        Dublin City            506,211        527,612        4%

    National strategic policy on land use, settlement,     South Dublin           246,941        265,205        7%
    economic development and sustainability over           Fingal                 239,995        273,991       14%
    the past decade or more, has consistently
                                                           DLR                    194,039        206,261        6%
    identified the GDA as a driver of national economic
    development. This is even more relevant in the         Kildare                186,336        210,312       13%
    context of the current challenging financial and       Meath                  162,831        184,135       13%
    economic circumstances and the capacity of the
                                                           Wicklow                126,194        136,640        8%
    GDA’s economy to adapt and develop will be crucial
    to restoring Ireland’s economic wellbeing in the       GDA               1,662,547      1,804,156           9%
    coming years.                                          State             4,239,848      4,588,252           8%

    2.2 Population                                         Table 1 shows that the growth in population was
                                                           far from uniform within the GDA, with the largest
    Between 2006 and 2011, the population of the           growth shown in Fingal (14%), and Kildare and Meath
    Greater Dublin Area grew by 9% from 1.66 million       (13%). In contrast, the population of Dublin City grew
    to 1.8 million, as compared to a slight lower growth   by a more modest 4% between the 2006 and 2011
    rate of 8% for the State as a whole. The GDA can be    census. This represents a continuation of a longer
    broken down by constituent county, as set down in      term trend, where the highest rates of population
    Table 1.                                               growth have been progressively cascading outwards
                                                           from Dublin, reflecting the dispersal of City Region
                                                           population growth across an extending commuter
                                                           belt.

                                                           The distribution of population is a critical
                                                           determinant of travel behaviour. In particular, the
                                                           location of population relative to key services such
                                                           as work, education, retail and leisure determines
                                                           the demand for travel and distances travelled. In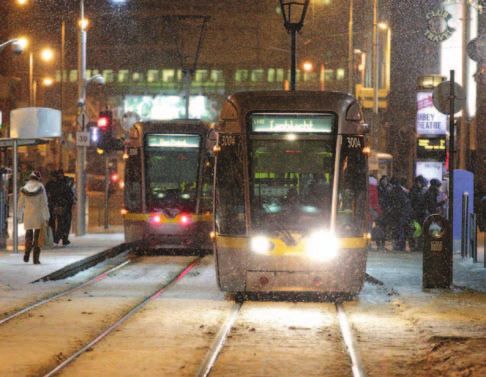
Integrated Implementation Plan Draft - Greater Dublin Area                                                               7

turn this has a critical impact on people’s choice                people travel to work. Census 2006 was undertaken
of mode - i.e. the more remote people live from                   as Ireland was coming to the end of a long period of
public transport and destinations served by public                sustained economic growth, while the 2011 census
transport the more likely they are to drive.                      is the first census in over 15 years to have been
                                                                  undertaken in the midst of an economic downturn.
Even within the more localised area of Dublin City
and suburbs, substantial changes in the distribution              The changes in the number of jobs and the
of population occurred between 2006 and 2011.                     distribution of employment between the two
Whilst the highest rates of population growth                     census years is an important indicator of both the
in Dublin has occurred in the northern fringe of                  impacts of the economic downturn and of land
the Metropolitan Area and in the Docklands and                    use planning policies relating to the location of
Heuston areas, population declines were recorded                  employment. One important feature of this has
across many of the more mature suburban areas                     been the substantial increase in employment in
and parts of the Inner City. This pattern broadly                 certain suburban located industrial estates and
reflects the ‘empty nest’ scenario and associated                 office parks in the Dublin Metropolitan Area. In
declining household size, characteristic of many                  particular, these relate to lands beyond the M50 to
older residential areas.                                          the north west of the city, between the Ballymun/
                                                                  St Margaret’s Road and the Ballycoolin area; the
2.3 Employment                                                    Maynooth and Swords areas; the Sandyford/
                                                                  Cherrywood areas; and lands to the north of the
The numbers of people in employment has a strong                  N7. Within the inner city, substantial employment
bearing the number of trips generated, particularly               growth occurred in the Docklands and Heuston
during the peak demand periods in the morning                     areas. The largest declines occurred in the Leixlip
and evening. Between 2006 and 2011, the number                    and Parkwest areas and a number of locations in the
of persons in employment in the Greater Dublin                    south eastern quadrant of the inner city.
Area declined by 6% from 800,000 to 754,000. A
comparable level of decline occurred in the State                 These patterns are described on the basis of trips
as a whole (6%). The GDA can be broken down by                    to work data from POWCAR 2006 and POWSCAR
constituent county, as set down in Table 2:                       2011, derived from Census 2006 and Census
                                                                  2011. (POWCAR means “Place of Work - Census of
Table 2 - Changes in number of persons in                         Anonymised Records” and POWSCAR means “Place
employment by GDA County and nationally                           of Work, School or College - Census of Anonymised
since 2006                                                        Records”). POWCAR and POWSCAR illustrate the
                                                                  changes in employment destinations within each ED
 County                     2006              2011     % Change   in Dublin City / environs between 2006 and 2011.
 Dublin City              245,007        227,429           -7%    It should be noted however, that this data excludes
 South Dublin             119,280        106,534          -11%
                                                                  mobile employment where work destinations are
                                                                  variable and hence not included in either dataset.
 Fingal                   120,794        119,276           -1%
                                                                  In summary, an examination of the changes in
 DLR                        87,815            87,490        0%
                                                                  employment destination in this area illustrates the
 Kildare                    91,581            85,587       -7%    increasing trend of suburbanisation of employment
 Meath                      78,437            74,342       -5%    in the main urban centres. While employment
                                                                  has dropped in many areas of the city, Sandyford,
 Wicklow                    57,326            52,907       -8%
                                                                  Cherrywood and Blanchardstown all emerge as
 GDA                   800,240           753,565           -6%    significant employment growth areas for Dublin in
 State               1,930,042         1,807,360           -6%    the period 2006-2011. Some central areas such as
                                                                  Docklands, Heuston and some locations in the South
The distribution of people’s places of employment                 East Inner City have also shown job growth.
is also an important determinant of travel patterns -
particularly in the morning peak period when most
8   National Transport Authority

    2.4 Means of Travel                                      Car as the dominant mode
    While the distribution of population and                 Analysis of means of travel to work from Census
    employment are critical determinants of overall          data going back to 1996 shows a growing reliance
    travel demand, the means of travel people choose is      on the private car. However, this overall trend masks
    an important measure of travel behaviour. Means of       significant spatial variations in this trend that are
    travel is affected by a number of factors, including     revealed in analysing the mode share for car at an
    the location of development, general economic            Electoral Division level.
    conditions, availability of public transport, changes    In regards to the percentage of people driving
    in fuel costs and public transport fares and other       to work by origin, data from the 2011 Census
    transport policy interventions. An analysis of the       shows that in the GDA, the highest levels of car
    means of travel to work and education in the 2011        dependency apply around the outer edge of the
    Census and comparison with equivalent data from          Metropolitan area and in peri-urban and semi-
    earlier census years gives a good indication of the      rural fringes where more than 7 in 10 people drive
    impacts of the recent economic downturn and other        to work. This is in contrast to the situation in the
    factors on people’s travel behaviour.                    commercial core of the city where less than one in
                                                             4 people drive to work. Car dependency levels are
    Means of travel to Work                                  also lower in areas where agriculture plays a greater
    Tables 3 and 4 below, shows the change in trips by       role in the local economy.
    mode and mode share percentages between 2006
    and 2011 for people travelling to work, nationally
    and in the GDA.

    Tables 3 and 4 show an increase in mode share for
    car and bicycle and reductions in walking and travel
    by bus. Against a background of a general decrease
    in trips to work of 6% in the GDA and 7% nationally,
    the only mode to increase in absolute terms was
    cycling. There was an increase of 23% in cycling
    trips to work in the GDA and an increase of 10%
    nationally. Further analysis of cycling reveals that
    there was a 40% increase in cycling trips within the
    city centre of Dublin (within the canals) between
    2006 and 2011. This increase in cycling has been
    influenced by a number of factors in recent years,
    including the increases in fuel costs and in public
    transport fares and investment in cycle networks
    in urban centres. The success of the Dublin bikes
    scheme also appears to have had a major impact
    on attitudes to cycling - particularly in Dublin city
    centre.

    Of note are the trends in mode share for car drivers
    and car passengers. While the mode share for car as
    driver has increased nationally and in the GDA, the
    mode share for car as passenger has declined. This
    reflects a general decline in car occupancy levels for
    trips to work, with the occupancy level in 2011 close
    to 1. There was a decline in the mode shares of both
    walking and bus nationally and in the GDA.
Integrated Implementation Plan Draft - Greater Dublin Area 9 Table 3 - % Mode Share comparison for trips to work, nationally, 2006 and 2011 Persons travelling to 2006 2011 Change in % Change work by mode nationally Trips % Mode Share Trips % Mode Share Mode Share in Trips On foot 205,688 11.7% 170,510 10.5% -1.2% -17% Bicycle 36,306 2.1% 39,803 2.4% 0.4% 10% Bus, minibus or coach 114,956 6.5% 91,676 5.6% -0.9% -20% Train, DART or LUAS 54,942 3.1% 52,749 3.2% 0.1% -4% Motorcycle or scooter 13,049 0.7% 8,443 0.5% -0.2% -35% Motor car: Driver 1,080,446 61.5% 1,067,451 65.5% 4.0% -1% Motor car: Passenger 104,861 6.0% 69,164 4.2% -1.7% -34% Other , incl. lorry 147,035 8.4% 131,018 8.0% -0.3% -11% Total 1,757,283 100% 1,630,814 100% 0% -7% Table 4 - % Mode Share comparison for trips to work in the GDA, 2006 and 2011 Persons travelling to work 2006 2011 Change in % Change by mode in the GDA Trips % Mode Share Trips % Mode Share Mode Share in Trips On foot 90,423 12.2% 81,886 11.8% -0.5% -9% Bicycle 23,282 3.2% 28,544 4.1% 0.9% 23% Bus, minibus or coach 88,573 12.0% 73,956 10.6% -1.4% -17% Train, DART or LUAS 49,471 6.7% 47,922 6.9% 0.2% -3% Motorcycle or scooter 8,386 1.1% 5,831 0.8% -0.3% -30% Motor car: Driver 406,327 55.0% 399,381 57.3% 2.3% -2% Motor car: Passenger 32,929 4.5% 24,107 3.5% -1.0% -27% Other , incl. lorry 39,463 5.3% 34,843 5.0% -0.3% -12% Total 738,854 100% 696,470 100% 0% -6%
10 National Transport Authority

     Means of travel to Education                                and with a reduction also, in the percentage of
                                                                 journeys taking between 45 minutes and 1 hour.
     Tables 5 and 6 show the mode share comparison
                                                                 These trends may reflect the on-going effects of
     for trips to education in the GDA and nationally.
                                                                 dispersed residential development on journey to
     These show a reduction in mode share for walking
                                                                 work distances (as reflected in journey times), but
     and bus, in contrast to increases in mode share for
                                                                 with the counter-balancing effects of reductions in
     car, both as driver and as passenger. The increase in
                                                                 congestion levels.
     cycling trips that was evident for work trips is also
     evident for trips to education.
                                                                 Figure 1 - Comparison of journey times,
     It should be noted that in contrast to the overall          National vs GDA, 2011
     reduction in trips to work, the opposite trend is evident
     with regard to trips to education between 2006 and          40%
                                                                                             National          GDA
     2011 - with a 14% increase in the GDA and 13%,              35%
     nationally. The increased numbers of people in full         30%
     time education is most evident in the Primary and
                                                                 25%
     Tertiary sectors - with a 29% increase in third level
     students nationally, between 2006 and 2011. Hence,          20%
     the increases in overall population and in the pupil        15%
     / student population in particular, have served to          10%
     largely counter balance (nationally) and more than
                                                                  5%
     counter balance (in the GDA) the impact of reduced
     employment on overall levels of travel demand in the         0%
                                                                       < 15 min 15-30min 30-45min 45-60min > 60min
     past 5 years.

     2.5 Journey time
     The economic boom between the mid 1990’s and                Figure 2 - Comparison of journey times in
     2006 had the characteristic impact of increasing            the GDA - 2006 and 2011
     overall travel demand and traffic congestion levels
     - in particular in urban areas. This in turn had an         40%
                                                                                             2006              2011
     impact on journey times to work in particular. An           35%
     analysis of journey to work times from Census 2011          30%
     is useful to reveal if the trend up to 2006 has been
                                                                 25%
     halted or reversed in response to the economic
     downturn.                                                   20%
                                                                 15%
     Figure 1 gives the profile of journey times for people
     travelling to work in the GDA and nationally for            10%

     2011. 51% of all trips to work in the GDA take 30            5%
     minutes or less as against over 70%, nationally.             0%
     Eleven per cent of trips to work in the GDA take                  < 15 min 15-30min 30-45min 45-60min > 60min
     longer than an hour. The biggest differences
     between the GDA and national level occur between
     the trips under 15 minutes (19% vs. 33%) and trips
     between 30 and 45 minutes (9% vs. 27%).

     Figure 2 compares journey times to work between
     2006 and 2011, which shows an increase in the
     percentage of trip taking between 15 and 30
     minutes and between 30 and 45 minutes. The
     greatest reduction relates to trips in excess of 1 hour
Integrated Implementation Plan Draft - Greater Dublin Area 11
Table 5 - % Mode Share comparison for trips to education, nationally 2006 and 2011
Persons travelling to 2006 2011 Change in % Change
education by mode Mode Share in Trips
nationally Trips % Mode Share Trips % Mode Share
On foot 227,422 26.1% 244,428 24.8% -1.3% 7%
Bicycle 17,654 2.0% 21,374 2.2% 0.1% 21%
Bus, minibus or coach 211,993 24.4% 196,886 20.0% -4.3% -7%
Train, DART or LUAS 16,716 1.9% 18,227 1.9% -0.1% 9%
Motorcycle or scooter 1,289 0.1% 869 0.1% -0.1% -33%
Motor car: Driver 37,866 4.4% 59,945 6.1% 1.7% 58%
Motor car: Passenger 354,636 40.7% 439,174 44.6% 3.9% 24%
Other , incl. lorry 2,893 0.3% 3,097 0.3% 0.0% 7%
Total 870,469 100% 984,000 100% 0% 13%
Table 6 - % Mode Share comparison for trips to education in the GDA 2006 and 2011
Persons travelling to 2006 2011 Change in % Change
education by mode in Mode Share in Trips
Trips % Mode Share Trips % Mode Share
the GDA
On foot 113,591 34.4% 123,943 32.9% -1.5% 9%
Bicycle 11,196 3.4% 14,198 3.8% 0.4% 27%
Bus, minibus or coach 70,326 21.3% 70,272 18.7% -2.6% 0%
Train, DART or LUAS 14,332 4.3% 15,293 4.1% -0.3% 7%
Motorcycle or scooter 636 0.2% 435 0.1% -0.1% -32%
Motor car: Driver 12,104 3.7% 18,423 4.9% 1.2% 52%
Motor car: Passenger 106,934 32.4% 133,048 35.4% 2.9% 24%
Other , incl. lorry 763 0.2% 684 0.2% 0.0% -10%
Total 329,882 100% 376,296 100% 0% 14%12 National Transport Authority
2.6 Departure time Figure 4 - Profile of departure times for
trips to work in the GDA - 2006 and 2011
Increased traffic congestion during the economic
boom years made for longer journey times and
2006 2011
caused commuters in the GDA and nationally to 20%
depart earlier, to be more certain of arriving on 18%
time for work. The phenomenon of peak spreading 16%
was particularly evident in the GDA as revealed by 14%
comparison of travel to work departure times in the 12%
2002 and 2006 census years. Analysis of departure 10%
times for travel to work form Census 2011 is useful 8%
to reveal if the trends in peak spreading have 6%
altered or reversed in the past five years. 4%
2%
Figure 3 gives the profile of departure times for
journeys to work and compares the national profile 0%
Before 6:30 to 7:00 to 7:30 to 8:00 to 8:30 to 9:00 to After
6:30 7:00 7:30 8:00 8:30 9:00 9:30 9:30
with the equivalent profile in the GDA. The profiles
are very similar, with a greater percentage of GDA
commuters leaving for work before 7:30 than is 2.7 Car ownership
the case nationally. One third of GDA commuters
leave for work before 7:30 in the morning, whereas Levels of car ownership have a critical impact on
nationally this percentage is 28%. people’s travel behaviour - in particular on the
number of trips they will make and the means of
Figure 4 compares the departure time profile of travel they will choose. The economic boom in
trips to work in the GDA for 2011 and 2006. This Ireland led to huge increases in car ownership to
comparison shows that the reduction in congestion levels that are now on a par with many of our EU
levels means that fewer commuters are now partners, a trend that was also reflected in the GDA.
departing for work before 7:30 (32% in 2011 as There are, however, significant spatial variations
against 36% in 2006), while more are departing in this trend, with relatively low levels of car
for work after 8:00 (50% in 2011 as against 45% in ownership in central Dublin in particular. This is in
2006). In summary, the AM peak within the GDA has contrast to car ownership levels of over 500 cars per
contracted over the last 5 years. 1,000 population in many counties, and particularly
high levels of ownership in counties within the
Figure 3 - Profile of departure times for commuting catchment of the GDA.
trips to work, Nationally vs GDA, 2011
Of particular interest in analysis of the 2011 Census
National GDA is to determine whether or not the economic
20% downturn has impacted on the general trend of
18% growth in car ownership up to 2006. Rather than
16% comparing the 2011 data with 2006, it is more
14% instructive to examine trends in car ownership since
12% 1991. Figure 5 shows the trends in car ownership in
10% the GDA counties since 1991 and compares the GDA
8% trend with the trend nationally. The car ownership
6% figures are presented as total cars and vans (owned
4% for private use) per 1,000 of population.
2%
0%
Before 6:30 to 7:00 to 7:30 to 8:00 to 8:30 to 9:00 to After
6:30 7:00 7:30 8:00 8:30 9:00 9:30 9:30Integrated Implementation Plan Draft - Greater Dublin Area 13
Figure 5 - Car ownership trends in GDA counties compared with the national trend
550
450
Cars per 1,000 persons
350
Dublin City
South Dublin
Fingal
250
DLR
Kildare
Meath
Wicklow
GDA
State
550
1991 1996 2001 2011
Year
Figure 5 shows the characteristic historic trend in between the mid 1990’s and 2000 is clearly evident
car ownership (i.e. S-Curve) for all GDA counties in the car ownership trends. It is also clear that
and nationally. Within the GDA, Meath has the despite the economic downturn since 1996, car
highest levels of car ownership with rates that are ownership levels have continued to rise and are
well ahead of the national average. However it is only levelling off where they are reaching saturation
clear from the graph that levels of car ownership in levels. The increases in car ownership despite
Meath are now approaching saturation levels (i.e. recent economic conditions may also be indicative
where every person legally entitled to drive owns of the reduced cost of owning a car in Ireland - in
a car), and the period 2006 to 2011 showed only particular the cost of second hand cars that has
a small increase in ownership levels in this county. fallen significantly over the past 5 years.
Though levels of car ownership in Dublin City are
much lower than in any other part of the country,
there was a significant jump in ownership between
2006 and 2011. The impact of the economic boom14 National Transport Authority Dublin Public
2.8 Summary and Main Conclusions
Some of the main findings from Census 2011 travel A
datasets, pertaining to the GDA are as follows:
cc The economic downturn and the corresponding
reduction in employment has resulted in a
reduction ( 6%) in the numbers of people in
employment in the GDA, between 2006 and
2011; 1 4
cc In contrast to the drop in trips to work, there
have been significant increases in trips to
education in the GDA (14%);
COMMUTER Hartstown
M3 Parkway
cc In the case of both trips to work and education, 39a
Ongar Castaheany
Charnwood
Dunboyne
there have been reductions in mode share for COMMUTER
continues to Allendale
Hansfield
walking and travel by bus and increases in the the North West
Leixlip (Louisa Bridge) Clonsilla
Maynooth Leixlip (Confey)
mode share for car and cycling. For travel to
work, cycling has been the only mode to show
an increase in absolute terms. This increase has
been particularly significant (40% increase) in
Dublin city centre;
2
cc The economic downturn and corresponding Ballyowen
Lucan
reduction in employment and journey to work (Liffey V
has had the effect of reducing congestion 25a Esker Ballydowd Qu
Lucan (Esker Church) Meadow Manor (Liffe
levels in the GDA, and this has led in turn to a 25a 25a
reduction in travel times and a contraction of the Finnstown Finnstown Griffeen Foxborough Fonthill Roa
Abbey Avenue 151
morning peak; and Hazelhatch
and Celbridge 25b
Adamstown Station
cc Between 2006 and 2011, car ownership COMMUTER
continues to Sallins,
(Commuter X)
Kishoge
Clondalkin
Fonthill
rates showed another increase despite the Newbridge, Kildare
and the South West Lock View
economic downturn, but some counties are now Grange
Castle
Grange Castle (West) New Nangor Ro
approaching saturation levels and these counties 13
Castlegrange
have shown only a small increase in ownership St John’s
Clon
levels since 2006. 3 Corkagh
Vil
Demesne
Bel
Fettercairn
Cheeverstown
Citywest Campus
77a
Jobst
Fortunestown (Nort
Saggart 27
Blessington
Road
4
ATransport Frequent Services
B C D E
Seatown
SWORDS COMMUTER continues to the North
Swords Manor
41 S Main Street
DART Malahide
Swords (Pavilions)
Ward River
Valley Park
Fosterstown (Boroimhe) Portmarnock
4 13 83
Balseskin X Harristown (83 X) Dublin 15
Airport Clongriffin
Airport Roundabout 27
Ballymun Cross 747 Clare Hall Abbey 29a
XMeakstown 16 Park Baldoyle
Charlestown Popintree Dardistown
Tyrrelstown A Kilmore
40d Balbutcher Bayside
Finglas (Northside)
IKEA Darndale Grange
Ballycoolin Plunkett Sutton
9 140 Santry Bonnybrook Road
Finglas East Ballymun (Newgrove
Rosemount Ellenfield
Business Park Finglas West Centre Beaumont Cross) 17a
Park
Hospital Howth Junction
14 Donaghmede & Donaghmede
Cappagh Finglas
Huntstown Corduff Village Wadelai Park Beaumont
Finglas South Ballymun (DCU) Whitehall Edenmore
Finglas 40d 40 11 Coolock
Blakestown Kilbarrack
17a Tolka Estate Glasnevin (Mobhi) Collins Avenue
BLANCHARDSTOWN CENTRE 40 Raheny
Botanic Gardens Donnycarney
Royal St Patrick’s Harmonstown
Canal Park Finglas Glasnevin Cemetery Fairview 123
Navan Road Road Drumcondra (North) Marino
Ashtown All Saint’s
Castleknock Parkway Station 120 Broombridge (Commuter X) Road St Anne’s Park
Ballybough and Gardens
Coolmine Killester
Station Fassaugh Fairview
122
Ashtown Ashington Cabra Road 7 North
(Fassaugh Strand Clontarf Dollymount
Mountjoy Road 130
Avenue) Square
Phibsboro Mater Castle Avenue
Navan Road Mater
Old Cabra Road Clontarf
4 9
83 46a 120 123
Phoenix Park Prussia Street 140
4 9 140 7 Dubli
Stoneybatter 123
14 15 27
Harbo
29a 130
39a 4 7 9 11 13 16 40 40d 41 747
41 46a 120 122 140 151
46a Parnell St Connolly COMMUTER
18 Parnell Square
Phoenix Park 40d 120 Docklands X
Palmerstown (Infirmary Road 83
4 7 9 11 13 16 40 151
40d 46a 120 122 140
Road and Zoo) 29a 130
O’Connell Street
Valley) Blackhall 4 7 9 11 13 16 40 41 29a 41 130
Cherry Orchard Place Four 46a 122 123 140 747 A Lwr Abbey St George’s Mayor Spencer The Point
41 Busáras
Hospital Ballyfermot Museum Courts Jervis Dock Square Dock
uarryvale Smithfield 25a 25b 39a 79 83 Abbey St 15a 15b 151 747
ey Valley) Kilmainham
Coldcut 25a 25b 39a 145 151 747 14 15 27 79 151 S 15a 15b Dublin Port
40 Le Fanu 79 145 747 151 151 14 15 North Wall
83 25a 25b 39a 27 79
Park 79 83 145 747 14 15 27 79 151 151
ad Ronanstown 15a 15b
Cherry 145 747
25a 25b 39a
D’Olier/Westmoreland 150 15a Tara Street 15a Grand Canal Dock
79 145 747 15b 15b
Orchard 4 7 9 11 13 14 15
Heuston 15a 15b 16 25a 25b 4 7 15a 15b 77a 4 7 15a 15b 77a 77a
79a 27 39a 40 46a 77a 83
Ringsend Road
James’s 151 122 123 140 145 150 4 7 11 14 15 Pearse 4 7
Parkwest 151 A Trinity 77a
13 40 123 Christchurch 15a 15b 25a 25b
& Cherry 39a 46a 140 145
Orchard Inchicore Thomas 13 40 123 13 27 40 77a Grand Canal
Street 123 150 151 Dock Station 18
11 14 15 15a 25a
25a Sandymount
15b 25a 25b 39a 25b Merrion Square Lansdowne
Kylemore Bluebell Suir Fatima 46a 140 145
25b 39a
Road
Drimnagh Road St Stephen’s 4 7 Dublin
27 77a 9 16
Green
39a Bay
oad Nangor Road Blackhorse Rialto 150 151 83 122 11 46a 145
Goldenbridge Tram Sandymount Station
Longmile Stop Ballsbridge
Woodford Red Cow Sydney Parade
Crumlin Baggot
ndalkin 122 Hospital Dolphin’s Street
llage Drimnagh Castle Barn Leeson Street Merrion
The Coombe Booterstown
Kingswood Camden Harcourt
123 Street Vincent’s
Walkinstown Coombe Herbert Hospital Blackrock
lgard Hospital South Park
Walkinstown Cross Donore Circular
Donnybrook Seapoint
Greenhills
Crumlin Clogher Road Harold’s Cross Portobello Stradbrook
Cookstown Broomhill Ashleaf Appian Way Salthill & Monkst
Industrial Estate 39a Monkstown Avenue 4
Armagh Road Rathmines Charlemont
Tallaght Monkstown DÚN LAOG
Crumlin Sundrive
Hospital Village Tymon Belfield (UCD) 46a
(South)
North Limekiln 9 Kenilworth
Whitehall Kimmage Ranelagh
Avenue 15a Mounttown
Road West 83
TALLAGHT Kill Of The San
Beechwood Grange & Gl
Sandford Road
Kimmage Stillorgan
town Tymon Palmerston Cowper (Shopping Centre)
th) Wellington Lane
Park Park Clonskeagh Deansgrange Glen
140
Killinarden Sallynoggin
Rathgar Miltown
Jobstown Terenure Roebuck
15a Comelscourt
(South) Dalk
Rossmore Windy Rochestown
Orwell Road Arbour Avenue
150 Goatstown
14
DUNDRUM
Templeogue 15b Leopardstown Killin
Churchtown Kilmacud East Racecourse Loughlinstown
Knocklyon Bushy Balally Stillorgan XCherrywood
Park Ballyogan
Rathfarnham (Luas) Central Park The Gallops Wood Laughanstown
15 Kilmacud 7
Sha
Ballycullen Sandyford Glencairn Leopardstown Carrickmines
Valley Cherrywood
Stillorgan Industrial Park
Butterfield Marley Grange Tram Stop
Ballycullen Road Sandyford Bride’s Glen
16 BRA
15 Oldorchard 15b Industrial Estate 11
15b
Brehonfield
Stocking Avenue Marlay Road
Boden Park Kilmacanogue DAR
Park 145 Grey
COMMUTER
continues to
the South East
B C D E16 National Transport Authority
3 Transport Challenges and Objectives
3.1 Transport and the Economy improvements to minimise road congestion,
maximise the use of public transport services
The economic wellbeing of the GDA is of vital and facilitate a greater uptake of walking and
importance to the wider Irish economy. A cycling;
significant proportion of population, employment
cc how to encourage some of those using the
and retail growth in the GDA in the last decade
network at busy times to use more appropriate
has taken place away from high capacity, public
means of travel or to travel at less congested
transport network. As a result, a large share of the
times;
associated growth in travel has been by car. This, in
combination with increased car ownership and use, cc how to free up road space for economically
has led to a substantial increase in road congestion essential traffic by further increasing the share of
in much of the GDA when compared with prior travel by means other than the car, particularly
years. to the city centre and other employment centres;
and
Recent public transport improvements, major
road construction and investment in cycle and cc how to target public transport improvements to
pedestrian facilities, in combination with the areas where access is currently poor, increasing
economic downturn, has temporarily alleviated the amount of people that can access jobs
congestion in the Greater Dublin Area. However, as in Dublin city centre and other employment
economic activity and employment increase, it is centres.
inevitable that, in the absence of targeted transport
infrastructural investment, traffic conditions can be 3.2 Public Transport and Society
expected to deteriorate throughout much of the Public transport brings a range of economic, social
Dublin region. This would have serious implications and environmental benefits. A number of these are
for businesses and the wider GDA economy. outlined below at broad level:
General transport challenges include: First it brings economic benefits by reducing
cc how to appropriately allocate financial resources congestion, offering affordable mobility and freeing
to achieve economically efficient solutions in the resources for use in other productive activities. The
transport area; benefits associated with reduced congestion can
be substantial. Evidence from the UK suggests that
cc how to lock in the economic benefits of new
buses carry more than a quarter of all motorised
transport infrastructure;
trips into city centres in most large cities (Abrantes,
cc the identification and delivery of network P, R Fuller and J Bray (2013) The Case for UrbanIntegrated Implementation Plan Draft - Transport Challenges and Objectives 17
Bus). If all, or even half, those bus trips were instead to understand, encouraging new users and
made by car, congestion in city centres would be improving the experience of existing customers,
increased significantly with subsequent impacts on through simplifying fares and ticketing and
productivity and competitiveness. In turn this would improving access to travel information;
also give rise to an increased cost of doing business.
cc how to make the public transport network easier
A systemic delay in getting goods to market would
to use;
result in increased costs for business, which
would likely have an impact on final prices paid by cc how to improve safety, and perceptions of safety,
consumers. for those who walk and cycle; and
Second, it brings social benefits by facilitating cc how to encourage walking and cycling, including
mobility, offering affordable alternatives to lower for leisure and recreational purposes, which can
income groups and other vulnerable cohorts. contribute to the health and wellbeing of GDA
Vulnerable and socially disadvantaged groups are residents.
most reliant on bus networks. In this sense public
transport plays an important role in tackling social
3.3 Transport and the Environment
isolation and promoting independent living. The environmental challenges associated with
transport are significant. Overall, Ireland’s
Third, public transport plays a vital role in enabling
greenhouse gas (GHG) emissions in 2010 were 9.3%
economic activity. Public transport aids in the
above 1990 levels (Ireland’s Environment 2012,
functioning of the economy by contributing to
EPA).
more flexible labour markets and enabling other
economic activities such as retail and leisure. Public Environmental challenges include:
transport allows individuals to travel across a wide
geographical area. In doing so it increases the cc how to identify the means to stabilise or reduce
number and range of jobs accessible to workers. transport related GHG emissions and the use of
This can be especially important for low income fossil fuels to power transport in the GDA;
or less skilled workers who are less likely to have cc how to minimise the impact on natural
access to a car and may also qualify for a narrower amenities; and
range of jobs which are more likely to be scattered
cc how to facilitate improvements to air quality,
across a larger area. For employers, public transport
reduce noise pollution and minimise the visual
extends the available labour supply, which can be an
impact of transport.
important element in a firm’s location decision.
Finally, it brings environmental benefits by reducing 3.4 General Objectives
traffic volumes and thereby cutting associated
The general objectives of the integrated
emissions levels. In Ireland alone, emissions from
implementation plan can be categorised under
the transport sector constitute nearly 20 percent
economic, social and environmental headings.
of all greenhouse gas emissions (Environmental
Protection Agency (2013) Ireland’s Greenhouse Gas
3.4.1 Economic Objectives
Inventory 1990 - 2011).
cc Improve travel time and reliability for the
The challenges for public transport in serving movement of people and goods;
society effectively include:
cc Facilitate businesses by the efficient movement
cc how to improve connectivity for those living in of people in the region seeking employment
disadvantaged areas; opportunities;
cc how to ensure that transport facilities are cc Support businesses through the facilitation of
designed to address the needs of mobility the efficient distribution of goods and materials
impaired people and people with disabilities; and servicing of premises;
cc how ensure that public transport is easy cc Appropriately allocate financial resources to18 National Transport Authority
achieve economically efficient sustainable
transport solutions; and
cc Improve access to key regional destinations,
such as the ports, Dublin Airport, hospitals and
colleges.
3.4.2 Social Objectives
cc Enhance accessibility to jobs, schools, shops,
local services, leisure facilities and other
destinations;
cc Enable access across the region to large
educational institutions, in particular third level
colleges;
cc Improve access for all people, including physical
access for mobility impaired people;
cc Improve internal connections between
communities and external links to/from areas
outside the GDA;
cc Provide for an improved quality of public realm
for the movement of people;
cc Improve the quality of travel information and
access to this information;
cc Advance the user-friendliness of the public
transport system including easy transfer across
the various modes and operators; and
cc Improve personal security and more comfortable
travel experience.
3.4.3 Environmental Objectives
cc Reduce the impact of transport on air and
water quality;
cc Reduce transport related greenhouse gas
emissions;
cc Reduce the impact of noise and vibration;
cc Promote energy efficiency and focus on reducing
dependence on non-renewable resources; and
cc Reduce impact on biodiversity and natural
amenities.20 National Transport Authority
4 Scope of the Implementation Plan
4.1 Approach to be pursued by the Authority in relation to the
procurement of public passenger transport services
The earlier sections of this document set out the over the period of the Plan. It addresses bus and rail
background and context to this Plan. The remaining services as well as small public service vehicles.
sections set out the key elements relating to the
infrastructure, service, integration/ accessibility and 4.2.3 Integration and Accessibility
land use aspects of the Plan.
Chapter 11 identifies various measures proposed
The structure of the subsequent sections is set out in relation to the integration of public passenger
below. transport services and the ease and convenience
of use of those services. It deals with integrated
4.2 Structure ticketing, real time passenger information,
journey planning, fares, branding and optimising
4.2.1 Infrastructure Investment Programme interchange. In addition, it sets out proposals in the
area of accessibility and passenger rights.
Chapter 5 sets out the central Infrastructure
Investment Programme. This provides the overall
4.2.4 Integration of Land Use and Transport
funding provision over the six year period of the
Plan. It identifies the four key investment areas, The final chapter of this Plan addresses the
being: relationship between land use and transport
provision and the essential need for an integrated
1. Bus; approach between both. It sets out a number of
2. Light Rail; principles that support that alignment and which
3. Heavy Rail; and reflect a co-ordinated approach between the
4. Integration Measures and Sustainable Transport. planning and delivery of development and the
planning and delivery of supporting transport
The subsequent chapters 6 to 9 detail the
provision.
investment proposals under each of these
respective areas, including identifying key
objectives and outputs, as well as certain measures
for the effective integration of public transport
infrastructure.
4.2.2 Integrated Service Plan
Chapter 10 details the integrated service plan
provisions including the key objectives and outputs22 National Transport Authority
5 Overall Infrastructure Investment Programme
5.1 Introduction While the Government’s “Infrastructure and Capital
Investment 2012 - 2016” sets out investment for the
The Government published its capital programme years to the end of 2016, it is required that this Plan
in November 2011 titled “Infrastructure and will extend to a six year period, to the end of 2018.
Capital Investment 2012 - 2016: Medium Term
Exchequer Framework”. That programme set out In line with the provisions of Section 11 of the
the Government’s capital investment priorities over Dublin Transport Authority Act 2008, guidance has
the five years of the programme. The total public been obtained from the Department of Transport,
transport investment set out in the programme is Tourism and Sport indicating that projected figures
€1,428 million over the period 2012 to 2016. may be used for proposed capital expenditure for
2017 and 2018. While no commitment has been
Under that capital investment framework, the amount given in relation to funding in those later years,
allocated to public transport infrastructure in the the Plan has assumed a similar level of funding for
GDA is €715 million to the end of 2016. Within this those years to that proposed for 2016.
plan there may be yearly adjustments to reflect
Government decisions, particular expenditure
timings and other factors. Arising from such
changes the Authority’s allocation for 2012 was
increased to €130.85 million and its allocation for
2013 is adjusted to €140.6 million.
Public Transport Investment 2012-16 (€ million)
2012 2013 2014 2015 2016 Total
Public Transport Infrastructure - GDA 111 158 150 145 150 715
Public Transport Safety and Development 111 114 120 115 111 571
Public Transport Projects / Accessibility 16 16 15 15 15 77
Smarter Travel 17 15 11 11 11 65
Total 256 304 296 289 287 1,428Integrated Implementation Plan Draft - Overall Infrastructure Investment Programme 23
Accordingly, the Authority has prepared this Plan on the basis of the following funding profile:
2013 2014 2015 2016 2017 2018 Total
Funding (€ m) 140.6 149.2 145 150 150 150 884.8
5.2 Overall Programme Approach 5.3 Environmental considerations
The Infrastructure Investment Programme forms The development of the Plan has been
an integral and central part of the Plan. Over the accompanied by consideration of environmental
six year period of the Plan, close to €900 million issues through, in particular, the Strategic
will be invested in public transport infrastructure Environmental Assessment process and the Habitats
and related cycling/walking infrastructure under Directive Assessment process. That process of
this Plan. A well planned investment framework is environmental assessment will continue through
essential to ensure that the optimal outcomes will the project development stage for individual
be achieved for this investment. schemes forming part of the Plan.
The overall Infrastructure Investment Programme is In delivering the Plan, the Authority will, in
divided into four sub-programmes. These are: collaboration with the relevant agencies, actively
address the protection and enhancement,
1. Bus; where practical, of the natural, built and historic
2. Light Rail; environment associated with these schemes.
3. Heavy Rail; and Projects which are taken forward to development
4. Integration Measures and Sustainable Transport. consent stage will be supported by environmental
The table below indicates the total Infrastructure appraisal, Habitats Directive Assessment and
Investment Programme sub-divided into its Environmental Impact Assessment (EIA) where
constituent sub-programmes. appropriate. All transport projects will be
constructed in accordance with applicable design
Each of these sub-programmes is addressed in turn standards and environmental regulations and
in the following sections, with details provided on mitigation measures in accordance with good
the objectives of the particular sub-programme practice will be incorporated into the design and
and projects intended for delivery under that sub- construction of these schemes.
programme.
The sub-programme amounts in the table above are
subject to adjustments during the period of the Plan
in line with prioritisation and progress of projects.
Sub-Programme 2013 2014 2015 2016 2017 2018
(€m) (€m) (€m) (€m) (€m) (€m)
Bus 43.6 39.0 40.0 39.0 42.0 42.0
Light Rail 27.3 30.2 43.5 75.0 65.0 65.0
Heavy Rail 32.1 41.7 26.0 10.5 15.0 15.0
Integration Measures & Sustainable 37.60 38.3 35.5 25.5 28.0 28.0
Transport
Yearly Totals 140.6 149.2 145 150 150 15024 National Transport Authority
6 Bus Investment
6.1 Background 6.2 Objectives of Bus Investment
Today, the bus already carries 60% of all city-bound The objectives of this sub-programme are to:
public transport trips and is the dominant transport
cc Support the continued use of the bus as the
mode in the Greater Dublin Area (GDA). Dublin Bus
primary public transport mode in the GDA;
currently operates a network catering for c.115
million passenger journeys per annum and Bus cc Invest in the provision of an attractive, modern
Eireann’s network of commuter services in the GDA bus fleet on publicly subsidised routes;
carries c.10 million passengers per annum. There cc Improve bus priority for bus transport to ensure
are also an increasing number of routes and services that the bus has the journey time advantages
operated by the private sector meeting transport that it needs to have it can compete effectively
needs throughout the region. with the private car;
Given the geographic nature of the region and the cc Enhance roadside facilities for bus transport;
low density dispersed development pattern that
cc Develop key interchange locations between
has occurred over recent decades, it is clear that
services and between modes; and
the bus will continue to play this central role in the
expanded market for transport well into the future. cc Further develop the bus mode by introducing
Investment in the development of bus-based public Bus Rapid Transit on appropriate corridors.
transport is, therefore, not just for the short term
but also for the medium and long term. 6.3 Proposed Investment Areas
Various actions and investments are required to The proposals in relation to Bus investment are
improve the attractiveness of the bus system in the encompassed in four investment areas:
GDA. This will require a network-wide approach
cc Bus Fleet Investment;
addressing network and fleet enhancement,
increased bus priority and focusing on customer cc Bus Stop and Shelter Provision;
facilities such as information provision (including cc General Bus Network Improvements; and
Real Time Passenger Information), good quality bus
stop and shelter facilities, optimised service routings cc Bus Rapid Transit Schemes.
and convenient interchange facilities with other The proposals under each of these areas are
transport modes. elaborated on in the following sections.Integrated Implementation Plan Draft - Bus Investment 25
6.4 Bus Fleet be more fully realised as additional buses of
this type are deployed and customers become
6.4.1 Current Status acquainted with entry and exit options;
In terms of bus fleet, while there was significant cc Improved seating in the form of individual
investment in the bus fleet in the early years of seating rather than standard bench type seating;
the last decade, the economic downturn meant cc Better identification of wheelchair space/s;
that investment in fleet renewal was limited in the
cc Improvements in legroom spacing;
latter period of the last decade. As a result, the
age of the Dublin Bus fleet has dis-improved, with cc Straight access stairs to upper deck;
a considerable portion of buses now dating back to
cc Audio announcements and visual displays
the 2000 to 2002 period. In addition to not offering
facilitating next-stop identifications; and
the same level of passenger comfort as more
modern buses, these older vehicles have higher cc Enabling for Wi-Fi provision.
operating and maintenance costs, placing further It is intended that similar specifications will apply
pressures on the limited public service subsidy to future vehicle acquisitions under this Plan,
amounts. with the accessibility features and environmental
The appropriate approach to bus fleet management performance of the vehicle being a key
revolves around a continuous programme of bus consideration also for new fleet.
replacement. An ad hoc approach with some
funding in some years and none in others is simply 6.5 Bus Stops and Shelters
not conductive to the efficient and effective
management of the fleet. 6.5.1 Current Status
Ensuring the quality of the bus vehicles addresses
The desirable maximum age of a standard
one component of the customer experience.
double deck bus operating at optimal use with
Another important component is the level of quality
minimal service disruption is about 14 years,
of roadside provision of bus shelters and bus stops.
with maintenance and running costs increasing
This is currently significantly less than it could be,
significantly after that point. In general, 12 years is a
partially because of limited investment.
better target as manufacturers are prepared to offer
warranties on the bus chassis and certain other The types of deficiencies that currently exist
elements up to a limit of 12 years. include:
6.4.2 Proposal cc Poor standard of many older bus stops -
corroded poles, limited or no information;
Given the importance of the bus fleet quality in
the provision of an attractive public transport cc In rural areas, frequently no hard standing of any
services, it is proposed to invest in a fleet renewal type - bus stops poles set in grass verge;
programme that seeks to ensure that the average cc Poor quality route and fare information at many
bus fleet age for publicly subsidised services does stops;
not exceed 7 years. This will require a continuous
cc Unreliable information on arrivals, pending
level of investment which will allow a consistent
further role out of Real Time Passenger
level of vehicle replacement each year, avoiding
Information signs;
the peaks and troughs that characterised previous
approaches. cc Lack of appropriate footpath connections to
many rural bus stops;
Recent bus fleet investment has seen the
procurement of an enhanced standard of vehicle. cc Lack of bus shelters in locations where they
These improvements have included: should be provided;
cc Second door provision on buses to speed up cc Poor standard of many older bus shelters;
boarding and alighting. The benefits of this will cc Advertising considerations compromising bus26 National Transport Authority
shelter layouts and provision; However, various deficiencies currently exist on
individual sections of that bus network with lane
cc Poor quality of seating in bus shelters in general;
constraints at individual locations causing significant
cc Lack of bus-bays or indentations to facilitate delays to bus movement. This compromises the
other vehicles passing the stopping bus; performance of the bus system, reducing bus
cc Lack of stop sharing between operators; speeds and precluding reliable journey times, which
is a vital component of a public transport system.
cc Lack of conformity in bus stop infrastructure
types; Up until recently, there was a large amount of bus
layover and parking in Dublin City Centre, utilising
cc Inadequate or no cycle parking facilities at many
scarce kerbside space. Following work undertaken
stops which are appropriate for their provision;
over recent years in redesigning bus services, the
cc Lack of litter bins at most bus stops and bus scale of this issue has been significantly reduced.
shelters; and However, some potential still remains for further
cc Graffiti present at many locations. relocation of layover and bus parking away from
central areas.
6.5.2 Proposal
Separately, there is, at present, only a limited level
It is the objective of this Plan to put in place a of bus prioritisation at signalised traffic junctions
programme to improve the quality of roadside in the GDA. The use of prioritisation technology
facilities for bus services, to include: at signalised junctions has the potential to further
improve bus performance while still retaining
cc An improved quality of bus stop provision,
general network performance for other traffic.
incorporating a common design approach,
uniform styling and standardised information
formats;
6.6.2 Proposals
While much has already been achieved in catering
cc Improved information provision at bus stops;
for bus movement in the GDA, it is proposed to
cc Bus shelter provision at appropriate locations; build on that work by:
and
cc Further development of a quality bus network
cc Sharing of bus stop facilities between operators appropriate to serve the needs of the GDA;
and services where appropriate.
cc Seeking to achieve, as far as practicable,
The Authority will coordinate the provision of bus continuous inbound priority and the maximum
stop facilities for publicly subsidised bus services possible outbound priority on key bus routes into
and will also prescribe standards of bus stop Dublin City Centre;
facilities, layouts and information provision for
cc Enhancing bus priority at other urban locations
privately operated services.
in the GDA;
6.6 General Bus cc Seeking enhanced bus prioritisation at signalised
traffic junctions in the GDA;
Network Improvements
cc Improving the level of interchange facilities
6.6.1 Current Status between services and with other transport
modes;
The benefits that have accrued from the roll-out of
the Quality Bus Network throughout the Greater cc Creation of bus hubs or bus focal points in key
Dublin Area in recent years are well documented. urban locations in the GDA; and
Quality bus corridors, totalling over two hundred cc Reducing the level of bus layover and parking in
kilometres in length, have been developed since the central urban areas.
start of the last decade, providing vastly improved
bus performance from what existed previously. As part of the further development of the bus
network, additional bus lanes will be implementedIntegrated Implementation Plan Draft - Bus Investment 27
by reassigning road space from private vehicles, and cost-effective urban mobility through the
converting hard shoulders, or road widening on provision of segregated right-of-way infrastructure,
sections to create an additional lane. Where road rapid and frequent operations and excellence
cross sections are too narrow to accommodate in marketing and customer service. It applies to
additional lanes, a virtual bus lane may be provided. public transportation systems that use buses to
This is accomplished using signalling arrangements provide a service with higher speeds and quality
to relocate queuing from an area of the route to an of service than traditional bus services, and is
area where bus lanes exist, thus allowing the bus to achieved by making improvements to the existing
bypass the queue. road infrastructure, the vehicles and the scheduling.
Aspects such as vehicle, station layout, ticketing,
Other measures that will be implemented in branding and intelligent transport systems are all
applicable locations to improve on-street priority integrated to deliver an attractive and modern
are likely to include contra-flow bus lanes, first transport system.
priority bus lanes, turning bans, bus gates and
straight-through lanes for buses at roundabouts. A successful BRT scheme has a number of essential
components which, taken together, form a system
Consideration will be given to a dedicated public that offers passengers a high level of service. The
transport corridor along Westland Row, which key elements of a BRT system are:
would provide improved interchange arrangements
with DART and rail services at Pearse Station. In cc Vehicle;
addition, more traffic signal prioritisation to favour cc Branding;
non-car transport modes, will be required in
numerous locations throughout the city area. cc Ticketing;
cc Station stops;
A fundamental feature of a bus corridor is the road
pavement that the bus operates on. The quality of cc Passenger Facilities; and
the road pavement dictates to a significant degree cc Segregation (where possible) and Priority (where
the passenger’s perspective of the comfort of full segregation is not possible).
the overall journey. Uneven road surface makes
it difficult for passengers to easily move to and This high quality integrated public transport mode
from seats while the bus is travelling, and makes uses buses on roadways or dedicated lanes to
movement to the upper deck particularly difficult. transport passengers quickly and efficiently to
Accordingly, it is proposed that pavement renewal their destinations, while offering the flexibility
works will be undertaken on certain corridors to and adaptability to meet transport demands. The
resolve current pavement deficiencies. goal is to approach the service quality of light rail
transit while still enjoying the very significant saving
In addition, the development of a coach parking in investment costs that bus transit is capable of
facility close to Dublin City Centre is proposed to delivering. Generally, BRT infrastructure costs are in
be progressed during the Plan period, to provide the order of one third to one quarter of that of light
facilities for longer layover by buses and coaches, rail schemes.
provided that the Authority is assured that the
many private bus operators will avail of the facility. Ideally, BRT operates with full segregation from
This will facilitate a review of, and consequential other traffic, but a key benefit is its flexibility to
changes to, the on-street coach parking mix with other traffic on existing roads where full
arrangements in the City Centre area. segregation is not readily achievable. BRT systems
also allow the option for other buses to benefit
6.7 Bus Rapid Transit from using sections of the BRT route.
BRT schemes are being successfully developed and
6.7.1 Description operated as part of integrated public transport
Bus Rapid Transit (BRT) is a high-quality bus based solutions in an increasing number of cities across
transit system that delivers fast, comfortable, the world. In Europe, there are BRT schemesYou can also read