WORKING PAPER SERIES Sentiment and Uncertainty about Regulation - The George ...
←
→
Page content transcription
If your browser does not render page correctly, please read the page content below

WORKING PAPER SERIES

    Sentiment and Uncertainty about Regulation
                                       Tara M. Sinclair
                               The George Washington University
                                       tsinc@gwu.edu

                                         Zhoudan Xie
                               The George Washington University
                                        zxie@gwu.edu

                                   Working Paper No. 2021-004

                                              June, 2021

              H. O. STEKLER RESEARCH PROGRAM ON FORECASTING
                               Department of Economics
                         Columbian College of Arts & Sciences
                          The George Washington University
                                Washington, DC 20052
                           https://www2.gwu.edu/~forcpgm

Working Papers represent preliminary work circulated for comment and discussion. Please contact the
author(s) before citing this paper in any publications. The views expressed in Working Papers are solely
those of the author(s) and do not necessarily represent the views of the H. O. Stekler Research Program on
Forecasting, the Department of Economics, the Columbian College, or the George Washington University.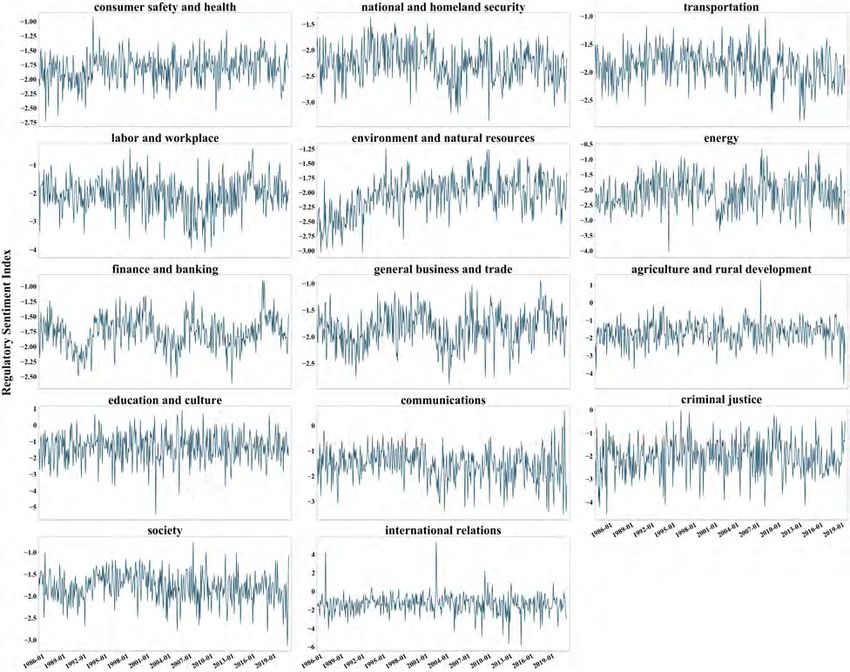
Sentiment and Uncertainty about Regulation∗
                           Tara M. Sinclair†                 Zhoudan Xie‡

                                           June 25, 2021

                                                Abstract
       Regulatory policy can create economic and social benefits, but poorly designed or ex-
       cessive regulation may generate substantial adverse effects on the economy. In this
       paper, we present measures of sentiment and uncertainty about regulation in the U.S.
       over time and examine their relationships with macroeconomic performance. We con-
       struct the measures using lexicon-based sentiment analysis of an original news corpus,
       which covers 493,418 news articles related to regulation from seven leading U.S. news-
       papers. As a result, we build monthly indexes of sentiment and uncertainty about
       regulation and categorical indexes for 14 regulatory policy areas from January 1985
       to August 2020. Impulse response functions indicate that a negative shock to senti-
       ment about regulation is associated with large, persistent drops in future output and
       employment, while increased regulatory uncertainty overall reduces output and employ-
       ment temporarily. These results suggest that sentiment about regulation plays a more
       important economic role than uncertainty about regulation. Furthermore, economic
       outcomes are particularly sensitive to sentiment around transportation regulation and
       to uncertainty around labor regulation.

       Keywords: Regulation, text analysis, NLP, sentiment analysis, uncertainty
       JEL Codes: E2, E3, K2, O4

   ∗
     The authors gratefully acknowledge the GW Regulatory Studies Center for support for this project and
ProQuest for providing access to TDM Studio. The authors thank Susan Dudley, Jerry Ellig, Steve Balla,
Brian Mannix, Bridget Dooling, Roberto Samaniego, Arthur Turrell, Federico M. Ferrara, Bentley Coffey,
and Xiaohan Ma for their insightful comments. The authors are also grateful to the participants at the 2020
Banca d’Italia and Federal Reserve Board Joint Conference, the Southern Economic Association 90th Annual
Meeting, the GW H. O. Stekler Research Program on Forecasting seminar, the 2021 Federal Forecasters
Conference, and the ESCoE Conference on Economic Measurement 2021 for their helpful comments. John
Bertino and Neha Mathur provided excellent research assistance.
   †
     Department of Economics and GW Regulatory Studies Center, the George Washington University.
Email: tsinc@gwu.edu
   ‡
     GW Regulatory Studies Center and Department of Economics, the George Washington University.
Email: zxie@gwu.edu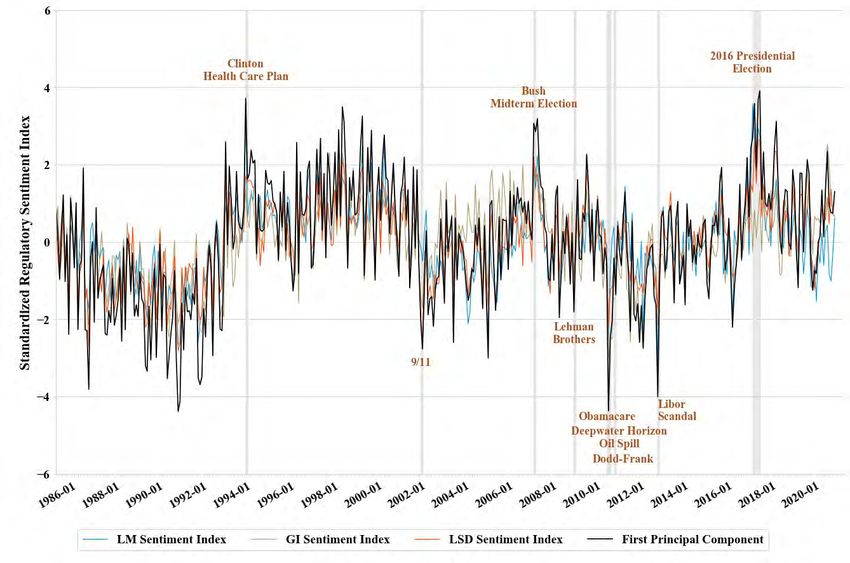
1     Introduction

The COVID-19 pandemic has disrupted daily lives and business operations. As part of
the policy responses to the pandemic, the U.S. government has taken various regulatory
actions. These regulatory responses include interstate and foreign quarantine, state and
local “shelter-in-place” orders, the emergency use authorization of medical products, and
temporary relaxations of certain regulatory requirements. While the primary objective of
these regulations is to contain the spread of coronavirus and protect public health, they also
affected many business activities and generated substantial economic impacts.
    The U.S. government issues thousands of regulations a year. Some of these are in re-
sponse to crises, such as the current pandemic, while others have evolved over time to address
longer term goals. Regulations can address market failures to reduce or eliminate negative
externalities and improve efficiency of resource allocation, creating significant economic and
social benefits. However, poorly designed or excessive regulations may impose “regulatory
burden” on the economy, which can potentially generate substantial adverse effects on aggre-
gate economic outcomes. How regulation affects the economy is thus an important question
for both researchers and policymakers and particularly relevant today.
    While the existing research studying the economic effects of regulation has mostly fo-
cused on the quantity of regulation, subjective perceptions of regulation could also influence
firms’ investment and hiring decisions and thus affect the aggregate economic activity. In
this study, we construct news-based measures of sentiment and uncertainty about regulation
in the U.S. over time and examine their relationships with macroeconomic performance. We
construct the measures using computational text analysis of news data, which cover 493,418
news articles related to regulation from seven leading U.S. newspapers from January 1985 to
August 2020. The overall trend of these articles suggests increasing news attention to reg-
ulatory policy over time, stressing the need to investigate the content of regulation-related
news. We then use a lexicon-based sentiment analysis method to evaluate two dimensions of
the news corpus: the general sentiment (i.e., positive and negative tone) and the degree of

                                              1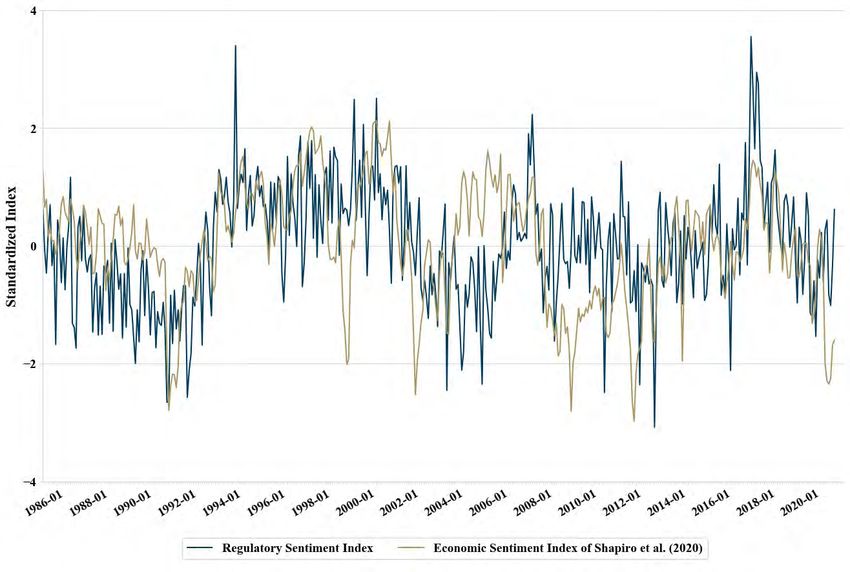
uncertainty expressed in the news about regulation, which capture the subjective attitudes
toward the overall regulatory environment. As a result, we build monthly indexes of regu-
latory sentiment and uncertainty from 1985 to 2020. In addition to the aggregate indexes,
we also categorize relevant news articles into 14 regulatory policy areas and construct cate-
gorical indexes that measure sentiment and uncertainty around specific policy areas in the
news.
   Using our regulatory indexes, we estimate impulse responses of key macroeconomic vari-
ables to shocks in sentiment and uncertainty about regulation, following the vector autore-
gression (VAR) models in Baker et al. (2016). We have three key findings. First, the impulse
response estimates suggest that a negative shock to sentiment about regulation is associated
with large, persistent drops in future output and employment, while a regulatory uncer-
tainty shock overall reduces output and employment temporarily. This indicates that news
sentiment about regulation may be a more appropriate measure reflecting the connection be-
tween regulation and macroeconomic outcomes than uncertainty about regulation. Second,
the impulse responses to regulatory sentiment shocks remain after controlling for news-based
measures of general economic sentiment or economic policy uncertainty, implying that our
regulatory sentiment measure contains some unique information that may be valuable for
predicting future economic activity. Third, economic outcomes are particularly sensitive to
sentiment and uncertainty around certain regulatory policy areas. Specifically, we find that
negative sentiment shocks related to transportation regulation have negative, long-lasting
effects on future output and employment, and sentiment shocks around finance and banking
regulation have relatively transitory but measurable effects on employment. In addition,
increased uncertainty about labor and workplace regulation leads to a persistent reduction
in output.
   Economic research has well documented that sentiment measuring subject attitudes to-
ward current and future economic conditions has strong predictive power for many macroe-
conomic outcomes (Bram and Ludvigson, 1998; Carroll et al., 1994; Benhabib and Spiegel,

                                             2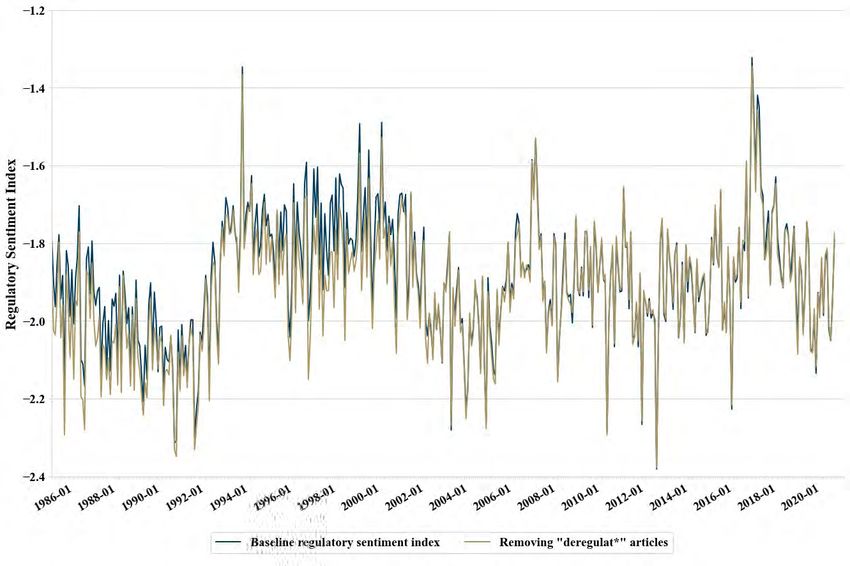
2019). Survey-based measures of economic sentiment are most widely used in empirical
studies, including the Michigan Consumer Sentiment Index and the Conference Board’s Con-
sumer Confidence Index. However, these measures are often subject to limitations due to
small sample sizes covered in surveys and low data frequency. As a result, recent studies have
begun to discover sentiment measures with high-frequency information in the news. News-
based economic sentiment measures are found to be strongly correlated with survey-based
measures and help explain aggregate economic fluctuations (Shapiro et al., 2020; Fraiberger,
2016).
   The development of news-based measures is partially a result of the advance in com-
putational text analysis during recent years. Research using text as data has introduced
economists to advanced natural language processing (NLP) techniques (Gentzkow et al.,
2019). As a popular field of NLP, sentiment analysis is used to extract, quantify, and ana-
lyze the semantic orientation of a document, such as customer reviews, social media, survey
responses, and news articles. In addition to a mere polar view of sentiment (i.e., positive
or negative), sentiment analysis methods can be applied to broader sentiment classifications
to extract other subjective information in source material, such as emotional states (e.g.,
happiness, fear, and anger), subjectivity, confidence, and uncertainty.
   Uncertainty has a long history in economic research, including a literature explicitly
focused on policy uncertainty (for example, Rodrik (1991); Hassett and Metcalf (1999);
Pastor and Veronesi (2012)). Similar to the sentiment literature, text-based measures of
policy uncertainty have gained rapid development and increasing attention recently. A key
contribution is made by the news-based economic policy uncertainty (EPU) index developed
by Baker et al. (2016). Numerous studies have been published subsequently to develop similar
measures for other countries (Arbatli et al., 2017; Cerda et al., 2016) and specific policy areas
such as trade policy and monetary policy (Caldara et al., 2020; Husted et al., 2019). This
research generally finds that increased policy uncertainty reduces business investment and
employment growth, raises precautionary savings, and increases stock price volatility (Baker

                                               3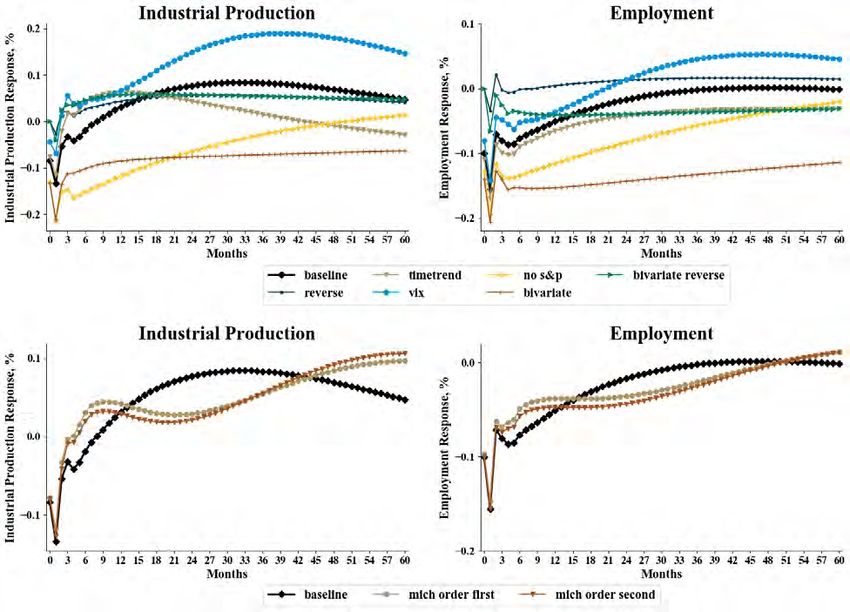
et al., 2016; Bloom et al., 2018; Gulen and Ion, 2016; Caldara et al., 2020; Julio and Yook,
2016). Comparatively, uncertainty surrounding regulatory policy remains largely unexplored.
   Just as measures of economic sentiment and uncertainty reveal information about cur-
rent and future economic activity, our study suggests that news-based measures of sentiment
and uncertainty about regulation may provide important information for understanding the
effects of regulatory policy on aggregate economic outcomes. Therefore, our study also con-
nects to the literature studying the aggregate economic effects of regulation. As detailed in
the next section, this literature has mostly focused on the volume or restriction of regulation
(Coffey et al., 2020; Dawson and Seater, 2013), so our study presents a new direction of
considering the economic impact of regulation.
   Our study has several practical implications. First, although it’s hard to draw any con-
clusion on the causal effects of regulatory sentiment and uncertainty on macroeconomic
activity based on the VARs, the dynamic relationships we show in this paper suggest that
an improvement in the regulatory system that increases public confidence and reduces uncer-
tainty in government interventions may help minimize unnecessary regulatory burden on the
economy. Second, news sentiment and uncertainty around certain regulatory policy areas
appear to have particularly strong links with macroeconomic performance. Policymakers in
those areas should explicitly consider both incremental and cumulative economic effects of
their regulations and increase transparency and clarity of the regulations. Third, up-to-date
indexes of regulatory sentiment and uncertainty can provide forward-looking information
about economic conditions. This information may help businesses better anticipate payoffs
and make optimal hiring and investment decisions.
   In the next section, we discuss the theoretical framework and empirical evidence in the
existing literature for understanding the economic effects of regulation. In Section 3, we
describe the data we use in this study, including text data of news articles and economic
data used in the VAR analysis. In Section 4, we describe our approach to identifying the news
content related to regulation and the evidence of increasing media attention to regulation

                                              4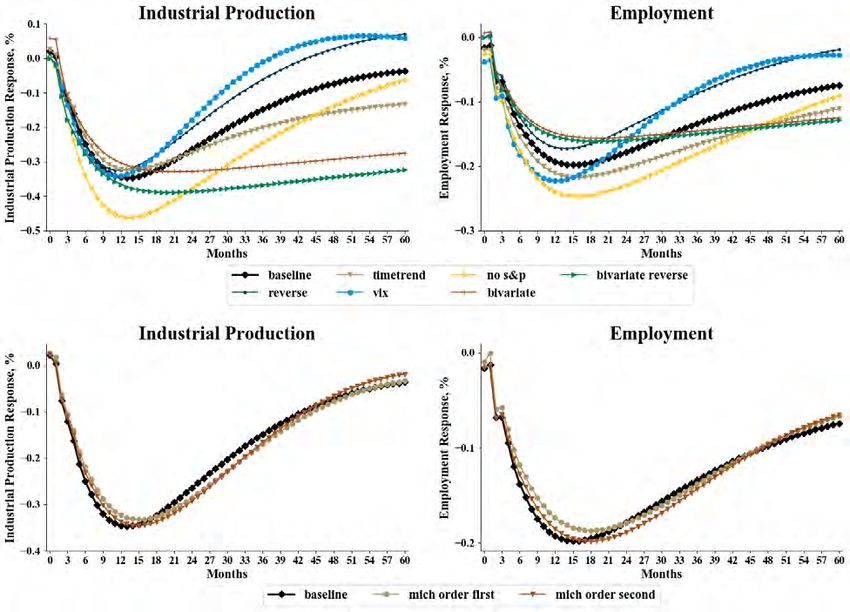
over time. Section 5 presents the regulatory sentiment and uncertainty indexes, including
the sentiment analysis method we use to construct the indexes, some descriptive analysis of
the indexes, and the impulse responses of macroeconomic variables to regulatory sentiment
and uncertainty shocks. In Section 6, we describe the categorical indexes that measure news
sentiment and uncertainty in 14 regulatory policy areas and their varied roles in the impulse
responses of macroeconomic outcomes. Section 7 concludes the study.

2     Economic Effects of Regulation

Regulations, also called rules, are the primary tools that the government uses to implement
laws and achieve policy goals. Regulations often involve “specific standards or instructions
concerning what individuals, businesses, and other organizations can or cannot do” (Dudley
and Brito, 2012, p.1). In this paper, we examine regulations in the U.S., with a focus on
regulatory actions considered by the federal government. Federal agencies issue thousands
of rules every year, covering a broad range of issues such as health, safety, transportation,
and the environment. For example, the Food and Drug Administration (FDA) regulates
the production, distribution, and packaging of certain foods and medical products to ensure
consumer health and safety; the Environmental Protection Agency (EPA) issue regulations
to control pollutants, manage waste and hazardous substances, restore wetlands, and ensure
drinking water quality.
    Given the broad scope of issues covered by regulatory policy, it can affect various in-
dustries and generate substantial impacts on the economy. These impacts are considered
both incrementally and cumulatively. The incremental economic effects of regulations are
partially reflected in agencies’ regulatory impact analyses. When issuing a new regulation
that may have significant effects on the economy, executive branch agencies are required
to estimate the costs and benefits of the intended regulation and adopt the regulation only
if “the benefits...justify its costs” (Clinton, 1993, p.51736). However, such regulatory im-

                                             5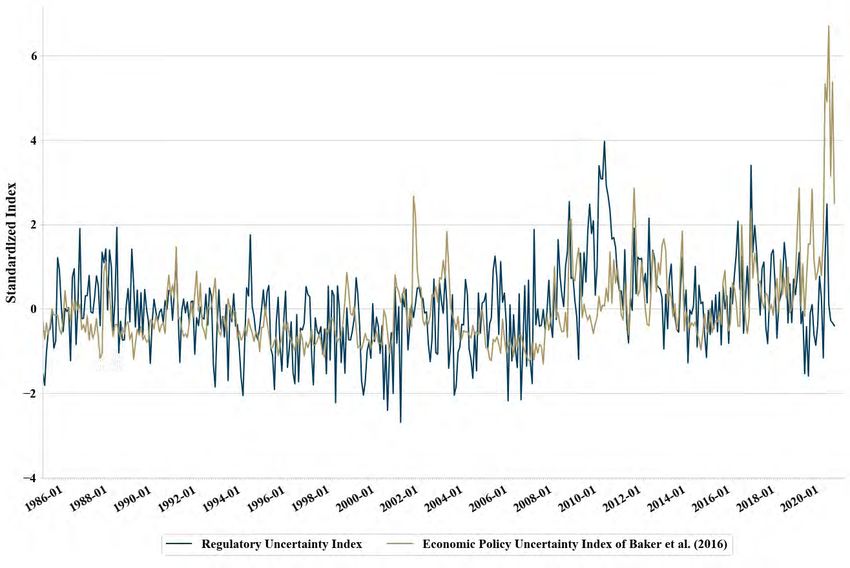
pact analysis is an ex-ante assessment of the effects of a regulation, based on unverifiable
assumptions and models of the counterfactual (Dudley, 2017). Agencies rarely conduct ret-
rospective analyses to assess the realized impacts of the regulation after it is implemented
(Dudley, 2017). Scholarly research comparing available ex-post assessments of the costs and
benefits of individual regulations and their ex-ante estimates suggests that the costs of reg-
ulations tend to be overestimated in ex-ante analyses (Harrington et al., 2000). In addition,
many independent agencies (e.g., Federal Communications Commission) are not subject to
the requirement of conducting regulatory impact analyses for issuing rules.
   Even if individual regulations are estimated to generate net benefits, regulations can
create indirect and cumulative economic impacts that are not considered in analyses of indi-
vidual regulations. Eads (1980) discusses four channels through which regulation can affect
innovation, which also have important implications for considering the aggregate economic
effects of regulation. First, regulation imposes restrictions on firm behavior and thus di-
verts resources that otherwise might be used for production and innovation (Eads, 1980).
While the direct costs for compliance with regulatory requirements are typically considered
in regulatory impact analyses, the indirect effects on innovation and productivity are often
overlooked.
   In academic research, theoretical models that incorporate the effects of regulation on
innovation or productivity are also limited. Coffey et al. (2020) presents one way of consid-
ering the impact of regulatory constraints on productivity in an endogenous growth model.
In their model, firm i in industry j produces goods with the following technology:

                                            ζ (Rj )
                                    Yij = Zijj        [LYij − φj (Rj )],

        ζ (Rj )
where Zijj        is the total factor productivity, Zij is the labor-enhancing knowledge specific
to the firm, ζj is the elasticity of the firm’s output to knowledge, LYij is the labor employed
in producing Yij , φj is a fixed labor cost, and Rj is regulatory constraints (Coffey et al.,

                                                      6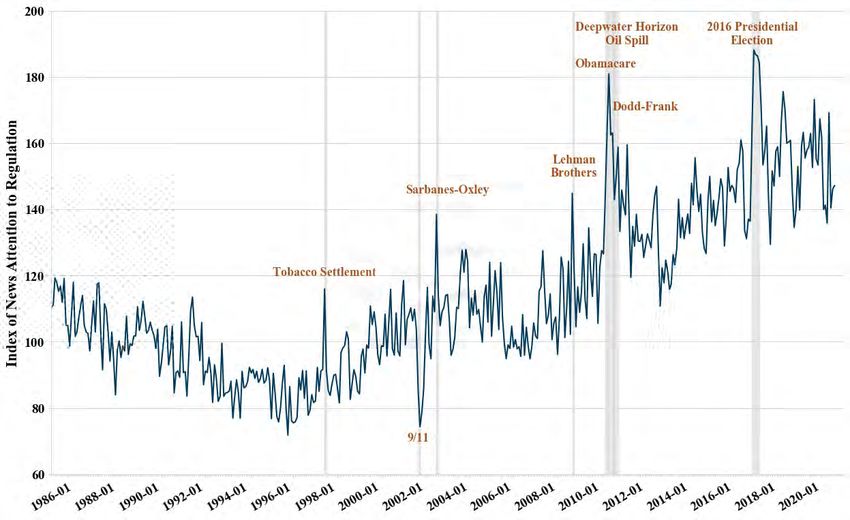
2020). The firm accumulates knowledge according to:

                                     Żij = κ(Rj )Kj LZij ,

where LZij is the labor invested in knowledge accumulation, Kj is the stock of public knowl-
edge in the industry, and κ(Rj ) governs how much knowledge is generated by the firm’s
investment given the regulatory restrictions Rj (Coffey et al., 2020). Therefore, their model
captures the direct effect of regulation on the firm’s fixed labor costs (i.e., labor used for
compliance) and the indirect effect on the firm’s productivity growth.
   Second, regulation may change the firm’s ability to calculate the payoffs to investments
(Eads, 1980). This connects to the broad literature studying uncertainty. Uncertainty ham-
pers firms’ ability to form a probability distribution of payoffs, making firms more cautious
about their investment and hiring decisions. This is often referred to as the “real options”
or “wait-and-see” effect (Bloom, 2014; Bachmann and Bayer, 2013). Regulatory uncertainty
acts in a similar way. For example, a pharmaceutical company may have the option to in-
vest in the development of a new drug; however, if the company is uncertain about whether
the drug would be approved to enter the market by FDA, it may prefer to wait until some
certainty is achieved. Less examined is other types of subjective attitude, such as sentiment
about regulation, and how they affect firm behavior. The firm’s anticipation of payoffs may
depend on whether business executives hold a positive or negative view about the current
and future regulatory environment, which captures the idea of “animal spirits” that influence
household and business behavior (Keynes, 1936; Shiller, 2017).
   While the first two channels suggested by Eads (1980) point to the adverse effects regu-
lation may impose on the economy, the other two channels imply indirect positive impacts
of regulation. Eads (1980) argues that regulation may change the nature and the optional
institutional patterns of research the firm undertakes. Examples include environmental regu-
lations that stimulate innovation in pollution control techniques or new products or processes

                                               7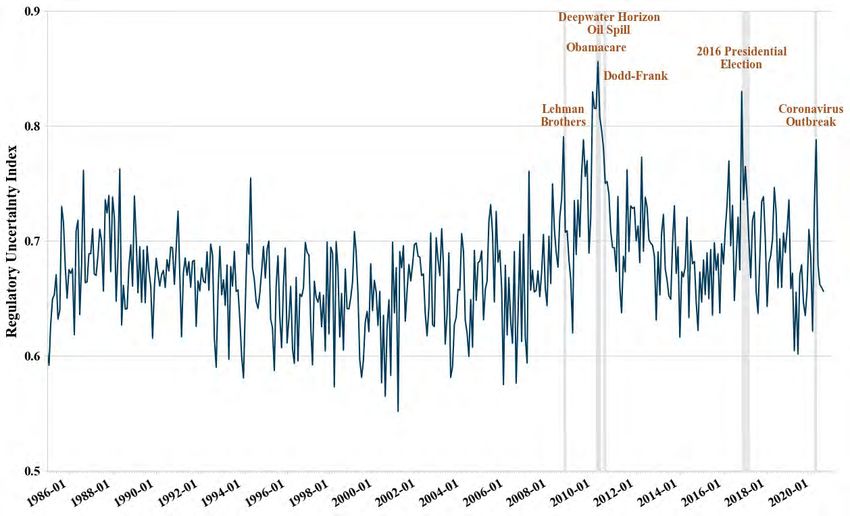
that bring less harm to the environment. This follows Michael Porter’s discussion on envi-
ronmental regulation and industry competitiveness, also known as the “Porter hypothesis”
(Porter and Van der Linde, 1995). Porter and Van der Linde (1995) argue that properly de-
signed environmental regulations can stimulate innovation that may partially offset or even
exceed their compliance costs.
   While the theory suggests potential channels through which regulation may affect the
economy, the aggregate effects of regulation need to be examined empirically. However, such
efforts are often hindered by the difficulty of measuring regulation. Existing approaches to
measuring regulation at an aggregate level primarily focus on the quantity of regulation,
such as the number of rules published by federal agencies, and the number of pages, total
words, and command words in the regulatory code (e.g., the Code of Federal Regulations)
(Dawson and Seater, 2013; Mulligan and Shleifer, 2005; Coffey et al., 2020). Others use
government spending and staffing devoted to regulatory activity as a proxy of regulation
(Beard et al., 2011; Sinclair and Vesey, 2012). These studies generally find a negative or
insignificant relationship between regulation and macroeconomic outcomes.
   However, the existing empirical measures may not provide complete information about
the aggregate effects of regulation. The quantity of regulation or regulators’ spending is far
from a perfect measure of regulation itself.1 Moreover, these measures typically track one
aspect of regulation on a relatively low frequency (mostly annually) due to the prolonged
rulemaking or budget process. In contrast, sentiment and uncertainty about regulation are
more likely fluctuate on a much higher frequency, since they are driven by most recent
regulatory events, which might include the promulgation of a new regulation, a company’s
regulatory compliance or violation, a regulatory investigation, or a lawsuit challenging agency
regulatory actions. An aggregate measure of sentiment or uncertainty about regulation
therefore reflects high-frequency information about subjective attitudes toward the overall
regulatory environment. As discussed above, these subjective variables can influence firms’
   1
     Many studies have discussed the limitations of the existing approaches of measuring regulation. See,
for example, Calomiris et al. (2020) and Simkovic and Zhang (2019).

                                                   8
anticipation of payoffs and thus affect the aggregate economic activity.
While there is some existing research that examines different types of economic sentiment
and policy uncertainty, little has been done specifically on regulation. The most closely
related work to our regulatory uncertainty index is the categorical EPU index on regulation
from Baker et al. (2016), which attempts to measure economic uncertainty around regulatory
policy. Baker et al. (2016) use a pre-defined set of terms related to regulation, in addition to
their economic, uncertainty, and policy terms, to identify news articles that reflect regulatory
policy uncertainty and construct the index based on the volume of those articles. Our
regulatory uncertainty index differs from theirs in at least three ways. First, we use a
substantially broader set of regulatory terms to identify news content related to regulation.
The set of terms is defined using computational text analysis of rule titles published by the
federal government. Second, we assess regulatory uncertainty in articles using a lexicon-based
sentiment analysis method, instead of based on whether the article contains any uncertainty
terms. Third, we use regressions to construct the index following Shapiro et al. (2020)
instead of using the volume of relevant articles. Neither Baker et al. (2016) nor other studies
measure news sentiment about regulation.
3 Data
Our initial news corpus includes 822,737 news articles that contain the keywords starting
with “regulat” or “deregulat” (e.g., “regulation”, “regulator”, “deregulation”) from seven
U.S. newspapers published between January 1985 and August 2020.2 The seven newspapers
are Boston Globe, Chicago Tribune, Los Angeles Times, New York Times, USA Today, Wall
Street Journal, and the Washington Post.3 We access to the full texts and metadata of the
news articles through ProQuest’s TDM Studio, which provides a comprehensive collection
of historical and current newspapers in a machine readable format. We remove articles with
2
In a robustness check, we remove the articles containing the keywords “deregulat*”. The impulse
response functions slightly change, but our main results remain unchanged. See Appendix L.
3
Data for USA Today and the Washington Post are only available from January 1987.
9identical full text to a previous article, leaving 788,516 articles in the corpus.
Since the keyword “regulation” and its variants can be used in many contexts other than
referring to government regulatory policy,4 we conduct further analysis to refine the corpus
by defining a dictionary of regulatory noun chunks (i.e., certain noun phrases extracted from
the text) from the titles of all rules considered by federal agencies from 1995 to 2019. The
data of rule titles are obtained from the federal government’s semiannual Unified Agenda
of Regulatory and Deregulatory Actions reports. The reports provide uniform data on
regulatory and deregulatory actions that agencies plan to issue in the near and long-term
future. The Unified Agenda reports published over 190,000 actions between 1995 and 2019,
which are associated with 38,868 unique rules (as identified by Regulation Identifier Numbers
(RINs)). Section 4 details our approach to define the dictionary and identify the news
content related to regulatory policy. As a result, our final news corpus includes relevant
regulatory sections from 493,418 news articles. Table 1 shows the number of articles from
each newspaper.
In the VARs, we use the same economic variables as those in Baker et al. (2016). Those
include monthly data on employment from the U.S. Bureau of Labor Statistics, effective
federal funds rate and industrial production from the Board of Governors of the Federal
Reserve System, and monthly averages of the S&P 500 index from the S&P Dow Jones
Indices LLC. In the VAR model examining impulse responses of investment, we use quarterly
data on real gross domestic product and real gross private domestic investment from the U.S.
Bureau of Economic Analysis, and quarterly averages of effective federal funds rate and S&P
500. In addition, we add the Michigan Consumer Sentiment Index from the University of
Michigan, VIX from the Cboe Global Markets, Inc., the EPU index of Baker et al. (2016), and
the economic sentiment index of Shapiro et al. (2020) into the monthly VARs for robustness
checks. The monthly data cover the period from January 1985 to August 2020, and the
4
For example, the term “regulation” and its variants are often used in the context of sports. A February
7, 2019 article in USA Today says: “As you watch the NFL or any baseball game and see every replay
tortured and analyzed from every angle, have you ever asked yourself, ‘You know, we could really use more
regulations in sports.’”
10quarterly data are from the first quarter of 1985 to the second quarter of 2020.
4 News Attention to Regulation
In this section, we describe the approach we use to identify regulation-related news articles
from the initial news corpus. Controlling for the total number of news articles published in
each newspaper, we first show evidence that news attention to regulation has been increasing
over time.
4.1 Identifying Regulation-Related News
Identifying regulation-related news is challenging for several reasons. While some newspaper
databases label news articles by subject categories such as finance, politics, and health care,
news articles are rarely labeled as regulatory policy. Also, regulation may be the main
theme of an article, but it may also be mentioned only in certain sections of an article that
mainly discusses economic or political issues. This makes a standard article-level analysis
inappropriate to identify news content related to regulation. A simple search of a limited set
of keywords like “regulation” or “regulator” would also return inaccurate results, because
those words could be used in various contexts.
To identify the specific news content related to regulation, we define a dictionary of
regulatory noun chunks to assess the context in which the keyword “regulation” or its variants
are mentioned in an article. Specifically, we examine the sentence that mentions “regulat*”
or “deregulat*” and its neighbor sentences (i.e., a sentence before and after the regulatory
sentence). If any of the three sentences contain one or more regulatory noun chunks defined
in our dictionary, then we consider these sentences as regulation-related news. An article can
have multiple regulatory sentences, depending on the extent to which regulation is the focus
of the article, and all these sentences and their neighbor sentences compose the regulatory
section of the article. Specifically, we conduct this assessment in a three-step process.
11First, we obtain noun chunks from the titles of all unique rules published in the Unified
Agenda reports from 1985 to 2019. Noun chunks are “base noun phrases” identified using the
NLP library spaCy. For example, the rule title “Test Procedures for the Analysis of Trace
Metals Under the Clean Water Act” is associated with a list of four noun chunks: [“Test
Procedures”, “the Analysis”, “Trace Metals”, “the Clean Water Act”]. We then clean the
noun chunks by removing special characters, removing leading articles (i.e., “the”, “a”, and
“an” at the beginning of a noun chunk), and lemmatizing the tokens of the noun chunks.
The above example thus becomes [“test procedure”, “analysis”, “trace metal”, “clean water
act”]. We only keep the cleaned noun chunks with two or more tokens, because a single-token
noun chunk such as “analysis” has too broad meaning to suggest any relevance to regulation.
We iterate this process over all unique rule titles and eventually generate a list of unique
n-token noun chunks (n ≥ 2). This list includes over 37,000 noun chunks and serves as the
base for our dictionary.
Next, we preprocess the texts of all news articles in our initial data set. This includes seg-
menting sentences of an article, extracting the sentence that mentions “regulat*” or “dereg-
ulat*” (indexed i) and its neighbor sentences (indexed i − 1 and i + 1), and lemmatizing
the tokens in the sentences. We then search each of the n-token noun chunks from the first
step in the extracted sentences using regular expression operations. If the three consecutive
sentences (i − 1 to i + 1) contain one or more of the noun chunks, then these sentences are
included in the regulatory section of the article.
As the third step, we conduct human checking and correction of the noun chunks that
occurred in the articles. Because the list of the n-token noun chunks automatically generated
from the rule titles still includes some general terms that are mentioned frequently in the news
articles but not necessarily related to regulatory policy (e.g., “same time”, “first quarter”,
“other country”), we read through the noun chunks that occurred in all the news articles
and manually filter out those general terms.5 After removing the general terms from the
5
For filtering out the general terms, two coders went through the list of noun chunks and marked general
terms independently, compared their results, and the discussed to solve the discrepancies.
12results, there remains 10,645 unique noun chunks that occurred in 493,418 news articles,
meaning that each of these articles contains a regulatory section. These noun chunks form
our dictionary of regulatory noun chunks, which are also used for building our categorical
indexes as discussed in Section 5. Appendix A lists 100 regulatory noun chunks with most
occurrences in the news articles.
Our sentiment analyses in the remainder of the paper are based on the corpus of the
regulatory sections in the 493,418 news articles.
4.2 Increasing News Attention to Regulation
Tracking the relative frequency of articles discussing regulation over time can suggest trends
in news attention to regulation. We investigate that by building a monthly index of news
attention to regulation using an approach similar to Baker et al. (2016)’s approach to building
their EPU index. That is, we scale the monthly count of news articles that contain regulatory
sections by dividing it by the total number of news articles published in the newspaper in
the month, and then standardize the scaled monthly counts and normalize the time series
to a mean of 100 from 1985 to 2009. Specifically, the monthly news attention index N At is
calculated as:
100
N At = zt PTe ,
1
Te t=1 zt
where zt is the mean of standardized monthly counts over newspapers:
K
1 X xit
zt = ,
K i=1 Nit δi,Te
where i = {1, 2, ..., K} denotes the newspaper, t = {1, 2, ..., T } denotes the month, xit is
the raw count of articles related to regulation in newspaper i in month t, Nit is the total
number of news articles published in newspaper i in month t, δi,Te is the standard deviation
xit
of the scaled count Nit
over the time interval Te for standardization and normalization (i.e.,
January 1985 – December 2009).
13Figure 1 plots the monthly index of news attention to regulation. The overall trend
suggests that regulation has been drawing increasing attention from the media since 1996.
News attention to regulation raised during months of important regulatory developments
and historical events that triggered massive regulatory responses. For example, the index
shows spikes around the Lehman Brothers bankruptcy in 2008, the passage of Obamacare
and the Dodd-Frank Act in 2010, and the 2016 presidential election, and a substantial drop
during the month of the 9/11 attack in 2001. Beside the overall increasing trend, the 2016
election is accompanied by particularly elevated news attention to regulation compared to
other elections, presumably because deregulation is one of Trump’s top political priorities
(Dudley, 2020).
The trend in news focus on regulation not only suggests that regulatory policy has become
an increasingly popular topic among journalists, but also implies that regulation has become
more relevant to their readers, potentially including consumers, workers, and business lead-
ers. This also motivated our study to investigate the news content and their implications for
the macroeconomy.
5 Sentiment and Uncertainty about Regulation
This section starts with a description of the sentiment analysis method we use to estimate
the sentiment and uncertainty scores of the regulation-related news articles in our sample.
Using the estimated scores, we compute the monthly indexes of regulatory sentiment and
uncertainty from 1985 to 2020. We then include the indexes in VAR models to examine how
macroeconomic variables respond to regulatory sentiment and uncertainty shocks.
5.1 Sentiment Analysis
We use a lexicon-based approach for sentiment analysis. The lexicon-based approach as-
sesses the semantic orientation of a document based on the frequency of words or phrases
14with a particular semantic orientation that occur in the document. It relies on pre-defined
dictionaries of opinionated words, such as a list of positive or negative words. There are
many available sentiment dictionaries designed for general purposes and some for specific
domains.
We use the 2018 Loughran and McDonald (LM) dictionary (originally developed in
Loughran and McDonald (2011)) to assess the sentiment and uncertainty in the regula-
tory sections of the relevant news articles in our baseline analysis. The LM dictionary was
constructed specifically for the domain of finance, using a corpus of corporate 10-K reports
(Loughran and McDonald, 2011). Because of its domain relevance, the LM dictionary has
been frequently used in economic research (for example, Fraiberger (2016); Calomiris et al.
(2020); Ostapenko et al. (2020)). The 2018 version of the dictionary comprises sentiment
word lists in several categories, including 2,355 words in the negative category, 354 words in
the positive category, and 297 words in the uncertainty category.
However, we also notice that the LM positive and negative word lists are strongly un-
balanced, with substantially more negative words than positive words. One reason is that
Loughran and McDonald (2011) has a clear focus on the proportion of negative words in
10-Ks for detecting the association between tone and excess returns. They note that finance
and accounting research generally finds little incremental information in positive words, and
the LM positive word list was created more for completeness than “discerning an impact on
tone identification” (Loughran and McDonald, 2011, p.45). While an unbalanced dictionary
may not affect our interpretation of changes in sentiment over time, it will bias our senti-
ment assessment toward a disproportionately negative tone. For this reason, we also use two
other dictionaries to construct the sentiment measure for comparison: the Harvard General
Inquirer (GI) dictionary and the Lexicoder Sentiment Dictionary (LSD). The GI dictionary
is a general-purpose lexicon originally developed in the 1960s and has been widely used in
various disciplines. It covers several broad valence categories, including lists of 2,005 negative
words and 1,637 positive words. The LSD is a comprehensive sentiment lexicon combining
15three pre-existing dictionaries and tailored primarily to political news (Young and Soroka,
2012).6 The LSD comprises 2,857 negative words and 1,709 positive words.
Similar to our search of regulatory noun chunks, we use regular expression to count
occurrences of each sentiment word in the preprocessed regulatory section of an article. We
incorporate a negation rule to take into account negated positive and negative words. That
is, if an English negation word, such as “not”, “don’t”, or “cannot”, occurs within three
tokens before the opinionated word, then the opinionated word would be considered as the
opposite orientation. For example, the following regulatory section contains two occurrences
of negative words as defined by the LM dictionary: “hazard” and “violation”, and three
occurrences of positive words: “boost”, “fear” (with the negation word “without”), and
“boost”.
So, the department’s Occupational Safety and Health Administration in re-
cent years has boosted spending on its consultation program, which allows little
companies to ask for an OSHA visit to look for workplace hazards without
fear of being cited for violations as a result of that visit. The idea is to boost
voluntary compliance with safety regulations. The program’s funding rose 50%
between fiscal 1996 and fiscal 2001, to $48.8 million, equal to about 11% of
OSHA’s total budget.7
We use a standard formula to calculate sentiment scores. The regulatory sentiment score
of an article is the difference between the proportion of positive words and the proportion of
negative words in the regulatory section of the article. Therefore, a positive sentiment score
indicates an overall positive tone in the news about regulation, and a negative score means
an overall negative tone.
6
The three pre-existing dictionaries combined in the LSD are the GI, the Regressive Imagery Dictionary
(Martindale, 1975), and the Roget’s Thesaurus (Roget, 1911).
7
The quote is from “GAO Criticizes OSHA’s Program for Small Businesses–Report Questions Effective-
ness of Consultations as Visits and Hazards Decline” published by the Wall Street Journal on October 30,
2001.
16We use a similar approach to assess uncertainty in regulation-related news content. The
uncertainty category of the LM dictionary covers a broad range of terms in addition to
“uncertainty” and “uncertain”, such as “ambiguity”, “confusion”, “doubt”, and “vague”.
The regulatory uncertainty score of an article is the proportion of uncertainty words in
the regulatory section of the article. A higher uncertainty score suggests a higher level of
uncertainty expressed in the regulation-related news.
5.2 Regulatory Sentiment and Uncertainty Indexes
Table 2 shows the descriptive statistics of the sentiment scores estimated using the LM,
GI, and LSD dictionaries and the uncertainty scores using the LM dictionary. The absolute
sentiment score that measures the polarity of a document is clearly dependent on the scope of
opiniated words defined in the dictionary. Unsurprisingly, the sentiment measured using the
LM dictionary is generally more negative compared with the GI and LSD. The LSD generated
the most balanced result, with an approximately same number of articles estimated negative
and positive. To illustrate how the three dictionaries assess a document differently, Appendix
B shows examples of regulatory sections with negative and positive words identified from
each dictionary. As shown in Table 2, the uncertainty scores indicate that approximately
half of the articles expressed a degree of uncertainty in the sections that discuss regulation.
Appendix B also includes the uncertainty words and estimated uncertainty scores for the
examples.
To construct the monthly sentiment and uncertainty indexes, we use fixed effects regres-
sions following Shapiro et al. (2020). The specification is:
sj = ut(j) + vi(j) + j ,
where sj is the estimated sentiment or uncertainty score for article j, ut(j) is a year-month
fixed effect, and vi(j) is a newspaper fixed effect. The estimated coefficients on the year-
17month fixed effects ut from this regression are the monthly sentiment or uncertainty index,
depending on the dependent variable. One advantage of this approach is that the newspaper
fixed effects control for time-invariant heterogeneities across newspapers, which can poten-
tially address the concern of ideological differences among news sources. This is particularly
important for our study, because the news sentiment toward government regulation could
be largely affected by the political stance of the newspaper.
Figure 2 plots the regulatory sentiment indexes estimated using different dictionaries
between January 1985 and August 2020. To focus on changes over time rather than relative
polarity between indexes, we normalize the indexes by their means and standard deviations.
The three time series demonstrate similar patterns over time and are strongly correlated
with each other. The correlation between the LM and LSD indexes is 0.8; the correlation
between the LM and GI indexes is 0.56; and the correlation between the LSD and GI indexes
is 0.71. We also show the first principal component of the three standardized sentiment
indexes in Figure 2, which explains 80 percent of the variance. All the three indexes and the
principal component suggest that news sentiment about regulation has changed over time.
For example, the newspapers in the period of late 1980s and early 1990s appear to express
a relatively negative tone when discussing regulation, while the sentiment largely improved
around the mid-1990s and maintained at a stable and higher level until the early 2000s.
In the following VAR analyses, we present the results using the LM sentiment index, but
include the results using the GI and LSD indexes and the principal component in Appendix
C to show robustness.
Figure 3 plots the regulatory uncertainty index. In particular, we see more spikes in
regulatory uncertainty during recent years. Regulatory uncertainty reached a historical peak
in 2010, a year that marks many important events in the regulatory history, including the
enactment of Obamacare (March 2010), the Deepwater Horizon oil spill (April 2010), and
the passage of the Dodd-Frank Act (July 2010). Other large spikes occurred around the
Lehman Brothers bankruptcy in September 2008, the Trump election in November 2016,
18and the coronavirus outbreak in the U.S. in April 2020.
Appendix D compares our regulatory sentiment index with the economic sentiment index
of Shapiro et al. (2020) and our regulatory uncertainty index with the EPU index of Baker
et al. (2016). The correlation between the regulatory sentiment index and economic senti-
ment index is 0.38 and statistically significant. While the two time series comove in some
time periods, they do not always coincide with each other. Similarly, the regulatory uncer-
tainty index has a statistically significant correlation of 0.28 with the EPU index, but the
two indexes demonstrate clear variations. These comparisons suggest that regulatory sen-
timent or uncertainty is distinct from aggregate economic sentiment or policy uncertainty,
and possibly contains unique information about the economy. We further investigate this
issue in the next section.
5.3 Impulse Responses
We then examine how our measures of sentiment and uncertainty about regulation affect
future economic activity. We use the monthly VAR model of Baker et al. (2016), through
which we estimate how measures of economic activity respond to a regulatory sentiment or
uncertainty shock. The shock is orthogonalized by using the Cholesky decomposition with
the following ordering of variables: our regulatory sentiment or uncertainty index, the log of
S&P 500 index, the federal funds rate, log employment, and log industrial production.8 The
VAR includes three lags of all variables. We show impulse responses up to 60 months after
the shock.
Figure 4 plots the impulse responses of industrial production and employment to a one-
standard-deviation negative shock to the regulatory sentiment index, with point estimates
and 90 percent confidence bands. The estimates show that a negative sentiment shock
reduces industrial production and employment. The effects on industrial production are
8
We tested for stationarity of our regulatory sentiment and uncertainty indexes. The Phillips-Perron
test rejects unit root for all the indexes, while the ADF and KPSS tests suggest more mixed results. See
test statistics in Appendix E.
19statistically significant between 6 and 15 months after the shock and reach the maximum of
a 0.35 percent drop at 13 months post the shock. The shock leads to a statistically significant
reduction in employment for a longer time period, lasting up to 24 months after the shock,
and the maximum estimated drop is 0.2 percent.
Figure 5 shows the impulse responses to a regulatory uncertainty shock. The effects
of a one-standard-deviation shock that increases regulatory uncertainty are relatively short-
lived, compared to the sentiment shock. Industrial production and employment drop by 0.13
percent and 0.16 percent, respectively, in the next month after the shock, but the effects start
waning and are not statistically significant at the 10 percent level after that.
Similar to Baker et al. (2016), we make several modifications to the VAR specification to
test the robustness of the results. Those include the VAR with reverse ordering, a bivariate
VAR, a bivariate VAR with reverse ordering, dropping the S&P index, including the VIX,
including time trends, and including the Michigan Consumer Sentiment Index. Figures 6 and
7 show the results on the regulatory sentiment and uncertainty indexes, respectively, suggest-
ing that the estimates of impulse responses to regulatory sentiment shocks are robust to the
modifications, while the estimates to regulatory uncertainty shocks present some variations.
In particular, the effects of sentiment shocks on industrial production and employment are
nearly unaffected after controlling for the Michigan Consumer Sentiment Index, regardless
of the ordering of the Michigan index and our regulatory sentiment index (see the bottom
two subplots of Figure 6). The Michigan index reflects consumers’ confidence in current
and future economic conditions. The robust impulse response functions suggest that our
measure of news sentiment about regulation reflect at least some unique information about
economic activity that is not captured by the general consumer sentiment or other sources
of first-moment information.
To investigate this issue further, we also add the news-based economic sentiment index
of Shapiro et al. (2020) and the EPU index of Baker et al. (2016) to the VARs. As shown
in Figures 8 and 9, most of the impulse response estimates remain after controlling for
20general economic sentiment or economic policy uncertainty. When the general economic
sentiment index is placed after our regulatory sentiment index in the causal ordering, the
estimated effects of a regulatory sentiment shock on output and employment are nearly
unchanged. When economic sentiment is placed first in the ordering, the magnitude of the
effects diminishes but still remains sizable.
In addition, we implement VARs using quarterly data to examine how gross investment
responds to regulatory sentiment and uncertainty shocks. The identification of the quarterly
VAR is based on three lags and Cholesky decomposition with the following order: our
regulatory sentiment or uncertainty index, the log of S&P 500 index, the federal funds rate,
log investment, and log gross domestic product. Appendix F plots the impulse response
functions over 20 quarters after a shock. The estimates of investment responses to regulatory
sentiment and uncertainty shocks are not statistically significant at the 10 percent level,
regardless of which dictionary we use to measure sentiment.
It is possible that the effects of regulatory sentiment and uncertainty shocks are con-
ditional on each other. Using the approach from Caggiano et al. (2017), we estimate
an Interacted-VAR and compute state-dependent generalized impulse response functions
(GIRFs) to see: (1) whether the impact of regulatory uncertainty shocks is different when
regulatory sentiment is particularly low, and (2) whether the impact of regulatory sentiment
shocks is different when regulatory uncertainty is particularly high. The results suggest no
clear evidence that the impulse responses to regulatory sentiment shocks under high and
low regulatory uncertainty are different: while the estimated negative effects of a regulatory
sentiment shock are generally larger when regulatory uncertainty is high, the GIRFs under
high and low uncertainty generally follow similar trajectories, and their differences are not
statistically significant at the 10 percent level. Similar results are observed for GIRFs to
regulatory uncertainty shocks under high and low regulatory sentiment. The details are
discussed in Appendix G.
In sum, the impulse response estimates indicate that news sentiment about regulation
21has a larger and more robust link with aggregate economic activity than uncertainty about
regulation. A drop in regulatory sentiment has a significant, persistent effect on future out-
put and employment. The robustness of this effect after controlling for news-based measures
of economic sentiment and policy uncertainty implies that our measure of sentiment about
regulation contains some unique information that may be valuable for predicting future eco-
nomic outcomes. An increase in regulatory uncertainty may reduce output and employment
temporarily, but this effect is smaller in terms of magnitude and presents some variations in
robustness checks.
While the application of our sentiment and uncertainty indexes has some interesting im-
plications, these indexes measure information in the news about regulatory policy in general.
However, regulation is diverse, involving various policy areas and segments of the economy.
In the next section, we discuss disaggregated measures of sentiment and uncertainty by
regulatory area.
6 Sentiment and Uncertainty by Regulatory Policy Area
To discover how news sentiment and uncertainty about regulation differ by policy area and
how they connect to economic activity, we build categorical indexes of sentiment and uncer-
tainty for 14 regulatory policy areas. We present the indexes and impulse response estimates
in this section.
6.1 Categorizing News Articles
To categorize relevant news content by regulatory area, we rely on the dictionary of regulatory
noun chunks described in Section 4.1. Specifically, we use the fact that the regulatory noun
chunks are extracted from rule titles and that rules are issued by agencies with specific
regulatory authorities. For example, EPA generally issues environmental regulations, FDA
issues regulations to protect food safety and health, and the Commodity Futures Trading
22Commission regulates part of the financial market. Therefore, we categorize agencies by
regulatory area according to their authorities and assume that the noun chunks extracted
from the rules issued by a given agency are associated with the regulatory area of the agency.
As a result, we specify 14 regulatory areas for the agencies in our sample, including con-
sumer safety and health, national and homeland security, transportation, labor and work-
place, environment and natural resources, energy, finance and banking, general business and
trade, agriculture and rural development, education and culture, communications, criminal
justice, society, and international relations. Appendix H lists examples of the agencies, their
designated areas, and rule titles. After linking regulatory noun chunks back to agencies,
the vast majority of the noun chunks (8,919 out of 10,645) in our dictionary are designated
with one regulatory area, while a small proportion of the noun chunks appear in multiple
rules issued by multiple agencies and thus are associated with multiple regulatory areas (e.g.,
“final rule”, “administrative requirement”, and “technical amendment”). We use only the
area-specific noun chunks (i.e., the regulatory noun chunks associated with only one area)
for categorizing the news articles.
Since the regulatory section of a news article in our sample contains one or more of the
noun chunks, the article can potentially be classified into regulatory areas based on the noun
chunks mentioned. The following is an example of regulatory section:
Automobile manufacturers are financing a multimillion dollar lobbying cam-
paign aimed at persuading state legislatures to require motorists to buckle up
their seat belts, a move designed to kill a federal regulation requiring the
industry to equip vehicles with more expensive air bags by 1989. Last year,
legislatures in New York, New Jersey and Illinois adopted mandatory seat belt
laws and legislation already has been filed on Beacon Hill to bring about the
same end.9
9
The quote is from “Automakers’ Millions Back Seat-Belt Laws” published by Boston Globe on January
30, 1985.
23This regulatory section contains four regulatory noun chunks: “seat belt”, “federal reg-
ulation”, “air bag”, and “seat belt” (with “seat belt” occurring twice). Among these terms,
“federal regulation” is a common term used in rule titles and thus are associated with seven
regulatory areas, whereas “seat belt” and “air bag” are noun chunks unique to the area of
transportation in our dictionary. Therefore, we classify this article into the transportation
category, based on the area associated with “seat belt” and “air bag”.
In longer regulatory sections, it is common that there are many regulatory noun chunks
that are linked to multiple unique areas. In that case, we define the dominant area of an
article as the most common area across all the regulatory noun chunks with unique areas
in the regulatory section. This approach intends to capture the primary regulatory areas
discussed in the relevant text of a news article. Mathematically, suppose there are n noun
chunks with unique areas in the regulatory section (duplicated noun chunks are counted
multiple times), apm×1 denotes a m × 1 vector for the pth noun chunk, where the qth element
of the vector apq = 1 if the pth noun chunk is associated with the qth area (q = {1, 2, . . . , m}),
and otherwise apq = 0. We add the vectors for all noun chunks:
n
X
apm×1 = bm×1 .
p=1
Then the dominant area is qmax such that bqmax = max1≤q≤m bq . In some instances, there
are multiple dominant areas for an article. Appendix I plots article counts by dominant
area, showing that finance and banking is the regulatory area that has drawn the most news
attention, followed by environment and natural resources regulation.
Appendix J shows the top 30 area-specific regulatory noun chunks with most occurrences
in the regulatory sections of news articles in each area. For example, “food and drug admin-
istration”, “public health”, and “child care” occur frequently in the articles classified into
the consumer safety and health category. For robustness checks, we conduct human checking
of the most common area-specific noun chunks in each area. Specifically, we manually filter
24out certain general or irrelevant terms from the top 100 regulatory noun chunks in each area
and then reclassify news articles. When filtering out general or irrelevant terms, we take two
alternative approaches: one is a relatively conservative approach that removes a small set
of terms that are unlikely associated with the corresponding area or very likely associated
with multiple areas, and the other is a relatively aggressive approach that keeps only the
terms that are more likely associated with the corresponding area than any other areas (see
Appendix K). These alternative approaches result in slightly different classifications of news
articles, and we discuss how they change the impulse response functions in Section 6.3.
6.2 Categorical Indexes
We use the same approach to construct the categorical indexes as we did for the aggregate
sentiment and uncertainty indexes. Namely, for a given regulatory area, we create the indexes
by fitting the fixed effects regression to the estimated sentiment or uncertainty scores of the
articles classified into the area. The specification is:
sj,q = ut(j,q) + vi(j,q) + j,q ,
where sj,q is the estimated sentiment or uncertainty score for article j in area q, ut(j,q) is a
year-month fixed effect, and vi(j,q) is a newspaper fixed effect. The estimated coefficients on
the year-month fixed effects ut(j,q) from the regression compose the monthly sentiment or
uncertainty index for regulatory area q.
Figures 10 and 11 plot the categorical sentiment and uncertainty indexes over time.
There are substantial variations in the measured sentiment and uncertainty about different
regulatory areas. For example, the sentiment about environmental and natural resources
regulation largely improved in the 1990s, a decade beginning with the passage of the 1990
Clean Air Act amendments. The sentiments around finance and banking regulation and
general business and trade regulation comoved closely over time, with large drops around
25You can also read