Left behind by the G20? - How inequality and environmental degradation threaten to exclude poor people from the benefits of economic growth
←
→
Page content transcription
If your browser does not render page correctly, please read the page content below
157 Oxfam Briefing Paper 19 January 2012
Left behind by the G20?
How inequality and environmental degradation threaten
to exclude poor people from the benefits of economic
growth
www.oxfam.org
EMBARGOED UNTIL 00:01 HRS GMT THURSDAY 19 JANUARY 2012
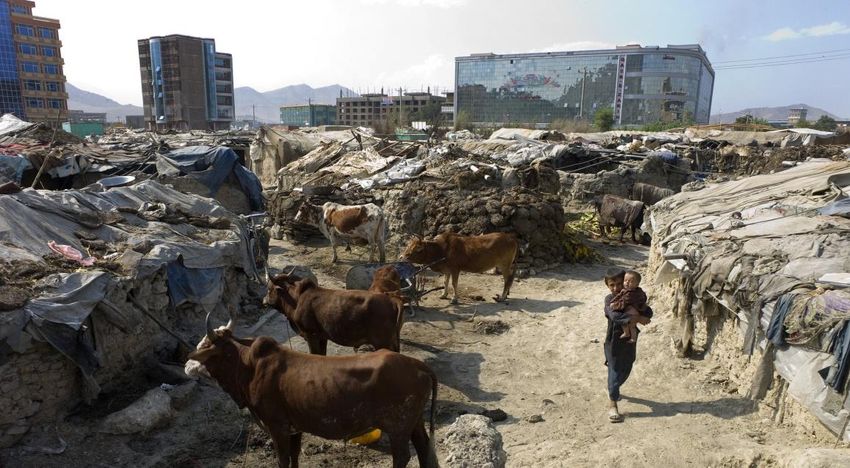
Around the world, poor families live alongside their livestock in filthy
environments, only metres away from glittering signs of wealth and progress.
© Jason P. Howe/Oxfam GB
The G20 is committed to supporting equitable and sustainable
growth. But new data shows that a lot needs to change if they are to
live up to this pledge. The stakes are high: analysis in this paper
suggests that without attention to growing inequality, strong
growth is unlikely to be enough to prevent poverty increasing in
some G20 countries over the next decade. Income inequality is
growing in almost all G20 members, while it is falling in many low-
and lower middle-income countries. Meanwhile, environmentally
unsustainable economic expansion is driving dangerous climate
change, and depleting the natural resources upon which poor
people depend most for their livelihoods. Without action, inequality
will render the benefits of growth inaccessible to the poor, even as
they bear the costs of this expansion through the impacts of a
changing climate and environmental degradation. It’s time for the
G20 to practice what it preaches.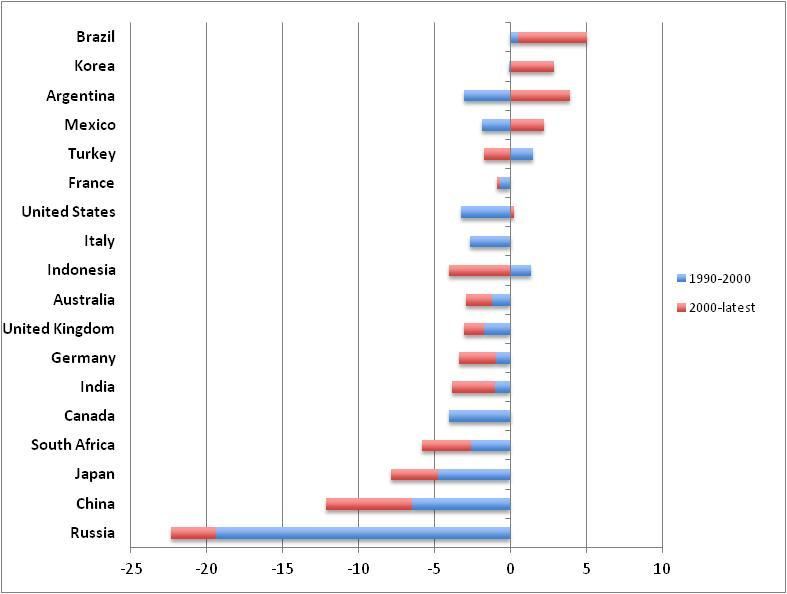
Summary
    In 2010, the G20 committed themselves to promoting inclusive and
    sustainable economic growth. They argued that ‘for prosperity to be
    sustained it must be shared’ and also endorsed ‘green growth’, which
    promises to decouple economic expansion from environmental
    degradation. But G20 countries have some way to go to match this
    commitment. This paper assesses their record, and points the way
    forward.

    The stakes are high: over half the world’s poorest people live in G20
    countries, and rising inequality threatens to prevent them benefiting
    from economic growth. Income inequality is growing in almost all G20
    countries, even while it is falling in many low- and lower middle-
    income countries. Meanwhile, G20 countries alone consume almost all
    the natural resources that the planet is capable of replenishing each
    year. Unsustainable patterns of usage are driving dangerous climate
    change and depleting the natural resources upon which poor people
    depend for their livelihoods.

    This means that many of those living in poverty will miss out on the
    benefits of growth, yet also bear the costs of this economic expansion
    through the impacts of climate change and environmental degradation.
    If G20 countries are to secure a prosperous future for all their citizens,
    they must now practice what they preach and tackle these linked, but
    distinct, challenges of equality and sustainability.

    Inclusive?
    Inequality erodes the social fabric, and severely limits individuals’
    opportunities to escape poverty. Where income inequality is high or
    growing, the evidence is clear that economic growth has significantly
    less impact on poverty: a trickle-down approach does not work.

    Moreover, recent research indicates overwhelmingly that inequality is
    detrimental to economic growth itself. Inequality leads to instability,
    prevents productive investment and undermines the institutions of
    government. Protests emerging around the world show the extent to
    which citizens are concerned about inequality’s corrosive power.

    And yet, inequality is growing in most G20 countries. Using a new
    dataset, we show that only four G20 countries – including just one
    high-income country, Korea – have reduced income inequality since
    1990. In this, the G20 is being outdone: a large number of others,
    including low-income and lower middle-income countries, have
    reduced income inequality in this period.

    Our analysis illustrates just how dangerous this trend is. In South
    Africa, our model predicts that more than a million additional people
    will be pushed into poverty between 2010 and 2020 unless rapidly
    growing inequality is addressed. The rewards flowing from increased
    equality are similarly dramatic. In Brazil and Mexico, bringing
    inequality down to the level in Indonesia (close to the G20 median)

2
could, according to our calculations, reduce the number of people in
poverty by 90 per cent in the space of a decade.
This analysis focuses on income inequality, which though important is
just one of the many inter-related forms of inequality. In its broadest
sense, inequality denies the rights of whole sections of society to be
treated with dignity and respect. In many G20 countries, at least half
the population are affected: the often subordinate status of women and
girls translates into less access to health and education, lower incomes,
and poorer life chances than men.
Sustainable?
Life depends on the planet’s natural capital, the natural resources that
we use to produce food, water and energy. But the current trajectory of
usage is deeply disturbing. No country (in the G20 or outside) has yet
demonstrated that it is possible to combine high average incomes with
sustainable natural resource use.
However, several middle-income countries have succeeded in reducing
the resource-intensity of their economic growth. Between 1991 and
2007, Mexico’s gross domestic product (GDP) grew four times faster
than its CO2 emissions. China’s grew two and a half times faster.
By contrast, the G20’s high-income countries have on the whole
performed very poorly. Only four G20 countries have reduced their
carbon emissions since the Rio Summit in 1992.
The dangerous climate change and environmental degradation that
results hits the poor hardest. The poor not only depend most on natural
resources for their livelihoods, but also tend to live in places
disproportionately affected by climate change. They can also lack the
rights or power to secure access to resources in times of scarcity.
Oxfam’s recent report Land and Power documents detailed cases of land
grabs depriving the poor of access in Uganda, Indonesia, Guatemala,
Honduras, and South Sudan.1
The G20 member countries must therefore act far more decisively to
bring their use of natural resources back within sustainable limits. The
high-income countries among them must lead in demonstrating that
environmentally sustainable economic growth is possible.
3Recommendations
Towards inclusive growth
The analysis in this paper shows that without attention to rising
inequality, strong growth will not be enough to reduce poverty
significantly over the next decade.
Policy makers must therefore devote more attention to inequality.
There are some indications that this may be about to happen, but most
G20 countries are currently moving in the wrong direction. Words need
to be matched by comprehensive policy programmes in all G20
countries.
The exact policy mix should be tailored to each national context, but
policies in successful developing countries suggest the following
starting points:
• redistributive transfers;
• investment in universal access to health and education;
• progressive taxation;
• removal of the barriers to equal rights and opportunities for women;
• reforming land ownership, ensuring the right access to land and
other resources, and investing in small-scale food producers.
The experience of Brazil, Korea, and many low-income and lower
middle-income countries shows that reducing inequality is within G20
policy makers’ power, whatever the level of economic development in
their country. There is no shortage of potential policy levers. Instead,
there has perhaps been a shortage of political will.
Towards sustainable growth
Resolving inequality will not on its own be enough to secure a
prosperous future for all. Economic activity is currently depleting the
Earth’s natural assets, including the capacity of the atmosphere to
absorb carbon dioxide, with the costs borne disproportionately by poor
women and men. The most immediate concern is climate change.
Developed countries must lead by going much faster and further in
absolutely decoupling their GDP growth from natural resource use,
including carbon emissions. However, all G20 countries must monitor
and begin to internalise in economic decisions the resource impact of
their production and consumption patterns across a wide range of
natural resources. These reforms should be accompanied by policies
that protect the most vulnerable communities, workers and consumers
from the impact of transition. A start can be made at the Rio+20
Sustainable Development Conference in June 2012.
4The exact policy mix should be tailored to each national context, but
may include:
• Investment in public goods, such as research and development in
clean energy;
• Tax breaks, subsidies and other incentives to guide private
investment to where it is needed;
• Taxing undesirables, such as greenhouse gas emissions, to direct
economic activity towards more sustainable alternatives;
• Regulation to stop companies polluting or to encourage them to
provide goods and services they otherwise would not.
In addition, G20 countries must show much greater leadership at the
UN Framework Convention on Climate Change (UNFCCC). In
particular, they should:
• ensure that developed countries commit, as a first step, to the high
end of their current 2020 mitigation pledges, and give assurances
that long-term mitigation financing will be mobilized to help
developing countries implement their most ambitious pledges;
• forge consensus on the fair shares of the global emissions cuts
needed to prevent more than 1.5°C of global warming;
• broker agreement on new and reliable long-term sources of climate
finance, particularly a fair carbon charge for international shipping,
with a compensation mechanism for developing countries, and
financial transactions taxes in developed countries.
The G20 has an opportunity to establish itself as a group of countries
that leads by example. They have committed themselves to pursuing
inclusive and sustainable economic growth, and living up to this
pledge is where they should start.
51 Introduction
Average global income per person has doubled over the last forty
years.2 The proportion of the world’s population living in poverty has
fallen significantly over the same period, but the absolute number
remains high: 1.3 billion people still live on less than $1.25 a day. More
than half of these women and men are in G20 countries.3
At the same time, the global economy is now using the planet’s
renewable natural resources between 20 and 50 per cent faster than
they can be replenished, with the G20 alone using 95 per cent of the
planet’s available biocapacity each year.4
In this report, Oxfam presents new analysis demonstrating the scale of
the equity and sustainability challenges facing the globe. A prosperous
future for all is possible, but most G20 countries are not currently
taking the route towards it.
A weight of evidence demonstrates that if policy makers focus
exclusively on economic growth and ignore inequality, the benefits of
economic expansion are inaccessible to the poor.5 Meanwhile, the
accompanying resource use often forces the poor deeper into poverty as
a result of environmental stress and climate change.
Having positioned itself as the pre-eminent global forum, the G20 must
lead by example. In 2010, G20 countries raised hopes that they would
do exactly this. They unveiled the Seoul Development Consensus for
Shared Growth, arguing that ‘for prosperity to be sustained it must be
shared’. Similarly, they made a welcome commitment to ‘green
growth’, 6 which promises to decouple economic expansion from
environmental degradation.
This paper points the way ahead, and shows just how far the G20 has to
go. We reveal a few high flyers, but mostly poor performers on
inequality reduction and sustainability, by examining G20 countries’
performance over recent years. We contrast the G20’s performance with
non-G20 countries and, through case studies, demonstrate how many
more people could escape poverty if the G20 actively pursued shared
growth. First, we unpack the evidence demonstrating the importance of
improving equality and sustainability.
62 Inequality and society
The struggle for greater equality is at the heart of modern politics. As
the UN Economic Commission for Latin America and the Caribbean
(ECLAC) puts it:
’For the past three centuries, equality has meant two things that, while com-
plementary, are in a state of permanent tension. The first is the abolition of
privilege and the firm establishment of equal rights for all individuals, irre-
spective of their origins and of their gender, nationality, age, territory and
ethnicity... The second dimension is the distribution of resources in society in
such a way as to allow all its members to exercise their rights effectively.’ 7
Inequality remains prevalent around the world at both the micro-level –
such as in violence against women – and the macro-level, which
manifests itself in the mistreatment of minorities (or majorities in some
cases), corruption, land grabs, and grotesque disparities in life chances
between and within countries. A child born in Japan today can expect
to live 37 years longer than a child born in Zimbabwe, for example.8 In
England, people living in the poorest neighbourhoods will, on average,
die seven years earlier than people living in the richest
neighbourhoods.9
Evidence has clearly linked inequality to the erosion of the social fabric,
including increased crime, lack of trust, and poor mental health.10
Statistical analysis suggests that a country’s murder rate is strongly
correlated with its level of income inequality.11 In Latin America, the
United Nations Development Programme (UNDP) has linked
inequality with undesirable aspects of the political system, including:
‘the poor regulatory capacity of the state, which allows for the presence
of monopolies or oligopolies, murky rules of the game and a poor
response to citizens’ needs.’12
This section does not attempt to give a comprehensive account of every
aspect of inequality, nor does it focus on the gross disparities that exist
globally (for example, the richest 10 per cent control approximately half
of the world’s income).13 Instead, it focuses on income inequality within
countries and sets out three economic arguments for policies that
favour equity:
1. The poverty-reducing effects of growth are limited by inequality.
2. Reducing inequality offers a double dividend: reducing poverty
directly and making future growth more pro-poor.
3. Inequality is a barrier to growth.
7The poverty-reducing effects of growth are limited
Economic growth can play a significant role in sustained development
over the long term. This is most clearly the case for the poorest
countries. For example, in Niger, average per capita income is $1 per
day and 93 per cent of the population is estimated by the UN to live in
‘We estimate that with the
‘multidimensional poverty’.15 Redistribution even to the point of
same growth rate and no
absolute equality would rescue many people from the deepest poverty,
rise in inequality in rural
areas, the number of poor in but still leave everyone poor.
China would have fallen to
However, the impact of aggregate or average income growth on
less than one-quarter of the
poverty, particularly in the short and medium term, varies hugely from
actual value.’
country to country. In some cases, growth is accompanied by a
Martin Ravallion 14
substantial reduction in the numbers and proportion of people living in
poverty. Brazil’s growth, for example, averaged 2.5 per cent a year from
1990 to 2009 and was accompanied by falling inequality (although it
still remains extremely high). Over this period, the proportion of
Brazilians living in poverty was cut in half.16
But in other cases, significant growth has occurred without any fall in
the poverty rate. In Peru in the decade from 1997, the proportion of the
population living in poverty grew even as the country averaged
impressive growth rates of 3.9 per cent a year.17
Based on a large sample of countries, former Chief Economist of the
World Bank Francois Bourguignon found that variation in growth rates
on their own explained only 26 per cent of the variation between
countries in rates of poverty reduction.18
Reducing inequality offers a double dividend of
poverty reduction
Inequality is the missing link – the key to explaining how the same rate
of growth can lead to different rates of poverty reduction. By failing to
take into account initial levels of inequality, and how they change, we
can grossly misjudge the impact of growth upon poverty reduction.19
We need to look at how much incomes rise on average and how the
increase is distributed amongst the population.
There are many factors, including gender, region, or other inequalities
of power, that can influence this distribution. Even in the world’s
richest countries, for example, women’s wages and terms of
employment are behind men’s.20 The inevitable effect of greater
inequality of income is that growth has a lesser impact on poverty.
Ravallion concludes that ‘growth will be quite a blunt instrument
against poverty unless that growth comes with falling inequality.’21
Empirical studies of recent evidence from developing countries
demonstrate the benefits of equality to poverty reduction very clearly.
Analysis for the World Bank22 found that, in countries with very low
income inequality,23 every one per cent of economic growth reduced
poverty by four per cent. In contrast, growth in countries with high
inequality had essentially no impact on poverty.24 Even having medium
8levels of income inequality can make a huge difference.25 They
conclude that ‘the power of growth to reduce poverty depends on
inequality.’26
Reducing income inequality is also a means of reducing poverty in the
absence of growth. The scope for poverty reduction through
redistribution is greatest in middle-income countries, where most of the
world’s poor people now live. Average income is considerably higher
than in the poorest countries, but is very unequally distributed.
‘Distribution matters for As Bourguignon points out, poverty reduction in Indonesia in the late
poverty reduction.’ 1990s was achieved entirely through redistribution, compensating for
Francois Bourguignon 27 the impact of negative growth.28 Bourguignon describes the ability of
inequality-lowering policies to both reduce poverty immediately and
accelerate the poverty-reducing impact of growth in the future as the
‘double dividend’ of redistribution.29
A focus on inequality is therefore crucial if policy makers want to
maximize poverty reduction.
Inequality is a barrier to growth
For a long time the orthodox view was that economic growth was
accompanied inevitably in the early stages by increased inequality,
leading eventually to greater equality. This phenomenon is known as
the ‘Kuznets curve’, named after economist Simon Kuznets. This would
imply that it is unnecessary and ineffective for developing economies to
worry about growing inequality.
But a mass of more recent evidence has overwhelmingly refuted this
characterization.30
Moreover, detailed investigation of data from both developed and
developing countries from the mid-1990s onwards offers significant
evidence that a high level of inequality is a barrier to future economic
growth.31 Indeed, the Asian Development Bank (ADB) suggests that
growth and equality can ‘be seen as part of a virtuous circle.’32
This contradicts the old argument, which asserted that inequality
enhances growth, because the concentration of income provides excess
wealth for investment.33
Analyses focus to different extents on inequality preventing productive
investment, limiting the productive and consumptive capacity of the
economy, and undermining institutions. The arguments are discussed
at length in a recent Oxfam research report and are summarized here.34
Firstly, it is argued that inequality prevents individuals making
productive investments or realizing their productive potential. For
example, where inequality disrupts credit markets to the extent that
only the wealthy elite has the capital required to access credit, many
potentially productive investments by those less wealthy are
foregone.35 A lack of women’s land rights either in legislation or
practice is a common barrier to accessing credit.
9Similarly, serious inequalities of income or power can deny access to
education and healthcare for large numbers of people. Besides being a
violation of the rights to education and health, this means that only a
minority of the population is able to develop its full capacity.36 In many
societies, this applies to at least half the population, where the
subordinate status of women and girls translates into less access to
education, health services, political spaces, land, credit, and power.
‘Societies that discriminate There is also a weight of evidence to suggest that inequality contributes
by gender tend to experience to weak social cohesion, poor institutions, and bad governance, and
less rapid economic that this, in turn, is a serious drag on economic growth. The ADB argue
growth… than societies that that the ‘persistence of inequality could trigger social and political
treat males and females tensions, and lead to conflict as is currently happening in parts of
equally.’ Asia.’38
Andrew Mason and Elizabeth King,
World Bank37
Furthermore, it has been influentially argued that greater equality of
land ownership contributes to a more even distribution of power and
thus more development-friendly institutions, including universal
education. This (among other issues) could help to explain the much
stronger growth in the USA as compared to Latin America over the last
two centuries.39
A similar argument has been argued to apply within Latin America
more recently, in explaining the greater growth in Costa Rica as
compared to Guatemala, with inequalities of wealth reinforcing the
concentration of power, and preventing the emergence of legitimate
and growth-promoting institutions.40 The way in which inequality
limits the ability of individuals to participate in both government and
development is central to the lack of growth.
Other studies by economists such as Dani Rodrik explore this further,
pointing to the importance of good institutions for growth and the
harmful impact of inequality on institutions.41
‘High inequality is a feature The IMF has recently added to this body of evidence, with research on
of under-development.’ the contribution of inequality to causing the financial crisis,43 and the
Francisco Ferreira and Martin role of greater equality in extending national growth spells.44
Ravallion, World Bank 42
If we factor in the impact on growth, the double dividend of tackling
inequality becomes a triple dividend: it directly reduces poverty,
enhances the ability of future growth to reduce poverty, and finally, it
improves prospects for growth itself. All this argues that high levels of
inequality should be a much greater cause for concern amongst policy
makers than they are at present.
103 Sustainability and equity
The growth of the global economy over the last two hundred years is
unprecedented. Looking forward, it is projected to quadruple in size by
2050, according to the Organisation for Economic Co-operation and
Development (OECD), rising from $70 trillion today to $300 trillion.45
However, in generating global economic growth to date, humanity has
been using nature’s resources in a deeply unsustainable way.
Environmental sustainability has many dimensions, including the rate
of use of renewable resources, non-renewable resources, and the
planet’s capacity to absorb waste. Many of these dimensions and their
interdependencies are still not fully understood, making it difficult to
produce indicators that reflect all the relevant dimensions. One
composite indicator which aims to measure humanity’s use of
renewable resources is the ecological footprint.
Box 1: What is an ecological footprint?
The ecological footprint aims to track humanity‘s demands on nature, in terms
of the land and sea area required to meet people‘s demand for food, fibre,
timber, energy, and settlements, and to absorb the carbon dioxide emitted.
That demand is then compared with the planet‘s biocapacity – its ability to
regenerate those resources year-on-year, based on available cropland,
grazing land, forests, fishing grounds, and the land area that would be
required to sequester carbon dioxide emissions. Both a nation‘s ecological
footprint and its biocapacity are expressed in terms of global hectares (gha) –
a common unit based on all the biologically productive land and sea area in
the world in a given year.
The ecological footprint is not a perfect measure of renewable resource use: it
does not include measures of freshwater use or biodiversity and, like any
indicator relying on internationally comparable UN data, the quality of data
varies from country to country. The footprint‘s calculation is currently evolving
as better data and improved methods for comparing the productivity of
different land types become available, but the underlying trends that it
documents remain alarmingly clear. As a result, it is used for analysis by many
governments, cities, companies, scientists, and international organizations.
Source: Oxfam based on Global Footprint Network, October 2011, www.footprintnetwork.org
Humanity’s global ecological footprint has doubled since 1961, and
today we are using nature’s renewable resources between 20 and 50 per
cent faster than the planet can renew them.46
We are significantly depleting the planet’s natural capital. Through
over-fishing, over-grazing, over-harvesting trees, and depleting soils,
we are running down the planet’s long-term ability to produce
resources for human use such as crops, meat, fish, and timber.
Likewise, we are undermining its ability to absorb waste, such as
storing carbon dioxide, and its ability to provide life-supporting
services such as biodiversity, freshwater renewal, and a safe climate.
11Environmental degradation exacerbates social
inequalities
Natural resources are the fundamental wealth on which life depends.
The current trajectory of environmental degradation is a threat to all
human prosperity, but the impact of degradation falls hardest on poor
countries and people, in three ways:
• Poor people depend most on natural resources for their livelihoods.
According to the Food and Agriculture Organization of the United
Nations (FAO), three-quarters of people facing hunger in the world
live in rural areas, mainly in Africa and Asia. They depend on
farming, fishing, herding, and forests for their livelihoods, often
surviving on marginal lands that are most prone to flooding and
drought.47 Women food producers, in particular, tend to depend on
marginal land and rain-fed agriculture, and so are among the most
affected by environmental degradation such as water stress and
declining soil fertility.48
• The impacts of climate change fall disproportionately on poor countries,
because of their geography combined with their level of economic
development. Even with a temperature rise of 1–2.5°C , the
Intergovernmental Panel on Climate Change (IPCC) predicts serious
effects in many developing countries. This includes reduced crop
yields in tropical areas, leading to increased risk of hunger, and the
spread of climate-sensitive diseases such as malaria.
Current greenhouse gas emissions and targets put the world on track
for a 4°C increase in average global temperatures. This could
devastate agriculture in many of the world’s poorest regions, destroy
clean water sources for up to three billion people in developing
countries, and cause one billion people to lose their homes by 2100.49
• Resource degradation exacerbates social conflict over resource use. Poor
rural communities often lack secure right of access to and use of the
arable land, water, forests, and fishing grounds that they rely upon for
their livelihoods. In the face of rising pressure on global
environmental resources, such as growing water stress, deforestation,
and declining soil fertility, low-income communities often lose control
over and access to those resources, as local elites or international
investors secure their own supply and access. Oxfam’s recent report
‘Land and Power’ documents detailed cases of such land grabs in
Uganda, Indonesia, Guatemala, Honduras, and South Sudan.50
Bringing humanity’s use of natural resources back within ecologically
sustainable limits is essential. But inequalities in power and resources
mean that poor people and poor countries are also vulnerable to the
impact of making that transition to sustainability. International and
national policies designed to protect their rights and interests are vital.
Tackling underlying inequalities within and between countries
becomes all the more important as a result.
124 The inequality report card
Historically, little effort has been devoted to developing accurate or
comparable measures of inequality (across time and countries). This is
symptomatic of a deeper problem. Inequality does not receive the level
of attention from policy makers (particularly outside Latin America)
that the evidence of its significance demands.
Inequality is not discussed or highlighted by the IMF in its annual
Article IV reports on each member country, or in its Extended Credit
Facility loans, which target poverty reduction and growth.
However, a recently developed database (the Solt database of
Standardized World Income Inequality51) provides a comparative
measure for one type of inequality: income. It contains standardized
gini coefficients: a measure of how far the income distribution is from
perfect equality.
This allows us to construct an income inequality report card for the G20
countries (and other countries) where we examine how unequal they
are now, and whether they are moving in the right direction. This
exercise revealed a few high performers, but a worrying overall trend
for G20 countries.
The G20 inequality report card
This paper compares inequality in net household income within a
country, as measured by the gini coefficient, for all the G20 countries
except Saudi Arabia (for which data is not available). As a comparison,
it also examines the income share of the poorest 10 per cent of the
population in a subset of countries.
According to the latest data shown in Figure 1, France has the lowest
inequality, closely followed by South Korea, a country that has rapidly
developed without seeing a major increase in inequality. South Africa is
the most unequal by a considerable distance.
13Figure 1: Gini coefficient of income in G20 countries, 2005–2009
70
Gini coefficient of income (most
60
50
40
recent)
30
20
10
0
Italy
France
Turkey
Canada
Germany
Korea
Japan
Russia
Mexico
India
United Kingdom
China
Argentina
Indonesia
Australia
South Africa
United States
Brazil
Source: Figure compiled by Oxfam using data sourced from F. Solt (2010) ‗The Standardized World
Income Inequality Database‘, http://hdl.handle.net/1902.1/11992 (Version 3.0)
Figure 2 shows in more detail how income is shared. Comparable data
on the distribution of income is available for only two thirds of the G20
countries. It is unavailable for Australia, France, South Korea, Japan,
Saudi Arabia, UK, and the USA.
We find that the income share of the poorest 10 per cent of the
population is often very low, sometimes as low as one per cent.
Meanwhile, the richest 10 per cent enjoy a huge share, sometimes
exceeding 40 per cent of all income.
In terms of the income share of the poorest 10 per cent of the population,
India is the strongest and Brazil is the weakest. South Africa has the
biggest concentration of wealth at the top end of the income scale.
14Figure 2: Income share in G20 countries, 2000–2009
India
Indonesia
Germany
Canada
Russia
China
Italy
Turkey
Argentina
Mexico
South Africa
Brazil
0% 20% 40% 60% 80% 100%
Share of national income
Poorest 10% 2nd poorest 10% Middle 60% 2nd richest 10% Richest 10%
Source: Figure compiled by Oxfam using data sourced from World Bank World Development
Indicators, http://data.worldbank.org
In general, the most unequal countries are emerging market economies:
South Africa, Brazil, Mexico, Russia, Argentina, China, and Turkey. The
most equal tend to be developed economies with a higher than average
income, including France, Germany, Canada, Italy, and Australia.
However, the picture is very different when we consider which
countries are reducing inequality and where it is increasing. This shows
that the wealthiest countries have much more to worry about.
According to our dataset, the only four countries in the G20 to have
improved equality since 1990 are emerging market economies: Brazil,
Korea, Mexico, and Argentina. Brazil and Korea succeeded in reducing
inequality both during the 1990s and over the last decade as they grew.
Mexico and Argentina, having become more unequal during the 1990s,
reversed this with greater improvements towards equality since 2000
(again, while growing).52
15Box 2: Reducing inequality in Brazil and Argentina
Brazil and Argentina are two of the few recent success stories on income
inequality in the G20. So what happened?
Economist Giovanni Andrea Cornia suggests two root causes of reduced
inequality across Latin America over the last decade: government policy and
benign economic conditions, illustrated by rising migrant remittances (which
represent more than 2.3 per cent of regional GDP, and 2.8 per cent for
53
Mexico).
Government policies sought to increase the tax to GDP ratio, allowing
countries to balance their budgets, as well as pursue increased government
spending. Focusing on government policy in Brazil, Hailu, and Soares
suggest that two areas stand out: improvements in education in the mid-
nineties, namely universal admission to primary schooling and lower
54
repetition rates, and cash transfers from the state.
The UN‘s Economic Commission for Latin America and the Caribbean
(ECLAC) affirms the importance of cash transfer programmes across the
55
region. UNDP agrees that they serve two major purposes: ‗first, to transfer
income flows to households in poverty, and, second, to promote investment
by households in the human capital of the youngest generation in order to
increase their capacity to generate income in the future and break the cycle
56
of the intergenerational transmission of poverty.’
Rising employment and wages also played a key role. Cornia highlights that
employment has increased more under left-of-centre governments in the
57
region. Cornia cites further evidence showing that minimum wages raised
incomes at the bottom of the distribution, and pulled up wages in the
informal as well as formal sector.
Source: Stuart, E. (2011) ‗Making Growth Inclusive‘, Oxford: Oxfam. (Other sources as cited.)
As Figure 3 shows, however, these four countries are the exception.
Across the G20 countries as a whole, and in every high-income country
except Korea, the average level of inequality rose from 1990 to the mid-
2000s (in each country, the latest year for which comparable data is
available).
Some countries have even seen accelerating increases in inequality
since the millennium: Turkey, Germany, Indonesia, Australia, India,
and South Africa. These inequalities are often linked to extreme
inequalities in wages: a May 2011 report by the UK’s High Pay
Commission indicated that on current trends, top executives would be
paid 214 times the average wage by 2020.58
16Figure 3: Comparison of percentage point change in gini coefficient of
income in G20 countries over two decades, 1990-2010
Less equal More equal
Source: Figure compiled by Oxfam using data sourced from F. Solt (2010) ‗The Standardized World
Income Inequality Database‘, http://hdl.handle.net/1902.1/11992 (Version 3.0)
These statistics tell us only about income inequality. Inequalities of
wealth – which are very significant in explaining how inequality hinders
growth, as described in the first section – can be even more extreme.
There is evidence that these, too, are growing. For example, recent
research by New York University economist Edward Wolff found that
the wealth share of the richest one per cent of the US population actually
grew during the economic crisis from 2007 to 2009.59
Even where income inequality has been reduced, in Brazil, Argentina,
and Mexico (leaving out Korea because the data is not available),
almost all the improvement is occurring in the middle of the
distribution. The middle class have gained income share at the expense
of the richest 10 per cent. A sustainable attack on poverty and
inequality will require a focus on the poorest people.
Overall, the G20 data tells a story of increasing inequality. Evidence on
the impact of inequality – and protests now happening around the
world – indicate strongly that G20 policy makers need to take note.
Experience in Brazil, Argentina, Mexico and Korea demonstrates that
progress towards equality is possible. The evidence also suggests that a
high level of inequality is not an inevitable corollary of a particular rate
of growth or level of development. This is put beyond doubt if we
consider how inequality has changed in other countries.
17Box 3: The importance of inequality beyond incomes
This section focuses on two measures of income inequality, because this is
where the most comparable data exist. But this only tells part of the story.
Inequalities in power and wealth, and differences between genders are all
crucial for development outcomes.
The ‗missing women‘ phenomenon demonstrates just how devastating these
forms of inequality can be. Analysis of population trends shows that the
number of girls and women in Asia is tens of millions lower than it should be.
This is because of sex-selective abortion and post-birth neglect of young
60
girls.
Regardless of income poverty levels, no country can claim to be truly
developed unless it has addressed such foundational forms of inequality as
this.
How does the G20 compare with low-income and
low middle-income countries?
Using the new Solt database, we have found that the level of income
inequality is falling in most low-income countries where data over time
is available.61 Their levels of inequality are converging towards those in
G20 countries.
A number of countries, particularly in very poor African countries such
as Mali, Malawi, Sierra Leone, and Ethiopia, have made substantial
improvements in their levels of income equality, as shown in Figure 4.
Figure 4: Changes in inequality in low-income countries, 1990-mid
2000s (2004, 2005 or 2006, depending on availability)
Mali
Malawi
Sierra Leone
Ethiopia
Gambia
Kyrgyz Republic
Guinea-Bissau
Niger
Guinea
Burundi
Cambodia
Kenya
Mozambique
Madagascar
Uganda
Tajikistan
Burkina Faso
Bangladesh
Nepal
-10 -5 0 5 10 15 20 25
Percentage point change in gini coefficient towards greater equality
Less equal More equal
Source: Chart compiled by Oxfam using data sourced from: F. Solt (2010) ‗The Standardized World
Income Inequality Database‘, http://hdl.handle.net/1902.1/11992 Version 3.0
18Several lower middle-income countries have also made huge strides in
reducing inequality (Figure 5).62 More than half the countries in our
sample reduced inequality between the mid-nineties and 2005,
although often from a high starting point.
Figure 5: Changes in inequality in lower middle-income countries, 1990-
mid 2000s (2004, 2005 or 2006, depending on availability)
Lesotho
Swaziland
Nigeria
Ukraine
Senegal
Nicaragua
Philippines
Egypt
Paraguay
Guatemala
Zambia
Pakistan
El Salvador
Georgia
Armenia
Mongolia
Indonesia
Belize
Bolivia
Morocco
Honduras
Moldova
India
Djibouti
Yemen
Vietnam
Cape Verde
Ghana
Turkmenistan
Papua New Guinea
-15 -10 -5 0 5 10 15
Percentage point change in gini coefficient towards greater equality
Less equal More equal
Source: Chart compiled by Oxfam using data sourced from: Frederick Solt, 2010, "The
Standardized World Income Inequality‖
This further demonstrates that growing inequality is not an inevitable
by-product of a particular stage of development. Falling inequality, and
thus greater reductions in poverty, is possible at any stage of economic
development.
Tackling inequality is as much a matter of political decision as of
economics. Of the two fastest-growing countries in the sample,
Armenia grew while becoming more equal; Turkmenistan grew while
becoming considerably less equal.
These findings throw the performance of the G20 countries into sharp
relief. If they want to promote a development strategy based on shared
growth, they need to lead by example. In reality they often perform
worse than non-G20 countries.
195 The sustainability report
card
The urgency of bringing global economic activity back within
sustainable environmental limits has been recognized for decades. In
1992, the world’s nations met in Rio de Janeiro and committed to
sweeping changes in global environmental action. This included
stabilizing global greenhouse gas emissions in order to prevent
dangerous climate change, and conserving and using the planet’s
biodiversity sustainably.
Twenty years later, in June 2012, they will meet again in Rio de Janeiro
to assess what progress has been made and define the way forward:
they must make concrete commitments to a plan of action for the next
decade and beyond that will shift economies onto a sustainable,
equitable and resilient path.
The G20 economies are likely to play a central role in generating the
global economic growth that is projected over the next 40 years. The
path they pursue will strongly influence the prospects for human
development in the rest of the world.
So what has been the G20’s record over the past two decades in terms
of combining economic growth with environmental sustainability?
What can be learned from their experiences in terms of what is possible,
and how much more action is needed?
The G20 sustainability report card
The G20 countries are home to just over 60 per cent of the world’s
population, and 66 per cent of the planet’s biocapacity (around 8 billion
global hectares) lies within their territories. Their economies collectively
grew by two-thirds from 1991 to 2007,63 while their combined ecological
footprint rose by over a quarter.
By 2007 (the most recent year for which data is available), they were
using 95 per cent of the planet’s total biocapacity in order to generate
their economic output. They were effectively commandeering the vast
majority of the planet’s sustainable resource base for their economic
production (see Figure 6). Analysing the data on the components of the
G20’s ecological footprint shows that CO2 emissions are the main driver
behind its rapid increase.
20Figure 6: The G20 countries’ ecological footprint of production, 1992-
2007
14
Global
Biocapacity
12 G-20 Total
Ecological
Footprint of
10 Production
Global Hectares, billion 8 G-20
Biocapacity
G-20 Built up land
6
G-20 Fishing
ground
4
G-20 Grazing land
2 G-20 Forest land
G-20 Cropland
0
1992
1995
1997
2002
2007
1993
1994
1996
1998
1999
2000
2001
2003
2004
2005
2006
G-20 Carbon
Source: Global Footprint Network database, analysed by Oxfam.
Within the group of G20 countries there are, of course, wide variations
in both per capita ecological footprints and average national incomes.
Figure 7 shows that countries with similar GDP per capita can have
very different ecological footprints associated with how they generate
economic output.
Germany and Australia, for example, have very similar GDP per capita
(around $33,000) but Australia’s resulting ecological footprint of
production is over two and a half times bigger than Germany’s.
Likewise, Mexico’s GDP per capita is higher than Argentina’s, but its
ecological footprint from producing that output is less than half of
Argentina’s. It is not surprising that nations’ ecological footprints vary,
given their differences in size and natural resource endowments. It is,
however, clear that the path to economic growth taken by countries
with large ecological footprints cannot be replicated globally.
21Figure 7: The G20 countries’ ecological footprint of production versus
GDP per capita, 2006
14
Middle income High income
Canada
Australia
12
2006 Ecological Footprint of Production per capita
10
United States
(global hectares)
8
6 Argentina
Germany
France
Russian Federation Saudi Arabia
4 Brazil
Italy United Kingdom
Korea (Republic of)
Japan
China South Africa Mexico
Turkey
2 Global biocapacity per person
Indonesia
Ecologically sustainable and high income quadrant
India
0
0 5,000 10,000 15,000 20,000 25,000 30,000 35,000 40,000 45,000 50,000
2006 GDP per capita (PPP $)
Source: UNDP 2010 (Human Development Report 2010) and Global Footprint Network database64
Figure 7 also sets out what would be required for globally shared
sustainability. If the planet’s biocapacity were distributed equally
among the current global population of seven billion, there would be at
most 1.8 global hectares (gha, a measure of biocapacity65) available per
person.
Among the G20 countries, only India and Indonesia have per capita
ecological footprints of production below 1.8 gha, but they both have
per capita GDP below $5,000. In contrast, Australia and Canada’s
annual economic output results in ecological footprints six times larger
than what would be globally sustainable.
This encapsulates the challenge of achieving sustainable global
economic growth. No country within or outside the G20 has achieved
high average incomes and a sustainable ecological footprint.
So what would it take to make economic growth environmentally
sustainable? Unpacking this question is essential for sharpening
debates on ‘green growth’ and for assessing progress made by
countries in decoupling economic growth from resource use.
22Box 4: What would sustainable economic growth take?
Whether or not sustainable economic growth is possible hinges on the
concepts of relative decoupling and absolute decoupling of economic growth
from natural resource use. Figure 8 demonstrates the crucial difference
between them.
Relative decoupling occurs when GDP grows faster than resource use
grows, so that the resource intensity of growth declines – but resource use
still rises in absolute terms. For example, the G20 countries‘ collective GDP
grew 66 per cent from 1991 to 2007, while its collective ecological footprint
of production grew 26 per cent over the same period. Clearly the resource-
intensity of the countries‘ growth fell by this measure, but the G20‘s
ecological footprint still rose by over a quarter in absolute terms.
In order to achieve environmentally sustainable economic growth at the
global scale, global resource use must fall while GDP continues to rise. This
is absolute decoupling. Given that the planet‘s renewable resources are
already being used far beyond sustainable levels, absolute decoupling is
needed quickly in order to prevent irreversible environmental damage.
Figure 8: GDP growth and resource use: relative and absolute
decoupling
Source: Oxfam ‗G20 countries and carbon dioxide emissions‘
What can we learn about the prospects for decoupling from G20
experience? Carbon dioxide emissions are driving the growth of the
G20’s ecological footprint of production. Given this, and the urgent
need to tackle climate change, we focus here on trends in decoupling
economic output from carbon dioxide emissions over the past two
decades.
Figure 9 shows how G20 countries’ GDP has grown in relation to the
CO2 emissions associated with that output. What does this imply about
the potential for environmentally sustainable economic growth?
23Figure 9: The G20 countries’ growth in GDP versus growth in CO2
emissions from production, 1991–2007
1.5
CHN
Zone 1:
1.3 No decoupling
IND
IDN
Growth in CO2 emissions (producttion based)
1.1
KOR
0.9 TUR
BRA Zone 2:
0.7 Relative decoupling
1991-2007
ARG
0.5
AUS
0.3 CAN
ZAF
JPN USA
0.1 MEX
ITA
GBR
0% 100% 200% 300% 400%
-0.1
FRA
DEU
-0.3
Zone 3:
Absolute decoupling
-0.5
Growth in GDP, 1991-2007
Source: World Bank 2011 (for GDP) and Peters et al (2011)
First, the majority of G20 countries achieved relative decoupling. Most
countries are clustered in Zone 2 where GDP growth was faster than
the growth of CO2 emissions. Among middle-income countries, Mexico
and China achieved the most significant relative decoupling. Mexico’s
GDP grew four times faster than its CO2 emissions. China’s GDP grew
two and a half times faster. This suggests that reducing the carbon-
intensity of economic growth is possible across different levels of
economic development.
Second, a lot more is required. Global CO2 emissions must fall at least
90 per cent by 2050 to prevent dangerous climate change. Countries
have varying responsibilities for making this happen, including those
within the G20. As agreed under the UNFCCC, all countries must take
action to prevent dangerous climate change on the basis of their
‘common but differentiated responsibilities and respective capabilities’.
Industrialized countries (including G20 members Australia, Canada,
France, Germany, Italy, Japan, the Russian Federation, the UK, the
USA, and other EU member states) must cut their emissions fastest and
furthest. This is because of their role in emitting the vast majority of the
atmospheric build-up of CO2 over the last century.
Collectively, those countries need to reduce their CO2 emissions by 40
per cent below 1990 levels by 2020 to be on track to prevent dangerous
climate change. In other words, they must urgently lead in achieving
absolute decoupling of economic growth from CO2 emissions.
24The performance of industrialized countries in the G20 is split. Five
failed to reduce their CO2 emissions levels at all over the period:
Australia, Canada, Italy, Japan, and the USA saw their CO2 emissions of
production rise in absolute terms. This ranged from nine per cent in
Italy to 27 per cent in Australia.
In contrast, Russia saw its emissions fall significantly, but this was
primarily due to industrial decline and stalled economic growth over
the period. Three countries – Germany, France, and the UK – achieved
absolute decoupling. Germany’s GDP, for example, grew 31 per cent
while its production-based emissions fell by 20 per cent.
This evidence of absolute decoupling offers some hope that an era of
sustainable economic growth is technically possible. But there are three
important caveats:
• Absolute decoupling, yes – but not fast enough. Germany, France, and
the UK may have absolutely decoupled economic growth from
producing CO2 emissions over the period. However, their emissions
must fall faster to be on track for the collective cut in developed
countries’ emissions to 40 per cent below 1990 levels by 2020.
Furthermore, all industrialized countries must make this scale of
progress.
• From production to consumption: the record on traded emissions. National
carbon accounting typically focuses on production-based emissions,
but the impact of a nation’s consumption patterns must also be taken
into account. This includes carbon emissions that are embodied in
imports and exports, such as steel, cement, cars, and electronic
goods. Globally, carbon emissions embodied in trade flows have
grown by 80 per cent since 1990, accounting for over a quarter of the
global total by 2008. Developed countries as a group are net carbon
importers. Their collective production emissions fell by almost two
per cent between 1990 and 2008, but, when carbon imports are taken
into account, the true change is an increase in carbon emissions of
seven per cent.66 Therefore, while Germany and France both cut
their consumption emissions on a par with cuts in their production
emissions, the UK’s record reversed. While production emissions fell
four per cent, consumption emissions rose 14 per cent.
• Environmental sustainability is broader than cutting CO2 emissions.
Reducing global CO2 emissions is an urgent priority for preventing
dangerous climate change. But it is just one aspect of environmental
sustainability, and hence sustainable economic growth. Other
environmental concerns, such as the impact of economic growth on
biodiversity and sustainable water use, also need to be taken into
account.
There is some cause for hope, but far more progress is required. The
vast majority of developed countries in the G20 have provided no
evidence that they can make economic growth environmentally
sustainable.
Most countries have barely started to put in place the scale of
investments, regulations, and incentives required to make absolute
decoupling happen fast enough. Even those countries that have led the
transition are not doing enough.
25As a whole, developing countries (led by many members of the G20)
have pledged, under the UNFCCC, to take more tonnes of CO2 out of
the global atmosphere compared to projected levels than developed
countries have.67
The G20 member countries must act far more decisively to bring their
use of natural resources back within the limits of what this planet can
provide. The developed countries must lead in demonstrating that
environmentally sustainable economic growth is possible.
All G20 members must use their influence to ensure that the 2012
Sustainable Development Conference in Rio de Janeiro is a turning
point towards sustainable and internationally equitable use of
resources.
266 What would shared growth
mean?
Tackling inequality is key to reducing poverty. However, as this report
demonstrates, income inequality is growing in many G20 countries.
This section shows just how significant this is for women and men
seeking to escape poverty over the next decade.
A number of economists have developed statistical models of the links
between economic growth, income inequality, and poverty reduction,
which we can use to illustrate the likely impact of inequality on future
poverty levels.
One such model has been developed by Augustin Fosu of the UN
University-World Institute for Development Economics Research68,
building on work by former World Bank chief economist Francois
Bourguignon.69 We have used this model to calculate how different
levels of inequality will affect the number of people living in poverty in
selected G20 countries over the next decade. For more on the model
and calculations, see the annex.
When tested against historical data for our selected countries, the
model proves surprisingly accurate at predicting performance in
absolute poverty rates (that is, people living on less than $1.25 a day).70
This gives us confidence using the model (together with the IMF’s
projections of economic growth and population trends) to illustrate
how inequality could affect future poverty levels.71
The results are dramatic across the three case study countries: Brazil,
Mexico, and South Africa. In Brazil and Mexico, reductions in
inequality (combined with forecast growth rates) could see absolute
income poverty virtually eliminated. While this could still leave many
people living below national poverty lines – which are more sensitive
measures of well-being in different contexts – this would be a hugely
important step forward. However, if inequality is instead allowed to
creep back up, the model predicts that reductions in extreme poverty
would be minimal or even non-existent. In our scenarios, strong
economic growth in South Africa will not stop the number of people
living in poverty increasing by 2020 unless inequality is brought under
control.
Furthermore, it is likely that tackling inequality would reinforce
economic growth. But for the purposes of these case studies, we do not
assume any knock-on impact. We simply aim to illustrate how the
distribution of income becoming more (or less) equal is likely to impact
on poverty, given currently projected growth rates.
27Brazil
Poverty reduction in Brazil is strongly dependent on tacking inequality,
but here past progress on both counts bodes well for the future.
Between 1999 and 2009, nearly 12 million people escaped absolute
poverty (income less than $1.25 a day), bringing the percentage of
Brazilians living in poverty down from 11.2 per cent to 3.8 per cent.72
During the same period, income inequality fell significantly. As
measured by the gini coefficient, it dropped by more than four
percentage points, from 0.52 to around 0.47.73
Although the starting level of inequality was very high, it was this
reduction in inequality that made such extensive poverty reduction
possible, during a period when annualized real growth in GDP per
capita was only around two per cent per year.
Going forward, the IMF projects that Brazil’s GDP will grow rather
faster: at 3.8 per cent in 2011, 3.6 per cent in 2012 and over 4 per cent in
subsequent years. If Brazil continues to grow at approximately this rate
until 2020, and continues current trends in population growth and
reduction in inequality, our model indicates that the number of people
living in poverty will fall by almost two thirds between 2010 and 2020,
a reduction of more than five million.
If inequality is allowed to rise however, there could be little or no
reduction in the numbers living in poverty. If inequality rose at the rate
seen in Indonesia, for example, less than half a million women and men
would escape poverty by 2020 despite strong economic growth.
Achieving a reduction in the Brazilian gini coefficient of inequality by
10 percentage points over the next decade (taking it to a level of
inequality still above the current median for G20 countries), could
reduce the number of people living in absolute poverty by more than 90
per cent. Compared with the situation in which inequality is
unchanged, almost two million additional people would be able to
move out of poverty.
Brazil’s past performance shows how a country with high inequality
and comparatively low growth can substantially reduce poverty by
addressing inequality. Going forward, our model indicates that if
policy makers can intensify their focus on inequality as growth
accelerates – that is, on promoting truly inclusive growth – they could
virtually eradicate absolute poverty.
28You can also read