Mid-Year Economic Report 2018 - Invest Today for Tomorrow - NICO Asset Managers
←
→
Page content transcription
If your browser does not render page correctly, please read the page content below

NICO
                                                  Asset Managers

                                                Invest Today
                                                for Tomorrow

           Mid-Year Economic Report
                    2018

Investment Management | Corporate Finance | Investor Services
MID-YEAR ECONOMIC REPORT-2018

                     LIST OF ACRONYMS
ADF:        African Development Fund
ADMARC:     Agricultural Development Marketing Corporation
AfDB:       African Development Bank
AMIS:       Agriculture Market Information System
BOE:        Bank of England
BHL:        Blantyre Hotels Plc
CPI:        Consumer Price Index
DSI:        Domestic Share Index
ECB:        European Central Bank
ECF:        Extended Credit Facility
EIU:        Economist Intelligence Unit
ESCOM:      Electricity Supply Corporation of Malawi
EUR:        Euro
FEWS NET:   Famine Early Warning Systems Network
FISP:       Farm Input Subsidy Program
FMBCH:      First Merchant Bank Capital Holdings Plc
FOB:        Free on Board
FSI:        Foreign Share Index
GBP:        British Pound Sterling
GDP:        Gross Domestic Product
ICT:        Information and Communication Technology
IDA:        International Development Association
IFAD:       International Fund for Agricultural Development
IFMIS:      Integrated Financial Management Information Systems
IHS4:       Fourth Integrated Household Survey
IMF:        International Monetary Fund
MASI:       Malawi All Share Index
MASL:       Meters Above Sea Level
MERA:       Malawi Energy Regulatory Authority
MK:         Malawi Kwacha
MPC:        Monetary Policy Committee
MPICO:      Malawi Property Investment Company Plc
MSE:        Malawi Stock Exchange
MT:         Metric Tonnes
MRA:        Malawi Revenue Authority
mVAM:       mobile Vulnerability Analysis and Mapping
MW:         Mega Watts
NBM:        National Bank of Malawi Plc
NBS:        NBS Bank Plc
NGOs:       Non-Governmental Organisations
NICO:       NICO Holdings Plc
NITL:       National Investment Trust Plc
MID-YEAR ECONOMIC REPORT-2018

                     LIST OF ACRONYMS
NSO:        National Statistical Office
OECD:       Organisation for Economic Cooperation and Development
OML:        Old Mutual Plc
OMO:        Open Market Operations
OPEC:       Organization of the Petroleum Exporting Countries
PCL:        Press Corporation Plc
RBM:        Reserve Bank of Malawi
Rmb:        Chinese Renminbi
SDF:        Southern Dark Fired Tobacco
Sunbird:    Sunbird Tourism Plc
TB:         Treasury Bills
TCC:        Tobacco Control Commission
“The Fed”   The Federal Reserve Bank Of America
TNM:        Telekom Networks Malawi Plc
WFP:        World Food Programme
TSH:        Tanzania Shillings
UGX:        Ugandan Shillings
UK:         United Kingdom
USA:        United States of America
US$:        United States Dollar
ZAR:        South African Rand
ZMK:        Zambian Kwacha
MID-YEAR ECONOMIC REPORT-2018

                        TABLE OF CONTENTS

Executive Summary…………………………………………………………………………………………… 5-7

Economic Overview…………………………………………………………………………………………… 8-10

Other Market Developments………………………………………………………………………………... 11-20

Regional Developments……………………………………………………………………………………… 21-23

Global Developments………………………………………………………………………………………… 24-26

Outlook for July 2018 and Beyond— Malawi……………………….………………………….....                 27-30

Economic Risks………………………………………………………………………………………………… 31-32

Appendices:

1.   Selected Economic Indicators (Malawi)…………………………………………………………..                33

2.   Selected Economic Indicators (Tanzania, Uganda, Zambia, Mozambique)……………….   33

3.   Budget Framework………………………………………………………………………                                  34

4.   Central Government Budgetary Operations……………………………………………………….. 35

5.   Trend of Debt in Malawi……………………………………………………………………………..                       35

6.   Malawi Selected Economic Indicators……………………………………………………………                   36

7-9. GDP………………………………………………………………………………………………………                                   37-38

10-11. Economic Projections……………………………………………………………………………….. 39-40

12. 2018/19 Budget Brief………………..………………………………………...…………..…………...
                                                                                  41

13. Fews Net Seasonal Calendar for a Typical year…...………………………………………………           42
MID-YEAR ECONOMIC REPORT-2018
EXECUTIVE SUMMARY
Economic Outlook — Malawi
The Kwacha is expected to remain stable against the US Dollar in the short-term as a result of continued
inflow of foreign currency. In the medium term, the Kwacha is expected to depreciate on account of signifi-
cant current account deficits and weak investment inflows.
Food security outcomes are expected to deteriorate during the lean season from October 2018 to January
2019 when food prices are at their highest and local cereal supplies are at their lowest (Source: Fewsnet),
thereby leading to build up in food inflationary pressures. However, significant carry-over stocks from the
previous agricultural season are expected to play an important role in keeping significant food inflationary
pressures in check.
The EIU expects RBM to opt for a modest increase in its policy rate in the second half of 2018 since risks to
inflation outlook remain on the upside (Source: EIU).
Interbank rates are expected to remain susceptible to change due to the volatility of liquidity levels in the
market but are expected to remain within a band of +2%/-4% around the Policy Rate. Treasury bill yields are
expected to remain below the level of monetary policy rate.
Exports performance may be hindered in 2018 on the back of variability in weather conditions, among oth-
ers. Overall, the current-account deficit has been forecasted to rise from an estimated 12.3% of GDP in 2017
to 14.1% in 2018, and to narrow to 12% of GDP in 2020 as agricultural exports recover and food imports
decline. These projections are contingent on normal rainfall patterns.
The government will continue to seek external support from non-traditional partners. The bulk of aid will,
however, continue to be disbursed as project-based grants and off-budget support to non-government agen-
cies.
In 2018, real economic growth is projected to range between 3.60% to 4.50% based on EIU, World Bank, IMF,
Ministry of Finance and RBM forecasts.
Key Economic Risks — Malawi
Insufficient power supply—will lead to lower productivity and dampen economic growth.
High government debt levels—create a future obligation for the government to repay the debt plus interest .
Global oil price increases—will lead to high import costs which may widen the country’s trade deficit.
Persistently weak export base—affects the Kwacha’s stability against the major currencies as import values
exceed export values.
High population growth rates— over-crowding on public resources and may reduce per capita income.
PAGE 5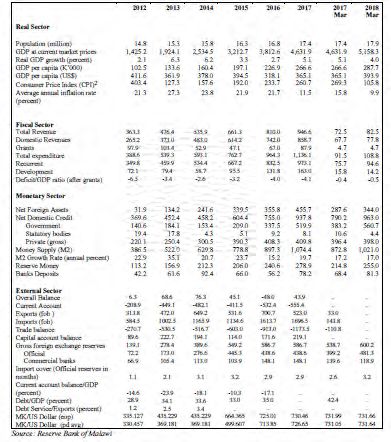
MID-YEAR ECONOMIC REPORT-2018
EXECUTIVE SUMMARY (Continued...)
Economic Highlights For Half Year 2018 — Malawi
Headline inflation for the 5 months ended 31 May 2018 averaged 8.9%, a decline from an average of 15.4%
recorded in the first half year of 2017. This was due to decreases in both food inflation and non-food infla-
tion (Source: NSO).
The all type Treasury bill yield decreased to 14.5% in June 2018 from 15.2% in December 2017 (Source:
RBM).
Liquidity levels averaged K5.71 billion per day in June 2018, decreasing from K6.43 billion per day in De-
cember 2017. Access on the Lombard Facility averaged K5.10 billion per day at an average rate of 18.00%,
decreasing from K5.51 billion per day recorded in December 2017 at an average rate of 19.58%. Overnight
borrowing between banks decreased to an average of K7.62 billion per day in June 2018 at an average rate
of 15.02% from K9.83 billion per day in December 2017 at an average rate of 15.02% (Source: RBM).
During the first half of 2018, the Malawi Kwacha was relatively steady against the US Dollar while it appreci-
ated against the British Pound, the South African Rand and the Euro (Source: RBM).
Total forex reserves in June 2018 decreased to US$1,114.28 million (5.33 months worth of import cover)
from US$1,176 million (5.63 months worth of import cover) recorded in December 2017. (Source: RBM).
The stock market was bullish in the first half of 2018, with the Malawi All Share Index (MASI) increasing by
42.31% to settle at 30,736.95 points in June 2018 from 21,598.04 points in December 2017 (June 2017:
18.41% increase) (Source: MSE).
Although the improved rainfall performance in February and March 2018 led to revitalization in some
crops, below average production is still expected for the 2018 agricultural season due to lack of adequate
rainfall during the critical crop growing periods (Source: FEWS.NET).
During the 2018 tobacco marketing season, it was estimated that a total of 147.8 million kg of all tobacco
would be sold against the demand of 171 million kg of all tobacco, representing 14% below demand require-
ment (Source: TCC).
The Malawi Energy Regulatory Authority (MERA) maintained fuel pump prices at K824.70, K815.80 and
K648.70 for Petrol, Diesel and Paraffin respectively, during the two reviews that took place in the first half
of 2018, amidst rising global oil prices (Source: MERA).
The MPC decided to maintain the Policy Rate at 16% during the two MPC meetings conducted in the first half
of 2018 (Source: 2018).
On 5 February 2018, the Ministry of Finance, Economic Planning and Development released the 2018/19
budget statement in which the budget was set at K1.5 trillion, and was later revised downwards by K50 bil-
lion in June 2018 (Source: Ministry of Finance, Economic Planning and Development)
PAGE 6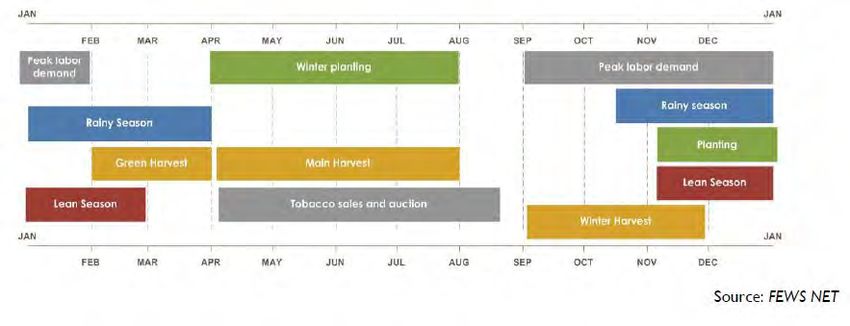
MID-YEAR ECONOMIC REPORT-2018
EXECUTIVE SUMMARY (Continued...)
Economic Highlights For Half Year 2018 — Malawi (Continued)
The President of Malawi delivered a State of the Nation Address on 4 May 2018 during the opening of the
third meeting of the 47th session of parliament and 2018/19 budget meeting in Lilongwe.
The IMF team visited Malawi on 14 January 2018 to conduct the 2018 Article IV Consultation and hold dis-
cussions with Malawian authorities on the program supported by the IMF’s Extended Credit Facility. On 30
April 2018, the Executive Board of the International Monetary Fund (IMF) approved a new three-year ar-
rangement for Malawi under the Extended Credit Facility (ECF).
The Ministry of Finance, Economic Planning and Development launched the MGDS III (2017-2022), whose
overarching theme is “Building a Productive, Competitive and Resilient Nation”. This is the fourth and the
final medium-term national development strategy which is formulated to contribute to the attainment of
the country’s long term development goals enshrined in the Vision 2020.
In April 2018, the Ministry of Finance, Economic Planning and Development published its Economic and Fis-
cal Policy Statement (EFPS) for 2018 which among other things, the ministry explained how the five key pri-
ority areas in MGDS III would be financed.
PAGE 7
MID-YEAR ECONOMIC REPORT-2018

   1.      ECONOMIC OVERVIEW
Inflation (Source: NSO)                                                                          Inflation (%) (Source: NSO)
                                                                              20.0
Headline inflation for the 5 months ended 31 May 2018 averaged                                                                     National

8.9%, a decline from an average of 15.4% recorded in the first 5                                                                   Food
                                                                              15.0
                                                                                                                                   Non food
months of 2017. This was due to decreases in both food inflation
and non-food inflation. Food inflation declined to an average of              10.0
9.0% from an average of 16.3% recorded in the first 5 months of
                                                                               5.0
2017, while non-food inflation averaged 9.2%, a decline from an
average of 14.4% recorded in the first 5 months of 2017.
                                                                                -

                                                        Change      Change

                      May-18   Dec-17        May-17    5 Months 12 Months
Headline inflation        8.9%     7.1%          12.3%       1.80%   -3.40%
                                                                                          Treasury Bill Yields (%) (Source: RBM)
Food                      9.5%     4.3%          11.2%       5.20%   -1.70%
                                                                              30.00
Non-food                  8.4%    10.0%          13.5%      -1.60%   -5.10%
                                                                              28.00
                                                                                                                                    91-day
                                                                              26.00
Government Securities (Source: RBM)                                                                                                 182-day
                                                                              24.00
                                                                                                                                    364-day
                                                                              22.00
Treasury bill yields decreased on all tenors during the first half
                                                                              20.00
of 2018. The all type Treasury bill yield decreased to 14.5% in               18.00
June 2018 from 15.2% in December 2017 (June 2017: 22.09%)                     16.00
                                                                              14.00
Total Treasury bill applications for the month of June 2018 stood 12.00
at K33.28 billion and K31.61 billion was allotted representing a 10.00
5.02% rejection rate. In December 2017, total treasury bill appli-
cations stood at K14.80 billion and K13.94 billion was allotted
representing 5.83% rejection rate. The 364 days paper accounted
for the highest subscription rate for the month of June 2018 at
46.84%, followed by the 182 days paper at 38.82% and the 91 Subscriptions per TB Tenor for June 2018
days paper at 14.35% (December 2017: 364 days at 75.35% fol-
lowed by 91 days at 14.74%, and 182 days at 9.92%).                     364-day                      91-day
                                                                                        TB                                                  TB
                                                                                      46.84%                                              14.35%
                                                     Change       Change
 Treasury bills      Jun-18       Dec-17   Jun-17   6 Mo nths    12 mo nths
     91-day          14.00%       14.73%   21.42%     -0.73%       -7.42%
    182-day          14.50%       15.10%   21.94%     -0.60%       -7.44%
    364-day          15.00%       15.77%   22.92%     -0.77%       -7.92%
 All type yield      14.50%       15.20%   22.09%     -0.70%       -7.59%

There were Open Market Operations (OMO) conducted in June
                                                                                                                                     182-day
2018 totaling to K56.29 billion (December 2017: K108.56 billion)                                                                        TB
at an average rate of 15.01% (December 2017: 15.78%) against                                                                          38.82%
maturities of K101.34 billion (December 2017: K94.56 billion).

                  PAGE        8
MID-YEAR ECONOMIC REPORT-2018

1. ECONOMIC OVERVIEW (Continued...)
Foreign Currency Market (Source: RBM)                                                USD/MWK Exchange Rate (Source: RBM)
                                                                               740
During the first half of 2018, the Malawi Kwacha was
relatively steady against the US Dollar while it appreci-                      730
ated against the British Pound, the South African Rand
and the Euro. The Kwacha closed the period at K730.73                          720
against the US Dollar from K732.03 in December 2017,                           710
a marginal appreciation of 0.18%.
                                                                               700

                                                       % Movement % Movement   690
CURRENCY          Jun-18       Dec-17       Jun-17      6 months   12 months
MK/US Dollar          730.73       732.03     728.51      0.18%      -0.30%
MK/GBP                956.98       979.53     948.08     2.30%       -0.94%
MK/ZAR                 53.15        59.04      55.91     9.98%       4.94%
MK/EUR                842.94       869.07     831.47     3.01%       -1.38%
                                                                                     Forex Reserves (US$ million) (Source: RBM)
As at end of June 2018, gross official reserves totaled
US$728.10 million (3.48 months of import cover), de- 1,000.00
creasing from US$761.97 million (3.65 months of im- 800.00
port cover) registered at the end of December 2017 600.00
(June 2017: US$678.70 million worth of 3.25 months of
                                                        400.00
import cover). Private sector reserves amounted to
US$386.18 million (1.85 months of import cover) as at 200.00
end of June 2018, decreasing from US$414.03 million         -
(1.98 months of import cover) recorded in December            Jun-17                    Aug-17     Oct-17    Dec-17    Feb-18     Apr-18   Jun-18

2017 (June 2017: US$356.40 million worth 1.71 months                                     Official Reserves    Private Sec. Reserves
of import cover).

Total forex reserves in June 2018 decreased to
US$1,114.28 million (5.33 months worth of import cov-
er) from US$1,176 million (5.63 months worth of im-
port cover) recorded in December 2017. Total forex
reserves of US$1,035.10 million (4.96 months of import
cover) were recorded in June 2017. The total import
cover requirement per month is US$209 million.

                                    Jun-18                           Dec-17                           Jun-17
                                       Import Cover                     Import Cover                     Import Cover
                      (US$ million)    (Months)        (US$ million)    (Months)        (US$ million)    (Months)
Gross Official                  728.10            3.48           761.97            3.65           678.70            3.25
Private Sector                  386.18            1.85           414.03            1.98           356.40            1.71
   Total                     1,114.28            5.33          1,176.00            5.63         1,035.10            4.96

               PAGE    9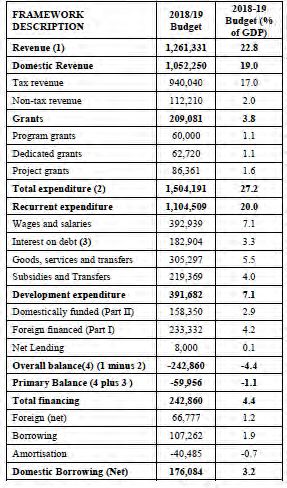
MID-YEAR ECONOMIC REPORT-2018
1. ECONOMIC OVERVIEW (Continued...)
Interbank Markets and Interest Rates (Source: RBM) Liquidity (Source:RBM)
27
Liquidity levels decreased in June 2018, averaging K5.71 billion 22
Kwacha Billions
per day from K6.43 billion per day in December 2017. Access on 17
the Lombard Facility (discount window borrowing) averaged K5.10 12
billion per day at an average rate of 18.00%, decreasing from K5.51 7
billion per day recorded in December 2017 at an average rate of 2
(3)
19.58%.
Overnight borrowing between banks decreased to an average of
Monetary Policy and Average Interbank
K7.62 billion per day in June 2018 at an average rate of 15.02% Rates (%) (Source: RBM)
from K9.83 billion per day in December 2017 at an average rate of 30.00
15.02%. 25.00
20.00
Stock Market (Source: MSE)
15.00
The stock market was bullish in the first half of 2018, with the
10.00
Malawi All Share Index (MASI) increasing by 42.31% to settle at
30,736.95 points in June 2018 from 21,598.04 points in December
Interbank rates Monetary Policy rate
2017 (June 2017: 18.41% increase). The year to date return for the
MASI stood at 42.31% as at end of June 2018 compared to 18.41% Change Change
Jun-18 Dec-17 Jun-17 (6 Months) (12 months)
recorded in the first of 2017. The Domestic Share Index (DSI) in-
creased by 23.11% to 20,033.47 points in June 2018 from MK/Share MK/Share MK/Share % %
BHL 7.00 28.00 20.25
16,272.64 points recorded in December 2017 (June 2017: 18.46%
FMB N/A 48.00 18.51 N/A N/A
increase). The Foreign Share Index (FSI) increased by 134.07% to ILLOVO 240.00 240.00 216.15 0.00% 11.03%
8,237.82 points from 3,519.43 points in December 2017 (June MPICO 19.49 15.61 8.00 24.86% 143.63%
2017: 14.76% change). NBM 300.00 270.08 262.00 11.08% 14.50%
NBS 8.66 8.50 6.00 1.88% 44.33%
NICO 46.00 34.00 12.08 35.29% 280.79%
All counters registered share price gains for the first half of 2018 NITL 73.00 60.06 36.50 21.55% 100.00%
except Illovo which remained steady at K240.00. The following are PCL 772.00 600.00 570.00 28.67% 35.44%
STANDARD 670.00 610.00 570.01 9.84% 17.54%
the percentage share price gains: MPICO (24.86%), National Bank
SUNBIRD 145.00 96.00 64.00 51.04% 126.56%
(11.08%), NBS (1.88%), NICO (35.29%), NITL (21.55%), PCL (28.67%), TNM 24.00 14.50 9.33 65.52% 157.23%
Standard Bank (9.84%), Sunbird (51.04%), TNM (65.52%), FMBCH FMBCH 160.00 67.00 N/A 138.81% N/A
(138.81%) and Old Mutual (52.04%). OML 2,980.00 1,960.00 1,850.00 52.04% 61.08%
MASI 30,736.95 21,598.07 14,577.62 42.31% 110.85%
In May 2018, BHL listed bonus shares on the MSE and announced a DSI 20,033.47 16,272.64 11,437.62 23.11% 75.15%
share split which saw each BHL share being split into five. This FSI 8,237.82 3,519.43 2,308.83 134.07% 256.80%
led to an increase in the firm’s total number of shares from Malawi Stock Exchange Performance (Source: MSE )
129,192,416 to 839,750,705, trading at K5.40 each share. As at
32,000
end of June 2018, BHL was trading at K7.00 per share. In March MASI
28,000
2016, Old Mutual plc announced the separation of its underlying
24,000
businesses into independently-listed, standalone entities. On 25
Points
June 2018, Old Mutual plc Shares were delisted from the Johan- 20,000
nesburg Stock Exchange, the Namibian Stock Exchange, the Zimba- 16,000
bwe Stock Exchange and the Malawi Stock Exchange. This saw list- 12,000
Mar-18
Apr-18
Jun-17
Jun-18
ing of Old Mutual Limited on the Malawi Stock Exchange.
Jan-18
Aug-17
Dec-17
Jul-17
Sep-17
Oct-17
Feb-18
May-18
Nov-17
PAGE 10MID-YEAR ECONOMIC REPORT-2018
2. OTHER MARKET DEVELOPMENTS
Food Security Update (Source: FEWS.NET)
Below average rainfall was mostly experienced across the country during the 2017/18 farming season. In addition
to the dry spell, the infestation of crops by fall army worms (FAW) also threatened this year’s agricultural output.
According to Agriculture Extension and Technical Services of the Ministry of Agriculture, approximately 270,000
hectares of maize, sorghum and millet had been infested by fall army worms during the main cropping season as
of 12 January 2018. However, just few months from the harvesting period, national food stocks were above aver-
age and national stocks in ADMARC and Strategic Grain Reserves were over 200,000MT. Maize prices in the local
markets were low and averaging about MK105/kg with a range of MK70 to MK140/kg in January 2018. Maize pric-
es in ADMARC markets remained at a higher fixed price of MK250/kg, but prices in local markets were still less
than half of ADMARC prices. However, maize prices in local markets increased during the last week of January
2018 after remaining stable since June 2017. The increase was attributed to a supply decrease as some farmers
and traders started hoarding their stocks because of the poor 2017/18 agricultural season.
Although the improved rainfall performance in February and March 2018 led to revitalization in some crops, be-
low average production was estimated for the 2018 agricultural season due to lack of adequate rainfall during the
critical crop growing periods. With the arrival of new harvests following the commencement of the harvesting sea-
son in April 2018, prices for staple maize followed typical trends and decreased 5 to 20 percent between April
and May 2018 in most markets across the country and maize prices were 8 to 33 percent below the five-year aver-
age. As the post-harvest period continues, Fewsnet expects poor households in districts in southern and central
regions to be faced with stressed food security outcomes from June to September 2018. The food security out-
comes in these areas is expected to deteriorate further during the lean season from October 2018 to January 2019
when food prices are at their highest and local cereal supplies are at their lowest. Drivers of the projected area
outcome include below-average access to income from casual labour opportunities and crop sales because of the
dryness and erratic rains during the 2017/18 cropping season, and projected above-average maize prices from
November 2018 to January 2019.
Agriculture Production Estimates (Sources: Ministry of Agriculture, Irrigation and Water Development, Few-
snet)
On 5 February 2018, the Ministry of Agriculture, Irrigation and Water Development stated that maize production
for the 2017/18 growing season would reduce by 283,941 metric tons which is about 8% of the estimated 3.5 mil-
lion tons produced in 2017. Furthermore, about 1.9 million families were estimated to face food shortage. About
210,740 metric tons of maize production was estimated to be lost to the dry spell and 73,201 metric tons to fall
army worms. In an attempt to address these risks, the Ministry of Agriculture, Irrigation and Water Development
outlined a number of initiatives to ensure the country remains food secure, some of which were intensifying
armyworm control measures, and implementation of maize export ban, which was also implemented in early 2017
and lifted in October 2017. National fall army worms monitoring, surveillance and control was also implemented
continuing through FAW management and control, as well as pesticide handling trainings.
The second round production estimates showed that overall cereal production for the 2017/18 season was below
average. Production of maize was 15% below the five-year average and other crops that registered a decrease in-
clude groundnuts, pulses, and cotton. Despite these reductions, maize grain is readily available in markets and
carryover stocks from the previous season will fill some of the national requirement gap.
PAGE 11MID-YEAR ECONOMIC REPORT-2018
2. OTHER MARKET DEVELOPMENTS
Tobacco Market Update (Source: TCC)
The 2018 tobacco marketing season for Malawi commenced on 9 April 2018 with the official opening at the main
market of Lilongwe Auction Floors presided over by President Arthur Peter Mutharika. Chinkhoma Auction floors
and Limbe Auction Floors opened on 16 and 23 April respectively. Even though the average tobacco prices for this
year’s marketing season are generally lower than those recorded in the previous season, higher tobacco volumes
have been registered this season, thereby entailing higher sales value than those recorded in the previous market-
ing season. Overall, it was estimated that a total of 147.8 million kg of all tobacco would be sold against the de-
mand of 171 million kg of all tobacco, representing 14% below demand requirement.
The cumulative tobacco sales results for thirteenth week of the tobacco marketing season have shown that the
tobacco average price declined by 11.55% to US$1.73/kg from US$1.96/kg recorded in the corresponding period
during the 2017 tobacco marketing season. Despite this price decline, the value of tobacco traded was 27.55%
higher than that registered in the previous corresponding period. The following are the cumulative sales results
for the thirteenth week of the tobacco marketing season compared to the same period in 2017:
The trend of average prices and average sales value are depicted below:
2018 Tobacco Sales: Week Ten Cumulative Sales Versus Same Period in 2017
National 2017 2018 % Change
Volume (Kg Million) 87.98 126.88 44.22%
Value (US$ Million) 172.39 219.88 27.55%
Average Price (US$/Kg) 1.96 1.73 -11.55%
Average Tobacco Prices (USCents/Kg) Sales Value (US$)
220.00 250,000,000
200,000,000
190.00
150,000,000
160.00
100,000,000
130.00
50,000,000
100.00 -
2018 2017 2018 2017
PAGE 12MID-YEAR ECONOMIC REPORT-2018
2. OTHER MARKET DEVELOPMENTS
Review of Fuel Prices and Electricity Tariffs Update (Source: MERA)
The Malawi Energy Regulatory Authority (MERA) maintained fuel pump prices at K824.70, K815.80 and K648.70
for Petrol, Diesel and Paraffin respectively, during the two reviews that took place in the first half of 2018, amidst
rising global oil prices, opting to apply the Price Stabilization Fund.
During the first fuel prices review conducted in April 2018, MERA observed that the landed costs of Petrol, Diesel
and Paraffin increased by 6.29%, 12.76% and 15.45% respectively. During the second review conducted in May
2018, the landed costs of Petrol, Diesel and Paraffin were noted to have increased by 17.45%, 21.25% and 28.91%
respectively. These increases qualified all the three petroleum products for an upward pump price adjustment
since they were beyond the +/-5% trigger limit. However, MERA resolved to maintain the pump prices for all the
three products as implemented on 4 November 2016 and apply the Price Stabilisation Fund (PSF) to cover the in-
creased landed costs of the three products.
On electricity, in April 2014, MERA approved a second base tariff for ESCOM for a four year period from 2014 to
2018 which expired on 30 June 2018. Consequently, ESCOM has submitted an application to MERA for a new base
tariff that will be implemented over a four year period from July 2018 to June 2022.
First and Second Statement of the Monetary Policy Committee (MPC) Meeting for 2018 (Source: RBM)
At its first meeting held on 27-28 March 2018, the MPC decided to maintain the Policy Rate at 16%. In coming up
with this decision, the committee observed that despite sustained decelerations in inflation in 2017, upside risks
to inflation outlook still persisted. These included the possible further increase in utility tariffs and the potential-
ly unchanged fiscal policy stance. The committee also decided to maintain the Liquidity Reserve Requirement
(LRR) at 7.5% and the Lombard Rate at 200 basis points above the Policy Rate. The MPC stated that maintaining
the monetary stance was appropriate to consolidate the gains made especially the achievement of a single digit
inflation.
On 4 July 2018, the Monetary Policy Committee released a second statement on the monetary policy stance follow-
ing the MPC meeting held from 3rd and 4th July 2018. The Committee observed that inflation during the first half
of 2018 remained somewhat elevated due to rebasing effects of the Consumer Price Index (CPI), electricity tariff
adjustment in May 2018, a jump in maize prices in January and February 2018 on account of speculation, and
fiscal pressures. Going forward, these risks coupled with rising global oil market prices are expected to per-sist in
the near-term. The Committee therefore suggested that maintaining the current monetary policy stance will help
in containing the risks and directing inflation towards the medium-term objective of 5%. This policy stance will be
complemented by consistent mop-up operations to maintain tight liquidity conditions in the market. Con-
sequently, the Committee resolved to maintain the monetary policy rate at 16% and keep the Liquidity Reserve
Requirement (LRR) ratio at 7.5%.
PAGE 13MID-YEAR ECONOMIC REPORT-2018
2. OTHER MARKET DEVELOPMENTS (Continued…)
Month-on-Month Fiscal Deficit Narrows Significantly as at April 2018 (Source: RBM)
The Reserve Bank of Malawi, on 11 June 2018, released its April 2018 Monthly Economic Review, which among oth-
er developments, showed that month-on-month fiscal deficit narrowed significantly to K3.7 billion from a deficit
of K26.3 billion recorded at the end of March 2018. During the corresponding month of April 2017, fiscal deficit
was at 20.4 billion. Total government revenues in April 2018 rose by 15.7% to K95.4 billion following another in-
crease in revenues of 12% to K82.5 billion in March 2018. Year on year, revenues recorded a growth of 3.8% from
K92 billion in April 2017. The revenue increase in the month was driven by growth in domestic revenues which
rose by K14 billion to K91.9 billion due to both tax and non-tax components. However, foreign inflows declined
during the month by 23.3% to K3.6 billion (US$4.9 million) from K4.7 billion (US$6.4 million) recorded in March
2018. Total government expenditures in April 2018 declined by K9.7 billion to K99.1 billion, following another de-
crease of K4.5 billion recorded in March 2018. This decline was on account of a decline in recurrent expenditure by
4.9% to K82.7 billion. However, development expenditure increased by 2.6% to K146.4 billion.
On a related note, the public sector owed the banking system a total of K567.3 billion as at end of April 2018, a
decrease from K576.9 billion in the preceding month. Net credit to the central government from the monetary au-
thorities went down by K66.7 billion to K362.9 billion compared to a drop of K2.9 billion to K279.6 billion in April
2017 as government repaid its outstanding Ways and Means advances and RBM off-loaded Treasury Notes and Bills
on the secondary market. On the other hand, net credit to central government from the commercial banks in-
creased by K51 billion to K193.8 billion largely due to RBM offloading of securities to the market and the commer-
cial banks increasing their holding of these securities.
The Reserve Bank Of Malawi Reports a Stable and Sound Financial Sector in 2017 (Source: RBM)
The Reserve Bank of Malawi, on 4 July 2018, released its Financial Institutions Supervision annual report for 2017
which has generally described the financial sector’s performance in 2017 as sound and stable, owing to a relatively
stable macroeconomic outturn. The Malawi’s banking sector’s satisfactory performance was generally supported by
favourable macroeconomic outcomes. Its assets grew by 26.8% to K1,572.3 billion. The Malawi Stock Exchange also
performed satisfactorily in 2017, with the Malawi All Share Index (MASI) registering a positive return in 2017 of
62.1% from a negative return of 8.5% in 2016, following improved performance in all listed companies. The sector,
however, continued to rely heavily on income from money market operations.
The pension sector has been steadily growing over the recent years, and during 2017, both contributions and as-
sets significantly grew on account of growing membership to the pension scheme. Investment income also in-
creased largely on account of the positive performance of the stock market. The sector’s assets grew by 39.8% to
K532.2 billion. The general insurance sector registered significant growth in both premiums and total assets, alt-
hough at a slightly slower pace compared to 2016. Total assets grew by 12.9% to K43.0 billion in 2017. However,
the sector experienced solvency and liquidity challenges largely due to high level of insurance receivables. The life
insurance sector also registered growth in gross premiums written and improvement in profitability. This growth is
attributable to an increase in annuity products as well as increased adoption of annual inflation-linked premium on
most individual life products. Its assets grew by 42.2% to K473.2 billion.
Lastly, the microfinance industry performed well during the year 2017, as aggregate assets for the whole industry
increased to K37.5 billion in 2017 from K35.4 billion in 2016. Individually, the performance was mixed as while
depositing taking microfinance institutions, credit agencies improved, non-deposit taking microfinance agencies
did not perform well.
PAGE 14MID-YEAR ECONOMIC REPORT-2018
2. OTHER MARKET DEVELOPMENTS (Continued…)
2018/19 National Budget Brief (Source: The Ministry of Finance, Economic Planning and Development)
On 5 February 2018, the Ministry of Finance, Economic Planning and Development released the 2018/19 budget
statement. The budget focuses on robust economic growth as the main goal of economic management alongside
the maintenance of macroeconomic stability for robust, inclusive and sustainable growth. Below is the summary of
the budget:
• The budget was set at K1.5 trillion which is 28.2% of GDP, compared to K1.3 trillion 2017/18 budget, rep-
resenting a 15.4% increase.
• The development budget has been increased by 25.6% over the 2017/18 budget to K391.7 billion, representing
7.3% of GDP.
• The recurrent expenditure is estimated at K1.10 trillion (20.7% of GDP) compared to K948.9 million in the
2017/18 budget.
• Revenue and Grants are projected at K1.26 trillion (23.6% of GDP) which is a 13.8% increase from K1.11 trillion
in the 2017/18 budget.
• Domestic revenue has been set at K1.05 trillion, representing 19% of GDP and Grants are programmed to reach
K209 billion (3.9% of GDP).
• The fiscal deficit is expected to amount to K242 billion (4.5% of GDP) from a deficit of K193 billion in the pre-
ceding budget (3.9% of GDP).
• In view of diminished net foreign borrowing, domestic borrowing is expected to rise to K176 billion which is
3.2% of GDP.
• The allocations to key sectors include: K156 billion to agriculture sector, K87 billion to the health sector, K149
billion to the education sector, K115 billion to the transport sector, and K 22 billion to the energy sector as
illustrated below:
Key Sectoral Allocation (MK'Billion)
Energy, 22.44
Health, 86.71
Agriculture,
156.09
Transport,
114.64
Education,
148.70
Revision of the 2018/19 National Budget (Source: The Ministry of Finance, Economic Planning and Develop-
ment)
In June 2018, The Ministry of Finance, Economic Planning and Development announced the reduction of the
2018/19 national budget from the initial proposed budget of K1.504 trillion to K1.403 trillion. This translates into
a reduction of the deficit inclusive grants or the overall balance by about K50.0 billion from an earlier projected
4.5% of GDP inclusive grants to 3.8% of GDP. The Ministry cited concerns over large budgetary deficit which could
consequently lead to heavy domestic debt burden as the reason for the downward revision.
PAGE 15MID-YEAR ECONOMIC REPORT-2018
2. OTHER MARKET DEVELOPMENTS (Continued…)
State of the Nation Address by President of Malawi
The President of Malawi delivered a State of the Nation Address on 4 May 2018 during the opening of the third
meeting of the 47th session of parliament and 2018/19 budget meeting in Lilongwe. Below is the summary of the
some of the highlights made during the presentation:
Economic Growth
Following macroeconomic stability, real GDP growth rate is expected at 4.0% in 2018 and 6% in 2019.
Agriculture
The government intends to transform agriculture by moving from subsistence to commercial farming. In order to
achieve this goal, government is implementing the Malawi Agricultural Commercialisation Project to select and
focus on crops for value chains. Agricultural Sector-Wide Approach Programme will be implemented to enable
small-holder farmers to have access to investment capital and markets.
Mining Development
Some of the initiatives in mining development include capacity building in mining contract negotiation and in de-
velopment of modern mining agreements. A regionally competitive Mining Fiscal Regime has also been adopt-ed to
ensure that investors will have confidence in the sector. The Mines and Minerals Act of 1981 and the Petro-leum
Act of 1983 are being reviewed to improve the legal environment of the mining industry to enhance devel-opment
of the sector and increase its benefits to the people.
Private Sector development, Industry and Trade
The government is promoting Foreign Direct Investment to help the country move from aid to trade. Private sec-tor
investment is needed for job creation and an expanded revenue base.
Public Health
The government intends to improve access to health services by expanding some of the existing health facilities
and constructing new ones. Construction of Malawi’s first-ever national Cancer Centre is expected to be complet-ed
before the end of this year. Government has procured medical equipment worth US$5.9 million for 49 health facili-
ties. Each of the 49 facilities will get standard minimum package of the equipment required to provide es-sential
health care. Government is also recruiting 858 health workers for the different levels of the health care system us-
ing the current Global Fund grant. Cabinet has also approved the Pharmacy and Medicines Regulation Bill, 2018,
which provides stiffer penalties for offenders in drug supplies.
Energy
The President expects the current power supply of 360MW to double to 720MW by 2020 and 1,000MW by 2023.
Measures to this goal include diversification into coal energy, wind power, solar power, gas power and expand the
current hydro system by building dams. The government is also working on inter-connections with neigh-bouring
countries to tap power.
Land, Housing and Urban Development
In the 2017/18 financial year, government continued to implement measures aimed at improving land tenure and
security. This year, government will develop subsidiary legislation for land related laws that were enacted in 2016.
Currently, only the subsidiary legislation for the Customary Land Act has been finalized and is currently in force.
Government will also develop and implement a rollout road map for the improved land administration and govern-
ance programme in line with the new Land Laws.
PAGE 16MID-YEAR ECONOMIC REPORT-2018
2. OTHER MARKET DEVELOPMENTS (Continued…)
Published Half Year Financial and Trading Statements (Sources: BHL Plc, NBS Plc, NITL Plc, NICO Holdings Plc,
TNM Plc, Standard Bank Plc)
The following companies have released their financial and trading statements for the half year ended 30 June 2018
as follows:
PUBLISHED HALF YEAR FINANCIALS
HY 2017 HY 2018 % Change
BHL 0.23 0.17 -26%
TRADING STATEMENTS FOR THE HALF YEAR ENDED 30 JUNE 2018
COUNTER DESCRIPTION
NBS Plc
Expects profit after tax to be approximately 140% higher than the loss rec-
orded during the previous corresponding period.
Expects profit after tax to be more than 35% higher than the previous corre-
NITL Plc
sponding period.
Expects profit after tax to be more than 50% higher than the previous corre-
Press Corporation Plc
sponding period.
Expects profit after tax to be more than 24% higher than the previous corre-
NICO Holdings Plc
sponding period.
TNM Plc Expects profit after tax to be more than 40% higher than the previous corre-
sponding period.
Expects profit after tax to be less than 40% from the previous corresponding
Standard Bank plc
period.
• Blantyre Hotels Plc Half Year Financial Performance (Source: BHL Plc)
Blantyre Hotels Plc registered a drop in revenue for the half year ended 30 June 2018 by 0.22% to K1,966 million
from K1,970 million recorded in the same period last year. The company attributes this drop to lower occupancy
on account of a slowdown in corporate level travel against the same time last year. This impacted both rooms
and incidental revenues.
Direct expenses grew by 4% to K888 million from K854 million due to inflation adjusted costs which averaged
8.1%in the period. Persistent power cuts, which forced the company to rely on more expensive power generation
alternatives also contributed to this rise. Hence, profits after tax declined by 27% to K165.39 million from
K225.15 million over the review period.
PAGE 17MID-YEAR ECONOMIC REPORT-2018
2. OTHER MARKET DEVELOPMENTS (Continued…)
The IMF Executive Board Approved US$112.3 Million under the Extended Credit Facility (ECF) Arrangement for
Malawi (Sources: IMF)
The IMF team visited Malawi on 14 January 2018 to conduct the 2018 Article IV Consultation and hold discussions
with Malawian authorities on the program supported by the IMF’s Extended Credit Facility. The two teams reached
staff-level agreement on a three-year program that could be supported by the ECF pending IMF’s Board approval in
April 2018.
On 30 April 2018, the Executive Board of the International Monetary Fund (IMF) approved a new three-year arrange
-ment for Malawi under the Extended Credit Facility (ECF) for Special Drawing Rights (SDR) worth 78.075 million
(about US$112.3 million), equivalent of 56.25% of Malawi’s quota in the IMF, to support the country’s economic and
financial reforms. This decision enabled an immediate disbursement of SDR11.15 million (about US$16 million)
with the remaining amount phased over the duration of the program, subject to semi-annual reviews.
The authorities’ ECF-supported program aims to entrench macroeconomic stability and to foster higher, more in-
clusive, and resilient growth. According to the IMF, this will be achieved through fiscal consolidation to ensure long
-term debt and external sustainability; containing inflation; focusing policies on poverty-reducing and resilient
growth by raising the amount and quality of spending on critical infrastructure and social sectors; tackling govern-
ance challenges through improved public financial management and procurement; improving financial intermedia-
tion and strengthening access to finance; and advancing critical growth-supporting structural reforms.
The following is the summary of the statement made during the meeting:
• Malawi has shown progress in achieving macroeconomic stabilisation following two years of drought, with a
rebound in growth and inflation reduced to single digits. However, the fiscal position has deteriorated and the
public debt to GDP ratio has risen. Increased debt service pressures have reduced space for needed infrastruc-
ture and social spending.
• The authorities are making efforts to entrench macroeconomic stability, raise growth and reduce poverty. Fis-
cal consolidation will ensure long-term debt and external sustainability. This, combined with continued
strengthening of the monetary policy framework, will contain inflation and reduce fiscal dominance. The
amount and quality of spending on critical infrastructure and social sectors will be raised. Governance will be
improved through reforms in public financial management and procurement.
• Improved financial intermediation, access to finance, and other critical growth-supporting structural reforms
will be advanced.
• The medium-term economic outlook is favourable, with private sector activity expected to benefit from better
infrastructure and an improved business climate. Progress will depend on the authorities’ strong ownership to
support successful implementation of their program.
The Malawi Growth and Development Strategy (MGDS) III (Source: Ministry of Finance, Economic Planning and
Development)
The MGDS III, whose overarching theme is “Building a Productive, Competitive and Resilient Nation”, is the fourth
and the final medium-term national development strategy which is formulated to contribute to the attainment of
the country’s long term development goals enshrined in the Vision 2020. The strategy will be implemented from
2017 to 2022, replacing MGDS II which was phased out in June 2016. The successor strategy has departed from the
formulation of multiple thematic areas by going straight into the choice of five key priority areas, which are said to
PAGE 18MID-YEAR ECONOMIC REPORT-2018
2. OTHER MARKET DEVELOPMENTS (Continued…)
The Malawi Growth and Development Strategy (MGDS) III (Source: Ministry of Finance, Economic Planning and
Development) (Continued)
be carefully selected in order to spur growth and address the bottlenecks to growth and development. The idea is
to maximize social and economic benefits of all the investments that will be done in the period. The effective im-
plementation of the five key priority areas is expected to translate into integrated impacts which will positively
affect other sectors through positively reinforcing multiple loops. Below is the summary of the identified five key
priority areas:
1. Agriculture, water development and climate change and management
The goal is to achieve sustainable agricultural transformation and water development that is adaptive to climate
change and enhance ecosystem services. A number of strategies will be put in place to address the adverse ef-
fects that climate change has on the agricultural sector through adaptation and mitigation. Adaptation will en-
hance preparation for and negate the effects of climate change, thereby reducing vulnerability of communities
and ecosystems. On the other hand, mitigation avoids escalating the risk of climate change by reducing further
release of Green House Gases (GHGs) and by sequestration of GHGs from the atmosphere.
2. Education and Skills Development
The goal is to improve quality and relevant education and skills for all. To achieve this, Malawi needs to improve
the transition rate from primary to secondary to tertiary level. The education system needs to be reformed to
include entrepreneurship, skills development in order to improve employability of young Malawians and reduce
youth unemployment.
3. Energy, Industry and Tourism Development
The goal is to provide sufficient sustainable energy for industrial and socio-economic development. Industriali-
zation and structural transformation of the economy are essential to maintain the rapid long-term economic
growth of a country. Industrialization also benefits other sectors such as Tourism, Health and Education, all of
which relay on energy development. Attention will also be put on mining exploration, extraction and regulation
to unleash the sector potential and empower the rural masses who live around mining sites.
4. Transport and ICT Infrastructure
The goal is to develop a safe, affordable, reliable, equitable and sustainable transport and ICT infrastructure.
High costs and poor access to reliable transport and ICT infrastructure in the country remain an important
threat to faster economic growth. Population growth on the other hand has continued to undermine the pro-
gress that has been made towards infrastructure development. In this regard, a conducive environment will be
provided for continued investments in maintenance, expansion and modernization of infrastructure.
5. Health and Population
The goal is to improve health and quality of the population for sustainable socio-economic development. Im-
proving health outcomes is essential and also a prerequisite for increased national productivity, accelerated eco-
nomic growth and poverty reduction. However, the health care system faces challenges which include shortage
of essential medical products and technologies, among others. In the next five years, there is need to ensure
that all people in Malawi access the greatest possible quality of healthcare. There is also need to increase invest-
ment in population related programmes such as modern family planning.
PAGE 19MID-YEAR ECONOMIC REPORT-2018
2. OTHER MARKET DEVELOPMENTS (Continued…)
Economic and Fiscal Policy Statement 2018 (Source: Ministry of Finance, Economic Planning Development)
In April 2018, the Ministry of Finance, Economic Planning and Development published its Economic and Fiscal Poli-
cy Statement (EFPS) for 2018 which sought to inform and share with various stakeholders the economic and fiscal
policies that will anchor the economy over the short to medium term. The EFPS also specified the broad strategic
priorities which would guide government in preparing the budget estimates for the 2018/19 fiscal year.
Among other things, the ministry explained how the five key priority areas in MGDS III would be financed. Govern-
ment intends to finance MGDS III through revenue generated from domestic sources as well as through concession-
al borrowing. Government will also encourage private sector involvement through Public-Private Partnership ar-
rangements. Government further intends to undertake a Development Finance Assessment (DFA) that is aimed at
mapping both domestic and external sources of development finance. This assessment will recommend policies,
institutional arrangements, capacity needs to mobilise, manage and determine existing and future flows of re-
sources.
On public debt management, the statement pointed out that in the medium term, Government intends to restruc-
ture the domestic debt to ensure that there is more long term debt than short term debt. This will ease the burden
of debt service on budget execution that is currently being experienced. On foreign borrowing, Government strate-
gy will involve contracting more concessional loans from multilateral sources and will continue to monitor debt
trends along with emerging domestic and external vulnerabilities and systemic risks. Government will also contin-
ue to implement principles of Development Cooperation Strategy (DCS) to enhance aid management. DCS is a coun-
try level framework to guide development cooperation for achievement of national development objectives.
The ministry expects real GDP growth to moderate to 4.5% in 2018 driven by the non-agricultural economy, tobacco
production, exports, and investment in infrastructure. Agricultural growth is anticipated to be slower than last year
due to the low crop yield, especially for maize following the effects of fall armyworm infestation and dry spells
during the early part of the growing season. Growth prospects are also constrained by delayed recovery of power
generation. Further declines in lending rates as inflation continue to decline are expected to support recovery of
private sector investment. This, combined with the present stabilization and reform programs will solidify busi-
ness confidence, support inclusive growth, and spur economic diversification. In light of these, real GDP growth is
expected to gradually increase to around 6% in the medium term. Inflation at the end of 2018 is expected to level
off in the region of 7% to 8% before gradually converging to 5% by 2022. In the short to medium term, inflation is
projected to remain within the single digit band. Meanwhile, risks to the disinflation path may emanate from the
rise in global oil prices and the impact of the current power outages.
2018 First Quarter Public Debt Update (Source: RBM)
According to RBM’s Financial and Economic Review for the first quarter of 2018, total public debt stock during the
first quarter of 2018 stood at K2,900.3 billion, representing a 4.1% increase from a 2017 fourth quarter position of
K2,786.6 billion. On an annual basis, public debt rose by 18.7% from a debt stock of K2,443.1 billion recorded as at
end of the first quarter in 2017. As a percentage of GDP, total public debt stock dropped to 56.2% of GDP in the
quarter under review from 60.2% of the fourth quarter of 2017.
Public external debt accounted for 52.7% of the public debt stock, from 53.4% recorded in the previous quarter and
51.5% recorded in the corresponding quarter of 2017. Outstanding domestic debt stock stood at K1.37 trillion, rep-
resenting a 5.7% increase from K1.30 trillion as was recorded by the end of the preceding quarter. On annual basis,
domestic debt rose by 15.7% from its 2017 first quarter position.
PAGE 20MID-YEAR ECONOMIC REPORT-2018
3. REGIONAL MARKET DEVELOPMENTS
Sub-Saharan Africa
According to the IMF’s April 2018 World Economic Outlook, real economic growth in sub-Saharan Africa is
projected to rise gradually during the 2018-2019 period to 3.4% and 3.7% respectively, as the challenging out-
look in commodity exporters gradually improves. South Africa’s real economic growth is expected to strength-
en from 1.3% in 2017 to 1.5% and 1.7% in 2018 and 2019 respectively. Business confidence is likely to gradual-
ly firm up with the change in leadership , but growth prospects remain weighed down by structural bottle-
neck. The medium term outlook is subdued, with growth expected to stabilise at 1.8% over 2020-2023 (Source:
IMF).
World Bank has projected sub-Saharan Africa regional real economic growth at 3.1% in 2018, and to an aver-
age of 3.7% in by 2020. Sub-Saharan African economies were hit hard by a crash in commodity prices which
slowed growth, reduced government revenues and weakened several of the region’s currencies. While Nigeria,
South Africa, and Angola are expected to see a gradual pick-up in growth, economic expansion will continue
at a solid pace in the West African Economic and Monetary Union (WAEMU), and strengthen in most of East
Africa. These forecasts are based on the expectations that oil and metals prices will remain stable, expansion
in global trade will stay robust, and external financial market conditions will continue to be supportive
(Source: World Bank).
Zambia
Zambia has shortlisted 10 regional and international companies to build a total of 100 Megawatts of solar
electricity projects by 2020. The country is heavily dependent on hydropower and following a drought in
2016, it has been hit by electricity shortages, forcing it to ration power supply to mines. The country has
since embarked on a policy to diversify to renewable forms of energy to ensure security of electricity supply
(Source: Reuters).
The Central Statistical Office monthly report for June 2018 has shown that year-on-year inflation for June
2018 decreased to 7.4% from 7.8% recorded in May 2018 owing to the base effect arising from the adjustment
in electricity tariffs in June 2017. The year-on-year food inflation rate rose to 7.5% in June 2018 from 6.9% the
previous month. Non-food inflation rate slowed to 7.3% from 8.9% recorded in May 2018 (Source: Central Sta-
tistical Office ).
Zambia’s finance minister has urged South African firms to invest in roads and power plants in the country
after it suspended borrowing indefinitely, slowing down the accumulation of new debt amid worries about
the risk of distress. The South African government and banks have drafted a plan to support infrastructure
projects in Zambia with an initial pledge of US$1.2 billion. The IMF rejected Zambia’s borrowing plans in Feb-
ruary 2018, saying its debt load was harder to sustain. (Source: Reuters).
Zimbabwe
China’s unlisted Tsingshan Holding Group has signed a US$1 billion agreement with Zimbabwe to build a
steelmaking plant in the country through its local subsidiary Afrochime, which produces chrome ore. The
plant is expected to produce 2 million tonnes of steel a year for 25 years. The country’s only integrated steel
plant, ZISCO, shut down in 2008 at the height of an economic crisis. Zimbabwe’s current administration is
trying to woo foreign investors especially in mining’ as part of efforts to revive the economy (Source: Reuters).
Zimbabwe’s year-on-year inflation rate for May 2018 remained steady at 2.7% for three consecutive months.
The month-on-month inflation stood at 0.0%, decreasing from 0.1% in April 2018 (Source: Reserve Bank of
Zimbabwe).
Zimbabwe has released a trio of climate change policies designed to make the country more resistant to cli-
mate pressures and help it meet its international carbon-cutting pledges. The Child Friendly Climate Policy is
designed to educate school children about climate change and promote climate-friendly practices, a new Cli-
mate Smart Agriculture Policy And the country’s first overall National Climate Policy (Source: Reuters)
PAGE 21You can also read