Thinking Beyond the Pandemic: Monetary Policy Challenges in the Medium- to Long-Term - European Parliament
←
→
Page content transcription
If your browser does not render page correctly, please read the page content below

STUDY
Requested by the ECON committee
Monetary Dialogue Papers, March 2021

             Thinking Beyond the
             Pandemic: Monetary
             Policy Challenges in
               the Medium- to
                  Long-Term

          Policy Department for Economic, Scientific and Quality of Life Policies
                        Directorate-General for Internal Policies
                              Author: Marek DABROWSKI                               EN
                                PE 658.221 - March 2021
Thinking Beyond the
 Pandemic: Monetary
 Policy Challenges in
the Medium- to Long-
         Term
       Monetary Dialogue Papers
             March 2021

 Abstract
 The economic characteristics of the COVID-19 crisis differ from
 those of previous crises. It is a combination of demand- and
 supply-side constraints which led to the formation of a monetary
 overhang that will be unfrozen once the pandemic ends.
 Monetary policy must take this effect into consideration, along
 with other pro-inflationary factors, in the post-pandemic era. It
 must also think in advance about how to avoid a policy trap
 coming from fiscal dominance.
 This paper was provided by the Policy Department for Economic,
 Scientific and Quality of Life Policies at the request of the
 committee on Economic and Monetary Affairs (ECON) ahead of
 the Monetary Dialogue with the ECB President on 18 March 2021.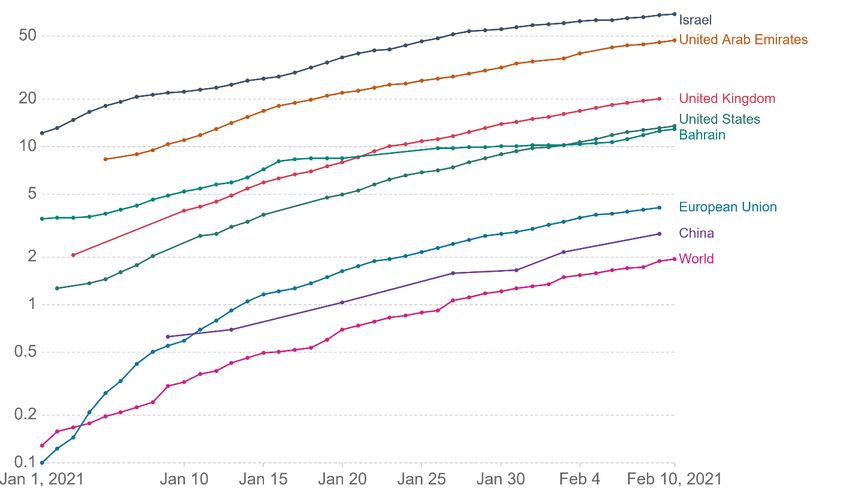
This document was requested by the European Parliament's committee on Economic and Monetary
Affairs (ECON).

AUTHOR
Marek DABROWSKI, CASE – Center for Social and Economic Research

ADMINISTRATOR RESPONSIBLE
Drazen RAKIC

EDITORIAL ASSISTANT
Janetta CUJKOVA

LINGUISTIC VERSIONS
Original: EN

ABOUT THE EDITOR
Policy departments provide in-house and external expertise to support European Parliament
committees and other parliamentary bodies in shaping legislation and exercising democratic scrutiny
over EU internal policies.

To contact the Policy Department or to subscribe for email alert updates, please write to:
Policy Department for Economic, Scientific and Quality of Life Policies
European Parliament
L-2929 - Luxembourg
Email: Poldep-Economy-Science@ep.europa.eu

Manuscript completed: February 2021
Date of publication: March 2021
© European Union, 2021

This document was prepared as part of a series on “Recalibrated Monetary Policy Instruments to
Address the Economic Fallout from COVID-19”, available on the internet at:
https://www.europarl.europa.eu/committees/en/econ/econ-policies/monetary-dialogue

DISCLAIMER AND COPYRIGHT
The opinions expressed in this document are the sole responsibility of the authors and do not
necessarily represent the official position of the European Parliament.
Reproduction and translation for non-commercial purposes are authorised, provided the source is
acknowledged and the European Parliament is given prior notice and sent a copy.
For citation purposes, the publication should be referenced as: Dabrowski, M., Thinking Beyond the
Pandemic: Monetary Policy Challenges in the Medium- to Long-Term, Publication for the committee on
Economic and Monetary Affairs, Policy Department for Economic, Scientific and Quality of Life Policies,
European Parliament, Luxembourg, 2021.
Thinking Beyond the Pandemic: Monetary Policy Challenges in the Medium- to Long-Term

CONTENTS
LIST OF FIGURES                                                                                        4
LIST OF TABLES                                                                                         4
LIST OF ABBREVIATIONS                                                                                  5
EXECUTIVE SUMMARY                                                                                      7
1.   INTRODUCTION                                                                                      8
2.   THE ECONOMIC CHARACTERISTICS OF THE COVID-19 PANDEMIC                                            10
     2.1. The dynamics of the COVID-19 pandemic and its prospects                                     10
     2.2. The limited state of knowledge on the COVID-19 pandemic, its impact on pandemic
          management, and economic activity                                                           12
     2.3. Characteristics of the COVID-19 economic crisis                                             13
     2.4. Crisis implications for monetary and fiscal policies                                        14
3.   MONETARY POLICY DECISIONS 2019-2021 AND THEIR SHORT-TERM IMPACT                                  17
     3.1. Monetary policy decisions of the ECB                                                        17
     3.2. Monetary policy decisions of the Fed and BoJ                                                19
     3.3. Impact of monetary policy decisions on CB balance sheets and money supply                   20
     3.4. QE and an impaired monetary transmission mechanism                                          23
     3.5. Monetary conditions outside major currency areas                                            24
     3.6. CPI inflation and changes in asset prices                                                   25
     3.7. The nexus between monetary and fiscal policies                                              30
4.   CHALLENGES FACED BY CENTRAL BANKS AFTER THE PANDEMIC                                             31
     4.1. The potential return of inflationary pressures                                              31
     4.2. Increasing fiscal dominance                                                                 33
     4.3. Risks to financial stability                                                                34
5.   CONCLUSION                                                                                       35
REFERENCES                                                                                            37

                                                   3                                          PE 658.221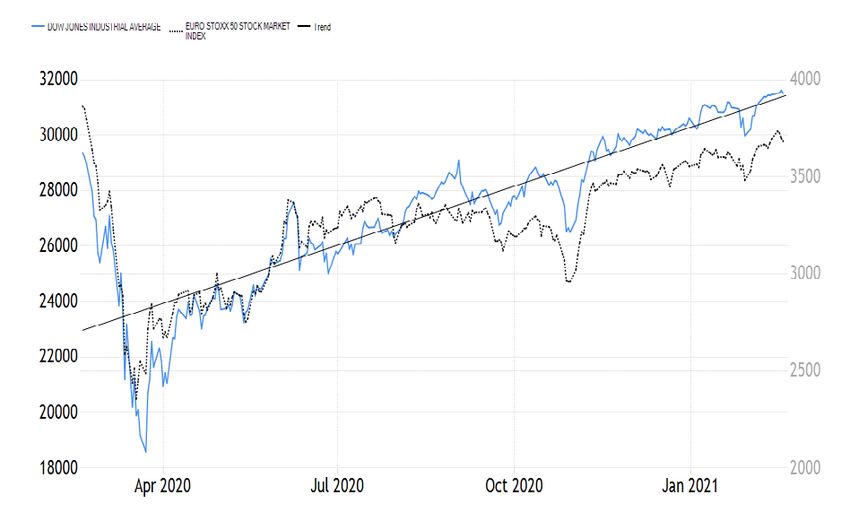
IPOL | Policy Department for Economic, Scientific and Quality of Life Policies

LIST OF FIGURES
Figure 1:     COVID-19 pandemic: daily new cases (left panel) and daily deaths (right panel) in the
              world, in thousands, 2020-2021                                                          10
Figure 2:     Cumulative COVID-19 vaccination doses administered per 100 people (logarithmic
              scale), 01.01.2021 – 11.02.2021                                                         11
Figure 3:     Gross household saving rate, in % of GDP, 2017-2020                                     14
Figure 4:     ECB net asset purchases in EUR billion, March 2015 – January 2021                       18
Figure 5:     PEPP: total bimonthly net asset purchases, in EUR million, March 2020 – January 2021 18
Figure 6:     Securities held outright by the Fed, in USD million, January 2019 – February 2021       20
Figure 7:     CB total assets, January 2019 – December 2020                                           21
Figure 8:     Major currency areas: CB balance sheets as % of nominal GDP                             21
Figure 9:     Major currency areas: broad money, March 2019 – December 2020 (quarterly data)          22
Figure 10:    Composite bank lending rates for NFCs and households in the euro area, annual in %,
              2014-2020                                                                           22
Figure 11:    Money multiplier (broad money to monetary base) in major currency areas 2019-2020 23
Figure 12:    CB liabilities to other depository corporations, major currency areas, 2019-2020        24
Figure 13:    12-month inflation in major currency areas, in %, 2019-2021                             25
Figure 14:    Price of crude oil WTI, in USD per 1 barrel, 2020-2021                                  26
Figure 15:    Measures of underlying inflation in the euro area, 12-month rate in %, 2019-2020        27
Figure 16:    US Dow Jones Industrial Average (left-hand scale, blue line) and Euro Stoxx 50 Market
              Index (right-hand scale, black line), 18 February 2020-18 February 2021               28
Figure 17:    US (left-hand scale, blue line) and euro area (right-hand scale, black dotted line)
              Nominal Home Prices Indexes, 18 February 2020-18 February 2021                          28
Figure 18:    Price of gold in USD for 1 troy ounce, 2016-2021                                        29
Figure 19:    Price of Bitcoin in USD for 1 unit, 2016-2021                                           29

LIST OF TABLES
Table 1:      Euro area, Japan, and the United States: general government gross debt, % of GDP,
              2007-2019                                                                               15

PE 658.221                                             4
Thinking Beyond the Pandemic: Monetary Policy Challenges in the Medium- to Long-Term

LIST OF ABBREVIATIONS
ABSPP      Asset-backed securities purchase programme

AEs        Advanced economies

APP        Asset purchase programme

BoJ        Bank of Japan

CARES      Coronavirus Aid, Relief, and Economic Security (Act)

CB         Central bank

CBPP3      Third covered bond purchase programme,

CDSs       Collateral default swaps

COVID-19   Coronavirus Disaease 2019

CPI        Consumer Price Index

CSPP       Corporate sector purchase programme

DFR        Deposit facility rate

EA         Euro area

ECB        European Central Bank

EM         Emerging market

ETFs       Exchange-traded funds (in Japan)

EU         European Union

EUR        Euro

Fed        Federal Reserve Board (of the United States)

FFR        Federal Fund Rate

FOMC       Federal Open Market Committee

GDP        Gross domestic product

GFC        Global financial crisis

                                          5                                          PE 658.221
IPOL | Policy Department for Economic, Scientific and Quality of Life Policies HICP Harmonised index of consumer prices IMF International Monetary Fund JPY Japanese yen J-REITS Japanese real estate investment trusts MLFR Marginal lending facility rate MM Money multiplier MRO Main refinancing operations (rate) NFCs Non-financial corporations PSPP Public Sector Purchase Programme, , PSBR Public sector borrowing requirement PELTRO Pandemic Emergency Longer-Term Refinancing Operations PEPP Pandemic Emergency Purchase Programme QE Quantitative easing TLTRO Targeted Longer-Term Refinancing Operations UPMs Unconventional policy measures USD United States dollar VAT Value Added Tax PE 658.221 6
Thinking Beyond the Pandemic: Monetary Policy Challenges in the Medium- to Long-Term

EXECUTIVE SUMMARY
•   In February 2021, one year after the outbreak of the COVID-19 pandemic, it is hard to see its quick
    end, despite the development of vaccines and the beginning of a mass vaccination programme.
    Fighting the pandemic may take longer and cost more (in terms of number of deaths; GDP; and
    fiscal, job, and personal income losses, among others) than originally expected. Worse, the
    knowledge on the ways and speed of the spread of coronavirus remains limited, which forces
    governments to rely on trial and error in adopting containment measures. Obviously, this
    increases economic uncertainty.
•   The economic characteristics of the COVID-19 crisis differ from the global financial crisis of
    2007-2009 and other past financial crises and business cycle downturns. It is a combination of
    demand- and supply-side shocks that led to the formation of forced saving and monetary
    overhang. Despite this difference, governments and central banks reacted with a massive fiscal
    and monetary relaxation (as they did in 2007-2009), which was costly and not sufficiently targeted.
•   The intensification of asset purchasing programmes was the main policy tool that could be
    used by central banks to further ease their monetary policies. However, they only partly
    achieved their declared goal, that is, increasing the liquidity of economic agents. Part of the
    additional monetary base returned to central banks in the form of voluntary deposits from
    commercial banks, repeating the experience of quantitative easing in the 2010s. This confirms that
    asset purchasing programmes are an imperfect monetary policy tool that weakens financial
    intermediation and impairs the monetary policy transmission mechanism.
•   Quantitative easing also increases the stock of government securities in central bank books
    (de facto debt monetisation), leading to fiscal dominance and narrowing the room for
    manoeuvre of monetary policy when the latter needs to be tightened. Eventually, this may
    compromise central bank independence and make them tolerant of higher inflation.
•   Monetary tightening may become necessary once the pandemic ends and the accumulated
    monetary overhang is unfrozen. Higher inflationary pressures can also be generated by other
    factors such as overshooting stimulus packages, supply bottlenecks, the expiring deflationary
    impact of tighter financial regulations, demographic changes, deglobalisation, and the
    deterioration of fiscal balances.
•   Governments and central banks should think ahead about how to avoid a policy trap caused
    by rapidly growing public debt and its de facto monetary financing, especially in the context
    of the potential return of inflationary pressures. They should carefully balance the short-term
    needs of fighting the pandemic and its adverse socio-economic consequences and the long-term
    constraints and challenges.

                                                 7                                          PE 658.221
IPOL | Policy Department for Economic, Scientific and Quality of Life Policies 1. INTRODUCTION In the first quarter of 2020, the COVID-19 pandemic hit the entire world economy in an unexpected way. A year later (February 2021), it is hard to see its quick end, despite having developed vaccines and begun a mass vaccination programme in several advanced economies (AEs). Most governments responded to the outbreak of the pandemic with strict lockdown measures to protect peoples’ lives and to limit the contagion effect. Clearly, the pandemic itself and the accompanying lockdown measures heavily damaged economic activity. Governments had to offer financial relief both to suffering businesses and the population at large. Together with the costs of fighting pandemics, foregone revenue (the effect of the pandemic-related recession) and attempts to boost aggregate demand, it has led to a huge expansion of both fiscal deficit and public debt. Major central banks (CBs), on their own, responded to the crisis with a new round of monetary relaxation. In fact, it had already started in 2019, well before the pandemic. The pandemic only accelerated and magnified an easing response. Because CB interest rates remained either low (the Federal Reserve Board of the United States, henceforth the Fed), zero, or even negative (the European Central Bank [ECB] and the Bank of Japan [BoJ]), monetary relaxation has had to rely largely on asset purchasing programmes (APPs), popularly called quantitative easing (QE). Its declared intention has been to provide additional liquidity to pandemic-stressed businesses and consumers and meet the declared annual inflation target of 2 or close to 2%, depending on the currency area. A less declared or undeclared policy goal, especially in the case of the ECB, has been to help governments to finance their fresh deficits and rollover the existing stocks of public debt, in some cases a challenging task long before the pandemic (think about Japan and some euro area countries). What could be seen as a relatively short-term distress in the early 2020s now looks like a longer crisis episode. While the strict lockdown measures were relaxed in most countries of the Northern Hemisphere at the end of the second and beginning of the third quarter of 2020, the next waves of the pandemic created the necessity to reintroduce them, although in a more selective and targeted way. Due to difficulties in predicting the length of the pandemic and its probable end date, economic decisions on both the macro and micro levels are burdened with a high degree of uncertainty. Against this background, CBs continue their expansionary monetary policies by extending the period of unconventional policy measures (UPMs) and expanding the size of APPs. For example, on 10 December 2020, the ECB Governing Council approved a package of decisions extending their anti-crisis measures taken in 2020 for most of 2021 (ECB, 2020). The huge increase of CB balance sheets is one of major results of these expansionary policies. It may lead to an inflationary pressure in the post- pandemic period (once the lockdown measures end) even if the current consumer price inflation (CPI) remains very low, as in the case of the euro area. There are also other risks associated with the continuation of extra-loose monetary policies, such as building asset bubbles, the engagement of financial institutions in less prudent transactions, distorting a financial sector business model, increasing income and wealth inequalities, and others. In the current circumstances, CBs do not seem to put sufficient attention to these side effects and remain rather unprepared to respond to the risk of inflationary pressure quickly enough. Furthermore, their de facto increasing engagement in public debt financing (even if carried out via secondary market purchases with only monetary policy considerations in mind) can make them hostages of quickly expanding fiscal imbalances. In such circumstances, shrinking their balance sheets can be politically difficult. PE 658.221 8
Thinking Beyond the Pandemic: Monetary Policy Challenges in the Medium- to Long-Term

The purpose of this briefing paper is twofold: (i) to assess the anti-crisis monetary policy measures taken
by the ECB in 2019-2020, including their last package of December 2020, and (ii) to look beyond an
immediate COVID-19-related policy horizon by analysing monetary policy challenges in the medium-
to long-term.
Our working hypothesis is that the anti-crisis measures of the ECB and other major CBs are only partly
effective in achieving the declared goals. On the other hand, they may produce various unintended
negative side effects – in particular, the increasing monetary policy dependence on fiscal imbalances
and rapidly growing public debt. This may compromise both the independence of CBs as well as their
ability to effectively resist post-pandemic inflationary pressures.
The structure of the paper is subordinated to its declared analytical purpose. Chapter 2 deals with the
economic characteristics of the COVID-19 pandemic and its impact on the effectiveness of the
monetary policy response measures undertaken. In Chapter 3, we analyse the monetary policy
decisions of the ECB (and other major CBs for comparison) and their effectiveness in achieving the
declared policy goals in the short term. Chapter 4 is devoted to an analysis of the policy challenges
which may be faced by the ECB and other major CBs once the pandemic emergency comes to its end.
Chapter 5 contains a summary and the conclusions of our analysis.
In our analysis, we use the data sources of the International Monetary Fund (IMF), Eurostat, the ECB, the
Fed, Worldometer, Our World in Data, and those collected by other researchers.

                                                   9                                            PE 658.221
IPOL | Policy Department for Economic, Scientific and Quality of Life Policies
2. THE ECONOMIC CHARACTERISTICS OF THE COVID-19
PANDEMIC
In this chapter, we analyse the dynamics of the COVID-19 pandemic and its prospects (Section 2.1); the
state of knowledge on the pandemic, its management, and its economic repercussions (Section 2.2);
the nature of the economic crisis caused by the pandemic and how it differs from previous crises, in
particular, the global financial crisis (GFC) of 2007-2009 (Section 2.3); and its implications for monetary
and fiscal policies (Section 2.4).
2.1. The dynamics of the COVID-19 pandemic and its prospects
To understand the economic impact of the pandemic in the short and medium- to long-term, we must
first analyse its actual and future dynamics.
The first cases of the new COVID-19 infection were registered in the Chinese city of Wuhan in December
2019. In late February and early March 2020, it spread to Europe and the United States. A year later, at
the time of writing this paper (February 2021), the figures for daily new cases and deaths worldwide
(Figure 1) remain high. The figures were increasing rapidly until January 2021. As of 11 February 2021,
the total number of identified COVID-19 cases exceeded 108 million and total number of COVID-19-
related deaths – 2.3 million 1.
Figure 1: COVID-19 pandemic: daily new cases (left panel) and daily deaths (right panel)
in the world, in thousands, 2020-2021
Source: Worldometers, https://www.worldometers.info/coronavirus/.
1 See Worldometers, Coronavirus cases, https://www.worldometers.info/coronavirus/.
PE 658.221 10Thinking Beyond the Pandemic: Monetary Policy Challenges in the Medium- to Long-Term
Predicting the pandemic’s dynamic towards the end of 2021 is a risky and highly speculative task,
especially given the new mutations of COVID-19 (the so-called British, South African, Brazilian, and
Californian ones – see Lancet COVID-19 Commission, 2021), which were identified at the end of 2020
and in early 2021. In such a situation, one cannot rule out new waves of high-intensity infections in
2021 and perhaps beyond.
Throughout 2020, the availability of a vaccine was seen as the potential turning point in fighting
coronavirus. When several vaccines became available at the end 2020, it turned out that their
production and distribution, as well as the vaccination process itself, would take a few years to cover
the entire world population. According to the EIU (2021) forecast, only the EU, the United States, and a
few smaller countries (Israel, United Arab Emirates, Bahrain, Singapore, Hong Kong, and Taiwan) have
the chance to complete mass vaccination towards the end of 2021. In other regions of the world,
vaccination will take more time, until 2023 and beyond (most of Africa). In such a situation, thinking
about achieving herd immunity against COVID-19 is unrealistic (Dadush, 2021; Krueger, 2021),
especially when the coronavirus is mutating.
The available statistics confirm that the vaccination campaign is rolling out slowly, except from a few
small countries (Israel, United Arab Emirates, and Bahrain) and the United Kingdom (which outperforms
both the United States and the EU) – see Figure 2.
Figure 2: Cumulative COVID-19 vaccination doses administered per 100 people
(logarithmic scale), 01.01.2021 – 11.02.2021
Note: Counted as the number of single doses, which may not be equal to the vaccinated individuals.
Source: Our World in Data, Coronavirus vaccinations, https://ourworldindata.org/covid-vaccinations.
The above overview suggests that the pandemic may not end quickly, and the world economy may
have to operate in extraordinary circumstances for a longer period of time.
11 PE 658.221IPOL | Policy Department for Economic, Scientific and Quality of Life Policies
2.2. The limited state of knowledge on the COVID-19 pandemic, its
impact on pandemic management, and economic activity
Despite more than a year of experience in fighting the pandemic, the state of knowledge on its actual
size, geographical spread, mechanisms of transmission, and effective containment measures remains
limited. In this section, we concentrate on those aspects of anti-pandemic management which have an
explicit economic impact, leaving aside purely medical and public health problems.
The uncertainty starts with the actual number of infections and even the number of COVID-19-related
fatalities. The reason for this is related not only to the imperfections of reporting systems in individual
countries but also to difficulties in accurately diagnosing cases without a broad-based testing system,
which is present in only a few countries. There is also a large number of asymptomatic cases, especially
in younger cohorts of the population, which are difficult to identify even with the help of broad-based
testing systems. Therefore, one can speculate that the actual number of infections is a few times larger
than what is officially recorded.
An even more limited knowledge concerns the exact channels of disease contagion. While it was clear
from the very beginning that keeping physical distance between people, limiting direct person-to-
person contact, and using face masks can slow down the proliferation of the pandemic, these actions
had to be translated into concrete protection measures aimed at prohibiting or limiting various types
of activities. In choosing concrete containment measures, knowledge on the factors facilitating the
spread of coronavirus (for example, indoor versus outdoor activities, weather conditions, the
seasonality of infections, and the role of schools, among others) plays a decisive role. However, such
knowledge is either lacking or very limited and uncertain. Furthermore, there are difficulties explaining
cross-country differences in the number of infections and deaths, which could help understand the
factors responsible for the contagion and evaluate the effectiveness of various anti-pandemic
strategies.
The limited state of knowledge determines the policy responses to the crisis, which are based, in most
cases, on trial and error. This approach is reflected in the stop-go policy carried out in most countries.
The policy response began with far-reaching and rather untargeted containment measures in most of
Europe and the United States 2 at the end of the first quarter and beginning of the second quarter of
2020 with the hope that they would stop the spread of coronavirus and stop the pandemic in a
relatively short period of time. When the huge economic costs of mass lockdowns became evident
(GDP decline was positively correlated with stringency of containment measures – see IMF, 2020;
Marcus et al., 2021) and the first wave of pandemic seemed to be over in several AEs (but not globally
as seen in Figure 1), governments began relaxing the lockdown measures at the end of the second and
in the third quarter of 2020. Economic activity started to recover at a quite rapid pace in the third
quarter of 2020 (IMF, 2021a).
However, the return of the pandemic in the autumn of 2020 forced most governments to reintroduce
lockdown measures, although in a more targeted way than in the spring of 2020. Since then, and until
the time of writing this paper, the stringency of anti-pandemic measures fluctuates in most of AEs (see
Hale et al., 2020) depending on the most recent infection and death statistics, pressure from sectoral
lobbies, and the political controversies around anti-pandemic policies. One can say it is driven by
2 In some East Asian countries (Japan, Taiwan, South Korea, Hong Kong, and Singapore) that had earlier experience with the SARS epidemic,
authorities managed to launch a system of mass testing and tracking infection chains with the use of IT technologies early on, avoiding
more severe lockdown measures (Stancati and Yoon, 2020).
PE 658.221 12Thinking Beyond the Pandemic: Monetary Policy Challenges in the Medium- to Long-Term
attempting to balance socio-economic considerations and the capacity of national healthcare systems
to deal with the pandemic (Dabrowski, 2020).
While in the first half of 2020 most countries enjoyed broad social and political consensus on the
necessity to take tough containment measures, support began to wane at the end of 2020 and in early
2021 when the social and economic costs of the pandemic and lockdown continued to increase and
doubts with respect to the effectiveness of concrete anti-pandemic policies and measures intensified.
It was seen, among others, in the course of the US presidential election campaign and in the series of
anti-lockdown protests held in various countries. The most recent cases (mid-February) of political
controversy on anti-pandemic measures include tension in the newly formed government of Italy
(Amante, 2021) and the failure of the Czech parliament to prolong the state of emergency to fight the
pandemic (Euronews, 2021).
The limited state of pandemic-related knowledge additionally increases the already high degree of
uncertainty in respect of the short- and medium-term economic prospects and the unpredictability of
government decisions. Uncertainty and unpredictability dampen both private consumption (beyond
basic necessities) and even more – investment.
2.3. Characteristics of the COVID-19 economic crisis
The economic characteristics of the COVID-19 crisis are very different from the GFC of 2007-2009 and
other past financial crises or business-cycle downturns. The GFC caused a disruption in financial
intermediation, which, by its nature, had a deflationary character. There were also other deflationary
factors in play such as new, more stringent financial regulations, the effects of globalisation, and others
(Dabrowski, 2019).
The current crisis is a combination of demand-side and supply-side shocks. They result not only from
depressed aggregate demand caused by the self-restrained behaviour of both consumers and
investors but also from administrative lockdown measures such as the prohibition of certain types of
activities, restrictions on the movement of people, or closed borders and the resulting disruption of
supply chains. In such circumstances, private spending decreases and private saving increases (Figure
3), but these are forced (involuntary) savings.
One can make a historical analogy to centrally-planned economies where people and enterprises could
not spend their money balances on the goods and services they wanted to buy because they were not
available on the market (as a result of administrative price controls and the administrative distribution
of goods and services) – the phenomenon of a shortage economy as described by Kornai (1980). This
led to forced saving (flow) and monetary overhang (stock), which represented a repressed inflation
(Cottarelli and Blejer, 1991).
Apart from temporarily frozen demand- and supply-side disruptions, the COVID-19 crisis, especially if
prolonged, can lead to substantial structural changes such as the expansion of e-commerce and
various e-services (including e-government ones), telework, teleconferencing, online education, and
the contraction of business travel, traditional retailing, and, therefore, demand for office and
commercial space. At the moment, it is difficult to predict which parts of the observed structural
changes have a temporary character and will disappear after the pandemic and which have an
irreversible character.
13 PE 658.221IPOL | Policy Department for Economic, Scientific and Quality of Life Policies
Figure 3: Gross household saving rate, in % of GDP, 2017-2020
26,
24,
22,
20,
18,
16,
14,
12,
10,
2017-Q4 2018-Q1 2018-Q2 2018-Q3 2018-Q4 2019-Q1 2019-Q2 2019-Q3 2019-Q4 2020-Q1 2020-Q2 2020-Q3
Euro area - 19 countries (from 2015) European Union - 27 countries (from 2020)
Source: Marcus et al., 2021.
The right diagnosis of the ongoing structural changes is important not only for structural and
institutional policies – for example, the respective adaptation of labour market regulations – but also
for monetary and fiscal policies. First, they should facilitate such changes rather than conserving the
existing supply side structure, which might mean support for “zombie” firms and industries. If one
assumes far-reaching structural changes, estimating the output gap may become more complicated
(i.e., due to the mismatch between the new demand structure and the old supply capacities).
2.4. Crisis implications for monetary and fiscal policies
The very nature of the GFC (see Section 2.3) required a bold monetary policy response to avoid a
deflationary spiral of the kind observed during the Great Depression of 1929-1933. And because
interest rates in major currency areas quickly hit the zero bound, CBs had to resort to UPMs, including
large-scale APPs. While expansionary monetary policies achieved their strategic goal (deflation was
avoided), the process of withdrawal from UPMs in the second half of the 2010s either went slow (the
United States) or did not start at all (the euro area and Japan). The continuous fear of deflation and
attempts to push inflation up to the declared 2% – or below but close to 2% – target were major reasons
of this failure (Dabrowski, 2019).
As a result, CBs in major currency areas met the new COVID-19-related challenges with interest rates
close to zero (the ECB and BoJ) or moderately positive (the Fed). Therefore, monetary relaxation
required resorting to UPMs, mainly APPs.
There is also a more fundamental question on which kind of monetary policy response has been
required, given the specific character of the COVID-19 crisis analysed in Section 2.3, which is quite
different from both the GFC and standard business cycle downturns. Indeed, the surprise outbreak of
PE 658.221 14Thinking Beyond the Pandemic: Monetary Policy Challenges in the Medium- to Long-Term
the pandemic and the far-reaching lockdown measures in the first half of 2020 caused a negative
aggregate demand shock in parallel with a supply-side disruption. The increase in gross household
saving (Figure 3) confirms the correctness of this diagnosis. CBs might also fear a potential disruption
in financial intermediation as happened during the GFC, so providing additional liquidity seemed to be
the right decision. However, once lockdown measures were relaxed in the third quarter of 2020 and
then continued in a more selective way, the rationale behind the continued monetary expansion
requires a closer analytical scrutiny. And this will be done in Chapter 3 of this paper.
Given the nature of the COVID-19 crisis, the main macroeconomic policy response should come from a
fiscal policy side. Governments are confronted with the necessity to:
• finance the direct costs of fighting the pandemic (mostly related to public health measures);
• provide financial compensation to people and businesses directly affected by the economic
consequences of the administrative lockdown measures; and
• accommodate for revenue losses and additional social spending resulting from the crisis-related
recession (automatic fiscal stabilisers).
This is the minimum agenda of a fiscal response. On top of this, several governments developed various
fiscal stimulus packages aimed at boosting aggregate demand or stimulating public investment
programmes (Skidelsky, 2021). The design of these packages differs between countries (IMF, 2021b).
The basic constraint comes from the limited fiscal space in most AEs (Table 1). Their fiscal positions
substantially deteriorated during the GFC and immediately after (Dabrowski, 2012) and only a few of
them (Germany is the most prominent example) managed to use the post-GFC period to rebuild fiscal
buffers.
Against the limited fiscal space, governments should use fiscal support measures wisely and carefully.
In particular, they should assess whether they have enough fiscal space for a large-scale fiscal stimulus
aimed to boost aggregate demand, if they can expect fiscal multipliers to be above one (only in such a
situation can the stimulus be self-financing), and what will be the optimal timing of its launching
(before the end of the pandemic when demand and supply constraints remain in force or after the
termination of containment measures).
Table 1: Euro area, Japan, and the United States: general government gross debt, % of
GDP, 2007-2019
Country 2007 2008 2009 2010 2011 2012 2013 2014 2015 2016 2017 2018 2019
Euro area 65.9 69.6 80.2 85.8 87.7 90.7 92.6 92.8 90.9 90.0 87.6 85.7 84.0
Austria 64.7 68.4 79.6 82.4 82.2 81.7 81.0 83.8 84.4 82.6 78.4 74.0 70.3
Belgium 87.3 93.2 100.2 100.3 103.5 104.8 105.5 107.0 105.2 104.9 101.8 99.9 98.7
Cyprus 53.2 44.1 52.8 55.5 65.0 79.4 102.9 109.2 107.5 103.4 93.9 100.6 95.5
Estonia 3.8 4.5 7.2 6.6 6.1 9.8 10.2 10.4 9.8 9.1 9.1 8.3 8.4
Finland 33.9 32.6 41.5 46.9 48.3 53.6 56.2 59.8 63.6 63.2 61.3 59.6 59.0
France 64.5 68.8 83.0 85.3 87.8 90.6 93.4 94.9 95.6 98.0 98.3 98.1 98.1
Germany 64.0 65.5 73.0 82.4 79.8 81.1 78.7 75.7 72.2 69.2 65.0 61.6 59.5
Greece 103.1 109.4 126.7 146.3 180.6 159.6 177.9 180.2 177.8 181.1 179.3 184.8 180.9
Ireland 23.9 42.4 61.7 86.0 111.1 120.0 120.1 104.3 76.7 74.2 67.4 62.9 57.3
Italy 103.9 106.2 116.6 119.2 119.7 126.5 132.5 135.4 135.3 134.8 134.1 134.8 134.8
Latvia 8.1 18.0 35.8 46.8 43.3 41.9 39.4 40.9 36.7 40.2 40.3 36.5 36.8
Lithuania 15.9 14.6 28.0 36.3 37.2 39.8 38.7 40.6 42.7 39.9 39.3 34.1 37.7
Luxembourg 8.2 15.4 16.1 20.2 19.0 22.0 23.7 22.7 22.0 20.1 22.3 21.0 22.1
Malta 61.9 61.8 66.3 65.3 69.3 65.9 65.8 61.6 55.9 54.5 48.8 45.2 42.6
Netherlands 42.0 53.8 55.8 59.4 61.8 66.4 67.8 68.0 64.6 61.9 56.9 52.4 48.4
Portugal 72.7 75.6 87.8 100.2 114.4 129.0 131.4 132.9 131.2 131.5 126.1 122.0 117.7
15 PE 658.221IPOL | Policy Department for Economic, Scientific and Quality of Life Policies Country 2007 2008 2009 2010 2011 2012 2013 2014 2015 2016 2017 2018 2019 Slovakia 30.3 28.6 36.4 41.0 43.5 51.8 54.7 53.5 51.9 52.0 51.3 49.5 48.0 Slovenia 22.8 21.8 34.5 38.3 46.5 53.6 70.0 80.3 82.6 78.7 74.1 70.4 66.1 Spain 35.8 39.7 53.3 60.5 69.9 86.3 95.8 100.7 99.3 99.2 98.6 97.6 95.5 Japan 175.3 183.3 200.9 207.7 221.9 228.7 232.2 235.8 231.3 236.4 234.5 236.6 238.0 US 64.7 73.7 86.8 95.5 99.8 103.3 104.9 104.5 104.6 106.6 105.7 106.9 108.7 Source: IMF, World Economic Outlook database, October 2020. Further deterioration of the fiscal situation (higher deficits and the rapid increase of public debt) also raises the expectation that monetary policy will provide a rescue by keeping interest rates low for a long period of time and by partial debt monetisation if necessary (Buiter, 2021). This creates the risk of compromising CB independence and the price stability goal of monetary policy. We will return to this question in Chapters 3 and 4. PE 658.221 16
Thinking Beyond the Pandemic: Monetary Policy Challenges in the Medium- to Long-Term

3. MONETARY POLICY DECISIONS 2019-2021 AND THEIR SHORT-
   TERM IMPACT
Having characterised the economic impact of the pandemic (Chapter 2), we turn now to the monetary
policy decisions of the ECB and other major CBs in the period of 2019-2021 – that is, immediately before
the pandemic and after its outbreak. We also analyse their monetary and non-monetary effects in a
short-term perspective. We start with the presentation of the monetary policy decisions of the ECB
(Section 3.1), followed by an overview of the Fed and BoJ decisions (Section 3.2). The subsequent
sections are devoted to the impact of these decisions on CB balance sheets and money supply (Section
3.3), monetary transmission mechanisms (Section 3.4), monetary conditions outside major currency
areas (Section 3.5), CPI inflation and changes in asset prices (Section 3.6), and a monetary-fiscal nexus
(Section 3.7).

3.1.        Monetary policy decisions of the ECB
The ECB was the last among major CBs to launch a large-scale APP (Dabrowski, 2019). It happened only
in March 2015, that is, when the Fed had already started to unwind its QE programmes. The ECB
continued them until December 2018, although at a slower pace in 2018 (Figure 4). After a 10-month
break, it returned to active net asset purchases in November 20193. It was motivated, among others, by
problems with pushing inflation up to the declared level of below, but close to, 2% over the medium
term (Draghi, 2019). In our opinion (Dabrowski, 2019), it was a serious misconception because inflation
between 0-2% involves no major policy risk (see Frankel, 2019; Gros, 2019; Leidy and Tokarick, 1998).
After the outbreak of the COVID-19 pandemic, the ECB intensified and eased the conditions of its APPs4
and targeted longer-term refinancing operations (TLTRO III) 5. On the top of this, in March and April
2020, it launched new programmes – the pandemic emergency purchase programme (PEPP) 6 and the
pandemic emergency longer-term refinancing operations (PELTRO) 7. The novelty of both programmes
as compared to the APPs and TLTRO III consisted of their size, greater flexibility (PEPP), and more
beneficial terms of lending (PELTRO).
As seen in Figure 4, the average size of total net asset purchases under the APPs throughout 2020 was
substantially lower than in 2015-2017, with the peak recorded in March 2020. Figure 5 shows that total
bimonthly net asset purchases under the PEPP represented a declining trend.

3   See ECB: asset purchase programmes https://www.ecb.europa.eu/mopo/implement/omt/html/index.en.html.
4   See ECB: Governing Council Meeting of 11-12 March 2020
    https://www.ecb.europa.eu/press/accounts/2020/html/ecb.mg200409~0026941ce4.en.html.
5   See ECB press release, 12 March 2020: “ECB announces easing of conditions for targeted longer-term refinancing operations (TLTRO III)”,
    https://www.ecb.europa.eu/press/pr/date/2020/html/ecb.pr200312_1~39db50b717.en.html.
6   See ECB: Pandemic emergency purchase programme (PEPP) https://www.ecb.europa.eu/mopo/implement/pepp/html/index.en.html.
7   See ECB press release, 20 April 2020: “ECB announces new pandemic emergency longer-term refinancing operations”
    https://www.ecb.europa.eu/press/pr/date/2020/html/ecb.pr200430_1~477f400e39.en.html.

                                                                  17                                                         PE 658.221
IPOL | Policy Department for Economic, Scientific and Quality of Life Policies
Figure 4: ECB net asset purchases in EUR billion, March 2015 – January 2021
Note: PSPP – public sector purchase programme, CBPP3 – third covered bond purchase programme, CSPP – corporate sector
purchase programme, ABSPP – asset-backed securities purchase programme.
Source: ECB, Asset purchase programmes, https://www.ecb.europa.eu/mopo/implement/omt/html/index.en.html.
Figure 5: PEPP: total bimonthly net asset purchases, in EUR million, March 2020 – January
2021
240000
220000 Covered Bonds Corporate Bonds
200000
Commercial Paper Public Sector Securities
180000
160000
140000 186603
120000
198214
100000
80000
140160
126832
60000 116339
40000
35384
20000
10579 7043
0 -544 2707
-2765 342
-7682
1471
-7603
-20000
Mar-May2020 Jun-Jul2020 Aug-Sep2020 Oct-Nov2020 Dec2020-Jan2021
Source: ECB, https://www.ecb.europa.eu/mopo/pdf/PEPP_breakdown_history.csv?4fccbac2ae5f38b8ae63b70d05d17fb0.
PE 658.221 18Thinking Beyond the Pandemic: Monetary Policy Challenges in the Medium- to Long-Term
Since March 2016, the main refinancing operations (MRO) rate remained at zero and the marginal
lending facility rate (MLFR) at the level of 0.25%, while the deposit facility rate (DFR) was cut from -
0.40% to -0.50% in September 2019 8.
On 10 December 2020, the ECB Governing Council took a series of decisions in which it:
• increased the envelope of the PEPP by EUR 500 billion to a total of EUR 1,850 billion and extended
the horizon for net purchases under this programme to at least the end of March 2022 and the
period of reinvestment of principal payments from maturing securities until at least the end of
2023;
• extended the period of more favourable terms of the TLTRO III by 12 months to June 2022; three
additional operations will be conducted between June and December 2021;
• extended to June 2022 the duration of the set of collateral easing measures adopted in April 2020;
• offered four additional PELTROs in 2021;
• declared the continuation of APP net purchases at a monthly pace of EUR 20 billion and reinvesting,
in full, the principal payments from maturing securities purchased under the APP for an extended
period of time.
3.2. Monetary policy decisions of the Fed and BoJ
The Fed and BoJ also reacted to the COVID-19 emergency with a new round of monetary policy easing.
The Fed cut the Federal Fund Rate (FFR) by 1.50 percentage points (to the range 0.00-0.25) in two steps
taken in March 2020. Before, between July and October 2019, the FFR was reduced in three steps by
0.75 percentage points.
In the second half of 2019, the Fed also returned to net purchases of securities, starting to again
increase its balance sheet (after its reduction between October 2017 and August 2019 9). On 15 March
2020, after the outbreak of the pandemic, it decided to increase its holdings of Treasury securities by
at least USD 500 billion and mortgage-backed securities by at least USD 200 billion 10. A week later, it
eliminated upper limits of these operations 11. Within its regulatory and supervisory mandate, the Fed
also launched several sector-targeted lending programmes 12. All these measures led to an increase of
its asset holdings by approximately 75% in the period between March 2020 and February 2021 (Figure
6).
In March and April 2020, the BoJ adopted three kinds of easing measures (Kuroda, 2020): (i) a special
programme to support financing non-financial firms, worth JPY 110 trillion (the purchase of corporate
bonds and refinancing financial institutions which lend to non-financial firms); (ii) purchasing Japanese
government bonds without limits and the provision of USD funds based on cooperation with other
CBs; and (iii) purchases of certificates of exchange-traded funds (ETFs) and real estate investment trusts
8 See ECB: Key ECB interest rates
https://www.ecb.europa.eu/stats/policy_and_exchange_rates/key_ecb_interest_rates/html/index.en.html.
9 See Federal Reserve: History of the FOMC's Policy Normalization Discussions and Communications
https://www.federalreserve.gov/monetarypolicy/policy-normalization-discussions-communications-history.htm.
10 See Federal Reserve, FOMC statement, 15 March 2020
https://www.federalreserve.gov/newsevents/pressreleases/monetary20200315a.htm.
11 See Federal Reserve, FOMC statement, 23 March 2020
https://www.federalreserve.gov/newsevents/pressreleases/monetary20200323a.htm.
12 See Federal Reserve, Coronavirus Disease 2019 (COVID-19) - Funding, Credit, Liquidity, and Loan Facilities
https://www.federalreserve.gov/funding-credit-liquidity-and-loan-facilities.htm.
19 PE 658.221IPOL | Policy Department for Economic, Scientific and Quality of Life Policies
(J-REITS). In December 2020, it extended the period of all these programmes to at least September 2021
and enlarged their envelopes (Vogado, 2020).
Figure 6: Securities held outright by the Fed, in USD million, January 2019 – February 2021
7000000
6000000
5000000
4000000
3000000
2000000
1000000
0
02-Jun-19
02-Jun-20
02-Nov-19
02-Nov-20
02-Apr-19
02-May-19
02-Apr-20
02-May-20
02-Aug-19
02-Dec-19
02-Aug-20
02-Jan-19
02-Feb-19
02-Mar-19
02-Sep-19
02-Jan-20
02-Feb-20
02-Mar-20
02-Sep-20
02-Dec-20
02-Jan-21
02-Feb-21
02-Jul-19
02-Oct-19
02-Jul-20
02-Oct-20
Source: Federal Reserve, Total Assets of the Federal Reserve
https://www.federalreserve.gov/monetarypolicy/bst_recenttrends_accessible.htm.
3.3. Impact of monetary policy decisions on CB balance sheets and
money supply
The new round of monetary relaxation launched in 2019 but intensified in 2020 (see Sections 3.1 and
3.2), in particular, increasing the size of net asset purchases, has led to the further expansion of CB
balance sheets both in nominal terms (Figure 7) and even more in relation to GDP (Figure 8), because
GDP was shrinking in 2020 in all three analysed economies.
The BoJ has been rapidly expanding its total assets since 2013, so the year 2020 brought about only a
modest acceleration. The ECB recorded a more visible change in the previous trend: after a period of a
relatively stable stock of total assets (2018-2019), they started to grow rapidly from March 2020 (by
42.7% between the end of February and the end of December 2020). However, it was the Fed that made
the most dramatic U-turn. After a period of shrinking its balance sheet (2017-2019), it recorded a rapid
increase by 93.1% between the end of August 2019 and the end of December 2020, most of which
occurred during the period from March to June 2020.
PE 658.221 20Thinking Beyond the Pandemic: Monetary Policy Challenges in the Medium- to Long-Term
Figure 7: CB total assets, January 2019 – December 2020
8.000.000,00
7.500.000,00 Euro Area
Japan
7.000.000,00
United States
6.500.000,00
6.000.000,00
5.500.000,00
5.000.000,00
4.500.000,00
4.000.000,00
3.500.000,00
Note: ECB in EUR million, BoJ in JPY hundred million, US Fed in USD million.
Source: IMF International Financial Statistics.
Figure 8: Major currency areas: CB balance sheets as % of nominal GDP
Source: Mosser, 2020.
The rapid growth of CB assets and the monetary base has led to an increase in broad money (Figure 9),
although at a slower pace than the former. The annual growth of broad money amounted to 11.5% in
21 PE 658.221IPOL | Policy Department for Economic, Scientific and Quality of Life Policies
the euro area (December 2019 to December 2020), 14.7% in the United States (September 2019 to
September 2020), and 6.9% in Japan (June 2019 to June 2020).
Figure 9: Major currency areas: broad money, March 2019 – December 2020 (quarterly
data)
24.000.000
22.000.000
20.000.000
18.000.000
EA Japan US
16.000.000
14.000.000
12.000.000
Mar 2019 Jun 2019 Sep 2019 Dec 2019 Mar 2020 Jun 2020 Sep 2020 Dec 2020
Note: ECB in EUR million, BoJ in JPY hundred million, US Fed in USD million.
Source: IMF International Financial Statistics.
Figure 10: Composite bank lending rates for NFCs and households in the euro area, annual
in %, 2014-2020
Note: Composite bank lending rates are calculated by aggregating short- and long-term rates using a 24-month moving
average of new business volumes. The latest observation is for November 2020. NFCs stands for non-financial corporations.
Source: ECB, 2021, Chart 13, p. 24.
PE 658.221 22Thinking Beyond the Pandemic: Monetary Policy Challenges in the Medium- to Long-Term
However, the borrowing costs for the non-financial sector have improved only marginally, at least in
the euro area. Figure 10 shows that while composite commercial bank lending rates for households for
home purchases in the euro area continued to decrease in 2020, the similar rates for non-financial
corporations (NFCs), that is, businesses, even increased slightly in the second half of 2020.
Both the slower growth of broad money and the stabilisation or even increase in lending rates for
businesses suggest problems with the effective transmission of the bold monetary impulses provided
by CBs, which we will analyse in Section 3.4.
3.4. QE and an impaired monetary transmission mechanism
In our previous analysis (Dabrowski, 2019), we diagnosed the unintended negative impact of QE on the
depth of financial intermediation. When CBs increased their stock of assets, the money multiplier (MM),
defined as the quotient of broad money to the monetary base, decreased. When CBs stop net
purchases or decrease the stock of assets, the MM increased.
The negative impact of QE on the MM could be explained by the behaviour of commercial banks. When
CBs intensified asset purchases, commercial banks increased their voluntary deposits with CBs despite
negative deposit rates in the ECB and BoJ. When CBs stabilised or started to reduce their stocks of
assets, commercial banks gradually reduced their deposits with CBs.
Figure 11: Money multiplier (broad money to monetary base) in major currency areas
2019-2020
6,50
6,00
EA Japan US
5,50
5,00
4,50
4,00
3,50
3,00
2,50
Mar 2019 Jun 2019 Sep 2019 Dec 2019 Mar 2020 Jun 2020 Sep 2020 Dec 2020
Source: IMF International Financial Statistics.
23 PE 658.221IPOL | Policy Department for Economic, Scientific and Quality of Life Policies Figure 12: CB liabilities to other depository corporations, major currency areas, 2019-2020 5.000.000 4.500.000 EA Japan US 4.000.000 3.500.000 3.000.000 2.500.000 2.000.000 1.500.000 1.000.000 Note: ECB in EUR million, BoJ in JPY hundred million, US Fed in USD million. Source: IMF International Financial Statistics. Our hypothesis (Dabrowski, 2019) was that QE absorbed so many low-risk liquid securities from the financial market that commercial banks had to increase their voluntary deposits in CBs to be able to manage their liquidity according to prudential norms. The alternative but not radically different interpretation was that commercial banks were restricted in their lending activities by the limited demand for credit (despite low interest rates) or by the various regulatory limits imposed on them as result of the far-reaching tightening of financial market regulations after 2008. Figures 11 and 12 suggest that a negative impact of QE on the MM was also present during the newest round of QE in 2019-2020, in particular, in the case of the Fed and the ECB. The additional factors that could prevent the full absorption of the growing monetary base by commercial banks are related to the economic characteristics of the current crisis. By this we mean the direct consequences of the lockdown measures and the crisis-related uncertainty, which negatively affect investment decisions in many sectors and industries and increase lending risk. Overall, the above analysis points to an impaired transmission mechanism when monetary policy resorts to UPM, especially QE. 3.5. Monetary conditions outside major currency areas In late February and early March 2020, emerging market (EM) economies suffered from large-scale capital outflows as result of the global financial market turmoil caused by the outbreak of the pandemic. Capital outflow led to a rapid increase in EM collateral default swaps (CDSs), spreads between EM bond yields and those in major currency areas, the depreciation of EM market currencies, and the collapse of their stock markets (Dabrowski and Dominguez-Jimenez, 2020). Fortunately, in most EMs, the adverse shock lasted only a few weeks, except in countries that were macroeconomically fragile before the pandemic, like Argentina, Lebanon, or Turkey. The monetary PE 658.221 24
Thinking Beyond the Pandemic: Monetary Policy Challenges in the Medium- to Long-Term

expansion in major currency areas (see Sections 3.1 and 3.2) has helped easing EM financial conditions
since April 2020 (Kalemli-Ozcan, 2020). Given the dominant role of the USD, the Fed’s monetary policy
has had the biggest positive impact on EM financial conditions and has helped in returning net capital
inflows; the ECB and BoJ also contributed to this relief, especially in their neighbourhoods.
Apart from monetary easing, both the Fed and the ECB launched currency swaps with several EM CBs.
The ECB also offered EUR repo lines to non-euro area CBs (Lane, 2020). On 10 December 2020, the ECB
Governing Council extended the repo facility for CBs and all temporary swap and repo lines with non-
euro area CBs until March 2022 (ECB, 2020).

3.6.       CPI inflation and changes in asset prices
In 2019 and Q1 2020, the euro area recorded a 12-month inflation below 1.5% and Japan – below 1.0%.
Inflation in the United States was higher – between 1.5-2.5% (Figure 13). After the outbreak of the
COVID-19 pandemic, inflation decreased everywhere. In the second half of 2020, it became negative in
the euro area and Japan. In the United States, it was in the range of 1.0-1.5%.

Figure 13:         12-month inflation in major currency areas, in %, 2019-2021
 2,5

 2,0

 1,5

 1,0

 0,5

 0,0

-0,5

-1,0                                     Japan        US       EA (HICP)

-1,5

Note: CPI inflation for the US and Japan, HICP inflation for the EA.
Sources: IMF International Financial Statistics (the US and Japan), ECB (the EA).

As mentioned in Section 3.1, low inflation in the euro area served as the key justification for a return to
QE in Q4 2019. After the pandemic outbreak, the weight of this argument in favour of continuous
monetary expansion has been further strengthened in all major currency areas (see Buiter, 2021;
Ranasinghe et al., 2020). However, one should be careful with drawing far-going conclusions from very
low or even negative inflation figures (see O’Brien et al. [2021] for a comprehensive analysis of supply-
and demand-side factors influencing inflation during the COVID-19 pandemic).
First, low inflation may result not only from the subdued aggregate demand or hypothetically
insufficient money supply but also from lockdown measures that radically change the composition of

                                                              25                                  PE 658.221
IPOL | Policy Department for Economic, Scientific and Quality of Life Policies
the consumer basket 13 and distort sectoral and industry-specific balances between demand and
supply.
Second, as analysed in Section 2.3, the subdued aggregate demand can have a temporary character,
resulting from anti-pandemic containment measures. It can rebound once the pandemic and
lockdown are over (unfreezing a monetary overhang resulting from forced saving).
Third, there were numerous supply-side shocks in 2020, the most notable of them being related to the
collapse of oil and other commodity prices in March and April 2020 (Figure 14).
Figure 14: Price of crude oil WTI, in USD per 1 barrel, 2020-2021
Source: Trading Economics, https://tradingeconomics.com/commodity/crude-oil.
Fourth, temporary cuts in the value added tax (VAT) in some euro area countries (Austria, Cyprus,
Germany, Greece, and Ireland) in the second half of 2020 14 also had a downward impact on recorded
inflation in this period. The most substantial reduction in VAT rates took place in Germany where the
basic VAT rate was lowered from 19 to 16% and the reduced VAT rate – from 7 to 5% for all goods and
services, for the period of 1 July to 31 December 2020 (Asquith, 2020). In other economies, VAT cuts
concerned only selected goods and services.
Figure 15 shows the effects of excluding changes in energy, food, travel-related items, clothing and
footwear prices, and VAT rates in Germany from the headline HICP indicator. Such an underlining
inflation measure remains in positive territory and is more stable than the headline HICP. However, it
also represents the declining trend in the second half of 2020.
13 Technically, changes in the composition of the consumer basket and the weights of individual items can be taken into consideration by
CPI statistics ex-post in the subsequent year.
14 See 2021 European Union VAT rates, https://www.avalara.com/vatlive/en/vat-rates/european-vat-rates.html.
PE 658.221 26Thinking Beyond the Pandemic: Monetary Policy Challenges in the Medium- to Long-Term
Figure 15: Measures of underlying inflation in the euro area, 12-month rate in %, 2019-
2020
Notes: HICPX – HICP excluding food and energy; HICPXX – HICP excluding energy, food, travel-related items, clothing and
footwear prices.
Source: ECB, 2021, Chart 8, p. 18.
The measure of underlying inflation can help to predict potential changes in the headline HICP in the
near future. By this we mean growing oil prices since November 2020 (Figure 14) and the expiration of
most temporary VAT rate cuts in Germany at the end of 2020. Perhaps the euro area positive headline
inflation of 0.8% in January 2021 reflects the impact of these changes and the beginning of a new trend.
27 PE 658.221IPOL | Policy Department for Economic, Scientific and Quality of Life Policies
Figure 16: US Dow Jones Industrial Average (left-hand scale, blue line) and Euro Stoxx 50
Market Index (right-hand scale, black line), 18 February 2020-18 February 2021
Source: Trading Economics, https://tradingeconomics.com.
Figure 17: US (left-hand scale, blue line) and euro area (right-hand scale, black dotted line)
Nominal Home Prices Indexes, 18 February 2020-18 February 2021
Source: Trading Economics, https://tradingeconomics.com.
PE 658.221 28Thinking Beyond the Pandemic: Monetary Policy Challenges in the Medium- to Long-Term
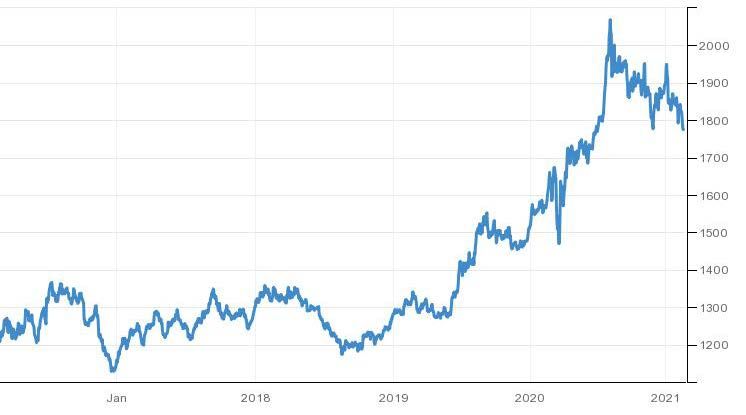
Figure 18: Price of gold in USD for 1 troy ounce, 2016-2021
Source: Trading Economics, https://tradingeconomics.com.
Figure 19: Price of Bitcoin in USD for 1 unit, 2016-2021
Source: Trading Economics, https://tradingeconomics.com.
29 PE 658.221You can also read