Will Europe Face A Lost Decade? A Comparison With Japan's Economic Crisis - Working Paper No. 2013-03 CREMA S dstrasse 11 CH - 8008 Z rich ...
←
→
Page content transcription
If your browser does not render page correctly, please read the page content below

Center for Research in Economics, Management and the Arts

                                  Raumplanung:
                            Rückzonungen sollen
                        Einzonungen ermöglichen
          Will Europe Face A Lost Decade?
A Comparison With Japan's Economic Crisis
                                                                      René L. Frey

              Artikel erschienen in Basellandschaftliche Zeitung, 28. November 2012, S. 30,
      aufgrund des Referats «Mehrwertabschöpfung: Eine politisch-ökonomische Analyse»,
  gehalten am 1. November 2012 in Zürich im Rahmen des «Forums Raumwissenschaften»,
                                                              Universität Zürich und CUREM

                            Beiträge zur aktuellen Wirtschaftspolitik No. 2012-04

                                                      Working Paper No. 2013-03

       CREMA Gellertstrasse 18 CH-4052 Basel www.crema-research.ch
     CREMA Südstrasse 11 CH - 8008 Zürich www.crema-research.ch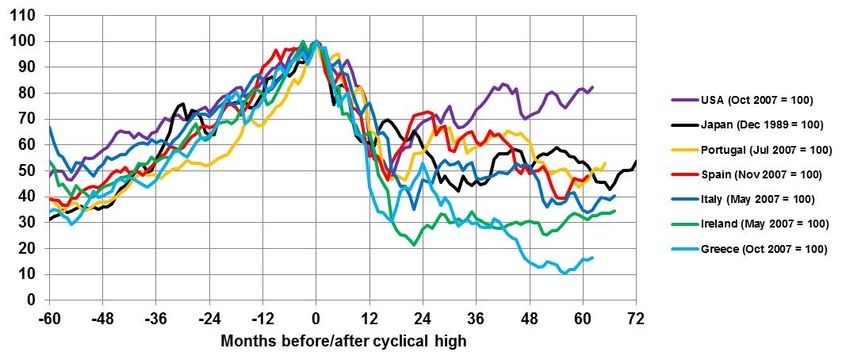
Will Europe Face A Lost Decade?
         A Comparison With Japan’s Economic Crisis

                                         by

                              Christoph A. Schaltegger
               University of Lucerne, University of St. Gallen, CREMA

                                         and

                                   Martin Weder
                                University of Lucerne

                                      Abstract

After more than five years have passed since the start of the global financial crisis,
many European countries are still suffering from financial instability, surging sover-
eign debt, economic stagnation or decline, high unemployment and political turmoil.
We compare consequences and policy measures during Europe’s current crisis with
those in Japan in the 1990s after the burst of a real estate and asset price bubble.
We show that despite marked differences, there are many similarities both in eco-
nomic outcome and policy reactions. Given the complexity, severity and persistence
of Europe’s multiple crises, the threat of a Lost Decade similar to the one Japan has
witnessed may not be unlikely. The paper concludes by presenting some of the les-
sons learned from Japan and Europe.

Corresponding Author:        Christoph A. Schaltegger
                             University of Lucerne
                             Frohburgstrasse 3
                             CH-6002 Lucerne
                             Switzerland
                             christoph.schaltegger@unilu.ch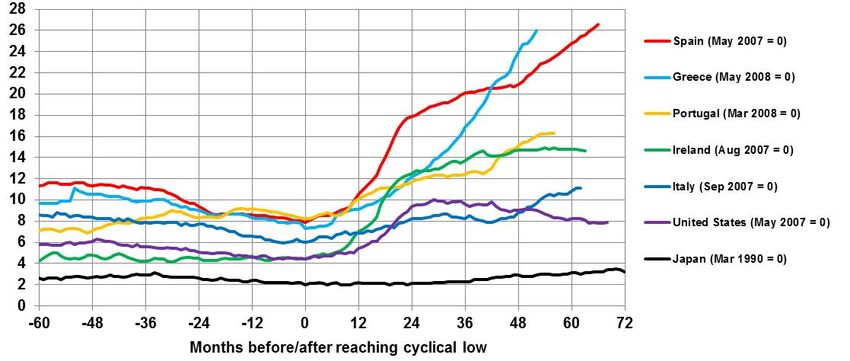
1.     Introduction

The current financial and economic crisis is the largest since the Great Depression of the
1930s. In 2009, the world economy contracted for the first time since World War II and trade
declined by more than 10 percent. The IMF (2010) estimated that financial institutions faced
crisis-related losses of $2.2 trillion between 2007 and 2010 alone. As a result of rapid eco-
nomic decline, more than 50 millions of jobs were lost (ILO, 2012).

Although central bank and government interventions were quick and unprecedented in
scope, there were widespread fears about a second Great Depression. In spring 2009, an
article by O’Rourke and Eichengreen (2009) received considerable attention, showing that in
the first months since the start of the crisis, the decline in world industrial output and trade
showed a similar pattern as during the 1930s. The decline in world stock markets was even
more pronounced. On the other hand, central banks around the world lowered interest rates
substantially and increased money supply while governments recorded much higher public
deficits. An update by O’Rourke and Eichengreen (2010) described that after declining for
almost a year and falling by 13 percent from peak to trough, world industrial production man-
aged to rebound. After more than 20 months into the crisis, it was about 5 percent below
peak levels whereas during the Great Depression it was around 25 percent. World trade and
equity markets also exhibited clear signs of recovery despite remaining below pre-crisis lev-
els.

However, the findings of Reinhart and Rogoff (2009) indicate that economic downturns after
financial crises tend to be deep and prolonged. On average, real house prices declined by 35
percent over a period of six years, equity prices collapsed by 55 percent over three and a
half years while output fell by 9 percent. In addition, unemployment rose by 7 percentage
points and government debt by 86 percent. Historically, banking crises and sovereign debt
crises are often closely linked as private debt is frequently transformed into government debt
(Reinhart and Rogoff, 2011). Furthermore, following a period of strong credit expansion, sov-
ereign defaults often occur in clusters (Panizza et al., 2009).

Nonetheless, the National Bureau of Economic Research in September 2010 declared that
the US recession was officially over, lasting from December 2007 until June 2009 and mark-
ing it the longest recession since World War II. While the US recovery is slow by historical
comparison, the economy is growing, unemployment is declining and house prices appear to
have bottomed out. Furthermore, financial institutions have reported increasing earnings on a
year-on-year basis for thirteen straight quarters (FDIC, 2012). In many cases they have paid
back the money they received from the US government in full. Fiscal policy, private sector
deleveraging and persistent unemployment remain important issues for policymakers, but
fears expressed during the height of the crisis about another Great Depression did not mate-
rialize. 1

In contrast, the financial and economic crisis in Europe intensified and turned into a sover-
eign debt crisis with recurrent bailouts for financial institutions and governments and rising
unemployment. Rising government and private sector debt levels, current account imbal-
ances and monetary inflexibility have become increasingly large challenges for the stability of
the Euro area. Shambaugh (2012) argues that Europe is facing three crises at the same
time: A banking crisis, a sovereign debt crisis and a growth crisis. Furthermore, these multi-
ple crises are closely interlinked as an intensification of one crisis has large repercussions on
the other two and vice versa. He argues that as long as the interdependence of these various
problems is not taken into account, partial solutions will not help or be even counterproduc-
tive.

Given the severity and duration of the current crisis, several authors have wondered whether
Europe and the United States are facing a “lost decade” like Japan in the 1990s, character-
ized by private sector deleveraging, rising government debt, unemployment and very low
economic growth. The Economist (2008), Randazzo et al. (2009) and Koo (2009, 2010,
2011) all find striking similarities between Japan and the United States that include a burst
real estate bubble and declining asset prices, large losses in the financial sector as well as
expansionary fiscal and monetary policy. Koo (2011), Lanz (2012), Schnabl (2012) and the
Economist (2012) came to similar conclusions about Europe.

We analyze economic outcomes and policy reactions in Europe over the past five years and
compare them with those in Japan after the burst of the financial and real estate bubble at
the beginning of the 1990s. Following a brief review of the causes and consequences of Ja-
pan’s burst bubble (section 2), we look at fiscal and monetary policy responses after the out-
break of the crisis (section 3). Economic developments such as economic growth, stability of
the financial sector, unemployment, consumer and asset prices, current account balances
and exchange rates and changes in competitiveness are discussed in section 4. In section 5,
we briefly look at the political and social costs associated with the crisis. The paper con-
cludes by presenting some of the lessons learned from Japan and Europe.

1
  On the other hand, alternative measures of unemployment that include marginally detached workers
and employees that work part-time due to economic reasons, are still high. This extended unemploy-
ment rate published by the Bureau of Labor Statistics still stood at 14.4 percent in January 2013 after
reaching 18 percent in January 2010 (BLS, 2013). Furthermore, the number of people who receive
food stamps has risen to an all-time high of 47.7 million people in September 2012 and has triggered
costs of almost $72 billion in 2011 alone (USDA, 2013).
2.     Causes and Consequences of Japan’s burst bubble
After World War II, Japan experienced very high growth rates – similar to the ones China has
recorded since the beginning of the 1980s – and quickly became the world’s second largest
economy behind the United States. Between 1951 and the first oil shock in 1973, the aver-
age annual growth rate was 10 percent while plant and equipment investment grew by 22
percent on average (Nakamura, 1995). High and persistent current account surpluses led to
an appreciation of the Yen and made Japanese financial assets more attractive. This was
particularly the case after the Plaza Agreement was signed in September 1985. The agree-
ment between the governments of France, West Germany, Japan, the United Kingdom and
the United States to depreciate the US Dollar in relation to the Yen and the Deutsche Mark
by intervening in currency markets weakened Japan’s export dependent economy and led to
a recession (McKinnon, 1997). The Japanese central bank quickly lowered interest rates to
stimulate growth and discourage speculative capital inflows (Schnabl, 2012). Market expec-
tations that the low interest rates would continue for an extended period were widespread,
although the economy rebounded rapidly. At the same time, financial deregulation led to ag-
gressive lending by financial institutions and to overconfidence and euphoria, adding further
fuel to the build-up of a bubble. Furthermore, taxation and regulations were biased toward
accelerating the rise in land prices (Shiratsuka, 2003). The result was a speculative boom
both in financial assets and real estate prices. According to Okina et al. (2001), the bubble
period lasted from 1987 to 1990 because this period was marked by a rapid increase in asset
prices, an expansion of monetary aggregates and credit and an overheating of economic
activity. However, the so-called Heisei boom was also characterized by persistent economic
growth and stable inflation rates (Shiratsuka, 2003). Between the beginning of 1985 and the
burst of the bubble less than five years later, the Nikkei 225 index increased from 15’000 to
an all-time high of 38’957 on December 1989 while land prices more than doubled.

The Bank of Japan considered this boom in financial assets and real estate prices to be un-
sustainable and started increasing interest rates sharply from 2.5 percent in April 1989 to 6
percent in August 1990. Real estate transactions were hindered through increased taxation
and new regulation (Schnabl, 2012). In March 1990, the Ministry of Finance introduced “real
estate loan restrictions” which forced financial institutions to publish monthly reports of their
real estate loans and to limit the increase in such lending (Nakamura, 1995). The Nikkei 225
reached its peak in December 1989 while land prices in the six largest urban areas started
declining in the second half of 1991. The Nikkei 225 lost more than 40 percent of its value in
the first year after the burst and dropped by more than 80 percent altogether before reaching
a low at 7’604 in April 2003. The decline in land prices was similar.
The rapid and vast decline in real estate and asset prices led to a recession in Japan and
mounting losses for financial institutions. However, lending to insolvent firms continued as
financial institutions tried to keep losses from materializing (Lanz, 2012). At the same time,
banks became “zombies”, depending on large amounts of subsidies and boundless liquidity
at almost zero interest rates (Caballero et al., 2008; Schnabl 2012). Consolidation of banks
proceeded only gradually, eventually leading to only four national banks in Japan. The col-
lapse within the Japanese economy in general occurred slowly rather than catastrophically.
The 1990s were later referred to as the “lost decade” because the economy either contracted
or grew only at a paltry rate. Saxonhouse and Stern (2003) argue that problems were even
more serious after this decade as public debt increased dramatically and the balance sheets
of commercial banks were even weaker than at the beginning of the 1990s. As economic
conditions did not improve substantially in the following decade, the whole period from the
1990s and 2000s is sometimes referred to as the Lost Two Decades (“ushinawareta ni-
junen”).

Koo (2009, 2011) shows that Japan’s “lost decade” in the 1990s was not the result of an or-
dinary recession, but rather the outcome of a debt-financed bubble that burst. Debt delever-
aging then took years and eventually caused a balance sheet recession as firms and house-
holds increased savings and payed off debt despite very low interest rates. As Japanese
firms became net savers, massive fiscal stimulus by the government was the only way to
maintain the level of GDP because monetary policy was facing a “liquidity trap”. According to
Koo (2010), net debt repayment in some years was as large as 6 percent of GDP.

Koo (2011) argues that the Eurozone is currently in a balance sheet recession as well as the
corporate sector and households have both been net savers since 2010. Simultaneous fiscal
consolidation by governments would thus trigger a deflationary spiral and aggravate the eco-
nomic situation. He argues that in such a situation, monetary policy is ineffective (liquidity
trap) and the government would thus have to borrow and spend the private sector’s excess
savings. Schnabl (2012) on the other hand argues that while expansionary monetary and
fiscal policy are both able to stabilize the economy in the short run, their long term conse-
quences are dire (political instability, economic stagnation, new bubbles, nationalization of
large parts of the economy, declining prosperity). He suggests that Europe should learn from
Japan’s experience and abandon its expansionary monetary and fiscal policy although such
an exit is associated with substantial adjustment costs.
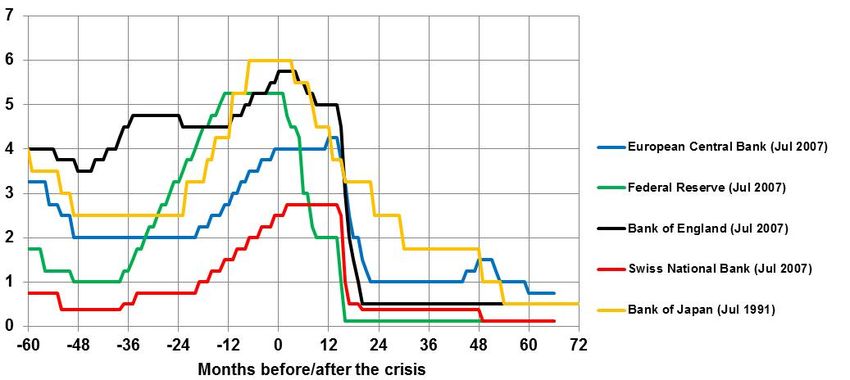
3.       Monetary and fiscal policy

3.1.     Monetary policy
Similar to Japan’s experience at the beginning of the 1990s, a strong and rapid increase in
short term interest rates in the United States eventually led to the burst of the real estate
bubble and ignited an economic downturn and large write-offs for financial institutions. Start-
ing from an unusually low level of 1 percent, the Federal Reserve raised the federal funds
rate 17 times between May 2004 and June 2006 to 5.25 percent. In Europe, the Bank of
England, the European Central Bank and others soon followed suit as economic prospects
improved and inflation rates were projected to rise (figure 1). While the Federal Reserve has
been criticized repeatedly for its strategy to keep interest rates low for an extended period of
time after a short and mild recession in 2001 and thus contributing to the causes of the global
financial crisis, recent evidence indicates that the European Central Bank’s interest rates
were exceptionally low as well. Wynne and Koech (2012) show that the ECB’s policy rate
between 1999 and 2007 was always at the lower bound of the interest rate range proposed
by the Taylor rule. While such a policy seemed appropriate for countries like France and
Germany, it turned out to be too expansive for Europe’s periphery, resulting in unsustainable
booms. The authors further show that economic differences such as unemployment or infla-
tion rates in the Euro area are larger than in the United States, indicating that a one-size-fits-
all monetary policy is less appropriate and presents one of the key challenges of the EMU.

Figure 1: Official central bank interest rates in percent

Sources: European Central Bank, Federal Reserve, Bank of England, Swiss National Bank, Bank of Japan.

In retrospective, the Bank of Japan’s monetary policy at the end of the 1980s resembles the
Federal Reserve’s strategy ahead of the global financial crisis. Interest rates had been kept
at exceptionally low levels for an extended period of time despite the fact that economic
growth was robust and strong price increases in various financial assets became evident.
Interest rates in Japan were then raised repeatedly and decisively from 2.5 percent to 6 per-
cent within 16 months (April 1989 to August 1990).

The policy response to the beginning of the crisis, however, differed. Within 15 months, the
Federal Reserve slashed the federal funds rate from 5.25 to near zero in November 2008.
Federal Reserve Chairman Ben Bernanke has repeatedly expressed concerns that one of
the most important lessons from the Great Depression is that monetary policy had been too
restrictive and procyclical, leading to deflation and a downward spiral in economic activity.
The Federal Reserve has committed itself to keep interest rates near zero until the middle of
2015 even if economic activity should be stronger than currently anticipated. The Bank of
Japan on the other hand reduced interest rates more slowly from 6 percent to 3.25 percent
within the first 15 months of the crisis. Persistent problems in the financial sector, deflation
and slow growth led the Bank of Japan to reduce interest rates further to 0.5 percent in Sep-
tember 1995, but it was not until September 2001 – more than 10 years after the outbreak of
the crisis – when it reached its cyclical low at 0.1 percent.

In Europe, the Bank of England, the European Central Bank, the Swiss National Bank and
other national banks outside the Eurozone engaged in concerted action after the collapse of
Lehman Brothers in September 2008, frequently lowering interest rates and providing large
amounts of liquidity to struggling financial institutions at the same time. By May 2009, all offi-
cial short term interest rates of the largest central banks were at 1 percent or lower. In the
wake of Europe’s sovereign debt crisis, both the European Central Bank and the Swiss Na-
tional Bank lowered interest still further in 2011 and 2012.

While the Bank of Japan did not start purchasing government bonds, mortgages and shares
until late in the 1990s, the willingness to resort to unconventional measures referred to as
quantitative easing was and is widespread in today’s crisis. The Bank of Japan has repeat-
edly tried to find an adequate exit strategy from the expansive monetary policy, selling gov-
ernment bonds at several points in time, but expanding its balance sheet further against the
background of persistent fragility in financial sector and weak economic prospects (Schnabl,
2012).

Today, the Bank of Japan holds Japanese government bonds in the amount of about 24 per-
cent of GDP, trailing only the Bank of England (figure 2). After Japan’s new prime minister
Shinzo Abe repeatedly urged the Bank of Japan to loosen monetary policy further, the cen-
tral bank increased its purchases of government bonds in January 2013 to overcome defla-
tion and support economic activity. It also set a new explicit inflation target of 2 percent. In
the United States, after several rounds of quantitative easing, the Federal Reserve holds
Treasury bills worth $1.7 trillion or about 11 percent of GDP on its balance sheet. In addition,
the Fed has bought mortgage-backed securities worth $1 trillion. In December 2012, the Fed
announced that it would purchase mortgage-backed securities at a pace of $40 billion per
month and treasury bills worth $45 billion each month to “support a stronger economic re-
covery”. For the first time, it also set specific thresholds for the unemployment rate at 6.5
percent and inflation projections at 2.5 percent. As long as unemployment remains above
and inflation below the defined threshold, interest rates would stay at the current historically
low level.

Figure 2: Stock of government bonds as a percentage of GDP, end of year (2007-2012)

Sources: European Central Bank, Federal Reserve, Bank of England, Bank of Japan, International Monetary Fund.

Unlike other large central banks, the ECB has not been as aggressive in extending liquidity
and cutting interest rates. In the tradition of the Deutsche Bundesbank, its legal mandate is
limited and exclusively focused on price stability whereas the purpose of the Federal Re-
serve is “to promote effectively the goals of maximum employment, stable prices and moder-
ate long-term interest rates” (Federal Reserve, 2005). In April and July 2011, the ECB even
increased its policy rate twice by 25 basis points to 1.5 percent due to perceived upside risks
for price stability. Nevertheless, the ECB started a Securities Market Program (SMP) in May
2010 and purchased government bonds from Eurozone member countries worth $219 billion
or slightly more than 2 percent of the Eurozone’s GDP. In December 2011 and February
2012, the ECB auctioned low interest loans (LTRO – Long Term Refinancing Operations) to
European banks with a duration of 36 months and interest of just 1 percent. In the first auc-
tion, loans worth €489 billion were announced, while the second one resulted in additional
loans worth €529.5 billion. Sovereign bond yields in the Euro area have been declining since
July 2012 when ECB president Mario Draghi stated that “within our mandate, the ECB is
ready to do whatever it takes to preserve the Euro. And believe me, it will be enough”. In
September 2012, the ECB declared that the SMP would be terminated and that assets would
be kept until maturity. The ECB announced a new Outright Monetary Transactions (OMT)
program that would operate without any time or size limit. The ECB intends to address per-
ceived distortions in the government bonds markets to ensure the proper transmission of
monetary policy. Although the ECB is willing to buy limitless amounts of government bonds,
these operations are tied to the willingness of governments to adhere to their commitments.
As a result of all these actions, the European Central Bank’s balance sheet has more than
doubled from an average of €1.2 trillion during 2007 to €3.1 trillion by October 2012. In com-
parison with the Federal Reserve, the Bank of England or the Swiss National Bank, however,
this expansion is less pronounced (figure 3).

Figure 3: Total central banks assets (Index, January 2007 = 100)

Sources: Bank of England, Bank of Japan, European Central Bank, Federal Reserve, Swiss National Bank.

3.2.     Fiscal policy

The economic boom in Japan during the late 1980s led to a strong increase in government
revenue, budget surpluses between 1988 and 1992 and a slight decline of the government
debt to GDP ratio (figure 4). After the bubble burst, government finances quickly deteriorated
– a result of both declining revenue through automatic stabilizers and increased government
expenditure. As a response to the economic crisis, the Japanese government implemented a
series of economic stimulus programs with an emphasis on infrastructure projects such as
roads, bridges and rail tracks for bullet trains (Yoshino and Mizoguchi, 2010). The budget
surplus of 1.9 percent in 1991 turned into a deficit of more than 4 percent of GDP from 1995
onwards. Combined with low or negative economic growth rates, government debt as a per-
centage of GDP increased dramatically from around 60 percent in 1990 to more than 220
percent in 2012 (OECD, 2012). Government revenue as a percentage of GDP did not reach
pre-crisis levels until the emergence of the economic boom of 2005-08. Government expen-
diture on the other hand increased from around 30 percent to 36 percent of GDP between
1990 and 2000 and reached new highs of more than 40 percent during the Great Recession.
Bailouts and capital injections for financial institutions also contributed to this increase. Fiscal
stimulus between 1992 and 2000 amounted to a total of 27 percent of GDP, yet economic
growth during that time span averaged just 1 percent (European Commission, 2009). The
strong increase in government debt has led to a situation in which the Japanese government
currently finances almost half of its expenditure through the issuance of new debt (bond de-
pendency ratio of 49 percent) while national debt service is the second largest expenditure
item behind social security (29 percent) at 24 percent. Despite the high amount of debt, av-
erage interest rates on government bonds have declined from around 6 percent at the begin-
ning of the 1990s to slightly more than 1 percent today (Ministry of Finance Japan, 2011).
This is primarily a result of persistent deflation, zero short-term interest rates and outright
bond purchases by the Bank of Japan. In addition, around 95 percent of Japanese govern-
ment debt is held by domestic residents, a result of a strong home bias and extreme risk
aversion (Tokuoka, 2010). With rapid population ageing and a shrinking labor force, this
trend is unlikely to continue much longer. The national savings rate has already declined by
more than 10 percentage points since the beginning of the 1990s while the household sav-
ings rate declined from 12.9 percent in 1994 to 0.4 percent in 2008 (OECD, 2012). At the
same time, even a slight increase in interest rates is a serious threat for Japan’s fiscal sus-
tainability. The rise in government debt is also a threat for financial sector stability as gov-
ernment bonds constitute 24 percent of all bank assets and are expected to rise to 30 per-
cent by 2017 (IMF, 2012c).

Figure 4: Government expenditure, revenue and debt in Japan as a percentage of GDP

Sources: OECD Economic Outlook Database, IMF World Economic Outlook Database.

During the Great Recession, governments around the world acted swiftly and decisively, pro-
viding support and capital injections for financial institutions and implementing fiscal stimulus
programs. Fiscal packages in the OECD averaged 2.7 percent of GDP during the 2008-10
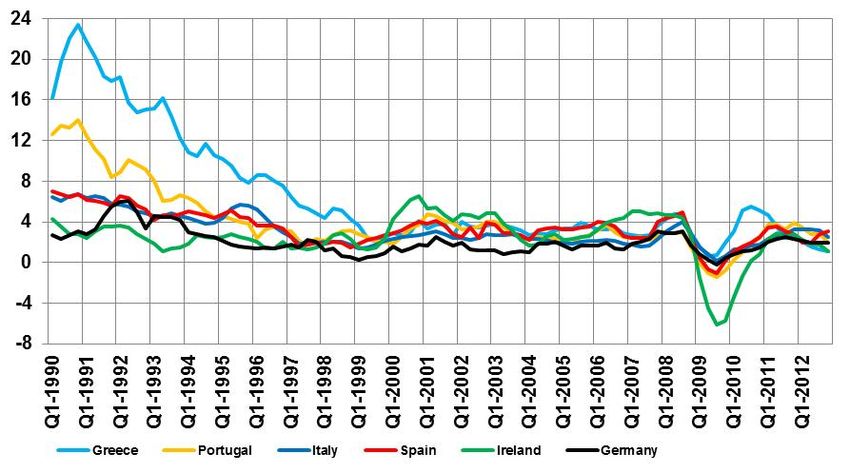
period. A little more than 50 percent of fiscal packages were implemented in 2009. While
countries like Australia, Canada, China, South Korea or the United States quickly agreed
upon large fiscal stimuli of more than 4 percent of GDP, strategies among European coun-
tries differed. Denmark, Finland, Germany, Luxembourg, Spain or Sweden implemented
substantial packages of more than 3 percent of GDP with several measures including lower
taxes. Countries like Italy or Portugal distributed less than 1 percent of GDP (OECD, 2009,
2010). Others like Greece, Hungary, Ireland and Iceland were even forced to cut expenditure
and raise taxes due to rapidly rising government debt and financial market pressure.

Fiscal stimulus, support for financial institutions, declining government revenue and very low
or negative economic growth led to a surge in government debt (figure 5). Over the last five
years, government debt in the Euro area increased by 29 percentage points of GDP. In Ja-
pan, government debt increased by 31 percentage points of GDP during the first five years of
the crisis. In Europe, the increase was particularly dramatic in Ireland where debt as a per-
centage of GDP between 2007 and 2012 more than quadrupled from 29 to 123 percent of
GDP. Of this increase, 38 percentage points are due to financial sector support (IMF, 2012a).
The United Kingdom, Spain and Greece also witnessed an increase in public debt of 50 per-
centage points of GDP or more.

Figure 5: Cumulative increase in public debt in percentage points of GDP since 2007

Sources: OECD Economic Outlook No. 92.

Similar to Japan, Ireland and Spain recorded budget surpluses before the burst of a major
real estate bubble. In 2007, government debt was at 29 and 42 percent of GDP respectively,
much lower than the average among all Euro area counties (72 percent). Greece and Italy on
the other hand had been heavily indebted at well over 100 percent of GDP for several years.
With the introduction of the Euro, long-term interest rates in Europe quickly converged (figure
6). Countries like Greece, Italy, Portugal and Spain who used to borrow at nominal interest
rates as high as 24 percent in the early 1990s, were now able to borrow at almost identical
interest rates as other Euro area member countries. Between the middle of 2004 and late
2007, Greece was even able to borrow at lower rates than the United States. Real interest
rates, computed as yields on ten year government bonds minus the annual inflation rate,
were negative on several occasions between 2003 and early 2008 for Greece, Ireland and
Spain. With the outbreak of the financial and economic crisis in 2008/09, financial markets
started to differentiate among Euro area countries. Fears that countries like Greece, Ireland
or Portugal would no longer be able to service their debt and would not receive any help from
other EU countries led to a sharp rise in yield spreads (figure 6). Average interest rates have
remained relatively stable over the past few years, but a loss in confidence and fears of con-
tagion have resulted in capital flight in the southern countries and huge capital inflows in the
northern economies like France, Germany or the Netherlands and including several countries
outside the Euro area like Denmark, Norway, Sweden or Switzerland.

Figure 6: Long-term interest rates in the Euro area in percent (1993-2012)

Sources: OECD, European Central Bank.

Rising government debt and interest rates forced several European countries into austerity at
a time when unemployment was still rising and economic growth low in some cases and
negative in others. Starting in May 2010 with the first rescue package for Greece worth €110
billion, fiscal policy in many European countries suddenly shifted gears as fiscal stimuli ran
out and fiscal adjustments started to be implemented. From this stage on, fiscal policy in Eu-
rope followed a completely different path than in Japan in the 1990s. It also differs from the
strategy in the United States and Japan today and has been controversially discussed. 2

2
 For a general discussion about the necessity and timing of austerity see for example a collection of
essays edited by Corsetti (2012), Krugman (2012) or Jayadev and Konczal (2010). More recent evi-
Ireland received financial support worth €85 billion in November 2010 and Portugal followed
in May 2011 (€78 billion). Greece then received a second rescue package and Spain re-
ceived a €100 billion bailout package for its troubled banks in July 2012. In late November
2012, international creditors agreed to give Greece two additional years until 2016 to reduce
the budget deficit. Because government debt is projected to reach 190 percent of GDP in
2014, interest rates on bailout loans were cut, interest payments were suspended for a dec-
ade and a bond buyback was initiated. Greece will receive an additional €43.7 billion of
which €34.4 billion were paid out in December 2012. Cyprus may receive a bailout package
as large as €17.5 billion or 100 percent of GDP. As of February 2013, the IMF, the European
Financial Stability Facility (EFSF), the European Stability Mechanism (ESM) and all other
commitments sum up to close to €500 billion for Greece, Ireland, Portugal and Spain. More
than €340 billion or close to 70 percent have already been disbursed (table 1). As these
loans are tied to strict conditions, fiscal policy shifted gears. However, fiscal policy among all
Euro area countries was already contractionary in 2010. The cyclically adjusted primary defi-
cit decreased by 0.8 percentage points in comparison with 2009 and was lowered further in
2011 by another 1.2 percentage points. Assuming that fiscal adjustments will continue to be
implemented as projected by the OECD, the cumulative improvement of the cyclically ad-
justed primary balance in countries like Greece, Iceland, Ireland, Portugal and Spain is sub-
stantial and among the largest in the history of industrialized countries. In the past, substan-
tial deficit reductions sometimes lasted more than a decade as in Belgium (1984-1998), Ire-
land (1979-1989) or Japan (1979-1990).
Table 1: Financial support for Eurozone countries in billions of Euros (as of February 2013)
IMF EFSF/ESM Other Share
Time Span Commitment Commitment Commitment Commitment Disbursed Disbursed
Greece May 2010 - Mar 2016 245,6 48,1 144,6 52,9 186,0 75,7%
Ireland Nov 2010 - Dec 2013 67,5 22,5 17,7 27,3 53,0 78,5%
Portugal May 2011 - May 2014 78,0 26,0 26,0 26,0 62,0 79,5%
Spain Jul 2012 - Dec 2013 100,0 100,0 41,4 41,4%
TOTAL 491,1 96,6 288,3 106,2 342,4 69,7%
Sources: CESifo, IMF, EFSF.
dence regarding the effects of fiscal adjustments on macroeconomic aggregates are presented by
Alesina and Ardagna (2010), Alesina et al. (2012), Guajardo et al. (2011), the IMF (2010) or Schalteg-
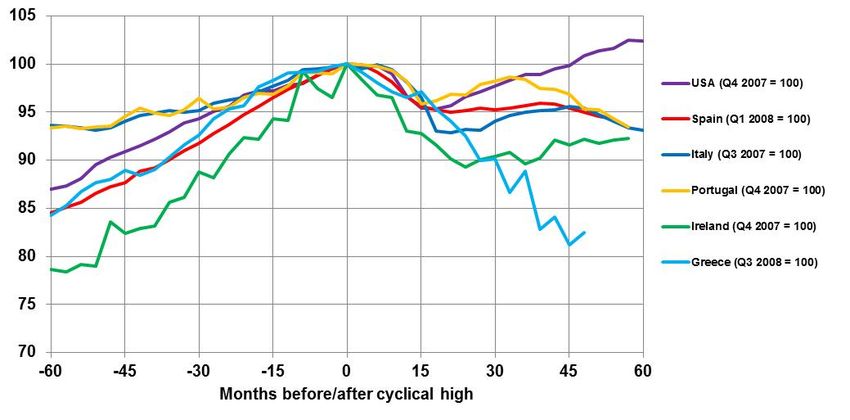
ger and Weder (2012).Figure 7: Cumulative improvement of the cyclically adjusted primary balance (% of GDP) Source: IMF (2009), OECD (2012). 4. Economic developments 4.1. Economic growth One of the characteristics of the Great Recession is the steep and fast decline in economic activity at the end of 2008 and throughout 2009. According to the IMF, the world economy contracted by 0.6 percent in 2009 – the first decline in output since World War II. The reces- sion was particularly severe among advanced economies (-3.7 percent) and in the Euro area (-4.3 percent). Some Eastern European countries saw their GDP contract by more than 10 percent. World trade fell by more than 10 percent. Unprecedented intervention by central bank and governments helped to stabilize the world economy by 2010 when it grew by 5.3 percent while world trade expanded by almost 13 percent (IMF, 2012b). Despite a recovery of the world economy, several European countries have experienced a double dip recession or even an outright depression like Greece. While the seasonally adjusted real gross domes- tic product of the United States reached pre-crisis levels after almost four years since the beginning of the recession, Europe’s debt ridden countries are still far below that mark (figure 8). In Spain, real GDP has stagnated for almost three years now and is still more than 5 per- cent below its peak level from early 2008. Current projections even see a further decline for the next quarters. Italy and Portugal are once again back in recession and more than 7 per- cent below peak levels. Ireland has recorded modest growth rates over the last few quarters, but is still almost 8 percent from pre-crisis levels. In Greece, real GDP has been falling for more than four years with total output loss close to 20 percent. This decline resembles the situation in Argentina between 1999 and 2002 before and after the sovereign default.
Figure 8: Seasonally adjusted real GDP (Index, peak value 2007/08 = 100) 3

Source: OECD, Hellenic Statistical Authority (EL.STAT.).

In Japan, the situation after the burst of the bubble was radically different. Although asset
prices witnessed a sharp decline, the economy continued to expand – but at much lower
rates than before the crisis. Five years after the beginning of the crisis, real GDP was 11 per-
cent higher. Similar to Greece, Ireland and Spain, economic growth before the crisis was
high by international comparison at 5 percent (table 2), but GDP grew by only 1.4 percent
each year in the five years afterwards. Had economic expansion continued according to
trend growth between 1980 and 1990, Japan’s GDP in 2012 would have been more than
twice its size from 1991 (figure 9). Instead, GDP at constant prices expanded by only 18 per-
cent between 1991 and 2012 – an average growth rate of 0.8 percent per year.

Figure 9: Development of Japan’s economy (GDP at constant prices, 1980-2012)

Source: IMF World Economic Outlook Database, own calculations.

3
    Data for Greece from 2011 onwards are not seasonally adjusted due to a break in the time series.
Table 2: Real GDP growth in percent
2003 2004 2005 2006 2007 2008 2009 2010 2011 2012 2003-07 2008-12
Austria 0,8 2,3 2,7 3,7 3,7 1,1 -3,5 2,2 2,7 0,6 2,6 0,6
Belgium 0,8 3,2 1,9 2,7 2,9 1,0 -2,7 2,4 1,8 -0,1 2,3 0,5
Finland 2,0 4,1 2,9 4,4 5,3 0,3 -8,5 3,3 2,7 0,7 3,8 -0,3
France 0,9 2,3 1,9 2,7 2,2 -0,2 -3,1 1,6 1,7 0,2 2,0 0,0
Germany -0,4 0,7 0,8 3,9 3,4 0,8 -5,1 4,0 3,1 0,9 1,7 0,7
Netherlands 0,3 2,0 2,2 3,5 3,9 1,8 -3,7 1,6 1,1 -0,9 2,4 0,0
United Kingdom 3,5 3,0 2,1 2,6 3,6 -1,0 -4,0 1,8 0,9 -0,1 3,0 -0,5
USA 2,5 3,5 3,1 2,7 1,9 -0,3 -3,1 2,4 1,8 2,2 2,7 0,6
OECD 2,0 3,1 2,7 3,2 2,8 0,2 -3,6 3,0 1,8 1,4 2,8 0,6
Euro Area 0,7 2,0 1,8 3,4 3,0 0,3 -4,3 1,9 1,5 -0,4 2,2 -0,2
Greece 5,9 4,4 2,3 5,5 3,5 -0,2 -3,1 -4,9 -7,1 -6,3 4,3 -4,3
Ireland 4,2 4,5 5,3 5,3 5,4 -2,1 -5,5 -0,8 1,4 0,5 4,9 -1,3
Italy 0,0 1,6 1,1 2,3 1,5 -1,2 -5,5 1,8 0,6 -2,2 1,3 -1,3
Portugal -0,9 1,6 0,8 1,4 2,4 0,0 -2,9 1,4 -1,7 -3,1 1,0 -1,3
Spain 3,1 3,3 3,6 4,1 3,5 0,9 -3,7 -0,3 0,4 -1,3 3,5 -0,8
Japan (1986-90/1991-95) 2,8 4,1 7,1 5,4 5,6 3,3 0,8 0,2 0,9 1,9 5,0 1,4
Source: OECD Economic Outlook No. 92, IMF World Economic Outlook Database.
In Europe, average growth rates between 2008 and 2012 are even lower and negative in its
most troubled member states. This is primarily a result of low growth in 2008 and the steep
decline during the Great Recession in 2009, but the most recent projections are rather bleak
even for countries like Germany or the Netherlands and are marked by continued uncertainty
(IMF, 2012b). The IMF’s world economic outlook includes growth projections until 2017 that
are consistently below 2 percent for countries like Belgium, France, Germany, Italy, the
Netherlands, Portugal and Spain. They are somewhat higher for Greece and Ireland, but
these countries are currently still below potential output, thereby benefiting from a catch-up
effect.
Economic growth is not only essential to consolidate public finances in the foreseeable fu-
ture, but is also a key ingredient to reduce high unemployment rates that are still rising in
several countries (figure 10). In December 2012, the unemployment rate in the Euro area still
stood at an all-time high of 11.7 percent. It is currently 26.8 percent in Greece and 26.1 per-
cent in Spain – similar to levels seen in the United States during the height of the Great De-
pression in the 1930s. Youth unemployment rates in Greece and Spain are even above 50
percent and close to 40 percent in Italy and Portugal (figure 11). Ireland’s unemployment rate
was only 4.4 percent in August 2007, but has climbed to 15 percent in late 2011. Italy and
Portugal have also seen strong increases in unemployment in most recent months, while the
United States is witnessing a slow but steady decline. The harmonized unemployment rate in
the United States peaked in October 2009 at 10 percent and currently stands at 7.9 percent
– still high by historical comparison and one of the main reasons for the Fed’s continued ex-
pansive monetary policy.Figure 10: Harmonized unemployment rates (percent of labor force) Source: OECD. Figure 11: Level and change in youth unemployment rates in the Euro area (2007-2012) Source: Eurostat. In Japan, the effects of the crisis on the labor market were much more limited. Known for very low unemployment rates in the Post World War II period, the unemployment rate reached a cyclical low at 2 percent in March 1990. It did not reach 3 percent until fourth years later in August 1994. Low growth and persistent problems in the financial sector eventually led to a further increase in unemployment, reaching 5.5 percent in 2002/03. Despite the rela- tively small rise since the outbreak of the crisis, the unemployment rate has never reached pre-crisis levels again, currently standing at 4.1 percent.
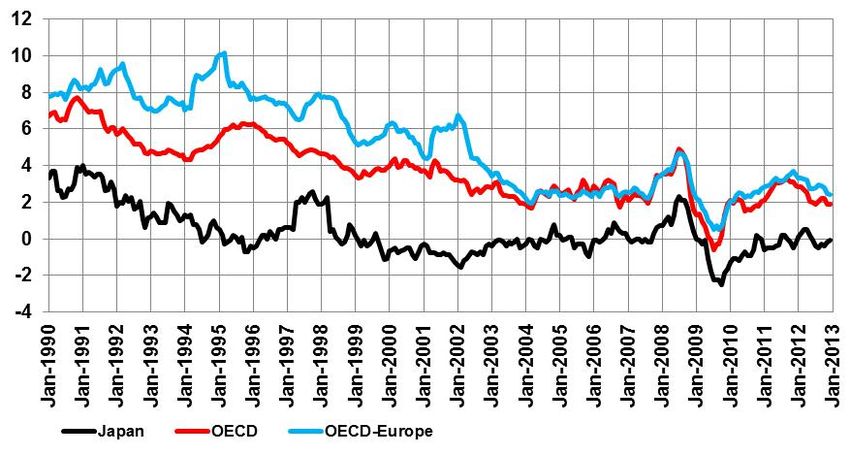
4.2.    Consumer and asset prices

Despite the remarkable increase in money supply and historically low interest rates, con-
sumer prices in Japan have been flat for more than two decades now. The consumer price
index in December 2012 was even slightly lower than 20 years earlier. Inflation has largely
followed global trends, but at a much lower level (figure 12). Consumer prices have declined
on various occasions and have seen increases above 2 percent on only two occasions: In
1997/98 when the VAT was raised from 3 to 5 percent and in 2008 when higher energy and
commodity prices around the world led to higher inflation rates.

Figure 12: Annual inflation in percent (1990-2012)

Source: OECD.

Along with interest rates, inflation rates in the Eurozone converged in the 1990s as European
Union member states were committed to fulfill the Maastricht criteria requirements in order to
be able to adopt the Euro as their new currency. While limiting government deficits to 3 per-
cent of GDP and gross debt to 60 percent of GDP, member countries were required to have
joined the exchange rate mechanism under the European Monetary System (EMS) for at
least two consecutive years and were not allowed to devalue their currency during that pe-
riod. Nominal long-term interest rates should not be more than 2 percentage points higher
than in the three member states with the lowest inflation rates. Finally, inflation rates were
required to be no higher than 1.5 percentage points above the average of the three member
states with the lowest inflation rates.

After the Euro was introduced as an accounting currency in 1999 and notes and coins en-
tered circulation in 2002, inflation rate differences were substantially lower than before, but
persisted. While Germany’s inflation rate remained below the ECB’s target of 2 percent or
lower for most of the time, Ireland’s consumer price index increased by more than 5 percent
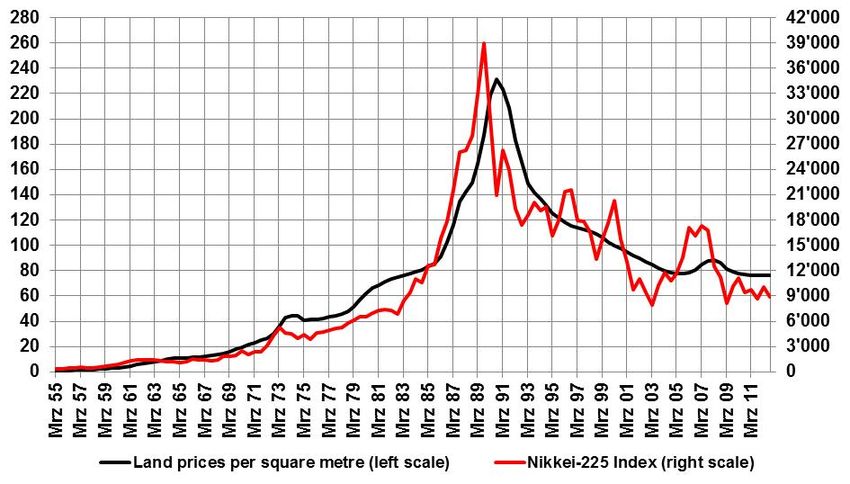
in both 2000/01 and 2007. Greece, Portugal and Spain also repeatedly witnessed inflation
rates above 4 percent. Inflation rates in the Eurozone have been slightly lower on average
since the outbreak of the global financial crisis, but have risen to more than 5 percent in
Greece (2010) and above 4 percent in Portugal (2011) – mainly a result of strong increases
in indirect taxation to consolidate the budget (figure 13).

Figure 13: Annual inflation in the Eurozone in percent (1990-2012)

Source: OECD.

While increases in consumer prices before and after the outbreak of the crisis were rather
contained, Japan’s asset price bubble was substantial by any measure. Within one decade,
equity prices increased six-fold while land prices quadrupled (figure 14). Saxonhouse and
Stern (2003) point out that many economists at the time considered this increase to be justi-
fied by strong economic fundamentals. Japan’s distinctive system of economic management
at both the government and the firm level was perceived to be superior. The steep decline in
asset prices since the beginning of the 1990s suggests that this increase was not justified.
Today, more than 20 years after the burst of the bubble and despite strong increases in re-
cent months, the Nikkei-225-Index is still more than 70 percent below its peak from Decem-
ber 1989. Land prices in the six largest urban areas are still declining, dropping more than
two thirds from its high in late 1990.
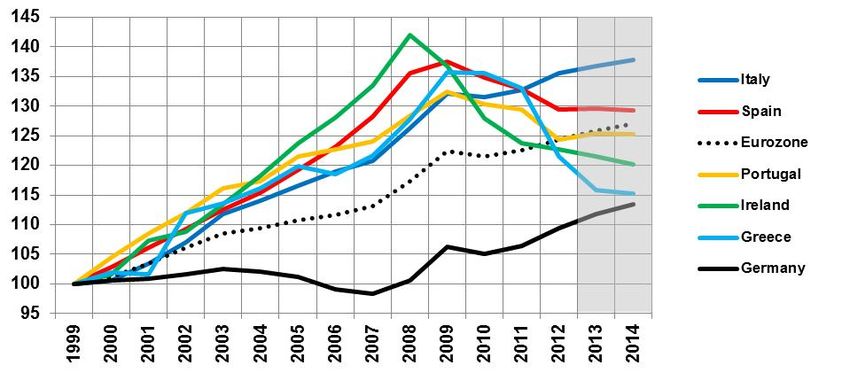
Figure 14: Land prices and share prices in Japan (1955-2012)

Sources: Japan Real Estate Institute, Thomson Reuters.

Comparing the rise and fall in land prices with the most recent developments in the United
States and Europe, it is evident that with the exception of Ireland, real estate bubbles were
less pronounced (figure 15). Despite the crisis, house prices in Italy and Portugal (not pic-
tured) continued to rise until the year 2010. They have been flat in Italy since and have
shown a slight decrease in Portugal. In Greece, house prices did not start to fall until the be-
ginning of 2009. They have shed almost 30 percent of their peak value since, but this is more
likely to be a result of economic decline rather than of a burst property market bubble. House
prices grew around 7 percent per year in the five years before the decline started. Real es-
tate prices in Spain have been falling for almost five years now, dropping almost 30 percent
since December 2008. US house prices according to the S&P/Case-Shiller Home Price In-
dex appear to have reached a bottom after falling by more than 30 percent since July 2006.
After substantial government and central bank intervention, prices have been relatively stable
over the past three years and have been rising since March 2012.

In contrast, residential property prices for all types of dwellings in Ireland have fallen by more
than 50 percent since September 2007. After more than five years into the crisis, this decline
is even more severe than in Japan’s during the 1990s. 4 Figure 16 pictures the development
of prices for new houses in both the Dublin area and the whole country of Ireland since 1970
as well as the number of completed houses in thousands of units. In the second half of the
1990s, prices and housing completions picked up sharply, fuelled by high economic growth
and low and falling real interest rates. Between 1995 and 2007, prices for new houses on
average more than quadrupled from around 78’000 Euros to 323’000 Euros and increased
almost five-fold in the Dublin area. This occurred despite the fact that housing completions
4
 Kennedy and McQuinn (2012) suggest that Irish house prices may have overcorrected by 12 to 26
percent.
almost tripled in the same period from 30’575 units in 1995 to 93’419 units in 2007. Housing
completions have dropped 89 percent between 2007 and 2011, putting numerous people out
of work and significantly contributing to the marked rise in unemployment.

Figure 15: Real estate bubbles in selected economies (Index, Peak = 100)

Source: Bank for International Settlements (BIS), Property price statistics, January 2013.

Figure 16: House prices and house completions in Ireland (1970-2012)

Source: Irish Department of the Environment, Community and Local Government.

In comparison with Japan at the end of the 1980s, share prices in Greece, Portugal and
Spain also showed a strong increase, almost tripling in value in the five years before the cri-
sis (figure 17). The rise was less pronounced in Ireland and Italy, but share prices still dou-
bled within five and four years, respectively. The collapse of share prices in 2008 and early
2009 was similar to the development in Japan as countries across the globe witnessed sig-
nificant losses on financial markets. In Japan, the Nikkei-225-Index was about 50 percent
lower five years later, while in the US share prices have shown a comparatively strong re-
bound. The reasons behind this recovery in the US are currently being discussed intensively,
with many critics pointing out that economic fundamentals are still relatively weak while the
Federal Reserve has provided vast amounts of additional liquidity.

Figure 17: Share prices before and after the peak (indexed values, peak = 100)

Sources: OECD.

In Europe’s debt ridden countries, share prices have fallen much more than in Japan two
decades earlier, dropping 90 percent or more in Greece and Iceland. Ireland’s share price
index is still almost 70 percent below its level from May 2007. In Italy and Spain, share prices
have shown a remarkable surge over the last few months, but are still far away from their
peak levels in 2007, dropping about 60 percent before the recovery started.

4.3.    Financial sector

After the collapse of Lehman Brothers in September 2008, central banks and national gov-
ernments in many industrialized countries quickly intervened to stabilize the economy and
financial institutions. Banks around the globe received almost unlimited liquidity, guarantees,
capital injections and were partially nationalized in other cases. The meltdown of one of the
world’s largest investment bank and its consequences forced central banks and government
to immediate action. In Japan, the effect of the crisis on financial institutions was far less se-
vere, particularly in the short run. The share of bad loans was rising in the 1990s, but banks
remained profitable for the time being (figure 18). Despite asset price declines, banks contin-
ued to lend to firms and households. A stabilization and consolidation of the financial sector
did not take place until a new law was implemented in 1998, encouraging financial restructur-
ing by requiring banks to publish detailed information about bad loans and allowing for the
nationalization of institutions (Schnabl, 2012). As banks were finally adjusting their balance
sheets, total loans declined by almost 30 percent. The continued process of “zombie lending”
further extended and aggravated the crisis (Lanz, 2012).

Figure 18: Banking profitability in Japan (1989-2008)

Source: OECD.

After mounting losses, 15 large banks eventually merged into four big financial institutions,
three of which are considered to be “systemically important financial institutions” by the Fi-
nancial Stability Board. Mizuho was founded in 2000 as a merger of Dai-Ichi Kongyo Bank,
Fuji Bank and the Industrial Bank of Japan. In 2001, Sumitomo Mitsui was formed out of the
Sumitomo Bank and the Sakura Bank which had previously been built out of a merger from
Mitsui Bank and Taiyo Kobe Bank in 1990. Resona Holdings was created in 2002, containing
the Daiwa Bank, Kinki Osaka Bank, the Nara Bank and the Asahi Banks. Finally, Mitsubishi
Tokyo Financial Group and UFJ Holdings merged to establish Mitsubishi UFJ Financial
Group in 2005. Both parts of the banks had previously been created of earlier mergers (Mit-
subishi Bank and Bank of Tokyo consolidated in 1996 while Sanwa Bank, Tokai Bank and
the Toyo Trust and Banking merged to form UFJ Holdings in 2001).

After return on equity was highly negative between 1995 and 2002, Japanese financial insti-
tutions returned to profit between 2003 and 2007. The number of financial institutions de-
creased from 155 in 1990 to 123 in 2008. More than a third of all jobs in the financial sector –
a total of 157’000 jobs – were lost between 1993 and 2003, according to OECD statistics.

In October 2012, the European Banking Authority (EBA) reported that Europe’s largest finan-
cial institutions managed to increase their capital positions by more than €200 billion be-
tween December 2011 and June 2012. In December 2011, the EBA had warned that the 71
European banks examined lacked €115 billion in capital reserves to manage the crisis, par-
ticularly in relation to losses associated with sovereign exposures. In order to restore market
confidence, banks were required to establish an exceptional and temporary buffer by the end
of June 2012. According to the EBA, these goals were more than fulfilled. Furthermore,
banks achieved their target mainly through retained earnings and raising new capital. Fears
that the requirements would lead banks to reduce lending and thus trigger a credit crunch
were not confirmed. According to the EBA, the recapitalization exercise was thus an impor-
tant, but not an ultimate step towards repairing EU banks’ balance sheets.

In its latest Financial Stability Review, the ECB identified three major risks to Euro area fi-
nancial stability. They include the potential aggravation of the sovereign debt crisis, bank
profitability risks due to a weak macro-financial environment as well as fragmented financial
markets (ECB, 2012). But the ECB also found that stresses on the Euro area financial sys-
tem have eased considerably since summer 2012 which it attributes to its own commitments
to counter unfounded concerns about the irreversibility of the Euro and the announcement of
the Outright Monetary Transactions (OMT). Nonetheless, the ECB argues that while its ac-
tions helped to alleviate symptoms of financial market fragmentation, it has not and cannot
address its root causes. Its exceptional monetary policy measures have rather bought time
which governments and financial institutions need to use to tackle the causes of the crisis
(ECB, 2012).

Developments in the Spanish banking sector and policy responses resemble those in Japan
during the 1990s as government and central bank officials neglected problems and post-
poned structural reforms for years before mounting losses became apparent. In December
2010, Bankia was formed, a conglomerate of seven ailing regional savings banks, creating
Spain’s fourth biggest bank and the country’s largest holder of real estate assets. In May
2012, Bankia requested another €19 billion bailout, after previously receiving €4.5 billion from
the Spanish government. The profit statement for 2011 was subsequently revised. Instead of
a profit of €309 million, it now recorded a loss of €4.3 billion. In October 2012, a stress test
by Oliver Wyman for the Spanish banking sector indicated that in an adverse scenario, finan-
cial institutions faced additional capital needs of €59 billion – of which €24.7 billion are due to
Bankia alone.

In Ireland, the government reacted much faster, but later depended on external support be-
cause of its immediate action. In September 2008 amid global financial turmoil, the Irish gov-
ernment issued an unlimited bank guarantee in favor of six banks. According to the IMF,
these guarantees amounted to 198 percent of GDP, far more than in any country and beyond
the government’s financial capabilities (IMF, 2009). In 2009, the National Asset Management
Agency (NAMA) was founded and took over large loans from financial institutions. However,
by September 2010, banks were no longer able to refinance themselves and the bank guar-
antee by the government was renewed for a third year, resulting in additional government
outlays of €30 billion or 20 percent of GDP in 2010 alone. In November 2010, Ireland re-
quested support from the European Union and the IMF. Irish financial institutions have post-
ed staggering losses since 2008, losing more than 12 percent of risk-weighted assets in
2010. Loan loss impairments continue to be substantial and have led to a deterioration of
profitability (Central Bank of Ireland, 2012).

In its most recent edition of the Global Financial Stability Report, the IMF (2012c) finds that
risks to the global financial system have increased in the past months with the Euro area
crisis continuing to be a main source of concern. Progress in reaching financial stability has
been limited because reforms are still only partially implemented and because of ongoing
crisis intervention. The IMF estimates that financial sector deleveraging between the fall of
2011 and the end of 2013 will amount to $2.8 billion in its baseline scenario and could
amount to $4.5 billion if current commitments remain unfilled and financial fragmentation and
financial repression continue.

Although several financial institutions have reduced their balance sheets and households
have started to repay their debts, private sector deleveraging in Europe has barely started. In
many advanced countries, total debt is still rising (MGI, 2012). With the exception of Ireland,
private sector debt in Japan was much higher than in Europe, accounting for as much as 300
percent of GDP (figure 19). But private sector debt did not start to decline significantly until
six years after the crisis broke out, dropping by more than 10 percentage points in 1997. In
Ireland, debt continued to rise until 2009. In Greece and Italy, debt has stabilized at relatively
low levels. The decline in Portugal and Spain has only been modest so far and will require
several years to reach pre-crisis levels if deleveraging continues at the current pace.

As Cecchetti et al. (2011) show, household, non-financial corporate and government debt all
increased significantly between 1980 and 2010. Among the 18 OECD countries examined,
household debt rose from 39 to 94 percent of GDP (median average), non-financial corpo-
rate debt from 85 to 126 percent and government debt from 43 to 97 percent of GDP, signal-
ing a major credit boom.
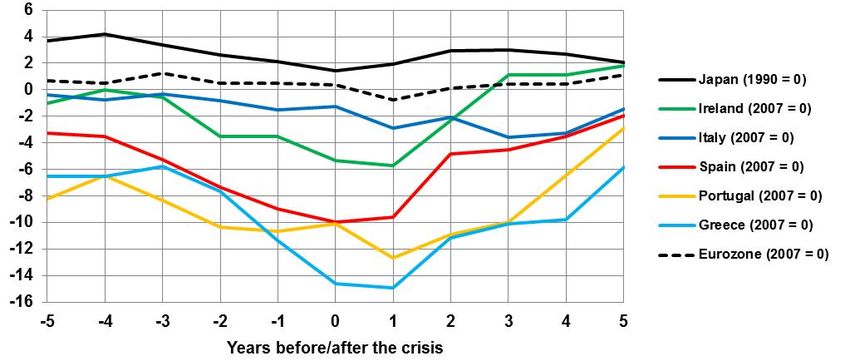
Figure 19: Private debt as a percentage of GDP (1991/2007 = 0)

Sources: Eurostat / Cecchetti et al. (2011)

4.4       Current account balance and exchange rates

Before the outbreak of the global financial and Europe’s sovereign debt crisis, a one-size-fits-
all monetary policy combined with different fiscal policies and unwillingness for structural re-
forms resulted in increasing imbalances between Eurozone member countries. While Ger-
many’s current account surplus kept rising, Greece and Portugal were running substantial
and increasing current account deficits. In 2003, Ireland was growing at high rates, but Ger-
many experienced a recession. Since the economic boom came to a sudden stop in Eu-
rope’s peripheral countries, current account balances have shown signs of converging again
(figures 20 and 21). After posting a deficit of close to 6 percent of GDP in 2008, Ireland is
expected to record a surplus for the third straight year in 2012. Greece, Portugal and Spain
have seen their deficit shrink by 8 to 9 percentage points since 2007/08. The reduction of
current account deficits in Europe’s periphery has not been accompanied by a corresponding
decline in current account surpluses among other Euro area members. Both Germany and
the Netherlands continue to record substantial surpluses. With the exception of 2008, the
Euro area as a whole has recorded a current account surplus every year. Furthermore, the
improvement in the current account balance was primarily achieved through a strong reduc-
tion in imports rather than growing exports. In Greece, imports have declined by almost 50
percent between 2008 and 2012. A strong decline in imports is also observed in Portugal (-
30 percent) and Spain (-15 percent). In Italy the decline was less pronounced and exports
have been growing for the past three years. Growing exports also played a major role in turn-
ing Ireland’s current account deficit back into a surplus, but growth rates have been lower
than the Euro area average (IMF, 2012b).
You can also read