CHAPTER 2: Aviation Activity Analysis and Forecast - DECEMBER 2018 - Reno ...
←
→
Page content transcription
If your browser does not render page correctly, please read the page content below

DECEMBER 2018

            CHAPTER 2:
Aviation Activity Analysis and Forecast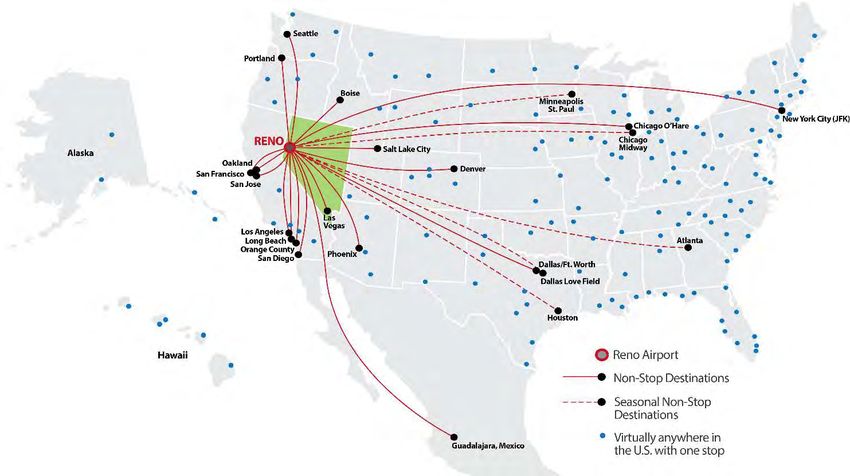
Chapter 2 - Aviation Activity Analysis and Forecast

AVIATION ACTIVITY ANALYSIS AND FORECAST
Introduction
This chapter presents an air service market evaluation, an analysis of historical trends, and 20-year forecasts
of commercial and noncommercial aviation activity. Commercial aviation activity includes passenger and all-
cargo service. Noncommercial activity includes general aviation (GA) and military operations. The air service
market study estimates the “True Market” for Reno-Tahoe International Airport (RNO) by evaluating market
trends to explore the potential for air service expansion. The identification of market trends is the result of
analyzing current airline service, assessing airline performance, and comparing RNO with other airports that
provide air service within the region. The analysis of historical trends provides the context for the
development of the forecasts and informs model specifications and assumptions. The forecasts will serve as
the basis for subsequent analyses in the Master Plan, such as the assessment of facility requirements,
demand/capacity analysis, development of a 20-year capital improvement plan, and environmental impact
analysis. The details of the proposed forecasting approaches are described below. The resulting forecasts are
compared with the latest Federal Aviation Administration (FAA) Terminal Area Forecast (TAF) for RNO.

Air Service Market Evaluation
In support of the aviation forecast for RNO, an air service evaluation helped to develop the true market
estimate. The true market estimate gives RNO the most useful information about local passenger travel
patterns relative to commercial airline service. This air service market evaluation comprises a true market
estimate, market performance, and route performance studied for seven of the eight airlines serving
passengers at RNO, listed in Table 2-1 below. Volaris, as a non-domestic provider, is not required to report
commercial passenger activity through U.S. Department of Transportation (DOT).

The air service market evaluation section will briefly describe the methodology and the catchment area used
in the evaluation and will highlight the trends from the collected data through the year ending (YE) June 30,
2016. This section also addresses the service gaps and opportunities presented for RNO, concluding with the
overview of the opportunities for both incumbent and new airlines.

Table 2-1: Airlines Serving Passengers at RNO        True Market Estimate
         Airline               Abbreviation          The primary objective of this evaluation was to develop
         Alaska                    AS                information on the travel patterns of passengers who
        Allegiant                  G4                live in the area.
       American                    AA
          Delta                    DL                The analysis relied on a combination of Airline Reporting
         JetBlue                   B6                Corporation (ARC) tickets (catchment area and online
       Southwest                   WN                travel agencies) and U.S. DOT data, calculating the true
         United                    UA                market for the year end (YE) June 30, 2016. This data did
         Volaris                   Y4                not capture tickets issued directly by airline websites,
                                                     and the survey sample consisted of 44,664 tickets, which
                                                     is consistent with industry survey standards.

                                                                                                               2-1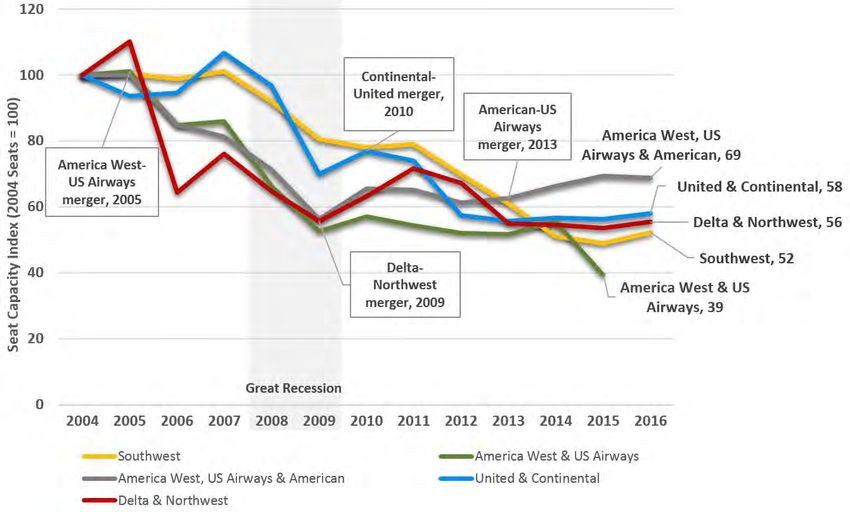
Chapter 2 - Aviation Activity Analysis and Forecast

Figure 2-1: RNO Primary Catchment Area 2016                The catchment area is defined as the geographic
                                                           area where RNO can reasonably expect to draw
                                                           passenger traffic and is representative of the local
                                                           market. This is significant because it includes the
                                                           population of travelers who ideally should use RNO
                                                           based on the drive time. RNO’s primary catchment
                                                           area, shown in Figure 2-1, comprises 92 zip codes,
                                                           and had a 2016 population of 776,930.

                                                           The true market summary is calculated by looking at
                                                           the actual passenger use versus the total
                                                           passengers eligible to use the airport based on the
                                                           catchment area. RNO had a true market of
                                                           3,665,693 origin and destination (O&D) passengers,
                                                           shown in Table 2-2, which is 5,021 total passengers
                                                           daily each way (PDEW), meaning an estimated 279
                                                           PDEW use alternate airports.

                                                           The overall true market number represents 93
                                                           percent domestic travel and seven percent
                                                           international travel. RNO retained 94 percent of
                                                           total passengers, as shown in Figure 2-2, which
                                                           equaled 96 percent of domestic travel, and 75
                                                           percent of international retention.

                                                               Figure 2-2: True Market Summary
Table 2-2: True Market Summary
                                        YE 2Q 2016
                                                               San Francisco International Airport (SFO) &
 Rank        Origin Airport                                    Sacramento International Airport (SMF)
                                        PAX          %
                        Domestic                                                 SMF
                                                                             SFO
   1             RNO               3,281,368          96                          3%
                                                                             3%
   2      Sacramento (SMF)            80,690           2
   3      San Francisco (SFO)         63,133           2
                  Subtotal         3,425,192         100
                    International
   1             RNO                 180,662          75
   2             SFO                  50,109          21
   3             SMF                    9,730          4                   RNO
                  Subtotal           240,501         100                   94%
             Domestic and International
   1             RNO               3,462,030          94
   2             SFO                 113,242           3
   3             SMF                  90,420           3
                     Total         3,665,693         100
Source: Mead & Hunt, Inc.; YE June 30, 2016

                                                                                                                2-2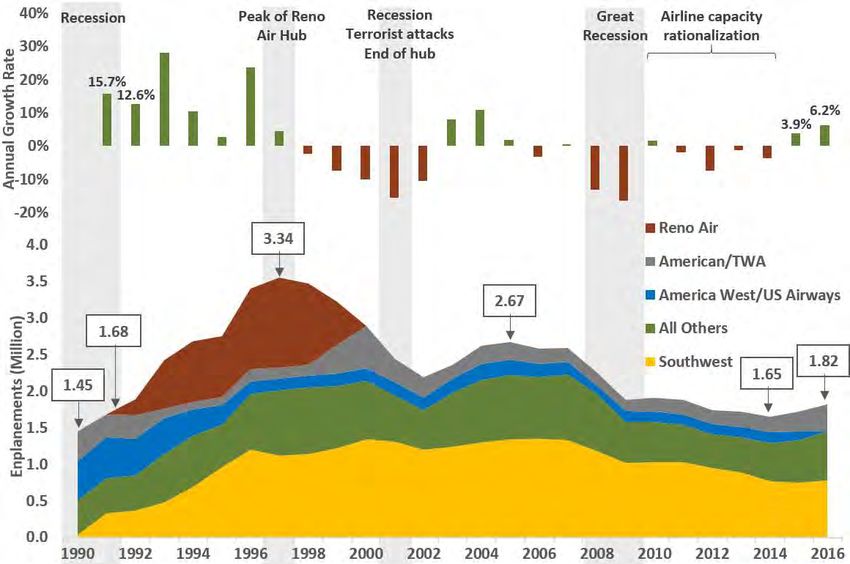
Chapter 2 - Aviation Activity Analysis and Forecast

Table 2-3 lists the top 25 domestic destinations. The top five domestic markets included McCarran
International Airport in Las Vegas (LAS), Los Angeles International Airport (LAX), Phoenix Sky Harbor
International Airport (PHX), Seattle-Tacoma International Airport (SEA), and San Diego International Airport
(SAN). Las Vegas was the top market with 435,015 annual passengers or 599 PDEW. Of note, the top 25
markets generate 65 percent of total air travel, and in the analysis, markets with nonstop service tended to
have a higher retention rate than markets without nonstop service.
Table 2-4 lists the top 15 international destinations. These markets were estimated at 240,501 annual
passengers or 329 PDEW. Within these markets, the top three were Los Cabos International Airport (SJD),
Cancun International Airport (CUN), and Vancouver International Airport (YVR). RNO retention rates were
much lower internationally, due in part to the service at RNO primarily being domestic, as well as RNO’s
relative proximity to San Francisco International Airport (SFO) and their significant international service.
Table 2-5 shows the top 50 true markets ranked by destination, illustrates RNO’s O&D passengers to each
destination, and lists RNO’s totals for domestic, international, and all markets within these top 50 including
the retention/diversion estimates for each.
Table 2-3: Top 25 Domestic Destinations
                                                                       Origin Airport %                 Total
   Rank                      Destination
                                                                RNO          SMF        SFO              Pax
     1                Las Vegas, NV                 LAS          99            0         0            435,015
     2               Los Angeles, CA                LAX          97            1         1            288,235
     3                 Phoenix, AZ                 PHX           97            2         1            193,021
     4            Seattle-Tacoma, WA               SEA           91            6         3            179,347
     5                San Diego, CA                SAN           99            0         1            160,718
     6                  Denver, CO                 DEN           99            1         1            147,844
     7                 Portland, OR                PDX           95            3         1            105,088
     8              New York JFK, NY                JFK          93            2         4             98,179
     9            Dallas-Fort Worth, TX            DFW           93            4         3             72,435
    10              Salt Lake City, UT              SLC          96            3         2             69,243
    11             Chicago O’Hare, IL              ORD           95            2         4             64,998
    12                 San Jose, CA                 SJC         100            0         0             52,012
    13                 Boston, MA                  BOS           90            2         7             51,915
    14              Minneapolis, MN                MSP           96            2         2             47,933
    15             Orange County, CA               SNA           99            0         1             46,022
    16                 Orlando, FL                 MCO           94            4         2             45,255
    17                 Atlanta, GA                  ATL          94            4         2             42,560
    18             Chicago Midway, IL              MDW           99            0         0             42,056
    19                  Austin, TX                 AUS           97            1         2             38,094
    20              Philadelphia, PA               PHL           90            7         3             35,370
    21                Baltimore, MD                BWI           96            3         1             35,220
    22           Washington Reagan, DC             DCA           96            2         2             32,943
    23                  Detroit, MI                DTW           97            2         1             32,418
    24              Houston Bush, TX                IAH          98            1         1             32,351
    25                  Newark, NJ                 EWR           89            2         9             30,399
                     Top 25 Domestic                             96            2         2           2,378,670
                      Total Domestic                             96            2         2           3,425,192
Source: Mead & Hunt, Inc.; YE June 30, 2016
Sacramento International Airport (SMF), San Francisco International Airport (SFO)

                                                                                                                           2-3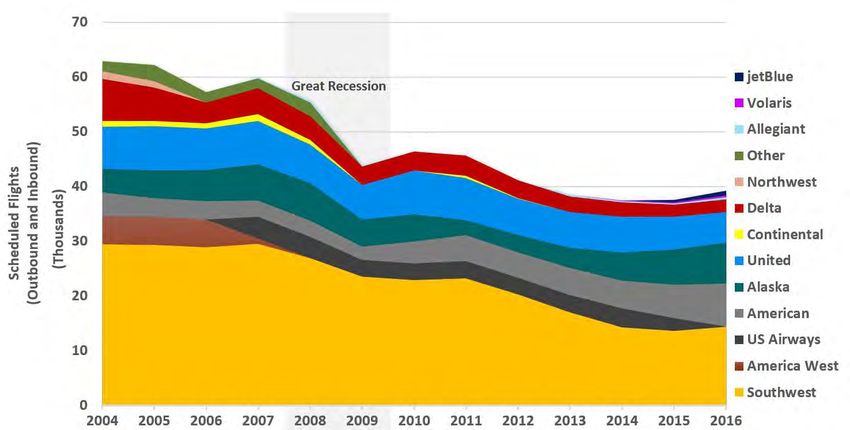
Chapter 2 - Aviation Activity Analysis and Forecast

Table 2-4: Top 15 International Destinations
                                                              Origin Airport %                Total
  Rank                       Destination
                                                        RNO         SFO        SMF             Pax
     1         San Jose del Cabo, Mexico      SJD        94           4          2           13,952
     2              Cancun, Mexico            CUN        87           7          6           13,552
     3            Vancouver, Canada           YVR        90           6          3           11,244
     4              Toronto, Canada           YYZ        91           6          3            9,998
     5            Mexico City, Mexico         MEX        87           4          8            9,553
     6           London Heathrow, UK          LHR        78          19          3            8,482
     7          Puerto Vallarta, Mexico       PVR        91           7          3            7,708
     8            Guadalajara, Mexico         GDL        87           2         11            5,746
     9            Manila, Philippines         MNL        61          39          0            4,458
    10              Calgary, Canada           YYC        90           5          5            4,436
    11             Montreal, Canada           YUL        85          14          1            4,189
    12            San Jose, Costa Rica        SJO        77          14          9            3,873
    13            Frankfurt, Germany          FRA        73          26          1            3,868
    14          Paris De Gaulle, France       CDG        77          22          1            3,815
    15               Dublin, Ireland          DUB        70          28          2            3,437
                  Top 15 International                   85          12          4          128,080
                   Total International                   75          21          4          240,501
Source: Mead & Hunt, Inc.; YE June 30, 2016

Analysis of Current Airline Service (Market Performance)
This section highlights traffic and capacity trends, revenue and fare trends, and the O&D revenue market
share by airline. The section also highlights regional comparisons for the domestic market based on YE 2Q
2016.

As far as traffic and capacity trends, YE 2Q 2016 year-over-year capacity was up six percent and passengers
were up eight percent, as Figure 2-3 shows. These factors drove a one percentage point increase in load
factor (percent of seats sold), with capacity (total available seats) and passengers (traveling public) trending
positively. As far as revenue and fare trends, origin and destination revenue were increasing with fares
remaining stable, and RNO fares continue to be lower than the U.S. average, as shown in Figure 2-4.

                                                                                                                2-4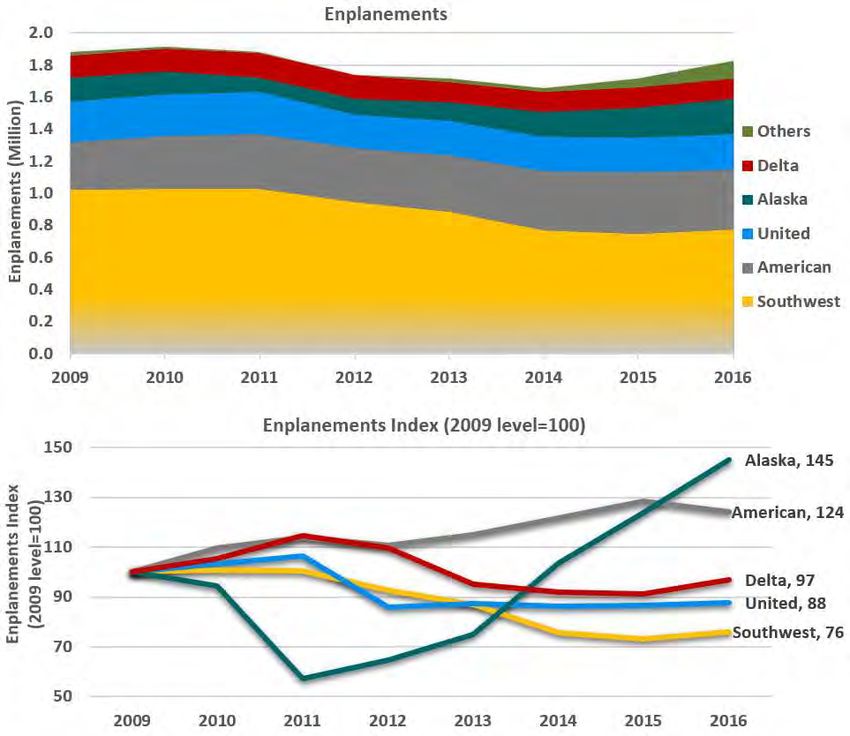
Chapter 2 - Aviation Activity Analysis and Forecast

Table 2-5: Top 50 Domestic Destinations
                                                RNO O&D                         Diverting Pax
 Rank                 Destination               Passengers   Retention %                             Total PAX
                                                                               SFO         SMF
    1              Las Vegas, NV          LAS     432,402         99           1,900        713       435,015
    2             Los Angeles, CA        LAX      280,401         97           3,590       4,243      288,235
    3                Phoenix, AZ         PHX      187,274         97           2,612       3,135      193,021
    4          Seattle-Tacoma, WA        SEA      161,860         90           5,106      12,381      179,347
    5              San Diego, CA         SAN      159,121         99            925         672       160,718
    6                Denver, CO          DEN      145,942         99           1,122        779       147,844
    7               Portland, OR         PDX       99,595         95           1,630       3,863      105,088
    8            New York JFK, NY         JFK      91,199         93           4,653       2,327       98,179
    9         Dallas-Fort Worth, TX      DFW       67,031         93           2,252       3,152       72,435
   10            Salt Lake City, UT       SLC      66,057         95           1,136       2,050       69,243
   11           Chicago O’Hare, IL       ORD       61,384         94           2,409       1,205       64,998
   12               San Jose, CA          SJC      52,012        100             0           0         52,012
   13                Boston, MA          BOS       46,462         89           4,240       1,213       51,915
   14            Minneapolis, MN         MSP       45,898         96           1,035       1,000       47,933
   15           Orange County, CA        SNA       45,347         99            450         225        46,022
   16                Orlando, FL         MCO       42,361         94           1,109       1,785       45,255
   17                Atlanta, GA          ATL      40,071         94            783        1,705       42,560
   18           Chicago Midway, IL       MDW       41,831         99            104         121        42,056
   19                 Austin, TX         AUS       36,915         97            646         533        38,094
   20             Philadelphia, PA       PHL       31,542         89           1,268       2,559       35,370
   21              Baltimore, MD         BWI       33,591         95            391        1,238       35,220
   22        Washington Reagan, DC       DCA       31,672         96            694         576        32,943
   23                Detroit, MI         DTW       31,420         97            426         571        32,418
   24            Houston Bush, TX         IAH      31,714         98            182         455        32,351
   25                Newark, NJ          EWR       26,522         87           3,064        813        30,399
   26           Houston Hobby, TX        HOU       28,233        100             0           0         28,233
   27             San Antonio, TX        SAT       27,681         99            222         74         27,977
   28               Honolulu, HI         HNL       23,034         85           1,430       2,528       26,993
   29               St. Louis, MO         STL      25,224         94            607        1,040       26,871
   30               Nashville, TN        BNA       25,596         96             0         1,131       26,727
   31                 Tampa, FL          TPA       25,466         96            81          867        26,413
   32             Kansas City, MO        MCI       25,608         98            160         337        26,105
   33                Ontario, CA         ONT       24,624         99            88          184        24,896
   34            San Francisco, CA       SFO       24,762        100             0           0         24,762
   35           Fort Lauderdale, FL       FLL      21,252         90           1,888        595        23,735
   36        Washington Dulles, DC        IAD      21,352         93            806         708        22,866
   37         Charlotte-Douglas, NC       CLT      22,102         97            218         464        22,784
   38               Spokane, WA          GEG       22,243         98            69          379        22,691
   39              Dallas Love, TX       DAL       22,397        100            47          59         22,503
   40             New Orleans, LA        MSY       20,615         97            333         255        21,203
   41            Albuquerque, NM         ABQ       20,029         97            139         417        20,585
   42          Raleigh/Durham, NC        RDU       18,272         91            860         940        20,072
   43                Kahului, HI         OGG       16,234         83            960        2,448       19,641
   44               Burbank, CA          BUR       18,661         99            72          72         18,805
   45             Indianapolis, IN       IND       17,577         97            422         89         18,087
   46              Anchorage, AK         ANC       15,538         89            402        1,608       17,549
   47                  Boise, ID          BOI      17,502        100             0           0         17,502
   48             Milwaukee, WI          MKE       16,597         96            409         273        17,279
   49                Tucson, AZ          TUS       16,877         99            163          0         17,040
   50        New York LaGuardia, NY      LGA       15,874         97            182         301        16,357
                   Total Domestic                3,281,368        96          63,133      80,690     3,425,192
                 Total International              180,662         75          50,109       9,730      240,501
                  Total All Markets              3,462,030        94         113,242      90,420     3,665,693
 Source: Mead & Hunt, Inc.; YE June, 30 2016
Passengers daily each way (PDEW)

                                                                                                                       2-5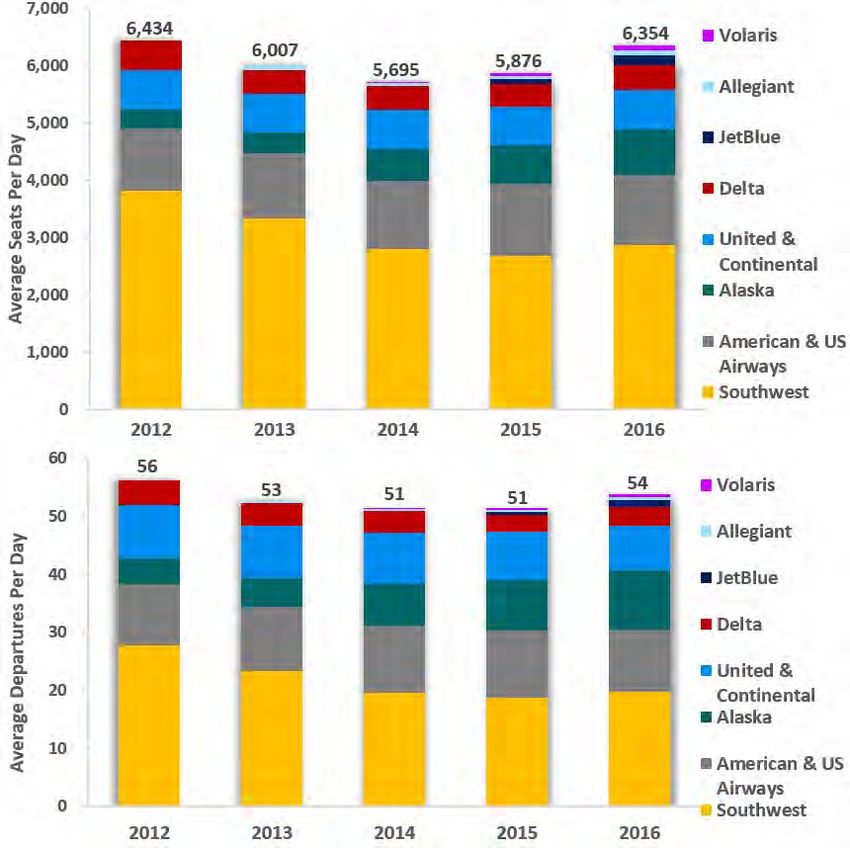
Chapter 2 - Aviation Activity Analysis and Forecast

Figure 2-3: Traffic and Capacity Trends

                        3,000,000                                                                                      90

                        2,750,000                                                                                  81% 83
                                    2,668,208

                        2,500,000                                                                                      75
Capacity / Passengers

                                    75%

                                                                                                                              Load factor %
                        2,250,000                                                                          2,177,286 68

                        2,000,000    1,921,145                                                                         60

                                                                                                           1,716,122
                        1,750,000                                                                                      53

                        1,500,000                                                                                      45

                        1,250,000                                                                                      38

                        1,000,000                                                                                      30
                                            2012          2013          2014             2015              2016
                                                       Capacity         Passengers           Load Factor

Source: Diio Mi T-100 Seats/Onboards 12-month non-directional, one-way rolling average; LF=RPMs/ASMs

Figure 2-4: Revenue and Fare Trends

                           $650                                                                                        $260
                                                                                                             $624.1M
                                                                                                                       $240
                           $600 $587.9M
                                                                                                                       $220

                                                                                                                                O&D Average Fare ($)
                                                                                                              $200
    O&D Revenue

                           $550     $199
                                                                                                                       $200
      Millions

                                                                                                                  $188 $180
                           $500     $171

                                                                                                                       $160
                           $450
                                                                                                                       $140

                           $400                                                                                        $120
                                    Q3 Q4 Q1 Q2 Q3 Q4 Q1 Q2 Q3 Q4 Q1 Q2 Q3 Q4 Q1 Q2 Q3 Q4 Q1 Q2
                                     2011        2012           2013          2014              2015         2016
                                             RNO YE O&D Revenue        RNO YE Avg Fare          US YE Avg Fare

Source: Diio Mi (total O&D passengers and revenue)

                                                                                                                                                       2-6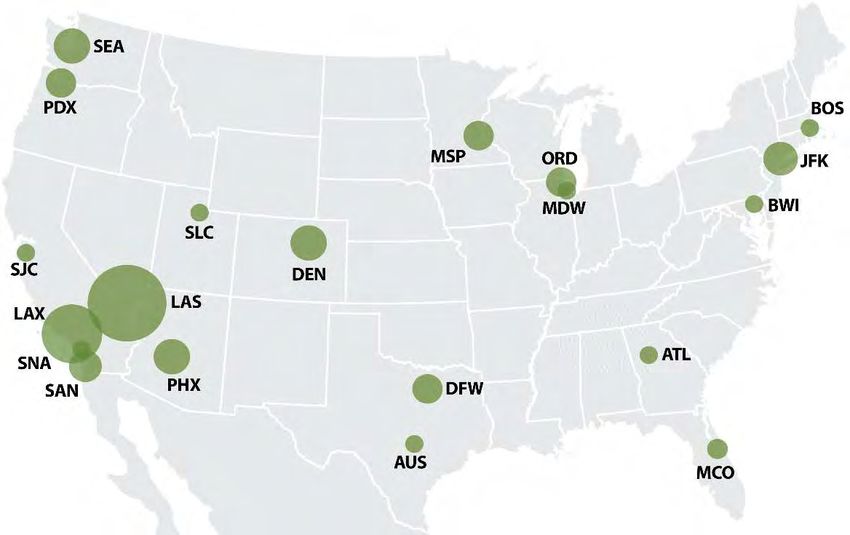
Chapter 2 - Aviation Activity Analysis and Forecast

Table 2-6 compares RNO with the other airports serving domestic markets in the region through YE June 30,
2016. RNO ranked 14th largest in the FAA West Region, which includes California, Arizona, Hawaii, and
Nevada, based on number of total passengers. RNO’s passenger and revenue growth outpaced the FAA West
Region. RNO’s fares increased one percent in contrast with fares for the region decreasing by four percent.
The decrease in RNO’s yield was similar to the regional average decline. This apparent contradiction is due to
passengers flying slightly longer distances during this period, and the fare being calculated as an average over
the distance traveled, or the fare divided by the miles traveled.

Table 2-6: Regional Comparisons – Domestic Only, YE June 30, 2016
                                                    Revenue      Average Average             YOY Change
 Rank              Airport             Passengers
                                                     (000s)       Fare    Yield       Pax     Rev Fare Yield
   1      Los Angeles, CA       LAX    20,038,447   $3,700,815    $185       11.8¢    10%      1%     (8%)   (8%)
   2        Las Vegas, NV       LAS    16,131,908   $2,262,677    $140       11.5¢     9%      1%     (7%)   (8%)
   3     San Francisco, CA      SFO    14,192,653   $2,939,966    $207       13.0¢     6%      3%     (3%)   (1%)
   4         Phoenix, AZ        PHX    11,738,283   $1,918,896    $163       13.8¢     7%      4%     (3%)   (3%)
   5        San Diego, CA       SAN     8,605,799   $1,481,202    $172       12.9¢     5%      2%     (3%)   (4%)
   6         Honolulu, HI       HNL     5,327,405   $1,264,101    $237       11.5¢     1%      3%      2%     1%
   7         Oakland, CA        OAK     4,960,227     $703,289    $142       14.3¢     7%      8%      1%    (3%)
   8     Orange County, CA      SNA     4,658,694     $781,818    $168       15.7¢     8%      3%     (4%)   (4%)
   9         San Jose, CA        SJC    4,474,656     $730,609    $163       15.4¢     6%      5%     (1%)   (2%)
  10      Sacramento, CA        SMF     4,301,125     $734,181    $171       15.4¢     6%      5%     (1%)   (3%)
  11          Kahului, HI       OGG     2,444,215     $566,981    $232       12.0¢     5%      5%      0%    (2%)
  12         Burbank, CA        BUR     1,953,575     $270,457    $138       20.4¢     2%      3%      1%     0%
  13         Ontario, CA        ONT     1,947,692     $325,178    $167       16.5¢     1%      1%      0%    (2%)
  14           Reno, NV         RNO     1,572,969     $271,505    $173       15.6¢     7%      8%      1%    (3%)
  15          Tucson, AZ        TUS     1,401,825     $267,431    $191       16.3¢    (2%)    (1%)     0%    (1%)
  16           Lihue, HI         LIH    1,292,657     $294,079    $227       12.6¢     3%      3%      0%    (1%)
  17           Kona, HI         KOA     1,216,952     $286,008    $235       12.9¢     4%      3%      0%    (4%)
  18       Long Beach, CA       LGB     1,177,654     $134,287    $114       13.3¢    (3%)    (9%)    (7%)   (2%)
  19      Palm Springs, CA      PSP       723,044     $141,923    $196       15.8¢     0%     (1%)    (1%)   (1%)
  20     Phoenix Mesa, AZ       AZA       663,302      $54,114     $82        8.0¢     5%     (3%)    (8%)   (8%)
  21       Hilo/Hawaii, HI      ITO       602,981      $76,121    $126       19.0¢     1%      2%      0%    (3%)
  22          Fresno, CA        FAT       567,801     $120,385    $212       18.0¢     1%      2%      1%     4%
  23     Santa Barbara, CA      SBA       277,457      $67,899    $245       19.0¢    (3%)    (1%)     1%     0%
  24        Monterey, CA        MRY       177,080      $34,789    $196       18.7¢     6%      0%     (6%)   (2%)
  25       Santa Rosa, CA       STS       138,960      $19,037    $137       24.3¢    23%     22%     (1%)   (1%)
          Total/Average                111,654,107 $19,712,744    $177      13.0¢     6%      2%     (4%)    (4%)
Source: Diio Mi – YE June 30, 2016

                                                                                                                    2-7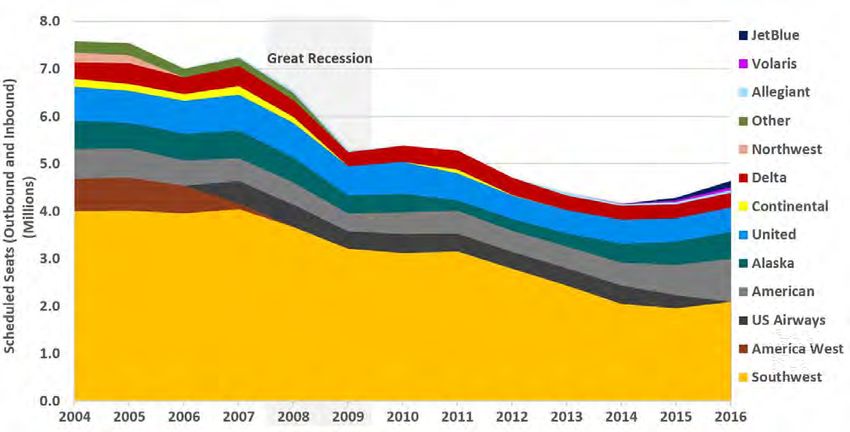
Chapter 2 - Aviation Activity Analysis and Forecast

Regional Air Service Comparison (Route Performance)
The route performance section covers the load factor trends, revenue per available seat mile (RASM)
performance, and RASM trends. Overall, thirteen markets had declining load factors for the second quarter
of 2016 compared to the second quarter of 2015, with only six markets showing improvement. RNO load
factors for the same period declined one percentage point driven by a seven percent increase in capacity.

RASM trends for Alaska Airlines, Allegiant Airlines, American Airlines, Delta, and JetBlue Airlines show mixed
results for the second quarter, with six markets improving and five markets having decreasing RASMs. The
most significant changes were positive on Alaska Airlines route to San Jose (SJC) and Delta Airlines route to
Minneapolis (MSP) increasing 17-19 percent year over year (YOY). For Southwest and United Airlines, overall
second quarter RASMs were down one percent YOY; however, results were mixed with seven markets
improving and three markets having decreasing RASMs.

Air Service Assessment (Service Gaps and Opportunities)
During the evaluation, gaps in commercial service emerged that present strong opportunities for RNO. This
section of the report documents the findings of the data collection and analysis in terms of existing airlines,
nonstop service, and air service opportunities for both incumbent and new airlines. As Figure 2-5 shows, as
of 2016 RNO has eight airlines (the seven domestic carriers and international carrier Volaris) providing
service to 22 destinations.

Figure 2-5: RNO Airline Service Destination Map

                                                                                                                2-8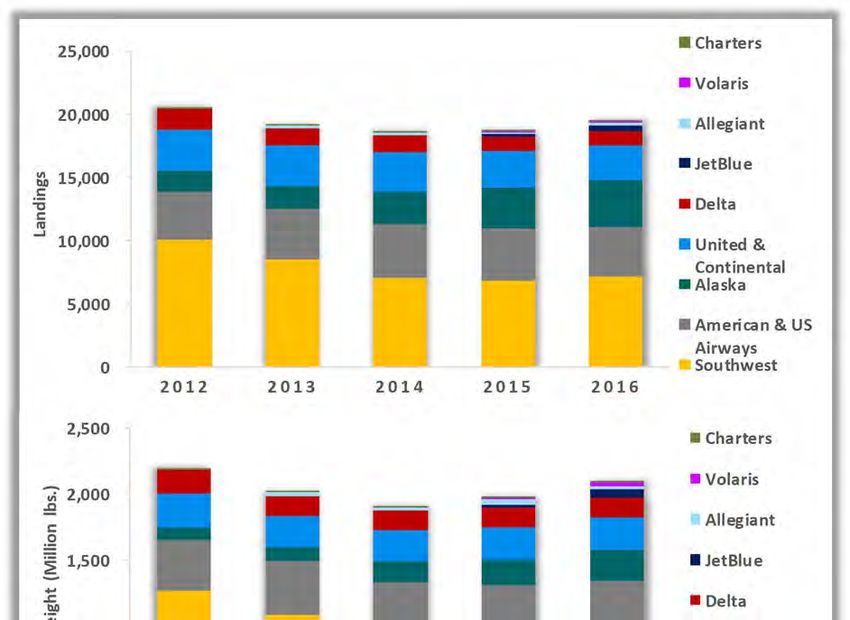
Chapter 2 - Aviation Activity Analysis and Forecast

Table 2-7 ranks RNO’s top 25 destinations and PDEWs by destination, as well as the average flights and seats
per week, and the market load factor those numbers represent. Several items are worth noting. Airlines as of
YE June 30, 2016, include Alaska, Allegiant, American, Delta, JetBlue, Southwest, United and Volaris. Potential
new entrants for domestic air service include two growing airlines: Frontier, which previously stopped service
in August 2007, and Spirit. Large local markets without nonstop service include: Logan International Airport
(BOS) with 71 PDEW, Minneapolis-St. Paul International Airport (MSP) to year-round with 66 PDEW, Orlando
International Airport (MCO) with 62 PDEW, Austin-Bergstrom International Airport (AUS) with 52 PDEW,
Philadelphia International Airport (PHL) with 49 PDEW, Baltimore-Washington International Airport (BWI)
with 48 PDEW, Ronald Reagan Washington National Airport (DCA) with 45 PDEW, Detroit Metropolitan
Airport (DTW) with 44 PDEW, and Newark Liberty International Airport (EWR) with 42 PDEW. United Airlines
George Bush Intercontinental Airport (IAH) is a market in need of additional frequency due to high load
factors and strong unit revenue. In March 2017, RNO offered nonstop service to 16 of the top 25 destinations
with 395 weekly departures on 48,510 weekly seats.

Table 2-7: Top 25 Destinations by PDEW
                                                                          Average / Week
  Rank                      Destination                      PDEW                                Market LF
                                                                         Flights     Seats
     1              Las Vegas, NV                LAS         595.9          69      10,123          76.1
     2             Los Angeles, CA              LAX          394.8          56       5,397          70.0
     3               Phoenix, AZ                PHX          264.4          35       4,786          78.2
     4          Seattle-Tacoma, WA              SEA          245.7          27       2,052          81.2
     5              San Diego, CA               SAN          220.2          13       1,859          74.2
    6                 Denver, CO                DEN          202.5          28       3,877          86.3
     7               Portland, OR               PDX          144.0          20       1,520          79.3
     8            New York JFK, NY               JFK         134.5           7       1,050          86.0
     9          Dallas-Fort Worth, TX           DFW           99.2          14       2,240          82.1
    10            Salt Lake City, UT             SLC          94.9          26       3,627          81.9
    11           Chicago O’Hare, IL             ORD           89.0           7       1,120          80.7
    12               San Jose, CA                SJC          71.2          13        988           64.4
    13               Boston, MA                 BOS           71.1           0         0            N/A
    14            Minneapolis, MN               MSP           65.7           0         0            92.4
    15           Orange County, CA              SNA           63.0           7        532           80.4
    16               Orlando, FL                MCO           62.0           0         0            N/A
    17                Atlanta, GA                ATL          58.3           1        180           N/A
    18           Chicago Midway, IL             MDW           57.6           4        668           92.0
    19                 Austin, TX               AUS           52.2           0         0            N/A
    20            Philadelphia, PA              PHL           48.5           0         0            N/A
    21             Baltimore, MD                BWI           48.2           0         0            N/A
    22         Washington Reagan, DC            DCA           45.1           0         0            N/A
    23                Detroit, MI               DTW           44.4           0         0            N/A
    24            Houston Bush, TX               IAH          44.3           2        152           94.3
    25                Newark, NJ                EWR           41.6           0         0            N/A
Source: Mead & Hunt, Inc. YE June 30, 2016; March 2017 schedules and YE October 2016 LFs

                                                                                                                        2-9
Chapter 2 - Aviation Activity Analysis and Forecast
RNO has a relatively high retention rate and supports the catchment area population of more than 750,000.
Based on the air service market trends derived from this study, March 2017 capacity is expected to be up 19
percent YOY, which indicates RNO is experiencing significant growth mainly driven by increases from all
incumbent airlines except American and Volaris Airlines. Carriers that have increased their schedule may be
cautious about further expansion if the scheduled capacity is unfilled and will likely want to see that extra
capacity sold and used at reasonable levels before expanding again in the near term.
RNO has service to all its top 10 markets including to John F. Kennedy International Airport (JFK) in New York,
which began in June 2015. While New York nonstop service exists, United Airlines’ service to EWR or
Washington Dulles International Airport (IAD) are options given the large regional local market sizes with no
nonstop service. While DCA may be the preferred airport for Washington D.C. area, IAD or BWI would offer
significantly more potential international connections.
Additional nonstop service to eastern markets such as BOS, DTW, MCO and PHL should be explored along
with continuing to meet with airlines not serving RNO as of the time of this study, such as Frontier Airlines
and Spirit Airlines. Eastern destinations could be more challenging to attract and retain service, as they
require a greater cost investment by the airlines due to the longer distances being flown. These costs make
the economics of the routes more challenging to sustain.
Incumbent Airline Opportunities
Overall, when including domestic and international travelers, Southwest Airlines was the largest carrier at
RNO at YE June 30, 2016. Southwest Airlines carried about 1.5 million passengers, ahead of American Airlines
with 735,000 passengers, United Airlines with 415,000, Alaska Airlines with 396,000, Delta with 247,000,
JetBlue with 82,000, and Volaris and Allegiant each carrying approximately 35,000 annual onboard
passengers to and from RNO. Load factors for all airlines averaged 81 percent with United Airlines and
JetBlue averaging 86 percent, and Volaris averaging the lowest at 73 percent. Overall industry load factors in
the mid-80s still leaves some room for passenger growth on the current schedule, especially for Alaska
Airlines and Southwest Airlines with their percent of seats sold just under 80 percent.
Trends point to Alaska Airlines’ overall March capacity being up 17 percent YOY. However, the merger with
Virgin-America may offer opportunities for additional expansion beyond John Wayne Airport (SNA) in Orange
County to markets such as SFO and SAN as they work through their combined networks. With Allegiant’s
year-round service to just LAS at the time of this study, opportunities for new markets such as AUS exist. AUS
is a top 20 market without nonstop service. Due to the nonstop service already provided from RNO to both
PHX and SAN, service to Phoenix-Mesa Gateway Airport (AZA) or SAN would present challenges. For example,
Allegiant may be reluctant to serve another market with direct competition even though they serve LAS in
conjunction with Southwest Airlines today.
2-10Chapter 2 - Aviation Activity Analysis and Forecast
Expanding Delta’s presence beyond Salt Lake City International Airport (SLC) is another viable option to
explore as both Hartsfield-Jackson Atlanta International Airport (ATL) and MSP have had less than daily
service and both are a top 20 market without daily nonstop service. Even though United Airline’s capacity is
trending upward 16 percent, they are running high load factors in the RNO market. As a result, additional
frequencies to IAH or nonstops to additional eastern markets like Chicago O’Hare International Airport
(ORD), IAD or EWR could be considered. Southwest has added the greatest number of seats YOY in the RNO
market expanding into Dallas Love Field (DAL) and Oakland International Airport (OAK); therefore, Southwest
may want to give the new service time to ramp up before expanding further. With the addition of Long
Beach Airport (LGB), JetBlue has doubled its capacity from the RNO market and may also want to give the
service time to prove itself. Volaris flies to Guadalajara International Airport (GDL) three times per week and
has generated load factors above 80 percent in certain months. Volaris could look to expand to additional
destinations such as CUN or Mexico City International Airport (MEX).
New Airline Opportunities
Several airlines do not currently operate at RNO and are potential operators of new service. These include
Frontier Airlines, Spirit Airlines, and some low cost international carriers such as WOW Air that continue to
grow and expand their footprint across the U.S. To attract these potential airlines, RNO would need to
experience either local market growth and/or target a hub that could provide connections beyond the target
city to be economically viable. Canadian carriers like WestJet are an example of this scenario.
Other airline opportunities may arise, such as pro-rate flying on regional airlines like SkyWest Airlines, or
scheduled charter service on evolving carriers like Air Florida, Falcon Air Express, Omni Air, Miami Air
International, or Sun Country. Previous attempts at attracting international service to London were
successful by working with key stakeholders though the Customs and Border Protection (CBP) staffing issues
will need to be examined. Targeting tour operators such as Thomas Cook, Apple Vacations, or Vacation
Express can be another way to expand international service.
Air Service Market Evaluation Summary
With more than 775,000 people in the RNO primary catchment area, a true market of 3.67 million O & D
travelers translates to 93 percent domestic travel, and seven percent, international. RNO retains 94 percent
within the top 25 markets, which generate 65 percent of total air travel.
In terms of market performance, based on YE June 30, 2016, capacity, passengers, and load factor improved
YOY and were trending positively. RNO fares were lower than the U.S. average and were stable while O&D
airline revenue was increasing, with Southwest Airlines and American Airlines leading in revenue share at
RNO. RNO passenger and revenue growth outpaced other airports within the West region. This appears to
contradict the reported results in the bullets below, but it is important to keep in mind that RASMs are the
metric used to analyze route performance. RASMs combine the average fare and load factor, which leads to
the seeming contradiction.
2-11Chapter 2 - Aviation Activity Analysis and Forecast
In terms of route performance, the bullets below summarize the results for the airlines serving passengers at
RNO:
Alaska (AS): RNO had above average RASM at SNA/Portland International Airport (PDX)/San Jose
International Airport (SJC)/SEA, but below average at Boise Airport (BOI) – SJC, although the RASM
experienced strong YOY improvement.
Allegiant (G4): RNO had above average RASM at LAS.
American (AA): RNO had below average RASM at ORD/Dallas/Fort Worth International Airport
(DFW)/PHX, and average at LAX.
Delta (DL): RNO had below average RASM at SLC – MSP, but operated seasonally on Saturdays only and
ran high load factors.
JetBlue (B6): RNO had below average RASM at JFK, where service began June 2015. LGB was not
analyzed due to service starting September 2016.
Southwest (WN): RNO had average RASM at LAS/LAX/SAN, and below average at Chicago Midway
International Airport (MDW)/PHX/Denver International Airport (DEN)/OAK. Service to OAK began June
2016.
United (UA): RNO had above average RASM at IAH/SFO, average at LAX, and below average at DEN.
Appendix F provides additional information regarding route performance for each of the airlines currently
serving RNO.
2-12Chapter 2 - Aviation Activity Analysis and Forecast
Commercial Passenger Traffic
This section discusses the historical trends in commercial passenger traffic at RNO and presents forecasts for
the 20-year period ending in 2036. The analysis of historical trends sets the context for model specifications
and assumptions used in forecast development.
Historical Enplanement Trends
Enplanement History Since 1990
In 2016 RNO posted its second consecutive year of growth in commercial passenger traffic, seeing 6.4
percent in growth of total passengers (enplaned and deplaned). Passenger enplanements increased 6.2
percent to 1.82 million, surpassing the previous year’s increase of 3.9 percent, as shown in Figure 2-6. These
increases ended seven consecutive years of decreases that began in 2008, when the U.S. economy entered a
recession. The increases also halted an overall downward trend since 1997 when enplanements reached an
all-time peak level of 3.34 million at the height of Reno Air’s hub operations at RNO.
Figure 2-6: RNO’s Enplanement Trends since 1990
Sources: U.S. BTS T-100 data for 1990-2008, RTAA records for 2009-2016, and Unison Consulting, Inc.
2-13Chapter 2 - Aviation Activity Analysis and Forecast
From 1990 through 1997, RNO experienced an unprecedented growth in enplanements with the expansion
of low-fare service by Reno Air and Southwest Airlines amid a long-running U.S. economic expansion.
Southwest Airlines began service in 1990 and rapidly ramped up its operations, gaining the largest airline
share of RNO enplanements by 1996.
Reno Air, a start-up low-fare carrier, began service in 1992 with RNO as its home base and main network hub.
Reno Air expanded operations quickly and competed closely with Southwest Airlines, besting Southwest in
1997 for the largest market share at RNO.
A pivotal change occurred in 1993 when Reno Air entered an alliance with American Airlines to handle
American’s regional traffic. In 1999, American Airlines acquired Reno Air, which flew its last flight in August
that year. At the time of the acquisition, American intended to use Reno Air to expand its network, but plans
changed following the 2001 U.S. economic recession and terrorist attacks. Financial pressures led American
to dispose of Reno Air’s entire fleet to reduce capacity and dismantle Reno Air’s network including the RNO
hub. These actions downgraded RNO to a secondary airport in American’s route system.
During the same period, RNO, along with other U.S. airports, faced weak air travel demand from the
economic recession, security concerns after the terrorist attacks, and a decrease in short-haul air travel due
to the new stringent security measures. After peaking in 1997, enplanements at RNO decreased in five
consecutive years through 2002.
In 2003, the trend reversed and annual enplanements at RNO increased in three consecutive years. During
the same period, jet fuel prices began to rise, and the U.S. economy began to slow again, ultimately entering
another recession in 2008-2009, which has come to be known as the Great Recession. This was the longest
and deepest post-World War II recession.
Airlines responded by cutting domestic seat capacity, cutting service on less profitable routes, increasing load
factors, transferring routes between mainline and regional service, retiring old aircraft, changing pricing
structures, and implementing various cost-cutting measures. Mounting financial pressures led to airline
bankruptcies and a consolidation wave that has left the industry with only four major airlines controlling 80
percent of the U.S. market. The Great Recession dampened air travel demand in leisure markets like Reno
more than in other markets with large business centers. Airline capacity cuts, which continued long after the
end of the Great Recession, hurt smaller airports like RNO more than larger airports.
As a result of these factors, passenger traffic at RNO decreased to 1.65 million enplanements in 2014, the
lowest level in 26 years. The growth in the past two years increased enplanements by 10.3 percent, to 1.82
million in 2016, about the same as the level in 1992, the second full year of Southwest’s operations at RNO
and the year Reno Air started service. The enplanement level in 2016 was slightly more than one half of the
all-time peak level in 1997 and more than two-thirds of the highest level reached just before the Great
Recession.
The growth in RNO enplanements in the past two years can be attributed to two positive trends: the regional
economic recovery is finally gaining momentum, and airlines are beginning to add capacity. At RNO, all
airlines increased scheduled seats over the two-year period, with Alaska Airlines adding the largest number
of seats. RNO also gained two new airlines, JetBlue and Volaris, and JetBlue added the second largest number
of seats.
2-14Chapter 2 - Aviation Activity Analysis and Forecast
Comparison of RNO and U.S. Enplanement Trends since 2002
Figure 2-7 compares the enplanement growth trends at RNO with the national trends since 2002. Through
2005, RNO was outperforming the nation in enplanement growth. By 2005, RNO’s enplanements had grown
22 percent from 2002, while U.S. total enplanements had grown only 19 percent. In 2006, RNO began to fall
behind as enplanements began to decrease, while total U.S. enplanements continued to increase through
2007.
In 2008-2009, the U.S. economy entered the Great Recession, and enplanements decreased nationwide. RNO
suffered proportionally larger decreases in enplanements. After the Recession ended in 2009, U.S. total
enplanements grew steadily each year and surpassed their pre-recession level in 2014. By 2016, U.S. total
enplanements had grown to 138 percent of their level in 2002.
RNO experienced the opposite as enplanements continued to decrease through 2014. RNO reversed the
trend in 2015 and has tracked national growth trends since then. Despite growing more than 10 percent over
the past two years, however, RNO’s enplanements remained well below pre-recession levels. In 2016, RNO
enplanements were still only at 83 percent of the 2002 level. As Figure 2-8 shows, RNO’s share of total U.S.
enplanements decreased from 0.3 percent before the recession to 0.2 percent after the recession.
Figure 2-7: RNO and U.S. Enplanements – Cumulative Growth Since 2002
Sources: RTAA records for RNO enplanements, U.S. Bureau of Transportation Statistics T-100 Market Data for U.S. total
enplanements, and Unison Consulting, Inc. The data labels show cumulative growth through 2016.
2-15Chapter 2 - Aviation Activity Analysis and Forecast
Figure 2-8: RNO’s Share (%) of U.S. Total Enplanements
Sources: RTAA records for RNO enplanements, U.S. Bureau of Transportation Statistics T-100 Market Data for U.S. total
enplanements, and Unison Consulting, Inc.
The following factors explain the divergence of RNO’s enplanement growth trends from the national
enplanement growth trends:
Divergent economic trends: Compared to the U.S. economy, the regional economy declined more sharply
during the 2008-2009 recession and continued to decline through 2013, four years into the national
economic recovery and expansion, as shown in Figure 2-9.
Divergent employment trends: The nonfarm employment level in the Reno-Carson City-Fernley
combined statistical area (Reno CSA) fell more sharply during the recession and began to recover a year
later than the U.S. nonfarm employment level, as shown in Figure 2-10.
Divergent trends in available airline seats: U.S. airlines cut system-wide domestic seat capacity during the
recession and kept capacity flat through 2014. RNO suffered deeper cuts, which continued through 2014,
as shown in Figure 2-11.
2-16Chapter 2 - Aviation Activity Analysis and Forecast
Figure 2-9: Comparison of the Reno CSA and U.S. Overall Economic Growth Trends
GDP – Gross Domestic Product
Sources: U.S. Bureau of Economic Analysis, Moody’s Analytics, and Unison Consulting, Inc.
Figure 2-10: Comparison of the Reno CSA and U.S. Employment Growth Trends
Sources: U.S. Bureau of Labor Statistics, Moody’s Analytics, and Unison Consulting, Inc.
2-17Chapter 2 - Aviation Activity Analysis and Forecast
Figure 2-11: Comparison of Trends in Available Seats at RNO and Nationwide
(U.S. Carriers, Domestic Segment Only)
Sources: U.S. Bureau of Transportation Statistics T-100 Domestic Segment Data on Available Seats and Unison Consulting, Inc.
Monthly Enplanement Trends
A seasonal pattern in enplanements is typical at most airports as it is at RNO, as shown in Figure 2-12. During
the year, enplanements at RNO typically reach their highest level in July, the peak of summer leisure travel.
They typically reach their lowest level in November, before the winter ski season, except in 2015 when
enplanements were lowest in February and in 2016 when enplanements were lowest in January.
Figure 2-12: Monthly Enplanement Trends at RNO
180
170
Enplanements (Thousand)
160
150
140
130
120
110
Jan Feb Mar Apr May Jun Jul Aug Sep Oct Nov Dec
2012 2013 2014 2015 2016
Sources: RTAA records and Unison Consulting, Inc.
2-18Chapter 2 - Aviation Activity Analysis and Forecast
Enplanement Trends by Airline from 2009
Figure 2-13 shows RNO’s enplanement trends by airline since 2009, the year during which the Great
Recession ended in June. RNO’s enplanements continued to decrease until the past two years and, by 2016,
were still down 3.1 percent from 2009. Southwest Airlines, RNO’s largest passenger carrier, was responsible
for much of the decrease, especially in short haul flights. United and Delta also posted decreases from 2009
to 2016. The increases in enplanements by American, Alaska, and other airlines, especially newcomer
JetBlue, offset some of the decreases in enplanements by Southwest, United, and Delta. In 2014, total
enplanements reached their lowest level for the period, which was also the lowest level in 26 years. Since
2014, total enplanements have been increasing, with all the airlines posting net increases between 2014 and
2016.
Southwest Airlines remains the largest passenger carrier at RNO, with a 43 percent share of total
enplanements in 2016, as shown in Figure 2-14. However, this share decreased from 54 percent in 2009,
which allowed other airlines to increase market shares. American Airlines, including US Airways’
enplanements, increased its enplanement share from 16 to 21 percent; Alaska Airlines, from 8 to 12 percent;
and new entrants JetBlue, Volaris, and Allegiant gained a combined share of 6 percent in 2016. During the
same period, United's market share decreased slightly from 13 to 12 percent, and Delta maintained its
market share of 7 percent.
America West merged with US Airways prior to 2009, and US Airways merged with American Airlines in 2013.
The charts in Figure 2-14 and Figure 2-15 show the combined enplanements of US Airways and American
Airlines, which grew in share from 2009 to 2016.
2-19Chapter 2 - Aviation Activity Analysis and Forecast
Figure 2-13: RNO Enplanements by Airline
Sources: RTAA records and Unison Consulting, Inc.
1. The bottom chart showing enplanement growth trends for individual airlines does not show the “Others” category. Subtotal
enplanements by this category of airlines quadrupled from 2009 to 2016 because of the entry of JetBlue, Volaris, and Allegiant into
RNO.
2. The numbers for American Airlines include the combined traffic of American Airlines, US Airways, and their regional affiliates,
before and after the merger. American Airlines and US Airways merged in 2013, and the US Airways brand was retired in 2015.
3. The numbers for United Airlines include Continental Airlines’ traffic prior to their merger in 2011.
2-20Chapter 2 - Aviation Activity Analysis and Forecast
Figure 2-14: Airline Shares of RNO Enplanements
100% 1%
7% 6%
Others
90% 7%
8%
12% Delta
80%
13% Alaska
70% 12%
16% United
Percentage
60%
21% American
50%
Southwest
40%
30% 54%
43%
20%
10%
0%
2009 2010 2011 2012 2013 2014 2015 2016
Sources: RTAA records and Unison Consulting, Inc.
The recent wave of consolidation prompted airlines to renew efforts to streamline operations and optimize
networks, cut overall system capacity, and shift their focus away from protecting market share to achieving
profitability. In the process, they moved flights from smaller markets like RNO to larger markets where they
could gain scale and network economies and make higher profits.
In addition, three specific developments likely contributed to the decrease in Southwest Airlines’ activity at
RNO: the repeal of the Wright Amendment, Southwest Airlines’ acquisition of AirTran Airways, and the
conditions for the U.S. Department of Justice’s approval of the American Airlines-US Airways merger. The
repeal of the Wright Amendment lifted restrictions at Southwest Airlines’ home base, Dallas Love Field (DAL),
on one-stop through service effective October 2007 and on nonstop service effective October 2014, allowing
Southwest to increase flights at DAL. The acquisition of AirTran Airways in May 2013 opened international
markets for Southwest. With the merger of American Airlines and US Airways, Southwest gained access to
gates at DCA, La Guardia Airport (LGA), and BOS that American Airlines and US Airways had to give up as a
condition to the approval of the merger. Due to a finite number of aircraft, Southwest’s expansion at these
airports was made possible by decreasing flights at other airports, including RNO.
2-21Chapter 2 - Aviation Activity Analysis and Forecast
Composition of Passenger Traffic at RNO
RNO’s passenger traffic consists largely of O&D traffic, as shown in Figure 2-15, which was estimated to
account for 90 percent of total enplanements in 2015. In 1997, at the height of Reno Air’s hub operations at
RNO, O&D traffic accounted for about 76 percent. RNO’s passenger traffic also consisted entirely of domestic
passengers, until Volaris began the RNO-GDL service in December 2014. By 2016, Volaris enplaned more than
20,000 passengers, capturing a 1 percent share.
Figure 2-15: Enplanements – O&D and Connecting Traffic Shares
4.0
10%
3.5 24%
3.0
Enplanements (Million)
2.5 Connecting
O&D
2.0
90%
1.5 76%
1.0
0.5
0.0
1997 1999 2001 2003 2005 2007 2009 2011 2013 2015 1997 2015
Sources: RTAA records, U.S. Bureau of Transportation Statistics T-100 Market Data, U.S. Bureau of Transportation Statistics DB1B
O&D Market Data accessed through Data Base Products, Inc., and Unison Consulting, Inc.
Top 20 O&D Markets
Figure 2-16 shows RNO’s top 20 O&D airport markets. Las Vegas McCarran International Airport tops the list
with a 13.4 percent share, followed by LAX with 8.2 percent, and Phoenix Sky Harbor International Airport
with 5.3 percent.
2-22Chapter 2 - Aviation Activity Analysis and Forecast
Figure 2-16: RNO’s Top 20 O&D Airport Markets
Share of RNO O&D
Airport Code
Passengers
Las Vegas McCarran International Airport, NV LAS 13.4%
Los Angeles International Airport, CA LAX 8.2%
Phoenix Sky Harbor International, AZ PHX 5.3%
Seattle/Tacoma International Airport, WA SEA 4.7%
San Diego International Airport, CA SAN 4.7%
Denver International Airport, CO DEN 4.2%
Portland International Airport, OR PDX 3.1%
John F Kennedy International Airport, NY 1 JFK 2.7%
Salt Lake City International Airport, UT SLC 2.1%
Dallas/Fort Worth International Airport, TX DFW 1.9%
Chicago O' Hare International Airport, IL ORD 1.8%
Orange County John Wayne Airport, CA SNA 1.7%
San José International Airport, CA SJC 1.6%
Minneapolis-St Paul International Airport, MN MSP 1.5%
Orlando International Airport, FL MCO 1.4%
Boston Logan International Airport, MA BOS 1.4%
Atlanta Hartsfield-Jackson International Airport, GA ATL 1.3%
Chicago Midway International Airport, IL MDW 1.2%
Austin-Bergstrom International Airport, TX AUS 1.2%
Baltimore/Washington International Airport, MD BWI 1.0%
Sources: U.S. Bureau of Transportation Statistics DB1B O&D Market Data accessed through Data Base Products, Inc., Bing Maps,
and Unison Consulting, Inc.
1. RNO O&D passengers using Newark Liberty International Airport (EWR) and La Guardia Airport (LGA) combined account for
another 1.3%.
2-23Chapter 2 - Aviation Activity Analysis and Forecast
Historical Trends in Scheduled Passenger Airline Service
The following figures show the trends in scheduled passenger airline service at RNO:
Scheduled seats from 2004 (Figure 2-17)
Scheduled seats by major carriers from 2004 (Figure 2-18)
Scheduled flights from 2004 (Figure 2-19)
Fleet mix and average seats per flight in 2004 and 2016 (Figure 2-20)
Number of nonstop destinations served from RNO from 2004 (Figure 2-21)
Scheduled service by airline from 2012 (Figure 2-22)
Seats provide the best measure for airline service capacity. Since 2004, scheduled seats at RNO have
decreased by about 40 percent, as shown in Figure 2-17. Southwest Airlines, RNO’s largest passenger carrier,
was responsible for much of the decrease, but all the other major carriers also contributed. Unfavorable
economic conditions, airline industry consolidation, and airline capacity rationalization explain the overall
decrease in airline industry capacity, which fell disproportionately on RNO and other small hub airports.
Southwest experienced other milestones such as regulatory changes, acquisition of AirTran Airways, and
requisite access to more gates at other airports as a condition of the 2013 merger. These milestones allowed
Southwest to expand elsewhere, made possible by cutting capacity at RNO and other airports, due to the
limited number of aircraft available for use and the lack of crew to fly them. Additionally, heightened
economic uncertainty during the Great Recession and the subsequent slow recovery made it unwise for
Southwest (and other airlines) to incur large capital costs by buying new aircraft. In fact, one of the strategies
that was key to airlines’ survival during the years of the recession was to retire inefficient aircraft, defer
deliveries of aircraft on order, and hold off on new aircraft orders.
Figure 2-19 shows how mergers have affected scheduled seats by major airlines at RNO. Of all the mergers
since 2004, the America West-US Airways merger in 2005 and the Continental-United merger in 2010 clearly
caused decreases in the combined seats of those airlines at RNO.
2-24Chapter 2 - Aviation Activity Analysis and Forecast
Figure 2-17: Trends in Scheduled Seats at RNO from 2004
Sources: Diio Mi Schedule data from RTAA and Unison Consulting, Inc.
Figure 2-18: Trends in Scheduled Seats of Major Airlines at RNO from 2004
Sources: Diio Mi Schedule data from RTAA and Unison Consulting, Inc.
2-25Chapter 2 - Aviation Activity Analysis and Forecast
Scheduled flights have decreased as much as scheduled seats, as Figure 2-19 shows.
Figure 2-19: Trends in Scheduled Flights at RNO from 2004
Sources: Diio Mi Schedule data from RTAA and Unison Consulting, Inc.
The mix of aircraft serving RNO has also changed, as shown in Figure 2-20. The proportion of narrow body jet
aircraft decreased from 81 percent in 2004 to 63 percent in 2016, as the proportion of smaller aircraft,
namely regional jet and turboprop aircraft, increased from 19 percent in 2004 to 37 percent in 2016. As a
result, the average number of seats on each flight decreased slightly from 120 in 2004 to 118 in 2016. Within
the narrow-body jet fleet, however, airlines have been adding seats to existing aircraft, so that the average
seat capacity on each narrow-body jet aircraft has increased. Within the regional jet and turboprop fleet, the
smaller 50-seat aircraft have been replaced with larger aircraft, so that the average seat capacity in this
equipment group has also increased.
2-26Chapter 2 - Aviation Activity Analysis and Forecast
Figure 2-20: Fleet Mix and Average Seats per Flight
Sources: Diio Mi Schedule data from RTAA and Unison Consulting, Inc.
The number of airport destinations served nonstop from RNO, shown in Figure 2-21, increased to 22 in 2016
from a low of 17 in 2010-2014. In 2004-2009, the number of airport destinations had reached a high of 23.
Figure 2-21: Number of Airport Destinations with Nonstop Flights from RNO
Sources: Diio Mi Schedule data from RTAA and Unison Consulting, Inc.
2-27Chapter 2 - Aviation Activity Analysis and Forecast
Figure 2-22 shows the trends in scheduled service originating from RNO by airline over the last five years.
Southwest still accounts for the most number of seats and flights offered at RNO, although its average daily
scheduled seats decreased from 3,800 in 2012 to 2,800 in 2016, and its average daily flights decreased from
28 in 2012 to 20 in 2016. American Airlines follows in second position, increasing its average daily scheduled
seats from 1,000 in 2012 to 1,200 in 2016 while maintaining 11 flights per day on average. For the entire
airport, scheduled seats decreased from 6,400 per day in 2012 to 6,300 per day in 2016 and scheduled flights
decreased from 56 per day in 2012 to 54 per day in 2016, on average.
Figure 2-22: Trends in Scheduled Outbound Service by Airline from RNO from 2012
Sources: OAG Schedules Analyzer and Unison Consulting, Inc.
2-28Chapter 2 - Aviation Activity Analysis and Forecast
Landings and Landed Weight
The trends in number of aircraft landings and landed weight by commercial passenger airlines reflect the
same declining trend through 2014 and the beginning of recovery in 2015 and 2016 observed by
enplanements, shown in Figure 2-23. Southwest Airlines accounts for the largest shares of landings and
landed weight, and American Airlines accounts for the second largest shares.
Figure 2-23: Trends in Landings and Landed Weight by Airline from RNO from 2012
Sources: OAG Schedules Analyzer and Unison Consulting, Inc.
2-29Chapter 2 - Aviation Activity Analysis and Forecast
Commercial Passenger Aircraft Operations by Month and Time of Day
Figure 2-24 shows the monthly distribution of commercial passenger aircraft operations at RNO, based on
airline flight schedules for 2015-2017. The peak month is July, with an average of 9.3 percent of annual
operations taking place during this month. Figure 2-25 shows the hourly distribution of operations during the
average day in July, also based on airline flight schedules for 2015-2017. Arrivals and departures are
distributed differently throughout the day. The peak hour for aircraft departures is from 6 to 6:59 a.m.; 13.1
percent of daily departures take place during this hour. The peak hour for aircraft arrivals is from 11 to 11:59
p.m.; nine percent of daily arrivals take place during this hour. The peak hour for total aircraft operations
(departures and arrivals) is from 9 to 9:59 a.m.; or 7.5 percent of total daily operations take place during this
hour.
Figure 2-24: Monthly Distribution of Commercial Passenger Aircraft Operations
12%
11%
Jul, 9.3%
Share of Annual Operations
10%
9%
8%
7%
6%
Jan Feb Mar Apr May Jun Jul Aug Sep Oct Nov Dec
Sources: OAG Schedules Analyzer and Unison Consulting, Inc. The distribution is based on scheduled flights for 2015-2017.
2-30Chapter 2 - Aviation Activity Analysis and Forecast
Figure 2-25: Peak Month Average Day Distribution of Commercial Passenger Aircraft Operations
14% Departures,
13.1%
12% Arrivals, 9.0%
Total Operations,
Percentage of Operations
10%
7.5%
8%
6%
4%
2%
0%
Time of Day
Arrivals Departures Total Operations
Sources: OAG Schedules Analyzer and Unison Consulting, Inc. The distributions are based on scheduled flights for July in 2015-2017.
Forecast Commercial Passenger Traffic
Methodology
The approach to forecasting commercial passenger aviation activity uses the following modeling techniques:
Hybrid forecasting framework
Multivariate time series regression analysis
Scenario forecasting
Forecast risk analysis using Monte Carlo simulation
2-31Chapter 2 - Aviation Activity Analysis and Forecast
The models use data from various sources, including the following:
Reno-Tahoe Airport Authority
Airline flight schedules
Airline websites and annual reports
Online airline fleet data sources
U.S. Bureau of Transportation Statistics databases and publications
Federal Aviation Administration databases and publications
U.S. Bureau of Census
U.S. Bureau of Labor Statistics
U.S. Bureau of Economic Analysis
Moody’s Analytics
2015-2019 Northern Nevada Regional Growth Study prepared by the Economic Planning Indicator
Committee (EPIC).
The hybrid forecasting framework incorporates both supply and demand considerations. The forecast for the
first year is supply-driven, based primarily on published airline flight schedules for up to one year ahead.
Airlines plan their schedules based on passenger bookings, and the schedules therefore reflect near-term
market demand. The schedules also establish the baseline data on commercial aircraft operations and fleet
mix.
Beyond the first year, forecasts are demand-driven. Market demand factors drive growth in enplanements.
Forecast enplanement levels, in turn, determine the number of aircraft operations and corresponding landed
weight, along with assumptions regarding trends in boarding load factors and changes in aircraft fleet mix.
Multivariate time series regression analysis links enplanement growth to trends in market demand drivers.
This type of analysis combines elements of multiple regression and time series regression methods. This
econometric modeling technique provides the ability to incorporate many explanatory variables, quantify the
contribution of each explanatory variable to aviation activity trends, and account for time trends and any
serial correlation in time series data. The model estimation process using the least squares method is
designed to minimize forecast errors. Using two-stage least squares (TSLS) estimation method also addresses
the potential endogeneity of real passenger yield, one of the key drivers of passenger traffic.
The regression model specification for RNO passenger traffic is based on the underlying theory of consumer
demand and the dynamics of traffic growth at RNO. The regression coefficients that measure contributions of
market demand drivers (explanatory variables) to RNO enplanement growth trends are estimated using
historical annual and quarterly data from 1990, controlling for the effects of any structural changes in air
service and extra-ordinary events like the 2001 terrorist attacks. The estimated regression coefficients are
then used to generate forecasts of RNO enplanements based on projected trends for the model explanatory
variables.
2-32Chapter 2 - Aviation Activity Analysis and Forecast
Since American Airlines ended the former Reno Air’s hub operations at RNO in 2001, connecting traffic has
decreased, increasing the O&D traffic share to 90 percent of total enplanements. For the regression model of
passenger traffic, O&D enplanements serve as the dependent variable, effectively controlling for the
significant fluctuation in enplanement levels due to connecting traffic.
The key explanatory variables (independent variables) in the regression model of passenger traffic are as
follows:
Economic trends: The regression model includes two economic indicators: the real per capita gross
domestic product (GDP) for the Reno-Carson City-Fernley, NV, CSA to indicate regional economic trends,
and the U.S. unemployment rate to indicate national economic trends.1 The regression coefficient
estimates for these variables confirm their expected effects on RNO enplanement trends. Holding all
other factors constant, growth in regional real per capita GDP and decreases in U.S. unemployment rate,
indicating overall national economic growth, promote growth in RNO enplanements. Conversely,
economic downturns and increases in unemployment decrease RNO enplanements.
Airline yield trends: Consumer demand is inversely related to price. Demand increases when price
decreases and decreases when price increases, if all other things are equal. The regression model
estimation results confirm this relationship strongly applies to RNO passenger traffic. The regression
model uses the average real passenger yield at RNO as the indicator for the price of air travel. Passenger
yield, which is the average revenue per passenger mile, is a better price indicator than the average fare,
because it controls for trip distance.2
Figures 2-26, 2-27, 2-28, and 2-29 show the projections of the most likely trends in the key demand drivers:
Regional economic trends: The regional real per capita GDP decreased sharply during the last recession.
Altogether it decreased for eight years straight through 2013. The regional economy began to turn
around in 2014 and has since grown steadily along with the national economy, albeit at the same slow
pace. According to economic forecasts by Moody’s Analytics, the regional real per capita GDP will
continue growing at an average pace of 1.3 percent annually over the 20-year forecast period, 2017-
2036. Moody’s Analytics’ economic forecasts anticipate some cyclicality in the medium term, showing a
mild acceleration of growth in the regional economy over the next three years—consistent with the
forecast in EPIC’s Northern Nevada Regional Growth Study for 2015-2019—before growth slows again.
The long-term forecast, however, does not anticipate any deep downturns in the regional economy like
the one experienced during the Great Recession.
1
These two economic indicators proved to be better predictors of RNO enplanement trends than the other economic
indicators tested: aggregate and per capita personal income in the Reno-Carson City-Fernley, NV, CSA; nonfarm
employment in the Reno-Carson City-Fernley, NV, CSA; and U.S. nonfarm employment. Population at the CSA level was
also tested as an explanatory variable.
2
Airline yield may not be totally independent of passenger traffic levels. The use of TSLS corrects for the potential
endogeneity of airline yield. With TSLS, the model estimation is done in two stages. In the first stage, airline yield is
regressed on the following independent variables: nonfarm employment in the Reno CSA, real per capita GDP in the
Reno CSA, U.S. unemployment rate, real jet fuel price, the variables that control for the changes in air service by Reno
Air and Southwest airlines, and the variables that capture post-9/11 structural changes.
2-33You can also read