Energy Outlook Gulf Coast - David E. Dismukes | Gregory B. Upton, Jr.* - LSU
←
→
Page content transcription
If your browser does not render page correctly, please read the page content below

Gulf Coast
Energy Outlook
                                             2
                                             0
                                             2
                                             1

David E. Dismukes | Gregory B. Upton, Jr.*
*Corresponding author
2021 Gulf Coast Energy Outlook
                                David E. Dismukes – LSU Center for Energy Studies
                                Gregory B. Upton, Jr. – LSU Center for Energy Studies
                                Release Date: Fall 2020

Acknowledgments
The Gulf Coast Energy Outlook (GCEO) would not have been possible without the help of many
who contributed both time and financial resources. First, the input from dozens of industrial, govern-
mental, civic, and trade organizations that requested having the 2020 GCEO presented to their
organizations is much appreciated. The feedback that was provided during these conferences and
individual meetings was instrumental in preparing the current 2021 GCEO. While “crunching the
numbers” is an important aspect of any forecasting process, the input provided by stakeholders who
have an “on-the-ground” view of what is occurring in real time is equally valuable.
Special thanks are owed to Marybeth Pinsonneault and Ric Pincomb (Center for Energy Studies)
and Stephen Radcliffe (E.J. Ourso College of Business), for their media, editorial, and production
expertise. Drew Smith (Center for Energy Studies) also contributed to data collection and analysis
included in this report.
Last, but certainly not least, a special thanks and appreciation is extended to our sponsors. We know
this has been a difficult year across all facets of the energy sector, so this year, in particular, we are
extremely grateful for this financial support:
 > Gold: Louisiana Mid-Continent Oil & Gas Association (LMOGA) and Phillips 66
 > Silver: Entergy, Enverus, and Koch
 > Bronze: Bristow Group

LSU Center for Energy Studies                                                                            1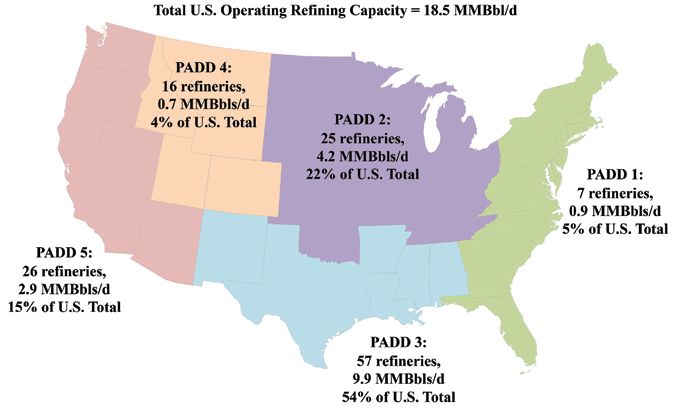
Table of Contents
1. Introduction. . . . . . . . . . . . . . . . . . . . . . . . . . . . . . . . . . . . . . . . . . . . . . . . . . . . . . . . . . . . . . 5
1.1 COVID-19. . . . . . . . . . . . . . . . . . . . . . . . . . . . . . . . . . . . . . . . . . . . . . . . . . . . . . . . . 5
1.2 Phase One of China Trade Deal Reached . . . . . . . . . . . . . . . . . . . . . . . . . . . . . 6
1.3 2020 Hurricane Season . . . . . . . . . . . . . . . . . . . . . . . . . . . . . . . . . . . . . . . . . . . . 8
1.4 What a Biden Presidency Could Mean for the Energy Industry . . . . . . . . . . . 9
2. Crude Oil and Natural Gas Production and Prices. . . . . . . . . . . . . . . . . . . . . . . . . . . . . . 10
2.1 Recent Market Trends: Production . . . . . . . . . . . . . . . . . . . . . . . . . . . . . . . . . . . 10
2.2 Recent Regional Trends: Crude Oil and Natural Gas Production. . . . . . . . . . 14
2.3 Recent Trends: Commodity Pricing. . . . . . . . . . . . . . . . . . . . . . . . . . . . . . . . . . . 15
2.3.1 COVID-19 impacts on oil prices . . . . . . . . . . . . . . . . . . . . . . . . . . . . . . . . . . . . . . . . . . . . . . 16
2.4 Outlook: Commodity Pricing. . . . . . . . . . . . . . . . . . . . . . . . . . . . . . . . . . . . . . . . . 18
2.5 Outlook: Crude Oil and Natural Gas Production. . . . . . . . . . . . . . . . . . . . . . . . 20
3 Pipeline Activity. . . . . . . . . . . . . . . . . . . . . . . . . . . . . . . . . . . . . . . . . . . . . . . . . . . . . . . . . . . 22
3.1 Recent Trends. . . . . . . . . . . . . . . . . . . . . . . . . . . . . . . . . . . . . . . . . . . . . . . . . . . . . 22
3.2 Pipeline Outlook. . . . . . . . . . . . . . . . . . . . . . . . . . . . . . . . . . . . . . . . . . . . . . . . . . . 24
4. Power Sector. . . . . . . . . . . . . . . . . . . . . . . . . . . . . . . . . . . . . . . . . . . . . . . . . . . . . . . . . . . . . 25
4.1 Recent Trends: Load Growth . . . . . . . . . . . . . . . . . . . . . . . . . . . . . . . . . . . . . . . . 25
4.2 Recent Trends: Carbon Emissions. . . . . . . . . . . . . . . . . . . . . . . . . . . . . . . . . . . . 27
4.3 Outlook: Capacity Investment . . . . . . . . . . . . . . . . . . . . . . . . . . . . . . . . . . . . . . . 28
5. Energy Manufacturing Activity. . . . . . . . . . . . . . . . . . . . . . . . . . . . . . . . . . . . . . . . . . . . . . 30
5.1 Recent Trends. . . . . . . . . . . . . . . . . . . . . . . . . . . . . . . . . . . . . . . . . . . . . . . . . . . . . 30
5.2 Energy Manufacturing Outlook . . . . . . . . . . . . . . . . . . . . . . . . . . . . . . . . . . . . . . 36
6. Energy Exports. . . . . . . . . . . . . . . . . . . . . . . . . . . . . . . . . . . . . . . . . . . . . . . . . . . . . . . . . . . 39
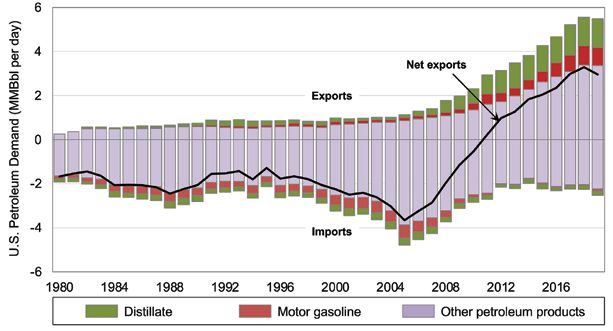
6.1 Recent Trends: Refined Product Export . . . . . . . . . . . . . . . . . . . . . . . . . . . . . . . 39
6.2 Recent Trends: Crude Oil Exports. . . . . . . . . . . . . . . . . . . . . . . . . . . . . . . . . . . . 44
6.3 Recent Trends: LNG Exports. . . . . . . . . . . . . . . . . . . . . . . . . . . . . . . . . . . . . . . . . 45
6.4 Outlook: Refined Product Exports. . . . . . . . . . . . . . . . . . . . . . . . . . . . . . . . . . . . 50
6.5 Outlook: Crude Oil Exports. . . . . . . . . . . . . . . . . . . . . . . . . . . . . . . . . . . . . . . . . . 52
6.6 Outlook: LNG Exports . . . . . . . . . . . . . . . . . . . . . . . . . . . . . . . . . . . . . . . . . . . . . . 53
7. COVID-19 Impacts on Domestic Energy Demand. . . . . . . . . . . . . . . . . . . . . . . . . . . . . . . 55
7.1 Electricity Demand. . . . . . . . . . . . . . . . . . . . . . . . . . . . . . . . . . . . . . . . . . . . . . . . . 55
7.2 Transportation Fuels Demand . . . . . . . . . . . . . . . . . . . . . . . . . . . . . . . . . . . . . . . 56
7.3 Natural Gas Demand. . . . . . . . . . . . . . . . . . . . . . . . . . . . . . . . . . . . . . . . . . . . . . . 57
8. Employment Outlook. . . . . . . . . . . . . . . . . . . . . . . . . . . . . . . . . . . . . . . . . . . . . . . . . . . . . . 58
8.1 Employment Forecasts . . . . . . . . . . . . . . . . . . . . . . . . . . . . . . . . . . . . . . . . . . . . . 58
9. Conclusions. . . . . . . . . . . . . . . . . . . . . . . . . . . . . . . . . . . . . . . . . . . . . . . . . . . . . . . . . . . . . . 62
2 Gulf Coast Energy Outlook 2021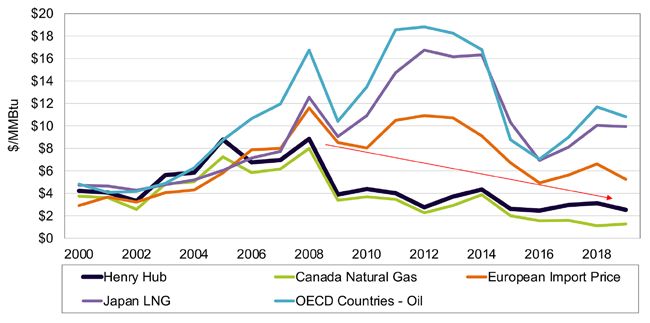
List of Figures
Figure 1: U.S. crude oil and natural gas production . . . . . . . . . . . . . . . . . . . . . . . . . . . . . . . . . . . . . . . . . . . . . . . . 10
Figure 2: U.S. crude oil prices and rig count . . . . . . . . . . . . . . . . . . . . . . . . . . . . . . . . . . . . . . . . . . . . . . . . . . . . . . 13
Figure 3: Rig counts in major shale basins. . . . . . . . . . . . . . . . . . . . . . . . . . . . . . . . . . . . . . . . . . . . . . . . . . . . . . . . 13
Figure 4: Gulf Coast crude oil and natural gas production . . . . . . . . . . . . . . . . . . . . . . . . . . . . . . . . . . . . . . . . . . 14
Figure 5: Historical inflation-adjusted natural gas price. . . . . . . . . . . . . . . . . . . . . . . . . . . . . . . . . . . . . . . . . . . . 15
Figure 6: Historic inflation-adjusted oil prices. . . . . . . . . . . . . . . . . . . . . . . . . . . . . . . . . . . . . . . . . . . . . . . . . . . . . 16
Figure 7: Crude oil price outlook. . . . . . . . . . . . . . . . . . . . . . . . . . . . . . . . . . . . . . . . . . . . . . . . . . . . . . . . . . . . . . . . 19
Figure 8: Natural gas price outlook. . . . . . . . . . . . . . . . . . . . . . . . . . . . . . . . . . . . . . . . . . . . . . . . . . . . . . . . . . . . . . 20
Figure 9: Crude oil production forecast and Gulf Coast share of U.S. production. . . . . . . . . . . . . . . . . . . . . . . 21
Figure 10: Natural gas production forecast and Gulf Coast share of U.S. production . . . . . . . . . . . . . . . . . . . 21
Figure 11: PADD 3 crude oil movements by transportation type. . . . . . . . . . . . . . . . . . . . . . . . . . . . . . . . . . . . . . 23
Figure 12: Henry Hub and Waha natural gas prices. . . . . . . . . . . . . . . . . . . . . . . . . . . . . . . . . . . . . . . . . . . . . . . . 24
Figure 13: Gulf Coast natural gas pipeline capacity outlook. . . . . . . . . . . . . . . . . . . . . . . . . . . . . . . . . . . . . . . . . 25
Figure 14: U.S. and Gulf Coast electricity sales . . . . . . . . . . . . . . . . . . . . . . . . . . . . . . . . . . . . . . . . . . . . . . . . . . . 26
Figure 15: U.S. and Gulf Coast industrial electricity sales . . . . . . . . . . . . . . . . . . . . . . . . . . . . . . . . . . . . . . . . . . . 27
Figure 16: U.S. and Gulf Coast carbon dioxide emissions from electricity generation . . . . . . . . . . . . . . . . . . . 28
Figure 17: U.S. power generation capacity and outlook. . . . . . . . . . . . . . . . . . . . . . . . . . . . . . . . . . . . . . . . . . . . . 29
Figure 18: Gulf Coast power generation capacity and outlook. . . . . . . . . . . . . . . . . . . . . . . . . . . . . . . . . . . . . . . 29
Figure 19: GOM energy manufacturing investments by state. . . . . . . . . . . . . . . . . . . . . . . . . . . . . . . . . . . . . . . . 30
Figure 20: GOM energy manufacturing investments by sector. . . . . . . . . . . . . . . . . . . . . . . . . . . . . . . . . . . . . . 31
Figure 21: Oil-to-gas price ratio . . . . . . . . . . . . . . . . . . . . . . . . . . . . . . . . . . . . . . . . . . . . . . . . . . . . . . . . . . . . . . . . . 32
Figure 22: U.S. chemical industry production and capacity. . . . . . . . . . . . . . . . . . . . . . . . . . . . . . . . . . . . . . . . . 34
Figure 23: Gulf Coast chemical exports to China. . . . . . . . . . . . . . . . . . . . . . . . . . . . . . . . . . . . . . . . . . . . . . . . . . 35
Figure 24: Gulf Coast chemical exports to rest of world . . . . . . . . . . . . . . . . . . . . . . . . . . . . . . . . . . . . . . . . . . . . 36
Figure 25: Collapse in output followed by a slow recovery. . . . . . . . . . . . . . . . . . . . . . . . . . . . . . . . . . . . . . . . . . 37
Figure 26: Number and capacity of U.S. refineries. . . . . . . . . . . . . . . . . . . . . . . . . . . . . . . . . . . . . . . . . . . . . . . . . 39
Figure 27: PADD 3 refining capacity and utilization. . . . . . . . . . . . . . . . . . . . . . . . . . . . . . . . . . . . . . . . . . . . . . . . 40
Figure 28: Monthly PADD 3 and U.S. refining utilization. . . . . . . . . . . . . . . . . . . . . . . . . . . . . . . . . . . . . . . . . . . . 41
Figure 29: PADD 3 petroleum product supplied. . . . . . . . . . . . . . . . . . . . . . . . . . . . . . . . . . . . . . . . . . . . . . . . . . . 41
Figure 30: Monthly PADD 3 petroleum product supplied. . . . . . . . . . . . . . . . . . . . . . . . . . . . . . . . . . . . . . . . . . . 42
Figure 31: U.S. petroleum product imports and exports. . . . . . . . . . . . . . . . . . . . . . . . . . . . . . . . . . . . . . . . . . . . . 43
Figure 32: Monthly U.S. petroleum product imports and exports. . . . . . . . . . . . . . . . . . . . . . . . . . . . . . . . . . . . . 43
Figure 33: U.S. crude oil exports and imports. . . . . . . . . . . . . . . . . . . . . . . . . . . . . . . . . . . . . . . . . . . . . . . . . . . . . 44
Figure 34: Monthly U.S. crude oil exports and imports . . . . . . . . . . . . . . . . . . . . . . . . . . . . . . . . . . . . . . . . . . . . . 45
Figure 35: World LNG trade volumes . . . . . . . . . . . . . . . . . . . . . . . . . . . . . . . . . . . . . . . . . . . . . . . . . . . . . . . . . . . . 46

LSU Center for Energy Studies                                                                                                                                            3
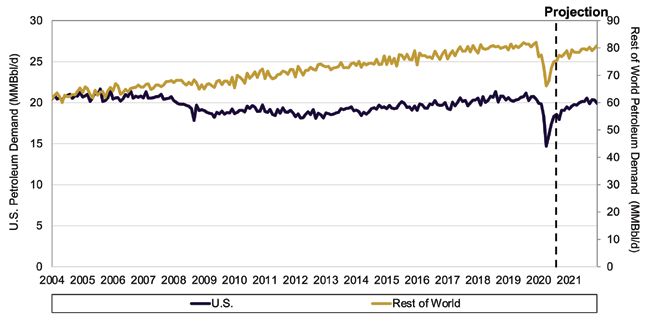
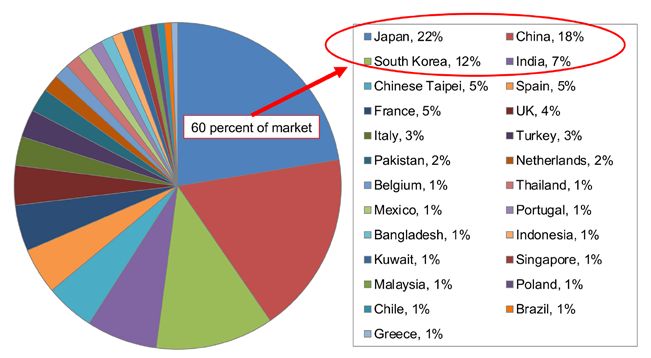
Figure 36: LNG imports and market share by country, 2019. . . . . . . . . . . . . . . . . . . . . . . . . . . . . . . . . . . . . . . . . 47
Figure 37: China’s natural gas demand . . . . . . . . . . . . . . . . . . . . . . . . . . . . . . . . . . . . . . . . . . . . . . . . . . . . . . . . . . 48
Figure 38: World energy prices. . . . . . . . . . . . . . . . . . . . . . . . . . . . . . . . . . . . . . . . . . . . . . . . . . . . . . . . . . . . . . . . . 49
Figure 39: Japan spot LNG price. . . . . . . . . . . . . . . . . . . . . . . . . . . . . . . . . . . . . . . . . . . . . . . . . . . . . . . . . . . . . . . . 50
Figure 40: Gulf Coast exports to China. . . . . . . . . . . . . . . . . . . . . . . . . . . . . . . . . . . . . . . . . . . . . . . . . . . . . . . . . . . 51
Figure 41: U.S. and world petroleum demand. . . . . . . . . . . . . . . . . . . . . . . . . . . . . . . . . . . . . . . . . . . . . . . . . . . . . 52
Figure 42: U.S. crude oil exports. . . . . . . . . . . . . . . . . . . . . . . . . . . . . . . . . . . . . . . . . . . . . . . . . . . . . . . . . . . . . . . . 53
Figure 43: Existing and proposed U.S. LNG capacity development. . . . . . . . . . . . . . . . . . . . . . . . . . . . . . . . . . . 54
Figure 44: Revised existing and proposed U.S. LNG capacity development . . . . . . . . . . . . . . . . . . . . . . . . . . . 54
Figure 45: Louisiana upstream employment forecast . . . . . . . . . . . . . . . . . . . . . . . . . . . . . . . . . . . . . . . . . . . . . . 59
Figure 46: Texas upstream employment forecast. . . . . . . . . . . . . . . . . . . . . . . . . . . . . . . . . . . . . . . . . . . . . . . . . . 60
Figure 47: Louisiana refining and Chemical manufacturing employment forecast. . . . . . . . . . . . . . . . . . . . . . 61
Figure 48: Texas refining and chemical manufacturing employment forecast. . . . . . . . . . . . . . . . . . . . . . . . . . 61

List of Tables
Table 1: China import commitments in perspective. Phase I China Trade Deal. . . . . . . . . . . . . . . . . . . . . . . . .  7
Table 2: COVID-19 impacts on U.S. crude oil and natural gas production . . . . . . . . . . . . . . . . . . . . . . . . . . . . . 12
Table 3: Oil prices and relevant events. . . . . . . . . . . . . . . . . . . . . . . . . . . . . . . . . . . . . . . . . . . . . . . . . . . . . . . . . . . 17
Table 4: GOM energy manufacturing investment, GCEO comparison. . . . . . . . . . . . . . . . . . . . . . . . . . . . . . . . . 33
Table 5: Chemical industry, revised capex. . . . . . . . . . . . . . . . . . . . . . . . . . . . . . . . . . . . . . . . . . . . . . . . . . . . . . . . 33
Table 6: Total GOM investment, all project announcements. . . . . . . . . . . . . . . . . . . . . . . . . . . . . . . . . . . . . . . . . 38
Table 7: Total GOM investment, new baseline outlook . . . . . . . . . . . . . . . . . . . . . . . . . . . . . . . . . . . . . . . . . . . . . 38
Table 8: Electricity demand. . . . . . . . . . . . . . . . . . . . . . . . . . . . . . . . . . . . . . . . . . . . . . . . . . . . . . . . . . . . . . . . . . . . . 56
Table 9: Transportation fuel demand . . . . . . . . . . . . . . . . . . . . . . . . . . . . . . . . . . . . . . . . . . . . . . . . . . . . . . . . . . . . 57
Table 10: Domestic natural gas demand. . . . . . . . . . . . . . . . . . . . . . . . . . . . . . . . . . . . . . . . . . . . . . . . . . . . . . . . . . 58

4                                                                                                                                           Gulf Coast Energy Outlook 2021
1. Introduction
The annual GCEO is designed to provide stakeholders with a “one-stop” overview of the current
trends and outlook for the region’s energy industry and its various sectors. The GCEO is a work prod-
uct of Louisiana State University’s Center for Energy Studies and has been sponsored by several
companies and institutions looking to assist LSU in disseminating timely information and analysis
impacting the region’s economy and citizenry. The GCEO is also supported by the Center’s general
state appropriation, which represents a generous commitment by the Louisiana Legislature to support
energy-related research. It would be difficult to produce the GCEO without both sources of support.
Unless stated otherwise, the “Gulf Coast” region specifically refers to the states of Texas, Louisiana,
Mississippi, and Alabama. In some instances, the U.S. Department of Energy reporting conventions
will require references to data collected at the Petroleum Administration Defense District 3 (PADD
3) level, which includes Arkansas and New Mexico, in addition to the Gulf Coast states. Employment
forecasts will focus on Louisiana and Texas. Where not specified, the forecast horizon extends to the
end of 2024, or approximately three years.
The remainder of this introduction will highlight the big picture considerations and assumptions made
in subsequent analysis and forecasting.

1.1       COVID-19
Forecasting is difficult under normal circumstances; this year there is perhaps more uncertainty than
ever. In January of 2020, the U.S. economy was in its 126th month of economic growth, the longest
in modern history. Demand growth in Asia, the source of demand for energy products produced in
the Gulf Coast, was strong and, while slowing was expected to continue, was well above growth
rates in the developed world. President Trump and Chinese President Xi Jingping had just signed
Phase I of a trade deal, at least temporarily alleviating some of the source of risk highlighted in last
year’s GCEO. Oil prices were about $60 per barrel, a level that is a good balance and high enough
to support continued exploration and production and sustain a profitable refining sector. According
to last year’s GCEO, there were more than $190 billion of investment announcements in the energy
sector, and a number of important pipeline investments were underway to deliver the hydrocarbons
to the Gulf Coast for processing and delivery all over the world. The 2020 GCEO was forecasting
that, barring an unforeseen external shock, oil and natural gas production was projected to continue
to set records in coming years, and employment in the refining and chemical manufacturing sector
would experience growth.
In March of 2020, everything changed rapidly when the COVID-19 pandemic essentially shut down
the global economy. Oil markets were rocked by (1) a historic decline in demand due to COVID-19
and (2) a failed OPEC+ deal to curtail output and sustain prices. These combined factors created
the perfect storm for a complete collapse in energy prices to a low that at one point touched on an
unheard-of negative daily price for West Texas Intermediate (WTI) oil. U.S. production immediately fell
in response to these price signals from a record high of 12.86 million barrels per day in November of
2019 to 10.0 million barrels per day by May 2020. This is an over 20 percent drop in U.S. oil produc-
tion in just seven months—the largest percent change in any seven-month period in modern history.

LSU Center for Energy Studies                                                                         5
The question GCEO will be addressing this year is, where does the energy industry go from here? How
have companies responded operationally to a global pandemic? How quickly will the global, national
and regional economies recover? The speed of recovery will play a major role in how quickly demand
for transportation—and therefore energy products—will rebound. But to further complicate matters,
has the COVID-19 pandemic also changed long-term behavior? Therefore, while specific long-term
forecasts are not presented, the GCEO will also be tasked with considering whether the fundamental
relationships between energy consumption and economic activity has changed more broadly.
            For purposes of economic modeling, COVID-19 is assumed to attenuate globally and
            the world is slowly able to return to some level of normalcy over the next two years.
            Another wave of COVID-19 leading to cascading shutdowns would certainly make
            our forecasts less optimistic. In the long run, transportation demand will rebound,
            but not to its pre-COVID-19 trajectory, especially in the developed world.

1.2            Phase One of China Trade Deal Reached
Perhaps the largest risk to the Gulf Coast energy industry, and in particular to the continued indus-
trial construction, highlighted in last year’s GCEO, was the trade negotiations with China. For the past
two years, the GCEO has articulated the significant economic and energy market changes occur-
ring along the Gulf Coast. Increasingly, the region is transforming itself into an exporter of energy
and chemical products (that are derived from hydrocarbons), as well as one that will likely serve as a
transfer point or hub for global energy transactions. The U.S. for instance, was exporting about five
million barrels per day pre-COVID-19 of petroleum products, most of which were leaving a Gulf Coast
port. Last year, the 2020 GCEO highlighted how the escalating trade disputes with China, the world’s
most populous country and second largest economy, had resulted in increased tariffs on natural gas
and petroleum products.
Specifically, in response to U.S. tariffs meant to bring China to the negotiating table, on June 1, 2019,
China increased its tariff on natural gas coming from the U.S. in the form of liquefied natural gas (LNG)
from 10 percent to 25 percent. The 2020 GCEO reported that at least one announced LNG project
had been postponed, with others seriously considering their development potential if these tariffs
continued. Estimates suggest that in total, the U.S. applied $550 billion in tariffs exclusively to China,
with China responding in applying $185 billion in tariffs exclusively to U.S. goods.1
After months of negotiations, in January of 2020, the U.S. and China signed Phase 1 of a trade deal
that went into effect on February 14.2 The 91-page agreement includes six chapters covering topics
such as intellectual property, technology transfer, trade in food and agricultural, financial services,
and macroeconomic policies.

1
    Dean Shira & Associates. China Briefing. The US-China Trade War: A Timeline. < https://www.china-briefing.com/news/the-us-china-trade-war-a-timeline/> Accessed September 2020.
2
    Economic and trade agreement between the government of the United States of America and the government of the People’s Republic of China.

6                                                                                                                                             Gulf Coast Energy Outlook 2021
Table 1: China import commitments in perspective. Phase I China Trade Deal

                                          Manufacturing                  Agriculture                    Energy                       Other                        Total

                      Panel A: U.S. Exports (Billions USD)*

                                                    (1)                         (2)                         (3)                         (4)                         (5)

                      China

                               2017               $50.4                       $20.9                          $7.6                       $51.0                     $130.0
                              2018                $49.0                        $10.4                         $8.0                      $52.8                      $120.3
                              2019                $49.3                        $14.8                         $3.6                      $38.8                      $106.4

                      World

                               2017              $627.8                      $153.5                        $59.2                     $706.7                     $1,547.2
                              2018              $648.3                       $155.5                        $95.6                     $766.3                     $1,665.7
                              2019              $646.5                        $151.3                     $108.4                      $736.9                    $1,643.2

                      Panel B: Phase I China Import Increase Committment (Billions USD)**

                             2020                 $32.9                        $12.5                       $18.5                        $12.8                       $76.7
                              2021                $44.8                        $19.5                       $33.9                        $25.1                     $123.3

                      Panel C: China Import Commitment Percent 2017-2019 Exports***

                      China

                             2020                 66.3%                        81.2%                    288.8%                        26.9%                        64.5%
                              2021                90.3%                      126.7%                      529.1%                       52.8%                       103.7%

                      World

                             2020                    5.1%                        8.1%                       21.1%                         1.7%                       4.7%
                              2021                  7.0%                       12.7%                      38.6%                          3.4%                        7.6%

                      Sources: * U.S. Census Bureau: Economic Indicators Division USA Trade Online. ** China Phase I Trade Deal. Chapter 6.
                      ***Authors' calculatons

As summarized in Table 1, Chapter 6 of the Phase I trade deal focused on expanding trade and
perhaps has received the most attention. It requires that in 2020 and 2021, China will increase
purchases and imports, into China from the United States, of manufactured goods, agricultural prod-
ucts, energy products and services, exceeding the 2017 baseline amount by no less than $200
billion. A specific carve-out of $52.4 billion for energy products is included.3
To put the energy carve-out into perspective, this is equivalent to 21 percent of the U.S.’s historical (as
measured by the average of 2017-19) total energy exports in 2020, and 38 percent in 2021. These
are large numbers, and China is currently not on track to meet these commitments.4 There is signif-
icant uncertainty as to what might happen in these trade talks if China does indeed not meet these
commitments. At the time that this document is being finalized, the U.S. is still waiting for the result of
3
     Specifically, $18.5 billion in 2020 and $33.9 billion in 2021.
4
    The Peterson Institute for International Economics (PIIE) is actively tracking China’s purchases of U.S. goods. At the time of this writing, China is significantly below its agreed targets in all
    areas, including agriculture, manufactured goods, and energy. < https://www.piie.com/research/piie-charts/us-china-phase-one-tracker-chinas-purchases-us-goods>

LSU Center for Energy Studies                                                                                                                                                                       7
the recent presidential election. The outcome could have significant implications for how and if these
negotiations continue. Would a Biden presidency revert to a pre-Trump trade policy with China?
Would an emboldened Trump, with an election behind him, increase pressure on China? Is another
round of tariffs to come? Or perhaps negotiations could be successful in reducing trade barriers with-
out imposing addition tariffs?
          For purposes of economic modeling, the GCEO will work under the assumption that
          trade talks with China do not deteriorate, that new tariffs will not be implemented,
          and that these export commitments on net do not impact demand for Gulf Coast
          energy products.

1.3          2020 Hurricane Season
As if a global pandemic were not enough, 12 major hurricanes were recorded, with five reaching
Category 3 status or higher. For the first time in recorded history, five named storms made landfall in
Louisiana. Most notably, on August 15, Hurricane Laura, the strongest hurricane on record in the state’s
history, made landfall in Cameron Parish, Louisiana. Hurricane Laura made landfall as a Category 4 and
caused billions of dollars of damage across many sectors of the economy, including damage to elec-
tricity infrastructure, agricultural products such as forestry5, and of course damage to residential homes
and local businesses. Fewer than three weeks later, Hurricane Sally made landfall as a Category 2 hurri-
cane near Gulf Shores, Alabama. Hurricane Delta made landfall on October 9 as a Category 2 also near
Lake Charles. Finally, on October 28, Hurricane Zeta made landfall in southeast Louisiana.
Perhaps most notably for our purposes, the Lake Charles area in southwest Louisiana has been
ground zero for billions in infrastructural investments in the refining, chemical manufacturing, and
export of natural gas in the form of liquefied natural gas. In fact, over 40 percent of the energy infra-
structure investment made in Louisiana over the past decade has been in the Lake Charles area.
Workers in the energy processing and export industry in the region have confirmed that the industry
was incredibly resilient through these hurricanes. Perhaps most notably, news reports have confirmed
that neither Cheniere’s Sabine Pass nor the Cameron LNG facility experienced major damage during
Hurricane Laura and are now back up and running.6 Industry insiders reported that this was an important
litmus test for other LNG export facilities that are weighing the risk of hurricane damage. The most nota-
ble damage to an individual plant was a fire at BioLab in Westlake Chemical’s Lake Charles Complex.
In terms of electricity infrastructure, while final numbers are not yet released, Entergy alone has
reported $1.4 billion in damage associated with Laura, with the plurality of this damage on trans-
mission infrastructure. Entergy reported 1,285 transmission structures destroyed, with another 492
damaged, and 297 substations out.7 Both SWEPCO and Cleco have also reported significant damage,
but at the time of this writing specific public damage estimates have not yet been released. At the
peak over 600,000 customers had power outages.8

5
  According to the LSU Ag Center, approximately $1.1 billion dollars of timber was lost due to Hurricane Laura.
6
  Sabine pass was up and running more quickly than Cameron LNG due to quicker access to both electricity and natural gas supply. Nonetheless, Cameron LNG is now up and running
  with no permanent damage of which we are aware. Source: LNG exports resume for Sabine Pass and Cameron terminals as another hurricane approaches. U.S. Energy Information
  Administration. Today in Energy. October 8, 2020.
7
  Hurricane Laura Restoration Update – 9/9/20 @9:30 AM. Entergy Newsroom.
8
  Source: U.S. Department of Energy. Office of Cybersecurity, Energy Security, and Energy Response. Hurricane Sally & Laura Situation Reports.

8                                                                                                                                       Gulf Coast Energy Outlook 2021
For purposes of economic modeling, effects of the 2020 hurricanes are short lived and have not materially affected companies’ decisions to make infrastructural investments in the Gulf Coast region. Electricity infrastructure has largely been restored. 1.4 What a Biden Presidency Could Mean for the Energy Industry At the time of this writing, the U.S. has undergone a presidential election, but the final outcome is not yet known. This election was particularly unique in that presidential candidate Biden made history as the first nominee for president from a major party in modern U.S. history to propose the ban of new oil and gas permitting on public lands and waters.9 Further, he proposed modifying royalties to account for climate costs. The Gulf Coast region will perhaps be the most impacted if these policies are enacted. What could this mean for the industry? Consider the two regulatory steps taken to drill for oil and gas in federal waters in the Gulf of Mexico. Leasing: When a company wants to drill for oil or natural gas in the federal waters of the Gulf of Mexico, it must first obtain a lease. Federal waters are beyond three miles from the Louisiana, Mississippi, and Alabama shorelines and nine miles from the Texas shoreline. The Bureau of Ocean Energy Management (BOEM), part of the U.S. Department of the Interior, conducts lease sales. Companies bid on lease tracts and the winner of those bids is awarded the lease in exchange for a payment that is determined by the result of the auction. This payment is called a “bonus” payment. Permitting: Once a lease is obtained, the private company will next have to obtain a permit to drill a well from the Bureau of Safety and Environmental Enforcement (BSEE). The permit to drill gives the operator approval to begin the process of drilling the well and requires the operator to show that they will meet environmental and safety regulations. Once the well is drilled and oil and natural gas is sold to the market, the operator will then pay the federal government royalties. According to Joe Biden’s plan for climate change, there are two changes to this process. First, his plan calls to ban new oil and gas permitting on public lands and waters, which would include the Gulf of Mexico. Second, the plan calls for the modification of royalties to account for climate costs. For perspective, royalties currently range from about 12 to 20 percent, depending on a number of factors. While modification of royalties could impact the economics of offshore drilling, because compa- nies bid based on the expected economics, this would likely cost the federal government money in up-front bonus payments. The net effect of this is an empirical question that the GCEO will not address directly. But, the effect of an outright ban on new permitting would have a clear negative effect on the offshore industry. A few things would likely occur if this policy were enacted as stated. First, there would likely be some drilling over the next several years, as companies that have already received permits would presumably be able to drill these wells. But nonetheless, this would slow drilling. A recent Wood Mackenzie report considers four scenarios of what the Biden policy could entail. It is simply not possi- ble to know which, if any, of these scenarios will actually be enacted.10 9 The Biden Plan for a Clean Energy Revolution and Environmental Justice. 10 What could a Biden administration mean for the U.S. GoM and Alaska? July 2020. Wood Mackenzie. LSU Center for Energy Studies 9
Therefore, for modeling purposes, GCEO will assume that a Biden policy of banning permits
offshore will not go into effect, at least over the forecast horizon.
Incorporating such information into the forecast modeling would require specifics of the policy
change and timing of these changes. Consistent with forecasting methodology in prior year GCEOs,
proposed policy changes will not be incorporated into forecasts until the policy change is actu-
ally enacted. In other words, a business-as-usual assumption with regard to offshore leasing will be
considered. In the event that a ban is swiftly implemented, forecasts are likely to be too optimistic.

2. Crude Oil and Natural Gas Production and Prices
2.1         Recent Market Trends: Production
The Shale revolution started to manifest itself in U.S. natural gas supplies in 2005 and has dramat-
ically changed the fortunes of U.S. energy companies across almost every sector. That revolution
continues in both crude oil and natural gas supplies, both of which continued to march upwards,
breaking production records from decades long since passed, until growth was abruptly interrupted
with the outbreak of COVID-19 globally.
Figure 1 shows that 2019 marked the highest level of U.S. crude oil and natural gas production on
record, averaging 12.3 million barrels per day (MMBbl/d) of oil and 112 billion cubic feet per day (Bcf/d)
of natural gas. As we will show later, a large share of this U.S. crude oil and natural gas production
increase comes from the Gulf Coast region. But, also highlighted in Figure 1, both oil and natural gas
production declined precipitously in response to COVID-19.

Figure 1: U.S. crude oil and natural gas production

                                            14                                                                                              140

                                            12                                                                                              120
                                                                                                                                                  Natural Gas Production (Bcf/d)
               Crude Production (MMBbl/d)

                                            10                                                                                              100

                                             8                                                                                              80

                                             6                                                                                              60

                                             4                                                                                              40

                                             2                                                                                              20
                                             1980   1985   1990      1995       2000      2005          2010          2015           2020
                                                                                 Year

                                                                  Crude Production             Gas Production

Source: U.S. Energy Information Administration. Petroleum & Other Liquids. Crude Oil Production. Natural Gas Gross Withdrawals.

10                                                                                                                                Gulf Coast Energy Outlook 2021
For perspective, Table 2 shows U.S. crude oil and natural gas production alongside the percent change from the same month in the prior year for each month post the COVID-19-induced slow- down. In March, U.S. oil production was at 12.7 MMBbl/d, or 6.7 percent above the level of production in March of 2019. By May of 2020, production fell to 10.0 MMBbl/d, a drop of 17.6 percent relative to the May of 2019.11 U.S. oil production reached its bottom in May, and as of July has rebounded to 11 MMBbl/d, but still 7.1 percent below production in the same month the prior year. Recently released August data shows that production once again fell in August to 10.6 MMBbl/d, almost 15 percent below the prior year’s August. On an annualized basis, U.S. oil production is currently down 4 percent from 2019. Natural gas production, also shown in Table 2, experienced a similar pattern. In March of 2020, U.S. natural gas production was at 116.9 Bcf/d, or 5 percent above its March 2019 level. Natural gas production bottomed out in June at 106.0 Bcf/d, or 2.5 percent below the same month in the prior year. In the most recent month, August, production is 2.2 percent below its August 2019 level. On an annualized basis, natural gas production is still up 1.5 percent relative to 2019. Thus, while both oil and natural gas production have been impacted, COVID-19’s impact on oil has been larger on a percentage basis. In preparation for the GCEO, one of the questions asked to many across the upstream industry was the extent to which these production reductions were due to (1) operational issues directly related to safely operating with COVID-19 and/or (2) market price and demand reductions. In terms of operational response, industry representatives have told us that rapid testing has been key, especially for offshore oil operations, where workers are confined to relatively close quar- ters while offshore. Companies servicing offshore operations revealed they would test workers for COVID-19 before going offshore, temporarily quarantine while waiting for test results, and then keep workers offshore for 28 days, in lieu of the standard 14 days.12 With proper planning, test results could be received within approximately three to four hours. With these precautions in place, we are aware of no offshore platforms that were shut down due to COVID-19. As compared to offshore operations, onshore oil and gas operations by their very nature have been able to implement social distancing more easily. Thus, GCEO will take the broad view that reduc- tions in oil and natural gas production have been, in essence entirely, due to a demand shock and the resulting price reduction. Any effects of COVID-19 on the operations themselves, while costly for companies financially, have been manageable logistically. Production numbers monthly averages. Where not specified, all references to production will be monthly averages. 11 Instead of working 14 days on with 14 days off, now workers are working 28 days on with the subsequent 28 days off. 12 LSU Center for Energy Studies 11
Table 2: COVID-19 impacts on U.S. crude oil and natural gas production

                                           United States                                     Gulf Coast

                                                          Percent                                     Percent           Gulf Coast
                                    Prod.                 Change                  Prod.               Change             % of US.

       Panel A: Crude Oil (MMBbl/d)

       March                            12.7                  6.7%                     7.5                8.0%             59.2%

       April                           12.0                    -1.0                    7.2                  1.8            60.2%

       May                             10.0                   -17.6                    6.1                 -13.7            61.1%

       June                            10.4                   -13.6                   6.3                 -10.5            60.6%

       July                             11.0                    -7.1                  6.5                  -3.7            59.5%

       August                          10.6                   -14.9                   6.0                 -18.4            56.9%

       Year to Date                     11.5                -4.0%                     6.9                 -2.3%            59.4%

       Panel B: Natural Gas (Bcf/d)

       March                          116.9                  5.0%                    41.9                 5.0%             35.9%

       April                           110.7                    1.4                  39.4                   1.2            35.6%

       May                            108.2                    -3.8                  37.9                   -7.1           35.0%

       June                          106.0                    -2.5                   37.5                  -5.5            35.3%

       July                            111.3                  -0.5                   39.0                  -4.7             35.1%

       August                          111.2                  -2.2                   38.7                  -8.5            34.9%

       Year to Date                    111.5                  1.5%                   39.5                 -0.6%            35.4%

       Source: U.S. Energy Information Adminstration. Petroleum & Other Liquids. Crude Oil
       Production. Natural Gas Gross Withdrawals.
       Note: Percent change represents a percent change from the same month in the prior year

Figure 2 underscores the drilling reduction associated with the global pandemic. In December, Baker
Hughes reported 804 rigs running in the U.S. Consistent with what was reported and forecasted in
last year’s GCEO, rig counts were declining modestly throughout 2019 and through the pre-COVID-19
beginning of 2020. But what was not predicted in last year’s GCEO was the precipitous drop asso-
ciated with the COVID-19 pandemic. In August of 2020, the most recent month of data available at
the time of this writing, rig counts as reported by Baker Hughes are at 250, a 73 percent decline rela-
tive to August of 2019. Unsurprisingly, this rig count drop has mirrored the drop in the West Texas
Intermediate Spot price. Notably, though, while the oil price has rebounded from its low of $17 in
April, rig counts have continued to decline each month.

12                                                                                                                 Gulf Coast Energy Outlook 2021
Figure 2: U.S. crude oil prices and rig count
2,000 $150
1,600 $120
WTI Spot Price ($/Bbl)
1200 $90
Rig Count
800 $60
400 $30
0 $0
2008 2010 2012 2014 2016 2018 2020
Year
Rig Counts WTI Spot Price
Source: U.S. Energy Information Administration. West Texas Intermediate Spot Price. Baker Hughes Rotary Rig Counts.
Figure 3 illustrates the rig activity in the seven major U.S. shale plays, as defined by EIA’s Drilling
Productivity Reports. As reported in last year’s GCEO, the Permian basin has been the predominant
shale play in the U.S., accounting for approximately 46 percent of the rig counts in the U.S. in 2019.
But the Permian basin has also seen the largest reduction in rig counts, losing almost 315 rigs (72
percent) in August of 2020 compared to August of 2019. Remarkably, over half of the reduction in rig
counts nationally have come from the Permian Basin. While rig counts have likely reached near their
bottom, GCEO is not anticipating a significant increase in drilling activity over the next year.
Figure 3: Rig counts in major shale basins
1,500
1,200
900
Rig Count
600
300
0
2008 2010 2012 2014 2016 2018 2020
Year
Permian Niobrara Haynesville Eagle Ford
Bakken Appalachia Anadarko
Source: U.S. Energy Information Administration. Drilling Productivity Reports
LSU Center for Energy Studies 132.2 Recent Regional Trends: Crude Oil and Natural Gas Production
As a corollary to Figure 1, Figure 4 illustrate regional (PADD 3) crude oil and natural gas production in
response to COVID-19. Referring to Table 2, a comparison of total U.S. oil and natural gas production
changes in response to COVID-19 to the Gulf Coast region is provided. A few notable observations
are as follows.
Figure 4: Gulf Coast crude oil and natural gas production
10 50
8 40
Oil Production (MMBbl/d)
Gas Production (Bcf/d)
6 30
4 20
2 10
0 0
2006 2008 2010 2012 2014 2016 2018 2020
Year
Crude Oil Natural Gas
Source: U.S. Energy Information Administration. Petroleum & Other Liquids. Crude Oil Production. Natural Gas Gross Withdrawals.
First, examining oil production, the Gulf Coast region, on a percentage basis, experienced both
a slower and shallower response compared to the U.S. percentage change. While Gulf Coast oil
production declined between March and April, the region’s production was still 1.8 percent above
April of 2019. By May of 2020, Gulf Coast oil production was down 13.7 percent from the prior May,
compared to 17.6 percent for the entire U.S. As a result, the share of U.S. oil production from the Gulf
Coast region increased from approximately 59.2 percent to 61.1 percent in just two months during the
pandemic. In the most recent month of data, August, Gulf Coast crude oil production was down 18.4
percent from the prior August, compared to 14.9 percent for the U.S. On an annualized basis, Gulf
Coast crude oil production is down 2.3 percent compared to 2019.
Interestingly, comparison of natural gas production nationally to the Gulf Coast region reveals a different
story. Gulf Coast natural gas production declined by 7.1 percent in May of 2020 relative to May of 2019,
compared to 3.8 percent for the U.S. In the most recent month of data available, August, Gulf Coast
natural gas production is still 8.5 percent below August 2019 production, compared to 2.2 percent for
the U.S. as a whole. On an annualized basis, Gulf Coast natural gas production has been down 0.6
percent compared to up 1.5 percent nationally. Notably, the winter heating season has yet to come.
14 Gulf Coast Energy Outlook 20212.3 Recent Trends: Commodity Pricing
Figure 5, like prior year GCEOs, highlights three different natural gas pricing epochs: (1) the period
spanning the 1990s; (2) the period starting with natural gas supply/pricing crisis of the 2000s; and
(3) post-recession period to current. These epochs differ in both the level of prices and the variabil-
ity in prices.13 Unsurprisingly, the effect of COVID-19 has been prices that are on the lower range of
even this lower price epoch. As will be highlighted throughout the report, GCEO believes that as the
COVID-19 pandemic gradually subsides, natural gas prices will continue within this third epoch of
relatively low prices and low variability.
Figure 5: Historical inflation-adjusted natural gas price
$18
$15
Henry Hub Price - ($/MMBtu)
$12
$9
$6
$3
$0
1993 1996 1999 2002 2005 2008 2011 2014 2017 2020
Year
Henry Hub Spot Price Average Price
Plus 1 SD Minus 1 SD
: U.S. Energy Information Administration. Henry Hub Natural Gas Spot Price. Inflation adjustment based on U.S. Consumer Price Index sources from the Bureau of Labor
Statistics.
Figure 6 provides a comparable analysis for crude oil pricing, underscoring again the dramatically
reduced volatility that current period prices are experiencing relative to past pricing epochs. Pre
COVID-19, oil prices were in the middle of the range of this third epoch and consistent with the
outlook provided in last year’s GCEO. In response to COVID-19, oil prices plummeted precipitously,
bottoming out at a monthly average of less than $17 per barrel in April.
Variability is shown as the standard deviation in the change in average monthly prices.
13
LSU Center for Energy Studies 15Figure 6: Historic inflation-adjusted oil prices
$160
$140
$120
WTI Price - ($/Bbl)
$100
$80
$60
$40
$20
$0
1988 1992 1996 2000 2004 2008 2012 2016 2020
Year
WTI Spot Price Average Price
Plus 1 SD Minus 1 SD
Source: U.S. Energy Information Administration. West Texas Intermediate Spot Price. Inflation adjustment based on U.S. Consumer Price Index sources from the Bureau
of Labor Statistics.
2.3.1 COVID-19 impacts on oil prices
On April 20, 2020, the WTI spot prices closed at -36.98 per barrel. A timeline of relevant dates and
events describing oil markets since the beginning of 2020 is shown in Table 3. Two pieces of infor-
mation are given for each date; (1) the relevant event; and (2) the West Texas Intermediate (WTI) spot
price per barrel as reported by the EIA on that date. As will be shown, it was a convergence of both
supply (OPEC) and demand (COVID-19) shocks and unfortunate timing that created such unprece-
dented short-lived price swings.
16 Gulf Coast Energy Outlook 2021Table 3: Oil prices and relevant events
Date Event WTI Price
Thursday, Jan. 2 First trading day of 2020 $61.17
Wednesday, March 4 The day before OEPC+ meeting $46.78
Monday, March, 9 OPEC+ fails to reach agreement on March 5-6 meeting $31.05
COVID-19 declared a pandemic by World Health Organization. U.S.
Wednesday, March 11 $33.13
Presidential Proclamation 9993 bans entry into US from over 25 countries
Friday, March 13 National emergency declared in the United States $31.72
Saturday, March 14 Presidential Proclamation 9994: Bans entry from Britain or Ireland. $28.96
Thursday, April 9 OPEC+ agrees to 10mbd production cuts to begin on May 1st $22.90
Monday, April 20 Day before May WTI NYMEX close -$36.98
Friday, May 1 OPEC+ production cuts begin $19.72
Monday May 18 WTI reaches $30 for first time since crash $31.83
Monday, June 22 WTI reaches $40 for first time since crash $40.60
Source: Authors’ research. All dates in 2020. For weekend dates, the WTI prices on the following Monday is listed.
On the first trading day of the year, oil was trading at $61 per barrel; a level that was about $10 per barrel
higher than what futures markets were forecasting at the time of the GCEO’s release last year (September
2019). Supply and demand were approximately in balance and futures markets were anticipating prices
to remain steady into the foreseeable future. A growing global economy and other generally bullish
factors at the time were moving oil demand on a steady upward trajectory. U.S. oil production was at an
all-time high of 12.8 million barrels per day in December of 2019. Market signals were displaying confi-
dence that production would be capable of meeting the demand growth at current prices.
But beginning in the first two months of 2020, concerns of COVID-19 spreading to countries outside
of China began to translate into forecasts that oil demand would weaken, putting downward pressure
on prices. By March 4, the day before an OPEC+ meeting the price of oil was at $47 per barrel. While
lower than the onset of the year, supply and demand were approximately in balance at this price point.
In response to the pandemic-induced global slowdown, OPEC+ was considering output reductions.
Specifically, Saudi Arabia was recommending reducing output by 1.5 million barrels per day with the
hopes of raising prices closer to those observed in the earlier part of the year. But Russia was not
on board—and by the time the meeting ended on Friday March 6, there was no agreement in place.
Upon a deal not materializing, by April 1, all OPEC countries (and Russia) were free to produce as
much oil as they chose. The following Monday (March 9), oil prices plummeted to $31 per barrel, a
reduction of 33 percent.
Further exacerbating these factors, the COVID-19 pandemic began to spread rapidly. On March 11,
the World Health Organization (WHO) declared COVID-19 as a pandemic. On the same day, President
LSU Center for Energy Studies 17Trump signed a presidential proclamation (9993) banning entry into the U.S. from more than 25 countries. On March 13, a national emergency was declared in the U.S., and the next day (March 14) President Trump signed another presidential proclamation (9994) banning entry into the United States from Britain and Ireland. Over the next few weeks, individual U.S. states and many countries around the world began implementing stay-at-home orders and other similar policies, significantly reducing economic activity and therefore transportation. For perspective, on March 22, Governor John Bel Edwards issued a stay-at-home order for Louisiana. By the time Louisiana’s stay-at-home order was implemented, oil prices were already below $25 per barrel. OPEC was under enormous pressure to make a deal happen; what started with a price drop in response to a failed OPEC agreement quickly spiraled out of control as the global pandemic began to rapidly accelerate. So, on April 9, just one month after the failed agreement, OPEC agreed to historic production cuts by an unprecedented 10 million barrels per day. Recall, the initial agreement that fell through just one month earlier was for just 1.5 million barrels per day. But in some ways, the damage was already done. As global demand received a sudden and dramatic reduction, oil produc- tion cuts could not happen fast enough, and on April 20, the WTI NYMEX futures closed at a negative price for the first time in history: -$37 per barrel. It is important to note that this negative price was a hub price in Cushing, Oklahoma, where physical deliverability was required, and a relatively small volume of oil traded at this price. For comparison, the Brent price that does not have a physical deliverability requirement bottomed at about $9 per barrel. This is more indicative of the actual prices received at the wellhead. Nonetheless, these low prices were unprecedented. By May 1, the OPEC+ production cuts hit the market (that were agreed to in the April meeting) and by that time prices had risen to about $20 per barrel. By mid-May prices exceeded $30 per barrel for the first time since the crash, and by mid-June exceeded the $40 threshold, where prices have more or less held steady since. 2.4 Outlook: Commodity Pricing Futures markets are indicating upward pressure on both crude oil and natural gas prices as global demand rebounds from COVID-19, followed by years of relatively flat prices in real terms (i.e. infla- tion adjusted) over the remainder of the forecast horizon. Figure 7 and Figure 8 show current futures prices for oil and natural gas alongside the futures prices from the last two year’s GCEOs. Examination of not only the current futures price but also how expectation has changed is instructive for under- standing market trends. Figure 7 shows the crude oil futures prices. For the past two years, GCEO has shown oil futures in backwardation—meaning that prices were expected to fall in the future. And in both years, the futures markets were successful in predicting declining prices, but in both instances the magnitude of decline was larger than what markets were anticipating. In contrast, today the futures market for oil is in contango—meaning that prices are expected to increase in the future. This is logical, given the precipitous demand reduction for transportation, and therefore oil, in light of the global pandemic. As transportation returns (and therefore demand), prices are expected to increase. What is perhaps more interesting is that prices are not anticipated to reach pre-COVID-19 predicted levels until 2030. 18 Gulf Coast Energy Outlook 2021
In other words, futures markets are anticipating that there will be enough supply to meet global
demand at between $40 and $55 per barrel for the next decade.

Figure 7: Crude oil price outlook

                                         $100

                                          $90

                                          $80
                WTI Spot Price ($/Bbl)

                                          $70

                                          $60

                                          $50

                                          $40

                                          $30

                                          $20

                                          $10

                                           $0
                                                15

                                                     16

                                                          17

                                                               18

                                                                      19

                                                                             20

                                                                                  21

                                                                                       22

                                                                                               23

                                                                                                    24

                                                                                                         25

                                                                                                                26

                                                                                                                     27

                                                                                                                            28

                                                                                                                                    29

                                                                                                                                           30
                                            20

                                                     20

                                                          20

                                                               20

                                                                    20

                                                                           20

                                                                                  20

                                                                                       20

                                                                                              20

                                                                                                    20

                                                                                                         20

                                                                                                                20

                                                                                                                     20

                                                                                                                           20

                                                                                                                                  20

                                                                                                                                          20
                                                                                            Date

                                                                    Historical          2018             2019             2020

Source: New York Mercantile Exchanged West Texas Intermediate Futures Price. Sources from S&P Global Market Intelligence. Most recent future price as of October
30, 2020.

Figure 8 shows the corollary for natural gas futures prices. Interestingly, while natural gas prices
are currently lower than markets predicted this time last year, natural gas prices are expected to be
higher in 2021 and 2022 than futures market suggested over the past two years. This is likely due to
at least two factors. First, as will be highlighted later, demand for natural gas has been less impacted
by COVID-19 than oil due to the simple fact that oil is primarily a transportation fuel. But second, on
the supply side, natural gas produced from oil wells (i.e. associated natural gas) production also has
declined. This is expected to put upward pressure on natural gas prices over the next two years.
Nonetheless, comparisons to Figure 5 reveal that natural gas prices are anticipated to continue in
the third low price and low variability epoch.
Although low oil and natural gas prices can create challenges for the upstream oil and gas extraction
and services sectors, the longer-term trajectory that these prices remain low is relatively good news
for the continued investment in refining, chemical manufacturing, and energy export in the Gulf Coast
region, as will be discussed in Section 5.

LSU Center for Energy Studies                                                                                                                                19
Figure 8: Natural gas price outlook
$6
$5
Henry Hub Spot Price ($/MMBtu)
$4
$3
$2
$1
$0
15
16
17
18
19
20
21
22
23
24
25
26
27
28
29
30
20
20
20
20
20
20
20
20
20
20
20
20
20
20
20
20
Date
Historical 2018 2019 2020
Source: New York Mercantile Exchanged Henry Hub Futures Price. Sources from S&P Global Market Intelligence. Most recent future price as of October 30, 2020.
2.5 Outlook: Crude Oil and Natural Gas Production
Next, Figure 9 and Figure 10 show oil and natural gas production forecasts based on the Enverus
ProdCast model. This is the same model used in production forecasting in past GCEOs. Prior year
GCEO readers will recall that each year U.S. oil and natural gas production have come in higher than
expected, and the ProdCast model has upgraded its production forecasts in response each year. In
last year’s GCEO, ProdCast was forecasting that total U.S. oil production would increase to approx-
imately 18 million barrels per day by 2030, with more than 12 million barrels a day coming from the
Gulf Coast region. Natural gas production was forecast to increase to 131 Bcf/d by 2030.
ProdCast’s outlook has changed dramatically this year in light of COVID-19. On an annualized basis,
U.S. oil production is anticipated to fall from its 2019 peak of 12.2 million barrels per day to 10.71 million
barrels per day in 2023. Thus, ProdCast is estimating that U.S. oil production will continue to decline
over the next approximately three years, as oil prices are anticipated to rebound slowly. Gulf Coast
oil production is anticipated to decline from its high of 8.0 million barrels per day in 2019 to 7.6 million
barrels per day in 2023. Thus, both U.S. and Gulf Coast oil production are anticipated to decline over
the next three years.
20 Gulf Coast Energy Outlook 2021Figure 9: Crude oil production forecast and Gulf Coast share of U.S. production
100% 14
12
Crude Oil Production (MMBbl/d)
80%
10
Share of Total(%)
60%
8
6
40%
4
20%
2
0% 0
06
08
10
12
14
16
18
20
22
24
26
28
30
20
20
20
20
20
20
20
20
20
20
20
20
20
Year
Share of Total Gulf Coast Total U.S. Rest of U.S.
Source: Enverus ProdCast
ProdCast has similar predictions for natural gas production, as shown in Figure 10. U.S. natural gas
production is anticipated to drop from its 2019 high annualized average of 102.9 Bcf/d to 93.5 Bcf/d
in 2023. Gulf Coast natural gas production is anticipated to decline from 44.3 Bcf/d to 40.4 Bcf/d over
this same time horizon (2019 to 2023). The ProdCast model production forecasts will be one of the
inputs used to forecast upstream oil and gas employment presented in Section 8.
Figure 10: Natural gas production forecast and Gulf Coast share of U.S. production
100% 125
80% 100
Natural Gas Production (Bcf/d)
Share of Total(%)
60% 75
40% 50
20% 25
0% 0
06
08
10
12
14
16
18
20
22
24
26
28
30
20
20
20
20
20
20
20
20
20
20
20
20
20
Year
Share of Total Gulf Coast Total U.S. Rest of U.S.
Source: Enverus ProdCast
LSU Center for Energy Studies 213 Pipeline Activity 3.1 Recent Trends Spatial differences in prices of hydrocarbons between areas is the market signal that drives pipeline development. If prices at “Point A” are higher than “Point B” at a given time, this provides an opportu- nity for a firm to move hydrocarbons from “Point A” to “Point B” and earn a profit doing so. Economists and traders call this phenomenon spatial arbitrage. As in prior year GCEOs, we highlight price differ- entials that represent pipeline constraints in both oil and natural gas markets. First, Figure 11 investigates the extent to which shipping constraints can explain the difference in prices between West Texas Intermediate (WTI) relative to Louisiana Light Sweet (LLS). Three vertical lines are drawn. The first vertical line is January of 2007, the date at which EIA began tracking crude oil and natural gas unconventional production in its Drilling Productivity Reports. The second line is May 2012, when the Seaway pipeline was reversed. Seaway initially moved crude from Freeport, Texas, on the Gulf Coast, to Cushing, Oklahoma, where WTI is priced. After Seaway was reversed, the pipe- line carried crude produced in the mid-continent to Gulf Coast refineries. This line divides a regime of increasing internal shipping constraints from a regime where those constraints were relieved. The third line is December 2015, when the U.S. government lifted the export ban that constrained the sale of crude oil overseas. The top Panel of Figure 11 shows the share of crude oil transported from PADD 2 and PADD 4 in the mid-continent (states in the Rocky Mountain and Midwestern regions) to PADD 3 in the Gulf Coast. From 1990 to 2007, almost all crude was transported from the mid-continent to the Gulf Coast via pipeline. Shippers used pipelines because rail and tanker were more expensive on the margin. During this time WTI and LLS moved in lockstep. In fact, by April 2012, more than half of the crude shipped from the mid-continent to the Gulf Coast went via high-cost barge and rail. Almost immedi- ately after the reversal of the Seaway pipeline, this trend stopped, and the share of crude shipped via pipeline began to recover. The LLS-WTI premium closely mirrors changes in the mode of transport over the 2007-2015 time period. This close correlation between shipping and prices can explain between half and three-quar- ters of the movement in relative prices. Empirical research has investigated whether changes in the composition of refining as captured by API gravity of crude inputs can explain these differentials.14 Evidence of shipping constraints, but not refining constraints, is observed. This analysis provides strong evidence that shipping constraints between the mid-continent and Gulf Coast were the culprit for the price discount. Last year, GCEO identified nine crude oil pipeline projects in the Gulf Coast region, either under construction or announced, that were expected to be completed by the end of 2021. Based on conversations with industry, pipelines that are currently not under construction likely will not begin construction, due to the precipitous drop in oil production associated with COVID-19. The good news is that at the time of this writing, crude markets are approx- imately in balance, with a slight premium for LLS. We anticipate this few dollar premium will persist over the forecast horizon and approximately 95 percent of crude shipped from the mid-continent Agerton & Upton, 2019. Decomposing Crude Price Differentials: Domestic Shipping Constraints or the Crude Oil Export Ban? The Energy Journal, Vol. 40, No. 3. 14 22 Gulf Coast Energy Outlook 2021
to the Gulf Coast will continue to come from pipelines. Due to the current oil price environment,
sudden increases in oil production from new areas creating the need for barge and rail shipments
are unlikely.

Figure 11: PADD 3 crude oil movements by transportation type

                                                             PADD 2 & PADD 4 Crude Oil Movements to PADD 3
                     100%

                       75%

                       50%
                                                    Tanker
                       25%                          Rail
                                                    Pipeline
                         0%
                          1990                   1995                 2000                 2005                2010                 2015                 2020

                                                                             WTI - LLS Premium ($/Bbl)
                      $10

                          0

                     -$10

                     -$20

                     -$30
                        1990                   1995                  2000                 2005                 2010                 2015                 2020
                                                                                           Year

Source: U.S. Energy Information Administration, West Texas Intermediate Spot Price and Light Louisiana Sweet First Purchase Price. Movements between PADD Districts,
by pipeline, by tanker & barge, and by rail

Shifting focus to natural gas midstream constraints, the relevant constraint is not between the mid-con-
tinent and the Gulf Coast region (as has been the case for oil), but instead moving natural gas out of
the Permian Basin. Specifically, there are three types of transportation-oriented constraints arising in
the Permian region. The first constraint rests with the limited in-field gathering system capabilities in
some areas. The second constraint rests with limited gas processing, while the third constraint rests
with the need for additional longer-haul transmission pipeline capacity to move natural gas out of the
Permian to Gulf Coast markets.15
Collectively, these constraints can lead to two phenomena (1) wellhead flaring of natural gas and (2)
inter-region natural gas pricing discounts, as seen in the Henry Hub/Waha pricing. Figure 12 illustrates
both of these trends focusing on the Permian basin and comparing Henry Hub and Waha natural
gas prices. Pre-2018 these two hubs traded at very similar prices with Henry Hub receiving a small
premium, on average, due to its proximity to many large sources of natural gas demand. Also, flar-
ing in the Permian basin was consistently less than 0.1 bcf/d; however, as Permian basin production
 For a detailed discussion of the value chain moving natural gas from wellhead to market, see recent research. Agerton, Gilbert & Upton, 2020. The Economics of Natural Gas Flaring in
15

 U.S. Shale: An Agenda for Research and Policy. Rice University’s Baker Institute for Public Policy Working Paper. USAEE Working Paper No. 20-460.

LSU Center for Energy Studies                                                                                                                                                     23
You can also read