Solar Powered Bike Sharing System with Electric Bikes
←
→
Page content transcription
If your browser does not render page correctly, please read the page content below
Solar Powered Bike Sharing System
with Electric Bikes
An overview of the energy system and the
technical system design
Master thesis within the Master's Programme Industrial Ecology
Examensarbete inom civilingenjörsprogrammet elektroteknik

FABIAN FOGELBERG

Department of Energy and Environment
Division of Environmental System Analysis
CHALMERS UNIVERSITY OF TECHNOLOGY
Göteborg, Sweden 2014
Report no. 2014:4
REPORT NO. 2014:4

Solar Powered Bike Sharing System with
 Electric Bikes
 An overview of the energy system and the technical system design

 FABIAN FOGELBERG

 Department of Energy and Environment
 Division of Environmental System Analysis
 CHALMERS UNIVERSITY OF TECHNOLOGY
 Göteborg, Sweden 2014
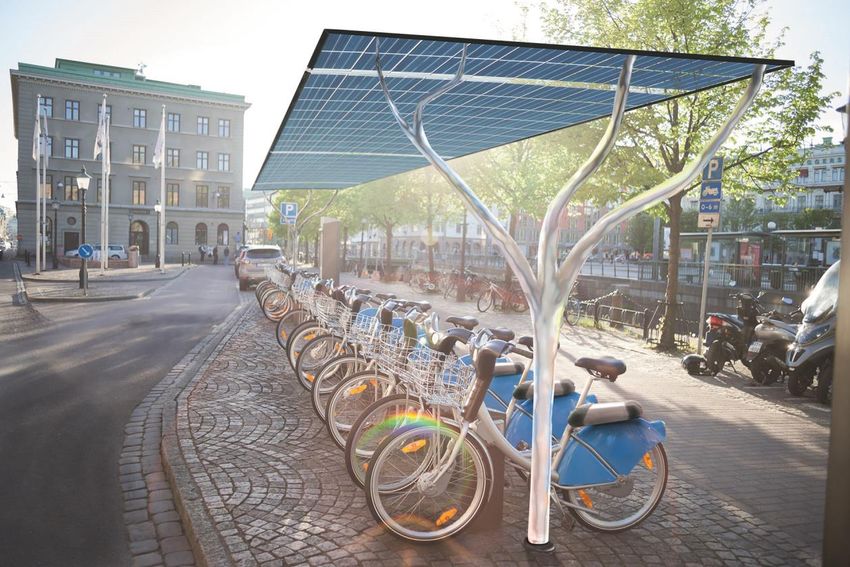
Solar Powered Bike Sharing System with Electric Bikes
An overview of the energy system and the technical system design
FABIAN FOGELBERG

In collaboration with Viktoria Swedish ICT

Tutors: Magnus Karlström and Magda Collado
Examiner: Björn Sandén

© FABIAN FOGELBERG, 2014.

Report no. 2014:4
Department of Energy and Environment
Division of Environmental System Analysis
Chalmers University of Technology
SE-412 96 Göteborg
Sweden
Telephone + 46 (0)31-772 1000

Cover:
Concept image of a solar powered bike pool with electric bikes. © Fabian Fogelberg, 2014.

Chalmers Reproservice
Göteborg, Sweden 2014
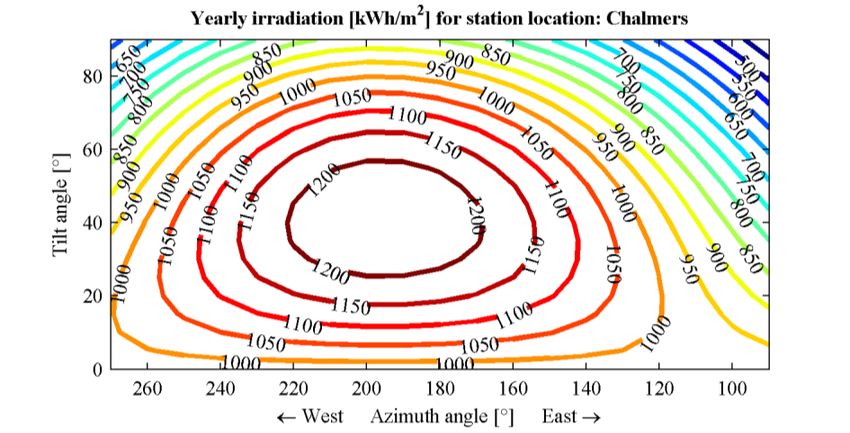
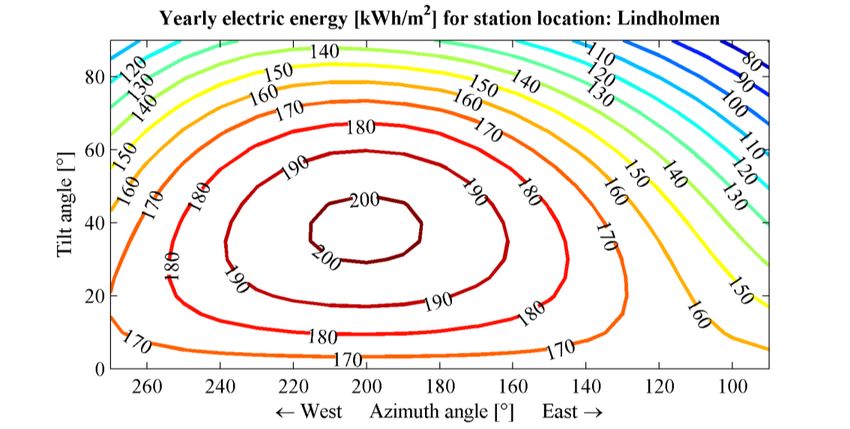
Abstract
Combining Electric Bikes (E-bikes) with bicycle sharing systems could have a number of
benefits. E-bikes reduce the human force needed for propulsion which facilitates longer and
hillier rides relative regular bikes. The system could thus have more widespread network of
stations, not only reaching more people but also enable commuting longer distances. It could
also reduce the need for redistribution as users of regular bike sharing systems tend to only
ride downhill.

The focus of this report has been to perform energy calculations and system design on solar
powered E-bike pools. The geographical focus has been on Gothenburg, Sweden but the
results can be applied to locations with similar latitude. The calculation methodology may
however be applied to any other city around the world. It was shown that placing 0.2-0.8 m2
solar panels per E-bike on the station's roof could supply enough energy to make the E-bike
self-sufficient on a yearly basis despite high degree of system use. By increasing the solar
panel area it was shown that there can be a net electric energy production on a yearly basis. At
the maximum assumed solar panel area (about 3-3.8 m2/E-bike) there could be 600-800 kWh
of solar energy fed to the grid per E-bike and year depending on the usage level.

Using a system that is on-grid and coupled with a stationary battery is seen as the best system
design. That would enable origin marking of electricity and decrease the problem of
intermittency with solar power. Reducing the interchange with the grid would also increase
the system efficiency as the current do not need to be converted to or from AC as often.

Keywords: electric bike, electric bicycle, solar power, e-bike, pedelec, BSS, shared bicycles,
bike pool, bike sharing system.

 i
Acknowledgements
This thesis would not have been if it were not for Stefan Pettersson at Viktoria Swedish ICT
who found me this interesting project, thank you for that. Thank you Magda Collado at
Viktoria Swedish ICT for your help along the way and for letting me take part in the E-bike
project. Thank you Magnus Karlström at Chalmers Industriteknik for being my tutor, have
met me for interesting discussions regarding the project and helped me with my text. Thank
you Björn Sandén for being my examiner, taking your time for the interesting discussions we
had along the way and for giving me feedback on the report. Thanks to the solar irradiation
data provider SoDa for your data. Without it, I would not have been able to study the solar
energy in such detail. A special thanks to Claire Thomas at SoDa for your help with the data
access and for sorting out my confusions regarding the data. Thank you Johan Wedlin at
Viktoria Swedish ICT for your proof-reading. Thanks to the all staff at Viktoria Swedish ICT
who have welcomed me into your inspiring world and to my mum and dad, Karin and Hans
Fogelberg, who gave me valuable comments on my report.

Now I want an E-bike.

ii
Abbreviations

AC Alternating Current [A]
BLDC Brushless DC motor
BHI Beam (direct) Horizontal Irradiance [W/m2]
BSS Bike Sharing System
BTI Beam (direct) Tilted Irradiance
DC Direct Current [A]
DHI Diffuse Horizontal Irradiance [W/m2]
DTI Diffuse Tilted Irradiance [W/m2]
E-bike Electric Bike (pedal assisted)
E-BSS Electric Bike Sharing System
GHG Green House Gas
GHI Global Horizontal Irradiance [W/m2]
GTI Global Tilted Irradiance [W/m2]
Isc Short Circuit Current [A]
Li-ion Lithium ion
mc-Si Multi-crystalline silicon
MPP Maximum Power Point
MPPT Maximum Power Point Tracker
NiMH Nickel Metal Hydride
NOCT Nominal Operating Cell Temperature [°C]
PM Permanent Magnets
PV Photovoltaic
RTI Reflected Tilted Irradiance [W/m2]
sc-Si Single-crystalline silicon
STC Standard Test Conditions
TC Temperature Coefficient [%/°C]
Voc Open Circuit Voltage [V]

 iii
Contents
1. Introduction ......................................................................................................................... 1
2. Purpose & research questions ............................................................................................. 3
3. Research methodology ........................................................................................................ 4
 3.1 Availability of solar power .......................................................................................... 4
 3.2 Energy requirements of E-bikes .................................................................................. 5
 3.3 System design of charging stations ............................................................................. 5
4. Background ......................................................................................................................... 6
 4.1 Solar energy ................................................................................................................. 6
 4.1.1 Variability of solar irradiance and irradiation ...................................................... 8
 4.1.2 Solar Photovoltaic and energy calculations.......................................................... 8
 4.1.3 Solar cell characteristics ..................................................................................... 10
 4.1.4 Mounting and tracking technology .................................................................... 12
 4.2 Electric bikes ............................................................................................................. 13
 4.2.1 E-bike batteries ................................................................................................... 15
 4.2.2 Electric motor and motor control ....................................................................... 16
 4.2.3 Human power input ............................................................................................ 17
 4.3 Bike sharing systems ................................................................................................. 17
 4.3.1 Taking the leap from BSS to E-BSS .................................................................. 20
5. Methodology for calculations on a solar powered E-bike sharing pool ........................... 21
 5.1 Solar energy calculations ........................................................................................... 21
 5.1.1 Irradiance data .................................................................................................... 21
 5.1.2 Case study on four possible station locations in Gothenburg ............................ 22
 5.1.3 Losses in the solar cell ....................................................................................... 23
 5.1.4 Shading in the urban environment ..................................................................... 24
 5.1.5 Specifications on the solar panel installation ..................................................... 26
 5.2 Modelling an E-bike .................................................................................................. 26
 5.2.1 Power during acceleration and deceleration ....................................................... 27
 5.2.2 Power to overcome air drag................................................................................ 27
 5.2.3 Power to overcome rolling resistance ................................................................ 28
 5.2.4 Power during climbing ....................................................................................... 28

iv
5.2.5 Regenerative braking.......................................................................................... 29
 5.3 Modelling an E-BSS system ...................................................................................... 30
6. Results ............................................................................................................................... 34
 6.1 Available solar energy and weather ........................................................................... 34
 6.2 E-bike electric energy use.......................................................................................... 37
 6.3 E-BSS energy results ................................................................................................. 38
7. Discussion ......................................................................................................................... 43
 7.1 Weaknesses and uncertainties ................................................................................... 43
 7.2 The energy system ..................................................................................................... 44
 7.3 The operational perspective ....................................................................................... 45
8. Conclusions ....................................................................................................................... 47
9. References ......................................................................................................................... 48
Appendix 1 ............................................................................................................................... 52
Appendix 2 ............................................................................................................................... 54
Appendix 3 ............................................................................................................................... 58
Appendix 4 ............................................................................................................................... 62
Appendix 5 ............................................................................................................................... 66
Appendix 6 ............................................................................................................................... 68
Appendix 7 ............................................................................................................................... 69

 v
1. Introduction

 1. Introduction
 Climate change from increased concentration of carbon dioxide in the atmosphere was
 acknowledged already back in the year 1896 (Arrhenius, 1896). It is however not until recent
 decades that discussions have emerged, and plans been developed, on how our emissions of
 Green House Gasses (GHG) should be reduced. The transport sector accounted for 13% of the
 global GHG emissions in 2004 (IPCC, 2007, p. 29). In addition to the global challenge of
 GHG emissions, many cities around the world face problems with local air pollution and
 congestion. Decreasing air pollution on a local — and a global — level can be accomplished
 by switching to vehicles with fuels that have lower environmental impact than fossil fuels;
 such as electric vehicles or bio-fuels. However, this does not directly affect congestion.

 Around a third of the trips made by car in Europe are shorter than 3 km, and half of the trips
 shorter than 5 km (IPCC, 2007, p. 51). This means that there is a potential for efficiency and
 air-quality improvement by switching to more energy efficient and less polluting modes of
 transport that can replace these short distance trips. One alternative is to increase bicycling
 which could reduce the need for taking car or public transport short distances as well as
 reduce congestion. One of the methods to increase bicycling in cities is to set up Bike Sharing
 Systems (BSS) that can be accessed by locals or tourists for a fee. There are currently more
 than 600 cities with BSS globally (ITDP, 2013, p. 10). The number of bikes in those systems
 exceeds 700 000 (ITDP, 2013, p. 13). By providing a large network of stations with shared
 bicycles, it is possible to supply an efficient, convenient and cheap mode of transport. These
 types of systems have been proven successful. In Barcelona, a maximum number of registered
 users per bike has been set, as well as prices increased in order to ensure an efficient system
 (OBIS, 2011, p. 59). One drawback with current BSS is that they are used for short rides in
 city centres and uphill rides have been seen to be avoided by users which increases the need
 for redistribution by truck (ITDP, 2013, p. 116). BSS uses commonly available trucks and
 cars on the market for their redistributions. They thus rely mostly on fossil fuels. Admittedly,
 the environmental impact from redistribution may be reduced if the car or the truck is
 powered by renewable power sources but reducing the need of redistribution also decreases
 the operating costs and congestion.

Recent developments on pedal assisted Electrical Bikes (E-bikes) and regulations surrounding
them have led to a growing market of E-bikes all around the world. Especially in China where
9 out of every 10 E-bikes are sold (Navigant Research, 2014). E-bikes could potentially be
one of the first type of electric vehicles to reach large-scale diffusion in Sweden (excluding
trams and trains). Not only are they energy efficient, but also cheap relative other electrified
transport modes. They enable rides in hilly and windy conditions where cyclists would reduce
their speed significantly. Longer rides are also possible as the rider's effort is reduced. Thanks
 to the characteristics of E-bikes they have a greater
 Electric bike potential to replace car trips than regular bikes
A pedal assisted electric bike (E-bike or
Pedelec) is a bike with an electric motor (Langford, et al., 2013). Introducing Bike Sharing
that only supplies electric power when the
 pedals are rotating. The motor must be 1
 turned off at 25 km/h and the maximum
 designed motor power is 250 W.
1. Introduction

Systems with E-bikes (E-BSS) could open up their use to a broader audience. The potential
for modal shift from fossil fuel powered transport modes would thus increase. Furthermore, a
roof may be placed on top of the E-bike station that could serve as combined weather
protection and provider of electric energy by installing solar panels on the roof. If the
available solar energy is sufficient, it could for example keep the system off-grid which means
that stations can be placed temporarily where needed, e.g. close to festival areas or sports
events. Placing solar panels on station roofs would introduce solar energy in places that
otherwise would not have been considered. An E-bike charged with electricity from the sun
may be one of the most efficient means of transport there is (see Appendix 1). The main
reason is because its mass is lower than a car's or a scooter's and thus less energy is required
for propulsion. The second reason is that bio-fuels or regular cycling requires conversion of
solar energy to chemical energy which is characterised by low energy conversion efficiencies
relative a solar panel.

There are several E-bike pools around the world. Some have been running for a few years and
some are recently started. To name a few there are: GoBike in Copenhagen, Eneloop SANYO
in Tokyo, CycleUshare in Knoxville and E-call a Bike in Stuttgart. Of those systems, two are
coupled with solar panels, Eneloop SANYO and CycleUshare. As CycleUshare is built and
operated by the University of Tennessee-Knoxville, research is being made and published on
E-BSS (University of Tennessee-Knoxville, 2014). However, many questions are still to be
answered as the use of E-BSS is far from large-scale in comparison to regular BSS. Also,
little information has been found on the synergy between solar panels and E-BSS. This is thus
the focus of this report in which the energy balance between the solar energy and E-bike
energy use is studied in detail for different system designs.

2
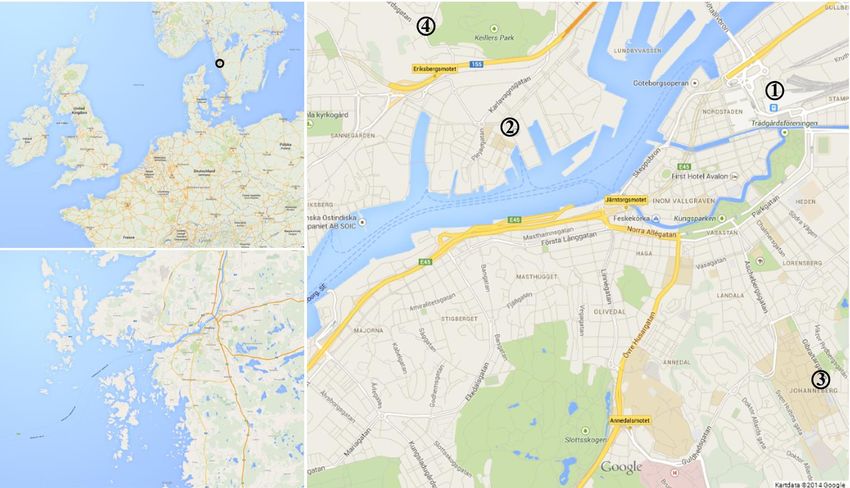
2. Purpose & research questions

2. Purpose & research questions
This master's thesis is part of a pre-study at the research institute Viktoria Swedish ICT that
aims at evaluating how E-BSS can be used as an urban mobility transport mode and determine
its implementation feasibility in the Western Sweden Region. The main objective of this
thesis is to investigate the energy system of E-BSS with solar panels on the stations' roofs.
The geographical focus is within the Western Sweden Region and more specifically, the city
of Gothenburg. The reason for the narrow geographic boundary is that solar irradiation varies
with location. Numeric results from the thesis may however be applied to nearby cities and
other locations at similar latitude as long as there are no major differences in irradiation. The
methodology presented in this report is however be applicable to other cities around the world
who want to learn more about how to develop and implement an E-BSS equipped with solar
panels.

A large share of the investigation is performed on a per E-bike basis as the numbers of E-
bikes in a station can vary. The study is divided into three parts: A study on the available
energy from the solar panels in urban environment, the energy use of E-bikes and the
resulting energy balance depending on system design. The research questions to be answered
within each part are:

 1. Solar energy:
 - What is the availability of solar energy in urban environments?
 2. E-bikes:
 - What is the electric energy use of an E-bike?
 - What is the typical usage of bikes in a pool system?
 3. System evaluation:
 - How much installed solar power is required per E-bike on a yearly basis in
 Gothenburg, Sweden?
 - How does the solar panel area affect the yearly energy balance of the
 system?
 - What type of system design is most suitable, on- or off-grid? With or
 without a stationary buffer battery?
 - What effect do the system design options have on the energy balance?
 - How should battery depletions be avoided?
 - What are important to think about when setting up an E-BSS?

 3
3. Research methodology

3. Research methodology
This study is mainly focused on calculations of the energy balance of solar powered E-bike
pools. The first step is to perform a literature review on solar energy, E-bikes and BSS. The
purpose of this review is to get knowledge on how each component work, their energy
use/generation and how they would interact in a pool system. The literature is as far as
possible collected from scientific databases such as Chalmers library's database search tool
Summon. Peer reviewed research papers were prioritised but other information types such as
books or reports can be collected from there as well. In cases where the scientific literature
does not have the information needed, such as specifications on commercial products, web
searches was performed to find information from other sources.

The study is divided into three main parts:

 1. Calculations of available electrical energy from the solar panels.
 2. Calculations of energy required of the E-bikes.
 3. Evaluation on system design by literature review of current BSS and BSS
 data and results from the two first parts.

The software Matlab from Mathworks is used as the main tool in all calculations of the E-
bike's energy use and the availability of solar energy.

3.1 Availability of solar power
To estimate the available electric energy from solar panels there are a number of parameters
that need to be identified and estimated properly. The first step is to estimate the available
solar irradiation. To do this, detailed datasets of solar irradiation data is needed. This
information is collected from the solar irradiation data provider SoDa (SoDa, 2014). They
provide irradiation data derived from satellite and ground measurements (ibid.). The datasets
used consists of hourly irradiation towards Gothenburg from February 1, 2004 to December
31, 2005. If data are missing or corrupted, interpolation is considered to enable calculations
over the entire period.

In ideal cases, all solar energy available would be collected by the solar panels but in a city
environment this is not always the case since buildings will shadow the irradiation. A method
of estimating these losses was developed. When the sunlight hits the solar panels, a number of
different losses will occur during the conversion to electric power. These will be dependent on
a number of factors such as type of solar cell technology used, outdoor temperature etc. Some
parameters can be determined by literature review of solar cell research while others depend
on system design and specific choice of system components.

4
3. Research methodology

3.2 Energy requirements of E-bikes
There are numerous different things that will affect the energy use of the E-bikes. The energy
requirements will vary heavily depending on the choice of route, the rider's weight, the E-
bike's specifications, etc. A few of these parameters were identified in the literature review
but some are dependent on actual system design. To get further insight on how BSS are being
used, data from running BSS was collected and analysed.

3.3 System design of charging stations
By combining the simulation results of available energy from the solar panels with the energy
requirements of the E-bikes it is possible to study different options of system design.
Independent of the amount of data collected, there is some things that cannot be determined
with great certainty as this report is of exploratory nature. This means that some results might
not apply to a real system. To deal with this problem, it was tried throughout the report to
analyse the system carefully to ensure that the drawn conclusions in the end will be relevant
for a real case despite changes in for example use of the system.

 5
4. Background

4. Background
This chapter presents background information on solar energy, E-bikes and BSS. Section 4.1
starts by introducing solar radiation to explain the variability of solar energy and the energy
levels involved. The section is ended with an introduction to solar cell technologies and the
factors affecting the electric power output. Section 4.2 includes information on E-bikes from
legal and technical perspectives including specific descriptions of components. Finally,
section 4.3, includes information and data on bicycle sharing schemes currently in place.

4.1 Solar energy
Everyone knows the power of the sun. If you are out in direct sunlight you feel your skin
warming up and anyone who has ever set foot into a car parked in direct sunlight knows the
sauna-like heat that hits you when opening the door. The solar irradiance perpendicular
towards the top of earth's atmosphere — also known as the solar constant — is roughly 1360
W/m2 (Kopp & Lean, 2011). This is the sum of all incoming electromagnetic radiation. The
share of the solar constant that reaches the ground depends on many factors. The atmosphere
will reflect, absorb and scatter the irradiance based on its chemical composition such as water
vapour content, cloud coverage and amount of aerosols (Weier & Cahalan, 2003). Another
factor is the inclination of incoming light; the lower the angle, the lower the irradiance
towards a surface. This is one of the reasons behind the relationship of decreased incoming
light towards the ground with increased distance from the equator. A lower angle of the sun
relative to the ground also means that the light travels through a larger air-mass and thus the
light intensity decreases due to previous mentioned factors.

The measure of the radiation's total power is noted irradiance and can be expressed in W/m2.
By integrating the irradiance you get the energy, or irradiation, that can be expressed in for
example Wh or kWh per m2. It is important to note that the surface may be either horizontal,
or inclined in a certain angle relative the incoming irradiance. This angle will affect the
amount of irradiance falling onto the surface. To be able to analyse the irradiance in further
detail, it can be split up in three main components: Direct, reflected and diffuse irradiance.

 Figure 1. Direct irradiance originates straight from the sun, reflected irradiance from reflections in
the ground (thus hits tilted planes only) and diffuse irradiance originates from the entire hemisphere.

Figure 1 shows how the three main irradiance components are defined. The direct irradiance
is the irradiance that comes straight from the sun disk, the reflected irradiance originates from
6
4. Background

reflections in ground and the diffuse component represents irradiance coming from the entire
hemisphere (excluding the sun disk) due to scattering and reflections in the earth's atmosphere
and clouds. The reflected irradiance originates from ground; it is thus zero when evaluating
the irradiance towards a horizontal plane. The reason for why the irradiance is split up in
different components is that they behave differently and the split thus enable a more detailed
analysis.

 Figure 2. Example of solar irradiance in Gothenburg, Sweden, during two days in July, 2004. The
 global irradiance is the sum of all irradiance components (solid). The direct irradiance is dashed
(red), the diffuse dashed-dotted (black) and the reflected dotted (blue). All components are towards a
 shadow-free surface tilted 40° (0° being horizontal) and south-facing. Data: SoDa (2014).

The sum of the direct, the reflected and the diffuse irradiance is called the global irradiance,
which is what is shown as a solid line in Figure 2. The maximum irradiance seen in Figure 2
— just above 1000 W/m2 — represents typical maximum irradiance perpendicular to the sun
at ground level (IEA, 2011). The first day in Figure 2 shows smooth global irradiance with the
direct irradiance being the dominant component; this means a clear and sunny day. On the
second day, the irradiance is much lower due to clouds shading the surface. The diffuse
component has therefore a larger share of the global irradiance. It can also be noted that the
reflected irradiance (dotted in Figure 2) is small during both days. In order to keep the
different irradiance components apart it is useful to introduce abbreviations as seen in Table 1.

Table 1. Abbreviations for the different irradiance components.
 Abbreviation Irradiance component
 GHI Global Horizontal Irradiance
 BHI Beam (direct) Horizontal Irradiance
 DHI Diffuse Horizontal Irradiance
 GTI Global Tilted Irradiance
 BTI Beam (direct) Tilted Irradiance
 DTI Diffuse Tilted Irradiance
 RTI Reflected Tilted Irradiance

 7
4. Background

4.1.1 Variability of solar irradiance and irradiation
There are great variations in solar irradiance and irradiation that must be acknowledged and
understood in order to analyse solar powered systems properly. In one second the irradiance
may fall from 1000 W/m2 to a tenth, if a thick cloud suddenly shades the sun. On a day-to-day
basis, as exemplified in Figure 2, the irradiation was 7.8 kWh/m2 the first day to drop to 4.3
kWh/m2 the next due to different weather.

Figure 3. Average daily Global Horizontal Irradiation (GHI) for each month in Gothenburg, Sweden,
 towards a horizontal and shadow-free surface. Data is averaged from 1983 to 2005. Data: NASA
 (2014).

Not only weather affects the irradiation, but also the inclination towards the sun. Figure 3
shows the average daily irradiation towards a horizontal surface for each month in
Gothenburg, Sweden. As the city is located at high latitude (58°), the sun's inclination is low
during winters and increasing during summers. The irradiation thus follows a similar pattern.
Differences in weather patterns may also cause the long-term average irradiation to vary with
up to ±30% on a monthly scale and ±10% on a yearly (NREL, 2011). An implication of the
intermittency of the solar energy is that some sort of buffering is necessary if the load does
not match the irradiation perfectly.

4.1.2 Solar Photovoltaic and energy calculations
The first silicon Photovoltaic (PV) cell was developed by Bell Labs in the U.S. during the
1950s (United States Department of Energy, 2010). The cell had a conversion efficiency of
solar to electric power of 4% which is a record that continuously has been broken ever since.
The highest efficiency as of today is 44.7%, measured in lab environment (Dimroth, 2013).
Commercial solar panels however have lower efficiencies as shown in Table 2 (IEA, 2011,
pp. 114-115; Green, et al., 2013). At first, PVs were used in niche applications in for example
space, rural electrification and telecommunication (IEA, 2011, p. 47). Later developments in
production and efficiency, as well as governmental market support programmes, have led to a
PV market that is expanding each year with prices that decreases continuously on long-term
scale (ibid.).

8
4. Background

Table 2. Typical efficiency of commercial solar panels.
 Solar cell technology Typical range of commercial panel efficiency (%)
 Single-crystalline Silicon (sc-Si) 14-22
 Multi-crystalline Silicon (mc-Si) 12-19
 Thin films 4-19

There are a number of solar cell technologies on the market but 85% of the market is
dominated by the crystalline silicon technologies (IEA, 2011). Within that category there are
two main technologies: Single-crystalline (sc-Si) and multi-crystalline (mc-Si) solar cells. Sc-
Si solar cells are made from silicon wafers with very high purity which results in higher
efficiency than mc-Si (see Table 2). The second largest market share is thin film solar cells.
Thin films is the name for solar cells that are produced by applying each layer one at a time
onto a substrate such as glass or a flexible surface (Poortmans & Arkhipov, 2006, p. xix). One
widespread thin film technology is the Amorphous Silicon (a-Si) solar cells — the type used
in calculators — which often are cheaper to produce than crystalline silicon solar cells.
However, their efficiency is lower. Another type of thin film is multi-junction silicon solar
cells. They use different layers of solar cells to be able to convert a broader spectrum of the
incoming irradiance into electricity (IEA, 2011). The efficiency of multi-junction solar cell
differs with the layers used but it may reach up to 19% on commercial panels (Panasonic,
2014).

In any installation it is important to know the estimated lifespan in order to calculate long-
term feasibility. Common market praxis in the PV industry is to guarantee that the solar panel
will generate at least 80% of the rated output power after 25 years (IEA, 2011, p. 114). The
system cost for a small (0-20 kW) grid-connected solar panel system in Sweden was around
15 SEK/W in 2013 (Energimyndigheten, 2014). The cost figure is for the most common cell
technology, i.e. either sc-Si or mc-Si.

 9
4. Background

4.1.3 Solar cell characteristics

 Figure 4. Example of mc-Si or sc-Si cell and panel. (1) Front of solar cell: Horizontal stripes collect
the current and minimises the resistance and are connected to bus bars (vertical), used for connection
to other cells. (2) Back of cell: Square contact points are used to connect bus bars from previous cell.
 (3) Panel layout: All cells connected in series. Source: Own work.

A typical crystalline silicon solar cell is shown in Figure 4, (1). The horizontal lines on the
front help to minimise the resistance and thus increase the efficiency and the vertical lines are
used to connect cell to back of the next one (Figure 4 (2)). A crystalline silicon solar cell has
an open voltage (Voc) of about 0.5-0.6 V when fully irradiated and generates short-circuit
current (Isc) proportional to the incoming irradiance (Rauschenbach, 1980, pp. 55, 198). To
get a useful voltage in a PV system, several cells are thus connected in series and usually
mounted in a rigid glass-framed panel as exemplified in Figure 4, (3). To further increase the
voltage, several panels can be series connected and to increase the current, they can be
parallel connected. In this way it is possible to configure the amount of series and parallel
connections to get a desired voltage and current.

To prevent current to flow in the wrong direction, e.g. from a battery to a solar panel or from
one panel to another in a parallel configuration, a blocking diode is usually added on each
panel (Rauschenbach, 1980, p. 74). A diode works in such a way that when it is forward
biased (typically about 0.7-1 V) it conducts and when a negative voltage is applied, it acts like
a circuit breaker (ibid.). An example of operation is if an 18 V solar panel is connected to a 12
V battery. During the day, the voltage of the solar panel exceeds the voltage of the battery,
and current will thus flow into the battery. On the night however, the solar panel's open
voltage will be 0 V and current will thus flow from the battery to the solar panel instead, not
only draining the battery but potentially also damaging the solar panel. By adding a diode
between the panel and the battery, it is possible to prevent current to flow in the wrong
direction night-time while still enabling battery charging daytime.

10
4. Background

Figure 5. Typical characteristics of a silicon solar panel for different loads and irradiance levels. The
circles mark maximum power points at each irradiance level. Data: Measurement on a mc-Si panel at
 Chalmers University of Technology, 2012.

An example of characteristic of a solar panel (or cell) is shown in Figure 5 for four different
irradiance levels ranging from 50 W/m2 to 400 W/m2. The curve was created by adjusting the
load connected to a mc-Si solar panel and measuring the output current and voltage
simultaneously. The power output in any point is given by voltage times current; this means
that the maximum power output is obtained when the area beneath each curve is highest. This
operating point is called the Maximum Power Point (MPP) and is marked with circles in
Figure 5. As the load in a PV system may vary and the MPP is dependent on irradiance (as
seen for the different lines in Figure 5), it is important to apply a tracking technology that
ensures operation at MPP. This is performed by a Maximum Power Point Tracker (MPPT)
which is the name for any power electronic device that is able to adjust the load to ensure
operation at MPP for maximum energy yield. The linear relationship in short circuit current
and incoming irradiance can be seen in Figure 5 by comparing the current at 0 V (Isc) for 50
W/m2 and 100 W/m2 where the current is approximately doubled. What also can be noted is
that there is a decreasing relationship in open voltage (i.e. at 0 A) with decreasing irradiance.
The MPPT is usually incorporated in the grid tie inverter that converts the Direct Current
(DC) to Alternating Current (AC) fed to the electrical grid. It can also be incorporated in a
battery charge controller designed to operate off-grid.

A common test procedure called Standard Test Conditions (STC) has been developed by the
solar PV industry in order to have consistent information on solar panels. The test uses an
artificial light source emitting a light spectrum called AM1. A spectrum which resembles the
spectrum from the sunlight at sea level a clear day. The total irradiance of this light source is
1000 W/m2 and the cell temperature of the tested solar cell or panel is held at 25 °C. At these
conditions, the output characteristics is measured similar to what is shown in Figure 5 and the
MPP on that curve is the rated output power of the panel (Rauschenbach, 1980, p. 389). The
rated power output from a solar panel is referred to as peak watts (Wp) of installed power.
Another test that usually is performed by solar panel manufacturers is the Nominal Operating
Cell Temperature (NOCT). It is used to estimate the cell temperature under conditions that are

 11
4. Background

more common in field than the STC. Those specifications are: 800 W/m2 irradiance, 20 °C
ambient temperature and 1 m/s wind speed (Alonso García & Balenzategui, 2004).

The efficiency of a solar cell, or panel, is described by the ratio between the electrical output
and the total incoming irradiance;

 = ⁄ . (1)

By solving for electrical power we get,

 = = , (2)

where G is the total irradiance in W/m2, A the area in m2 and η the conversion efficiency. A
problem with the efficiency, η, is that it is dependent on temperature; the higher the
temperature, the lower the efficiency (Rauschenbach, 1980, p. 74). This relationship will be
further described in section 5.1.3.

4.1.4 Mounting and tracking technology
To maximise the energy yield from fixed solar panels, they should generally be mounted
towards the south1. In some cases however, e.g. when buildings are shading the panels it
could be more beneficial to point the panels more east- or westwards. The tilt can be chosen
to get the maximum yearly energy yield or optimised for another period depending on
application. If for example an off-grid system should be designed that measures temperature
and transmits the data to a weather institute, it is best to mount the panels so that the energy
yield is highest during the period with lowest irradiation to ensure full-year operation (e.g.
December as seen in Figure 6). The yearly optimal tilt angle will generally be higher the more
North of the equator you are as the sun angle thus will be lower. If it is physically possible,
the solar panels can be mounted on a tracking device that estimates where the irradiance is
highest on the sky and turns the panels towards that point. There are a number of different
tracking solutions on the market but two types can be identified: 1-axis and 2-axes tracking
(either just azimuth or tilt, or both).

1
 In the Northern hemisphere; vice versa in the Southern hemisphere.
12
4. Background

 Figure 6. Average daily irradiation per month in Gothenburg, Sweden. Dark grey: Towards a
 horizontal surface. Light grey: Extra energy yield with 1-axis tracking (south-facing and changing
 tilt). Data: NASA (2014).

The energy gain from using tracking compared to fixed position will vary depending on
location and how well the tracking performs. An example of the irradiation towards a
horizontal surface and one with 1-axis tracking (changing tilt) is shown in Figure 6. The
energy gain due to tracking during the winter months is more than the summer months due to
the low solar angle wintertime. The yearly energy gain of the 1-axis tilting compared to the
horizontal case in Figure 6 is 20%. A computer model for locations in Germany concluded
that the yearly energy yield compared to fixed tilt could be increased with 10% for 1-axis
tracking on an azimuth plane, 25% when changing the tilt instead and 29% when using a 2-
axes tracking system (Breyer & Schmid, 2010).

4.2 Electric bikes

 Figure 7. Electrical bike as figured in a patent from 1895. The motor is mounted on the rear wheel,
the battery in the frame and the power switch on the handle. Note the lack of pedals. Drawing from a
 patent by Bolton Jr. (1895).

One of the first patents of electrical bikes was registered almost 120 years ago by Ogden
Bolton Jr. (see Figure 7) (Bolton, 1895). The concept Bolton Jr. patented is similar to the E-
bikes of today. An E-bike is — narrowed down to its basics — a regular bicycle equipped
with an electrical motor, a battery and some electronics and switches that controls power
levels. Since it is powered by two energy sources, pedalling and electricity, it can be classified

 13
4. Background as a hybrid vehicle. For an E-bike to be legal in Sweden it has to fulfil a set of requirements according to the law (Lag(2001:559) om vägtrafikdefinitioner): Electrical motor may only be active while pedalling (unless speed is below 6 km/h). Maximum rated power of motor2: 250 W. No motor power may be provided at speeds above 25 km/h. The EU directive 2002/24/EC also states that the power must be progressively reduce as the bike approaches 25 km/h, this is however not needed for E-bikes in Sweden. The fact that pedalling is not needed for speeds below 6 km/h can be especially practical when walking the bicycle uphill or cruising in walking speed. The requirements on E-bikes differs from country to country, but one that stands out is the U.S. who allows 750 W motor power and speeds up to 32 km/h without the need for pedalling (Morchin & Oman, 2006, p. 21). Figure 8. Example of typical commercial E-bike. The motor is in this case placed in the hub of the front wheel (rated at 250 W) and the battery and its electronics is enclosed in the black box right of the rear wheel. Typically, there is also a small control panel on the handles. Reproduced with permission of EcoRide (2014). An example of a commercially available E-bike is shown in Figure 8. The motor is usually placed in the front or rear wheel (called hub motor) but sometimes on the crank shaft (Atkinson, 2012) or mounted directly on the wheel (Rubbee, 2014). The location of the battery may vary depending on bike design but typically, the producers try to place it as low as possible for an optimum centre of gravity. There is usually also a control panel at the handle (not seen in Figure 8) that is used to turn on and off the E-bike function, set different power level options and monitor the battery level. 2 Note: The rated power of the motor is the mechanical. The electrical power is thus higher due to losses in the motor and the rest of the electrical system. An electrical motor may also provide higher power than the rated during short periods of time. 14
4. Background

4.2.1 E-bike batteries
A battery in an E-bike should have capacity large enough to keep the range at a level that
meets the user's demand, but also meet technical requirements such as safety and be able to
supply enough power to the motor. There are a number of different battery technologies on
the market. A short review of twelve different E-bike producers3 in Europe and USA revealed
that all of them use Lithium Ion (Li-ion) batteries. Although this short investigation makes no
claim to be complete, it is safe to say that Li-ion batteries are a common technology for
western E-bike producers to use.

It was found that a common battery capacity is 10 Ah in a 36 V system. In energy that is equal
to about 360 Wh assuming that the battery voltage does not change throughout the discharge
cycle and that the State of Charge (SOC) may reach 0%. Li-ion batteries are in the upper
range of energy density compared to other technologies (Morchin & Oman, 2006, p. 154) and
they also last longer than other technologies (ibid.). The energy density of commercial Li-ion
batteries is in the range of 100-250 Wh/kg (Panasonic, 2014) whereas the cheaper alternative,
Lead Acid batteries, is around 30 Wh/kg (Morchin & Oman, 2006, p. 154). A drawback with
Li-ion batteries is their high initial cost, however, when taking a lifecycle cost perspective
they can still be cheaper than e.g. Lead Acid batteries (Morchin & Oman, 2006, p. 36). The
cost of battery replacement for a Swedish E-bike user is about 3000 SEK (EcoRide, 2014;
Lifebike, 2014).

The charge temperature of Li-ion batteries is about 0-45°C but it can discharge in the range of
-20°C to 60°C (Cadex, 2014). No charging should be permitted if the battery temperature is
below 0°C as this could damage the battery (ibid.). In the window of 0° to about 5°C, it is
necessary to decrease the charge current (ibid.).

Another factor that is of importance for the choice of battery technology is the performance
during heavy discharge. Such conditions can be riding steep uphill or in strong headwind. A
Lead Acid battery will for example lose a large share (>50%) of its rated energy capacity
during heavy continuous discharge compared to low discharge rates due to high internal loss
(Zirnheld & Muffoletto, 2011). Nickel Metal Hydride (NiMH) and Li-ion batteries on the
other hand lose less than 10% during similar conditions (ibid.). Charging the battery requires
a charger that monitors the battery properly in order to avoid battery cell failure (Morchin &
Oman, 2006, p. 92). Li-ion batteries could for example explode or catch fire if over-charged
(ibid.).

3
 Investigated E-bike producers: EcoRide, Batbike, Sjösala, Crescent, Lifebike, BionX, Easy Motion USA,
Apollo, Monark, e-Victoria, MyEco and Kalkhoff.
 15
4. Background

4.2.2 Electric motor and motor control
An electrical motor is usually composed of a stator and within it a rotor. The design of the
rotor and stator varies depending on motor technology. What all have in common is that a
varying magnetic field within the machine is needed for continuous rotation. One type of
motor that has been used since the early days of E-bikes is the brushed Direct Current (DC)
motor (Bolton, 1895). In that machine, the rotating magnetic field is created by pole-
switching every half turns by means of a brush between the stator and the rotor (Morchin &
Oman, 2006, p. 112). However, this design has some drawbacks; the brush will eventually
wear out and the efficiency is low due to resistive losses from the brush (ibid.).

Today, there are many different types of motors on the market but the one commonly used in
E-bikes is Brushless DC motors (BLDC) (Muetze & Tan, 2007). The efficiency of BLDC is
higher than the brushed variant thanks to the lack of a brush and that Permanent Magnets
(PM) is used for magnetisation instead of current through coils (Muetze & Tan, 2007;
Morchin & Oman, 2006, p. 115). A drawback with the BLDC motor is that needs more
advanced motor control than the brushed motor type (Sandqvist, 2014). The short overview of
the twelve E-bike producers mentioned in section 4.2.1 also showed that ten producers stated
the motor technology used and nine out of them were BLDC motors.

The motors may be equipped with internal gears, or not, depending on design. Gears are used
to reduce the motor speed from motor to wheel. Geared BLDC motors are commonly used on
cheaper E-bikes as high efficiency is easier — and cheaper — to obtain with high motor
speeds (Morchin & Oman, 2006). More expensive E-bikes may use gearless BLDC motors
that are more expensive to build and control. The benefit of gearless drive is lower noise and
no wear on internal gears. The efficiency of BLDC motors for E-bike applications is typically
around 80% (Starschich & Muetze, 2007; Morchin & Oman, 2006, p. 33). A new motor type
that has shown efficiency up to 90% in E-bikes is the transverse flux machine (Pompermaier,
et al., 2012). This is however a new type of motor that not only costs more to produce but also
requires even more complex control than the BLDC machine (ibid.) which makes the system
more expensive (MyEco, 2014).

How the motor is controlled varies with manufacturers. Typically, the E-bike producers
incorporate a control panel from which the user can turn on or off the electrical assist and set
the power level of the motor. On cheaper E-bikes, a cadence sensor is used to identify if the
pedals are spinning or not (Electricbike.com, 2013). If they are, the motor is turned on with a
constant power level set by the user or controlled by a manual throttle (ibid.). This control
strategy means that the E-bike can go without any force provided by the rider as long as the
pedals are spinning. On more expensive E-bikes, a torque sensor is used to add electrical
power proportional to what the rider puts in (ibid.). This results in lower total energy
consumption and a more intuitive handling than using a cadence sensor (ibid.). The
manufacturer Bosch for example, uses torque sensors in their E-bike drivelines (Bosch, 2014).

16
4. Background

Their ratios of electric power to human can be set from 0.3:1 to 2.75:1 with a 1:1 ratio being
the normal setting (ibid.). A 1:1 ratio means that the electric motor will provide equal amount
of power as the rider. A third control strategy used is that the motor controller tries to reach a
speed reference set by the user (EcoRide, 2014). The electric efficiency of the control system
is unknown for most commercial E-bikes but one team that built an E-bike for research
purposes reported efficiency above 94% (Spagnol, et al., 2012).

4.2.3 Human power input

 Figure 9. Example of the human endurance and power output while pedalling. Equation used from
 Morchin and Oman (2006).

The power provided by the rider is highly individual. An example of human power output
during heavy pedalling is shown in Figure 9. More than 500 W may be supplied by a well-
trained cyclist during short periods of time (
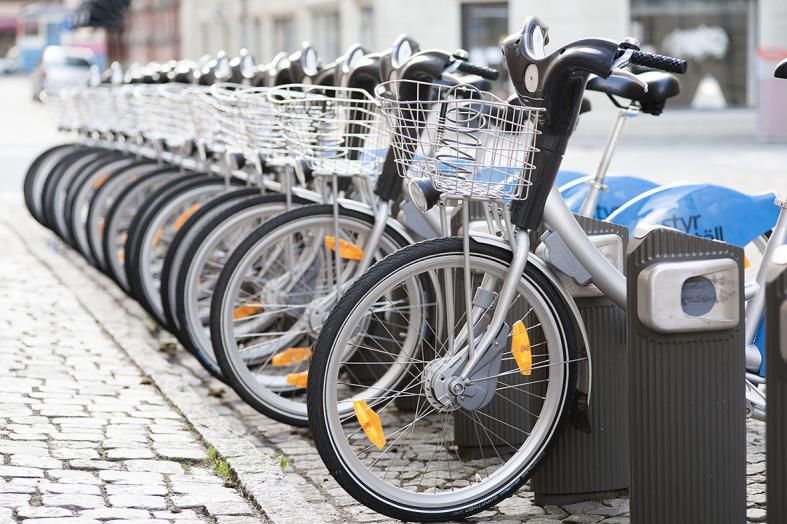
4. Background

 Figure 10. Example of BSS bikes and docking spaces. Source: Own work.

The characteristics of the bicycles are usually that they are sturdy unisex models, with a
basket in the front or a rack for bags or other light goods (see Figure 10). The docking spaces
are used to lock the bikes when they are not in use (Figure 10). Docking is usually performed
by simply holding the bike against the docking pole and locking is performed automatically.
The purpose of the terminal is from a user perspective to provide all necessary information
about the system including check-in and payment functionality. The presented information
can be how to check in and out bikes, how to pay or register, where the nearby stations are
located and if there are available docking spaces or not. When a customer wants to start a
journey, he or she register at the terminal and one of the bikes unlocks. Check-out
functionality may be built into the docking poles as well.

As BSS are designed to provide flexible means of transport for many people, there is usually
an economic incentive in place to discourage people to use the bikes for a long period of time.
One example of pricing is the BSS Styr & Ställ Gothenburg. The first 30 minutes are free for
yearly subscribers and the cost of going into the next 30 minutes period is 10 SEK, the next-
coming 20 SEK and thereafter 40 SEK per half hour (JCDecaux, 2014). To sign up for one
season (1st of March to 31th of November) costs 75 SEK if you connect your account to your
public transport card (ibid.).

The terminals also play an important role for the operators. They keep track of when a user
starts and stops a trip in order to bill for the correct amount of time. Another important
indicator is the load factor, i.e. the number of bicycles per docking space. As the rides are
inhomogeneous during the day, there will be stations that becomes empty or full of bikes.
Both will cause problems for the user that either may want to use a bike and not finds one
available, or want to return one and find the station full. To overcome this problem, the
terminal sends information on the station's load factor to the operator's server. They can then
use this information as decision support on how, when and where to redistribute bikes.
Redistribution is mainly performed by flatbed trucks or vans with trailers (ITDP, 2013, p.

18
4. Background

112). The cost of redistribution is a large share of the operating cost. In the case of
Barcelona's BSS, it accounts for 30% (OBIS, 2011, p. 27). A second method to avoid full
stations — and necessity for a system where bikes move between stations — is to build more
docking spaces than there are bikes. ITDP's bicycle sharing planning guide (2013)
recommends 2-2.5 docking spaces per bike. The figure is based on experiences from different
BSS operators (ibid.). An indicator that can be used to evaluate the performance of one BSS
compared to others is the number of trips per bike and day. Table 3 shows usage statistics for
six different cities. There is a wide range of usage where Gothenburg being one of the lowest.
The usage is dependent on many factors such as pricing and station locations.

Table 3. Average number of trips per day and bike for a few cities with large-scale BSS (ITDP,
2013, p. 150; Trafikkontoret, 2012).
 City Trips per bike and day
 Gothenburg 1.3 (data only from 2012)
 London 3.1
 Paris 6.7
 Barcelona 10.8
 New York City 8.3
 Washington, D.C. 2.4

The current BSS in Gothenburg is not operating the whole year. Their current operating
season is from March 1 to December 31 (JCDecaux, 2014). This operational strategy is
utilised around Europe in other cities with cold climate wintertime (OBIS, 2011, p. 31).

The total cost of a BSS varies depending on for example system design, pricing and operation.
Two cities whose BSS profits differ a lot are London and Paris. The city of London subsidised
their BSS, Barclays Cycle Hire, with about 118 million SEK in 2012. During the same year,
Paris had a profit of 139 million SEK (Gladdis, 2013).4 The reason for the success in Paris
may be that the operator has landed a better sponsorship deal (ibid.) and that the system is
used twice as much as London's system (see Table 3).

For large-scale BSS in Europe, it is estimated that the total investment cost is around 22 000-
27 000 SEK per bike (OBIS, 2011, p. 26).5 The largest share is the cost of building the
stations (ibid.). In Barcelona for example, it accounted for 70% (ibid.). This share includes the
cost of buying and installing the stations including all docking points and terminals. The
second largest share of the investment cost is purchasing the bikes. In Barcelona, the bike
investment accounted for 17% of the investment cost (OBIS, 2011, p. 26), i.e. approximately
1 900-3 100 SEK per bike with the average European investment cost from above.

4
 Conversion rate £1=10.75 SEK (2014-03-05)
5
 Conversion rate €1=8.84 SEK (2014-03-05)
 19
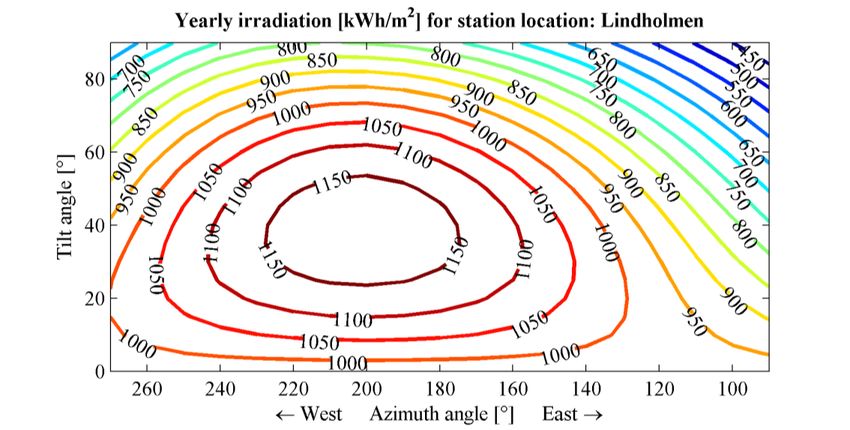
4. Background

When the system is up and running, there are operational costs such as redistribution and
maintenance. The estimated operating cost for European BSS is about 13 000-22 000 SEK per
bike and year (OBIS, 2011). The largest share of that being redistribution, followed by bike
and station maintenance and administration (ibid.). Another factor that is important to
consider in BSS is the health impact from cycling. Several studies have found the benefit of
cycling to outweigh its risks (Oja, et al., 2001; de Hartog, et al., 2010; Rojas-Rueda, et al.,
2011). Rojas-Rueda et al. (2011) estimate that the BSS in Barcelona reduces mortality by
about 10-12 deaths/year. The main factor behind that was increased physical health of the
users (ibid.). The health benefits of using BSS have been acknowledged by the city of Boston,
which launched a program to prescribe subsidised subscription to the town's BSS to fight
obesity (Malamut, 2014).

4.3.1 Taking the leap from BSS to E-BSS
Using E-bikes in a BSS (E-BSS) could enable longer and hillier rides as the rider's effort is
reduced. The stations could thus be placed further away from the city centre and encourage
commuting by E-bikes in places BSS do not cover today. This would lead to a shift from
other modes of transport available such as car or bus. The stations of E-BSS would be
different to regular BSS. From a user perspective, the main difference would be E-bikes
instead of regular bikes, but from an operator's perspective; much is changed. First of all, the
E-bikes need to be charged, each docking space must thus be equipped with charging ability
and a battery management system. If the E-bikes would have enough charge it could be
possible to include some docking poles without charging ability as a means to reduce the cost.
The poles must be designed in a safe way so that no voltage is applied to reachable parts in
the docking pole. The terminal must also take the SOC of the E-bikes into consideration to
ensure that the battery capacity is enough for the next trip. (This can of course be debated. An
E-bike can be used as a regular bicycle if no power is available so it is a question of user
experience.) The use of E-bikes also opens up for some interesting possibilities, as power is
available on the bike. This can for example be to power a GPS to enable tracking of stolen
bicycles or to gather data on speed and location for system optimisation and travel pattern
research.

20
5. Methodology for calculations on a solar powered E-bike sharing pool

5. Methodology for calculations on a solar powered E-bike
 sharing pool
This chapter presents the methodology on how the system calculations are performed. It starts
with solar power calculations in section 5.1, followed by E-bike calculations in section 5.2
and a combined system model in section 5.3.

5.1 Solar energy calculations
It is important to define a coordinate system that can be used consistently to be able to keep
track of the position of the solar panel relative the sun and the urban surrounding.

 Figure 11. Definition of angles between the sun and a solar panel. γ indicates azimuth angles (0° is
 north and 90°, east); αsun is the altitude angle of the sun and αpanel the tilt angle of the panel, both
 relative horizon; αi is the angle of incidence between the direct irradiance and the solar panel's
 normal and θzenith is the zenith angle (i.e. 90°- αsun).

Figure 11 defines all the important angles for the sun and a solar panel. γpanel and γsun notes the
azimuth angle of the panel and the sun respectively, both are defined as 0° to north and 90° to
the east; αpanel and αsun notes the angle relative ground for the panel and the sun respectively;
αi is the angle of incidence between the sun's direct irradiance and the normal of the solar
panel and last is the zenith angle, θzenith, which indicates the angle between zenith and the sun.
The equation to calculate the angle of incidence is shown in Appendix 2, Equation A2.1.

5.1.1 Irradiance data
Data of irradiance can either be obtained by ground or satellite measurements. Most of the
irradiance used in this report comes from SoDa, a provider of irradiance and meteorological
data (SoDa, 2014). Their data is derived from satellite measurements that are processed into
different irradiation databases. The one used in this report is called HelioClim-3 (or HC3) and
shows the hourly irradiation for all different irradiance components presented in Table 1
starting from 1st of February 2004 to 31st of December 2005. The data is constructed in such

 21
You can also read