Utility-scale renewable energy 2019 Market Intelligence Report - GreenCape
←
→
Page content transcription
If your browser does not render page correctly, please read the page content below
Utility-scale renewable energy

  2019
  Market Intelligence Report

Utility-Scale Renewable Energy: Market Intelligence Report 2019   i
ii Utility-Scale Renewable Energy: Market Intelligence Report 2019
GreenCape
GreenCape is a non-profit organisation that works at the interface of
business, government and academia to identify and remove barriers to
economically viable green economy infrastructure solutions. Working in
developing countries, GreenCape catalyses the replication and large-scale
uptake of these solutions to enable each country and its citizens to prosper.

Acknowledgements
We thank Jack Radmore and Ian Scrimgeour for the time and effort that went
into compiling this market intelligence report.

Disclaimer
While every attempt has been made to ensure that the information
published in this report is accurate, no responsibility is accepted
for any loss or damage to any person or entity relying on any of the
information contained in this report.

Copyright © GreenCape 2019

This document may be downloaded at no charge from
www.greencape.co.za. All rights reserved.

Subscribe to receive e-mail alerts or GreenCape news, events,
and publications by registering as a member on our website:
www.greencape.co.za

18 Roeland Street, Cape Town, 8001, South Africa

Authors:                Jack Radmore and Ian Scrimgeour
Editorial and review:   Bruce Raw, Mike Mulcahy, Salomé Bronkhorst,
                        and Nicholas Fordyce
Images:                 GreenCape, Jeffrey Barbee, Abengoa Solar,
                        and Nicholas Fordyce
Layout and design:      Tamlin Lockhart Art Direction

Utility-Scale Renewable Energy: Market Intelligence Report 2019                 iii
Contents

Executive summary                                                                                           1
What’s new?                                                                                                 3
1. Introduction and purpose                                                                                 4
2. Sector overview                                                                                          6
   2.1. Context                                                                                             6
   2.2. 2018 Integrated Resource Plan (IRP 2018)                                                            9
   2.3. The REIPPPP                                                                                       14
   2.4. Key players                                                                                        18
   2.5. REIPPPP market size                                                                                18
		       2.5.1. Economic value of renewable energy facilities                                              18
		       2.5.2. Investments made to date                                                                   21
		       2.5.3. Allocations of generation capacity                                                        22
		       2.5.4. Future pipeline based on IRP 2018 allocations                                             22
   2.6. Economic development through the REIPPPP                                                          23
3. Policies and regulation                                                                                26
   3.1. Guiding policies                                                                                  26
   3.2. Government departments involved in the energy and electricity sector                              28
   3.3. Energy regulation                                                                                 28
4. Opportunities and barriers                                                                             30
   4.1. Emerging opportunities                                                                             31
		       4.1.1. Bid Window 5 of the REIPPPP                                                                31
		       4.1.2. Manufacturing potential                                                                   32
		       4.1.3. Municipalities exploring the option to procure from IPPs                                  34
		       4.1.4. Refinancing of REIPPPP Bid Windows 1-4                                                    36
   4.2. Market uncertainties                                                                              39
		       4.2.1. Ensuring continuity and transparency                                                      39
		       4.2.2. Maintaining the country’s existing manufacturing base                                     39
		       4.2.3. Reforming the country’s electricity sector                                                39
5. Funding and incentives                                                                                 42
   5.1. General database web page                                                                         42
		       5.1.1 Green finance database                                                                     42
		       5.1.2 Government funding and incentive database                                                  42
		       5.1.3 Finfind database                                                                           42
		       5.1.4 AlliedCrowds database                                                                      42
6. The Western Cape: Africa’s greentech hub                                                               44
7. GreenCape’s support to businesses and investors                                                        48
8. References                                                                                             52

iv                                             Utility-Scale Renewable Energy: Market Intelligence Report 2019
List of acronyms
                 and abbreviations
AUW		         African Utility Week
BW		          Bid window
CAGR		        Compound annual growth rate
CCA		         Customs controlled area
COD		         Commercial operation date
CPUT		        Cape Peninsula University of Technology
CSIR		        Council for Scientific and Industrial Research
CSP		         Concentrated solar power
DBSA		        Development Bank of Southern Africa
DEA		         Department of Environmental Affairs
DoE		         Department of Energy
dti			        Department of Trade and Industry
EAF		         Energy availability factor
ED			         Economic development
EKF		         Danmarks Eksportkredit (Denmark Export Credit Agency)
EPC		         Engineering, procurement and construction
ERA		         Electricity Regulation Act, No 4 of 2006
ETI		         Employment tax incentive
GWp		         Gigawatt peak
ICN 		        International Cleantech Network
IDC		         Industrial Development Corporation
IDZ		         Industrial Development Zone
IEA		         International Energy Agency
IEP		         Integrated Energy Plan
IFC		         International Finance Corporation
IPP		         Independent Power Producer
IPPO		        Independent Power Producers Office
IRP		         Integrated Resource Plan
kWh		         Kilowatt-hour
LNG		         Liquefied natural gas
MCSA		        Minerals Council South Africa
MWp		         Megawatt peak
NDP 		        National Development Plan
OEM		         Original equipment manufacturer
O&M		         Operation and maintenance
PCE		         Portfolio Committee on Energy
PPA		         Power purchase agreement
PV			         Photovoltaic
RE			         Renewable energy
RECP		        Renewable Energy Cooperation Programme
REIPPPP       Renewable Energy Independent Power Producer Procurement Programme
RMB		         Rand Merchant Bank
SAPVIA        South African Photovoltaic Industry Association
SARETEC       South African Renewable Energy Technology Centre
SAWEA         South African Wind Energy Association
SED		         Socio-economic development
SEZ		         Special Economic Zone
SIPs		        Strategic infrastructure projects
SSEG		        Small-scale embedded generation
VRE		         Variable Renewable Energy

Utility-Scale Renewable Energy: Market Intelligence Report 2019                   v
List of figures

Figure 1:
Timeline of RE in the South African context                                                                5
Figure 2:
Key utility RE movements in SA to date                                                                     7
Figure 3:
Policy adjusted IRP draft 2018                                                                            10
Figure 4:
Governance structure of IPP office                                                                        16
Figure 5:
IPP office procurement process                                                                            16
Figure 6:
Tariff decline and MW awarded in 4 Bid Windows                                                            17
Figure 7:
Typical company types involved at different stages of project life                                        18
Figure 8:
Countries from where private investments were made in the REIPPPP                                         21
Figure 9:
Policies guiding South Africa’s economic growth trajectory                                                26
Figure 10:
Eco-system of policies relating to the REIPPPP                                                            27
Figure 11:
Eskom week on week EAF for 2016, 2017 and 2018                                                            32
Figure 12:
Average Tariff (R/kWh) decline of Solar PV and Wind in the REIPPPP                                       36
Figure 13:
GreenCape’s focus areas                                                                                  49

vi                                            Utility-Scale Renewable Energy: Market Intelligence Report 2019

List of tables

Table 1:
Additional drivers affecting the private market                                9
Table 2:
Capacities for least cost plan by year 2030                                   13
Table 3:
Capacities for least-cost plan by 2030 with annual build limits on RE         13
Table 4:
Market movements in the REIPPPP                                               14
Table 5:
IRP 2010, IRP 2018, determinations to date in MW                              15
Table 6:
Status of remaining REIPPPP projects                                          17
Table 7:
Tariffs offered by solar PV, wind and CSP projects over bid windows [R/kWh]   21
Table 8:
Actual procured generation capacities per REIPPPP bid window                  22
Table 9:
Future pipeline based on IRP 2018 allocations                                 22
Table 10:
Economic development through the REIPPPP BW 1-4                               24
Table 11:
Procurement outstanding based on IRP adjustments                              30
Table 12:
Local solar PV manufacturing                                                  33
Table 13:
Key players in wind tower manufacturing/construction located in SA            34
Table 14:
Average Debt funding as percentage of Total Funds                             37
Table 15:
Split in debt and equity REIPPPP BW 1-4                                       38
Table 16:
Commercial Operation Date BW1-3                                               38
Table 17:
Lead financiers BW1-4                                                         38
Table 18:
Lead equity investors BW1-4                                                   39

Exchange rate used:
1 USD = R14.29 (December 2018)

Utility-Scale Renewable Energy: Market Intelligence Report 2019               vii
Executive summary
           The South African energy mix is primarily made up of coal assets
      because of limited technology options in the past, and due to South Africa’s
    abundant supply of the commodity. The South Africa Minerals Council’s National
      Coal Strategy for South Africa ranks the country seventh in the world, with
        253 million tonnes extracted in 2016 (MCSA 2018). Coal power currently
      represents over 90% of the total electricity mix, with the remainder covered
                by nuclear, hydro and most recently, renewable energy.

South Africa (SA) still has a single utility                            expedited rounds coming in at less than R0.62/
electricity model where a single entity (Eskom)                         kWh. Each bid window has also seen a major
owns and operates generation, transmission and                          oversubscription in tender submissions from
a share of distribution infrastructure. This model is                   numerous local and international developers
designed to aid developing energy markets that                          and investors.
require significant long-term (10-15 years)
infrastructure investments and demand balancing.                        To date, the programme has attracted more than
However, the applicability of this single utility                       R200 billion in investment, of which R48.7 billion is
model is changing rapidly in a global context with                      foreign equity and financing activities.
the introduction of new technologies, which are
cheaper, modular, capable of being decentralised                        The latest Integrated Resource Plan (IRP) 2018
and more environmentally friendly. SA is in the                         allocations indicate 8 100 MW for wind, 5 670 MW
early stage of this transition on the back of a                         Solar Photovoltaic (PV) and 2 400 MW of
large-scale renewable energy (RE) rollout.                              small-scale embedded generation (SSEG) to be
                                                                        procured by 2030, which has the potential of
South Africa’s RE market has exploded over the                          attracting in excess of R200 billion in the next 12
last eight years after the inauguration of the                          years. Using an indicative R/MW overnight capital
Independent Power Producers Office (IPPO) in                            cost per technology, the approximate market
2010. The IPPO, with the support of the                                 value per technology based on IRP 2018
Department of Energy, has procured 6 376 MW of                          allocations is R88 billion (for solar PV), R142 billion
energy to date 1. This has been managed through                         (for wind) and R30 billion (for SSEG).
six bid rounds in the large Renewable Energy
Independent Power Producers Procurement                                 The timing of procurement will have a major
Programme (REIPPPP) bid windows, and through                            impact on manufacturing and pricing in the
two bid rounds in the small REIPPPP. Of the                             market. A consistent annual allocation will attract
projects procured, 3 772 MW (Draft IRP 2018) are                        international developers, manufacturers and
operational, while 20 projects from the small                           increase competitiveness, which in turn will
programme are waiting on Power Purchase                                 decrease the tariffs bid. Indications are that
Agreement (PPA) signatures. The National                                prices as low as R0.46/kWh and R0.56/kWh for
Department of Energy (DoE) has determined a                             solar and wind can be expected by 2030.
total of 14 725 MW of RE, which allows for another
8.3 GW of procurement to still occur.                                   With a growing energy market and an increase in
                                                                        the number of IPPs, a secondary market for
The REIPPPP has been lauded globally for its                            refinancing and equity buyouts has emerged.
clear mandate, growth path and independence in                          Institutional investors seeking 20-year stable
its procurement approach. This is clearly                               returns and larger IPPs looking to develop their
illustrated through a tariff decline of more than                       asset management businesses are able to
150% over five years, with the levellised cost of                       reassess project risk after 2/3 years of operations
electricity for wind and solar in the most recent                       and exit clauses have expired.

1
    IPPO presentation to the Parliamentary Portfolio Committee on Energy (PCE) on 6 March 2018.

1                                                                Utility-Scale Renewable Energy: Market Intelligence Report 2019
There are further opportunities related to                   Lastly, the introduction of wheeling frameworks
decreasing battery prices and growth in Variable             within municipalities and potential for energy
Renewable Energy (VRE) as a percentage of the                trading is improving the viability of utility-scale
total energy mix. There is an opportunity for                RE projects for private and municipal off-take.
utility-scale (load balancing and frequency                  Limitations do however exist in accessing
control), small-scale, and off-grid solutions;               generation licences for projects larger than 1 MW,
however, it remains a relatively small market                whilst public entities (municipalities) require the
opportunity for manufacturing. If battery storage            Energy Minister’s determination to purchase
replaces the allocation of gas in the IRP, there is a        power from private generators.
market of 8.1 GW between 2025 and 2030.
Although the local market remains small, local               The DoE has set the foundation for South Africa
manufacturing to provide battery storage for                 to become a global leader in transitioning to RE,
both grid services and utility-scale storage may             and a technology and innovation hub for the
represent a viable opportunity – if manufacturers            continent. The next five years are critical to
access other markets from a South African base.              demonstrate intention, ensure stability and
A view on African decentralised power supply                 garner international and local support in a
and electric vehicles will need to support a                 rapidly transitioning energy environment.
manufacturing base in South Africa.

                                                                                                © GreenCape

Utility-Scale Renewable Energy: Market Intelligence Report 2019                                                  2
What’s new?
Since the publication of the 2017 Utility-scale Renewable Energy Market Intelligence Report, there have
been a number of important developments in the sector and in the national government’s Renewable
Energy Independent Power Producers Procurement Programme (REIPPPP). In 2018:
■ a new Energy Minister was appointed;
■ after a long delay, 27 independent power producer projects were signed under Bid Windows 3.5 and

   4 of the REIPPPP;
■ the draft 2018 Integrated Resource Plan was released; and
■ the country started to experience load shedding again, because of coal and nuclear power plant

   maintenance requirements.

This MIR replaces the 2017 report. In addition to updates on the state of the REIPPPP, it highlights:
■ the opportunities for investors arising from Bid Window 5 and the influence of the draft 2018 IRP on

   Bid Window 5 opportunities;
■ the developments around municipalities seeking the option to procure from independent power

   producers; and
■ the opportunity to refinance projects from Bid Windows 1-4.

Notable developments to take note of, include the following:
■ Nuclear energy has intentionally been left out of the energy mix up to 2030.
■ Small-scale embedded generation has been included in energy planning, with 2 400 MW up to 2030.
■ There is a drive for mid-merit power and peaking plants as part of the energy mix.
■ Diminishing utility-scale battery prices and value stacking (frequency and voltage control) are

  supporting their inclusion on a national planning level.

3                                               Utility-Scale Renewable Energy: Market Intelligence Report 2019
1
Introduction and purpose
    This report provides potential investors and businesses in the utility-scale RE
    sector with a greater understanding of market opportunities in South Africa.

Renewables 2018, a report by the International
Energy Agency (IEA), finds that globally the share                Global renewable energy consumption
of renewables in meeting global energy demand                     increased by more than 5% in 2017 – three
is expected to grow by one-fifth in the next five                 times faster than total final energy
years to reach 12.4% in 2023.                                     consumption. In the power sector,
                                                                  renewables accounted for half of annual
Renewables will represent the fastest growth in                   global electricity generation growth, led by
the electricity sector, providing almost 30% of                   wind, solar PV, and hydropower
power demand in 2023, up from 24% in 2017.                        (Renewables 2018).
During this period, renewables are forecast to
meet more than 70% of global electricity
generation growth, led by solar PV and followed              dominating the market, backed by a growing
by wind, hydropower, and bioenergy.                          small-scale embedded generation market (mostly
                                                             solar for commercial and industrial businesses).
A key driver behind this global shift has been
government policy support and procurement                    As shown in Figure 1, the introduction of RE in the
programmes, which most recently include                      South African context dates back to 2003 with
countries such as Mexico, Egypt, Morocco,                    the delivery of the White Paper on RE policy.
Zambia, Ethiopia, Saudi Arabia and Rwanda, with              However, only in 2010 with the release of the
prices dropping as low as R0.33/kWh ($0.024/kWh)             Integrated Resource Plan (IRP) 2010-2030 did the
under competitive processes (Magyari 2017). For              RE framework really start to take shape. The
the first time, renewable capacity additions of 178          purpose of the IRP 2010 was to determine the
gigawatts (GW) accounted for more than two-                  preferred energy mix over the next 20 years. It
thirds of global net electricity capacity growth.            included determinations for RE amounting to 14
Solar PV capacity expanded the most (97 GW).                 725 MW, coal-fired plants of 6 250 MW, and
Meanwhile, onshore wind additions declined for               gas-fired power plants of 3 726 MW.
the second year in a row, and hydropower growth
continued to decelerate. Led by commercial and               Given the large amount of power to be acquired
industrial projects, followed by residential                 from the private sector, the Renewable Energy
applications, the expansion of distributed                   Independent Power Producer Procurement
generation, spurs almost half of global PV                   Programme (REIPPPP) was established to fulfil
capacity growth in the period 2018 to 2023.                  three specific duties: professional advisory
                                                             services, procurement management, monitoring,
The South African renewable energy market is                 evaluation, and contract management.
following a similar trend. Solar PV and wind are

Utility-Scale Renewable Energy: Market Intelligence Report 2019                                                  4
2010-2030
2003 2010 2018 2018
IRP
White Paper Establishment Procured 6.3 IRP
Energy Mix
on RE of IPP office GW of RE 13.7GW RE
(17.8GW RE)
Figure 1: Timeline of RE in the South African context
Following a call for more regulatory and policy In what follows:
certainty, the Draft IRP 2018 has been released Section 2 gives an overview of the market, and
with the aim to determine the preferred energy describes market size and key players.
mix up until 2030. It includes determinations for Section 3 details the general legislative and
additional RE amounting to 13 770 MW, coal-fired regulatory framework governing RE.
plants of 1 000 MW, and gas-fired power plants Section 4 highlights emerging opportunities and
of 8 100 MW. barriers in the market.
Section 5 focuses on funding and incentives.
This report provides potential investors in the Section 6 gives an overview of the Western Cape
utility-scale RE space with a greater as Africa’s growing greentech hub.
understanding of market opportunities in South Section 7 focuses on the free services that
Africa, taking into account the size of the GreenCape provides to its members.
opportunities and the level of risk involved. The
report is compiled for foreign direct and local Note: GreenCape’s Energy Services Market
investors (persons or organisations) that are Intelligence Report explores the energy services
looking to invest directly in the utility-scale RE market, including the embedded generation
green economy through project development, RE market (generation of less than 1 MW),
asset management, equity, debt, equipment and energy efficiency. This market has been
manufacture or support services. excluded from this report.
For enquiries or to access our services,
contact our Renewable Energy Sector Desk
at re@green-cape.co.za.
© Abengoa Solar
5 Utility-Scale Renewable Energy: Market Intelligence Report 20192
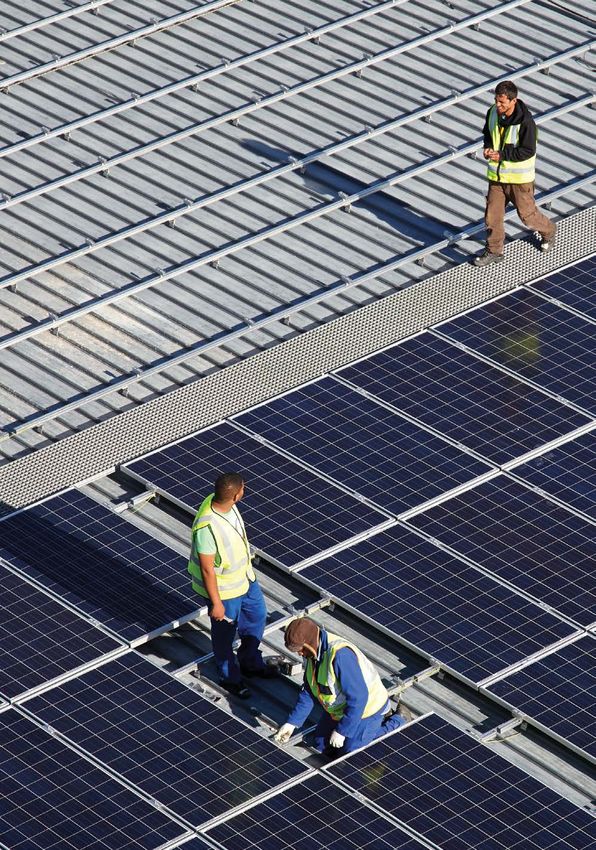
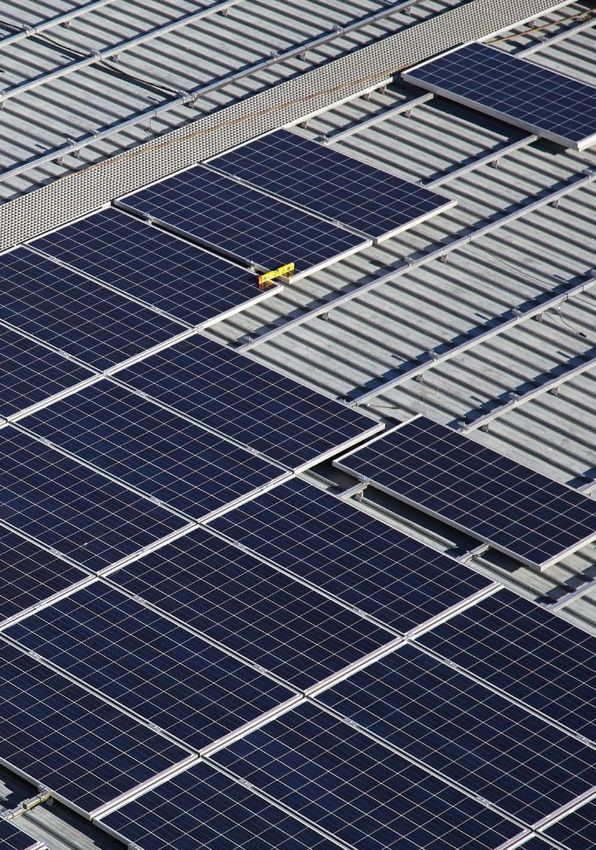
Sector overview
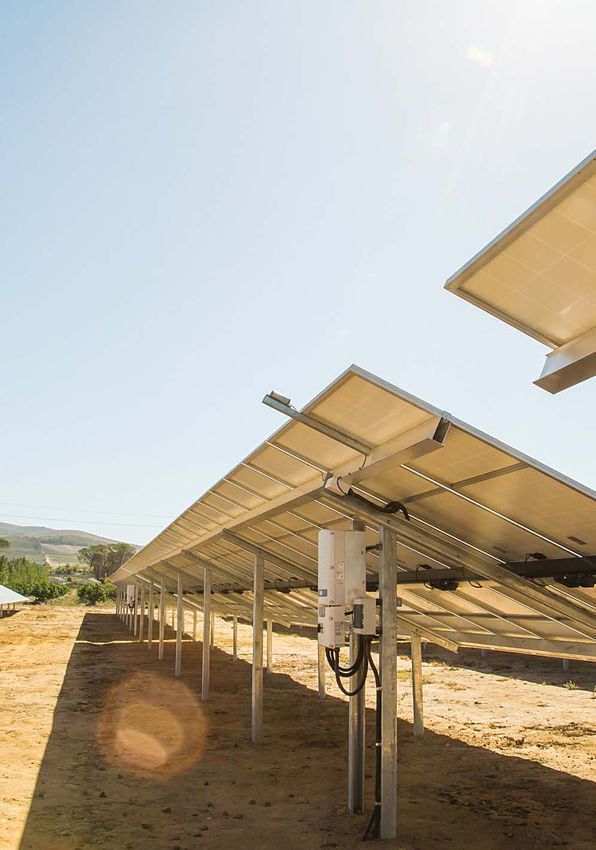
Accounting for nearly 7% of installed capacity, the South African
RE sector is showing rapid growth and significant potential. Every month
new projects reach commercial operation, with over 3 GWp of projects
connected and operational to date.
2.1. Context The significant growth of SA’s RE industry in
South Africa’s nominal capacity is dominated by recent years is the result of several factors:
coal-fired generation stations with a net output ■ Proactive government policy in procuring
of 37.8 GWp, which represents more than 90% of RE capacity;
the country’s total installed capacity of over 45 ■ Increases in electricity tariffs charged by
GWp. Nuclear generation capacity comprises 4% the national utility, Eskom;
of generation capacity, and comes from the only ■ Wind and solar energy competing on a
nuclear generation facility on the African levellised cost of electricity basis with coal
continent, Koeberg power station. RE is a new and nuclear;
sector in SA, with the first commercial utility ■ Establishment of Renewable Energy
projects coming online in 2013. Independent Power Producers Procurement
Programme (REIPPPP);
At the time of writing, 3.8 GW of RE is ■ Offtake guarantees by government, backed
commercially operating (IPPO 2017), of which the by the treasury.
three main technologies are concentrated solar
power (CSP), solar photo voltaic (PV), and wind. Figure 2 and Table 1 below illustrate some of the
key utility RE movements in SA to date, with
additional drivers affecting the market.
© GreenCape
Utility-Scale Renewable Energy: Market Intelligence Report 2019 6Key
Key events
Determinations
Signing events
Minister appointments
Mar-12
Submission Date
BW 2
Mar-14
Nov-12 Submission
Signing of PPA BW 1 Date BW 3.5
2003 Dec-12 May-14
White paper 2nd RE Tina Joemat-
on RE policy Determination Peterson
of RSA 3 200 MW appointed
Energy
Minister
2008 Aug-11 Dec-12 May-13
REFIT 1st RE Coal Domestic Signing of
consultation Determination Determination PPA BW 2 Aug-14
Paper 3 725 MW 2 500 MW Submission
Date BW 4
Aug-13
2009 Nov-11 Dec-12 Submission
COP 15 – Reduce Submission Gas Date BW 3 Nov-14
SA’s carbon Date Bid Determination Submission
emissions by Window (BW) 1 3 126 MW Date –
34% by 2020 Small IPP
Dec-12
2010 COGEN Dec-14
IRP 2010 –2030 determination Signing of
800 MW PPA BW 3
2003 2011 2012 2013 2014
– 2010
Figure 2: Key utility RE movements in SA to date
7 Utility-Scale Renewable Energy: Market Intelligence Report 2019Mar-16
Gas
Determination
600 MW
Apr-16
Cross Border Coal
3 750 MW
May-16
Signing of
PPA BW 3.5 Mar-17
Mmamoloko
Nkhensani Kubayi
appointed Energy
May-16 Minister
Solar Parks
Determination
1 500 MW
Jun-17
Acting Eskom
CEO Koko
Aug-16
Cogen bids due
suspended due to Feb-18
dealings with Jeff Radebe
stepdaughter appointed Energy
Minister
Sep-16
Preferred
Jul-17
bidders COGEN
Acting Eskom Apr-18
Apr-15 CEO Johnny Signing of 27
13 Preferred Dladla IPP projects
Bidders Oct-16 appointed from R4
announced – 2 Coal projects and 3.5
BW 4 announced
863 MW
End August
Central Energy Year of 2019
Aug-18
Jun-15 Fund expected to Release of draft
Coal plants
13 Additional Nov-16 oversee IPPO IRP 2018
schedule for
Bidders – BW 4 Eskom CEO Brian shutdown and
8 100 MW as/
Molefe resigns maintenance
Diesel
Sep-17 8 100 MW Wind, 5
Aug-15 Announcement to 670 MW Solar, 2
3rd RE Dec-16 sign BW 3.5, 4 by 400 MW SSEG End 2019
Determination Imported Hydro end Oct. Projects Koeberg
6 300 MW Determination under 77c/kWh Maintenance
2 609 MW – approximately
End 2018
Power 1 year 2 GW
Dec-15 Oct-17 requirement for
COGEN Dec-16 David Mahlobo 2019 scheduled
determination Coal RFP appointed Energy maintenance.
1 000 MW issued Minister Coal and Nuclear
2015 2016 2017 2018 2019
Utility-Scale Renewable Energy: Market Intelligence Report 2019 8Table 1: Additional drivers affecting the private market
Date Movement
October 2016 Adoption of Smart Meter Specifications – NRS049-2
December 2016 CSIR Energy Centre Report highlights the actual tariffs from REIPPPP and Coal
IPP showing how cheap RE builds have been. Solar – R0.62/kWh; Wind – R0.62/
kWh; Coal – R1.03/kWh
January 2017 Reason for not signing IPPs announced by the Minister of Energy – decreased
growth below 2%, resulting in lower demand for electricity.
April 2017 Western Cape High Court Judgement nullifies government’s nuclear agreements
for failing to consult public and undertake due processes.
Minister of Energy decides to review all determinations after nuclear judgement.
This is one of the main reasons for no response on municipal section 34 requests.2
July 2017 City of Cape Town files court application to purchase from IPPs
Sep/Oct 2017 Public consultations for Atlantis Special Economic Zone (SEZ) for Green
Technologies
Dec 2018 Launch of Atlantis SEZ for Green Technologies, with national Department of Trade
and Industry (the dti) encouraging greentech investment through incentives.
2.2. 2018 Integrated Resource energy, with the bulk of new generation
Plan (IRP 2018) coming from PV, liquefied natural gas (LNG)
The IRP, developed by the national DoE, serves as and wind. The policy adjusted scenario is shown
primary plan for new-build power generation. in Figure 3 below.
When originally drafted in 2010, it was intended
to be updated every two years. Since 2010, there It is worth noting that the new coal capacity
have been several draft revisions but as yet no
in the plan was not in the least cost modelling,
updated IRP has been officially adopted. The IRP
but was added based on projects procured
generally considers several scenarios, with the
through the coal-to-power IPP process. While
policy adjusted IRP being the primary plan.
this would create a concerning break in RE
projects if implemented in its proposed form,
The latest revision, IRP 2018, has gone through a it also shows a commitment to the IPP
public comment process and a final version is programme and gives credibility to the value
expected to be published early in 2019. This draft of government’s commitments.
marks a significant shift towards renewable
2
2
A Section 34 request entails a request for the Minister of Energy to make a determination against the IRP for the procurement of
energy generation as detailed under section 34(1) of the Electricity Regulation Act, 2006 (Act No 4 of 2006).
9 Utility-Scale Renewable Energy: Market Intelligence Report 2019Other
Gas/ (cogen, Distributed
Coal Nuclear Hydro Storage PV Wind CSP
Diesel biomass, Generation
landfill)
Current 37149 1860 2100 2912 1474 1980 300 3830 499
2019 2155 244 300 Allocation
to the
2020 1433 114 300 extent of
2021 1433 300 818 the short
term
capcity and
2022 711 513 400 1000 1600
energy gap
2023 750 1000 1600 500
2024 1860 1600 1000 500
2025 1000 1600 500
2026 1600 500
2027 750 1600 2000 500
2028 1000 1600 500
2029 1575 1000 1600 500
2030 2500 1000 1600 500
Total
Installed
Capacity 44381 3720 4600 5000 8288 17742 600 6830 499 4000
by 2030
(MW)
Source: Adapted from DoE (2018)
Installed capacity
Committed/Already contracted
New capacity
Extension of Koeberg plant life
Distributed generation capacity for own use
Figure 3: Policy adjusted IRP draft 2018
The draft also makes a strong statement towards procurement closer to 2024. The impact of
encouraging local manufacturing. By forcing adding build limits to the least cost scenario can
annual build limits on PV and wind, i.e. the be seen in Table 3. The annual build limits bring
maximum limit of a specified technology that can forward PV procurement from 2027 in Table 2
be built in a given year, the plan brings (no build limits) to 2024, Table 3.
Utility-Scale Renewable Energy: Market Intelligence Report 2019 10© GreenCape 11 Utility-Scale Renewable Energy: Market Intelligence Report 2019
Utility-Scale Renewable Energy: Market Intelligence Report 2019 12
Table 2: Capacities for least cost plan by year 2030

 Year                PV (MW)             Wind (MW)                Gas                     Landfill
                                                                  (CCGT/                  Gas
                                                                  CC-GE/                  (MW)
                                                                  OCGT) (MW)
 2020

 2021

 2022

 2023

 2024

 2025                                                             2 380

 2026                                                             750                     250

 2027                2 290                                        1 480

 2028                1 640               2 500                    2 200

 2029                2 180               2 800                    2 200

 2030                1 710               3 700                    1 930

 Total               7 820               9 000                    10 940                  250

Table 3: Capacities for least-cost plan by 2030 with annual build limits on RE

 Year                PV                  Wind                     Gas                     Landfill
                     (MW)                (MW)                     (CCGT/                  Gas
                                                                  CC-GE/                  (MW)
                                                                  OCGT (MW)
 2020

 2021

 2022

 2023

 2024                1 000

 2025                1 000               1 600

 2026                1 000               1 600                    2 380

 2027                1 000               1 600                    1 650

 2028                1 000               1 600                    1 950

 2029                1 000               1 600                    3 000                   250

 2030                1 000               1 600                    1 800

 Total               7 000               9 600                    10 780                  250

13                                               Utility-Scale Renewable Energy: Market Intelligence Report 2019
2.3. The REIPPPP
The South African utility-scale RE model, which has evolved since 1998, can be divided into
four phases (derived primarily through policy and competition). Key policy movements are
summarised in Table 4 below.
Table 4: Market movements in the REIPPPP
Initiation Market Transition Consolidation
Development
Pivotal RE policy Programme Bid Window 1-2 Bid Window 3-4
Movements uncertainty development [nascent market [competitive
– high returns] market]
Timeline 1998 – 2008 2009 – 2010 2011 – 2013 2014 – Present
1998 White paper 2009 – 2011 – DOE abandon Nuclear debate
on Energy Renewable REFIT for
Energy feed-in- competitive tender
tariff (REFIT) process
phase 2 launched
by NERSA
2003 White 2009 – COP 15 2011 – 1st Delay in Bid Window
paper on RE commitments Determination: 3 725 4 (BW4)
MW announcement
2007/08 Load IRP 2010 – 2030 Aug 2011 – Issue of Job losses as a
shedding REIPPPP RFP result
2008 – REFIT 2010 – Nov 2011 – Bid April 2018 – Sign
draft guidelines Establishment of submission period BW4
issued by NERSA IPP office
Government 2008 – Eskom Dec 2011 – Preferred August 2018 –
Solar hot water bidder Updated IRP
rebate Announcement
programme
2008 – Energy 11 Dec 2011 – COP 17 Nov 2018 -
Act enacted in Durban Suggestion of BW5
announcement
2008 – 2012 – 2nd
Commissioning determination – 3
of Darling Wind 200 MW
Farm
Nov 2012 – Signing
of PPA BW1
May 2013 – Signing
of PPA BW2
Utility-Scale Renewable Energy: Market Intelligence Report 2019 14The REIPPPP came about after a number White Paper on RE, by which the government set
of policy movements and programme a target of 10 000 GWh RE consumption by 2013,
refinements. These include the IRP 2010-30, and in 2009 when NERSA approved the policy
the establishment of the IPP office and and tariffs for a REFIT programme.
cancellation of the REFIT programme.
Nevertheless, the 2011 promulgation of the IRP
The introduction of RE into national energy issued by the Department of Energy (DoE)
planning extends as far back as the 1998 White had the greatest impact on the RE sector.
Paper on the Energy Policy of South Africa. The Government set a target of 17.8 GW of new
policy committed to encouraging private sector power generation capacity (Table 5) to be
participation, competition and open, non- delivered through RE technologies, and
discriminatory access to the transmission system. abandoned the REFIT programme for a
The sector was further supported in 2003 with the competitive RE tender approach.
Table 5: IRP 2010, IRP 2018, determinations to date in MW
IRP 2010 – 2030 Policy 2018 updated plan
Adjusted
Solar 8 400 8 288
Wind 8 400 17 742
CSP 1 000 600
SSEG 4 000
RE goal 2030 17 800 30 630
Determinations to date
1st Determination 3 725
2nd Determination 3 200
3rd Determination 6 300
Solar Parks Determination 1 500
Determined to date 14 725
The major concern with the establishment of a Treasury (NT) and the Development Bank of
~R560 billion3 programme was to ensure fair Southern Africa (DBSA) in 2010. A memorandum
competition and independence, free from undue of agreement (MoA) was concluded between the
influence. With all previous generation, parties, and the DBSA was directed to support
transmission and equitable share of distribution the establishment of the Independent Power
managed by Eskom, the programme had to have Producer (IPP) office. In 2016, the MoA was
a very clear separation of powers. extended for a further three years.
Central to SA’s RE programme was the The IPP office is housed in the DBSA, which
establishment of the Independent Power oversees staff, operations and procurement of
Producers Procurement Programme (IPPPP) by consultants’ goods and services. Initial funding
the DoE (illustrated in Figure 4 below), National was provided as a loan recoverable at financial
3
Weighted capital cost of 6 422 MW (R31 438 804/MW)*17.8 GW
15 Utility-Scale Renewable Energy: Market Intelligence Report 2019close. The office is an agent of the DoE and is The IPP office operates at arms-length from
mandated to procure whilst National Treasury, government and is self-funded through a 1%
through the Government Technical Advisory project fee paid by IPPs. The office is not a juristic
Centre, manages the IPP office account. National person under the MoA, which ensures its
Treasury also provides a guarantee to back the independence from government departments.
obligations of Eskom in terms of the Power
Purchase Agreements (PPAs) with the IPPs.
Integrated
Energy Plan &
Integrated
Resource Plan
Guiding National
documents Treasury
Concurrence Development
Department Memorandum Bank of
NERSA given by of Energy of Agreement Southern
Nersa
Africa
Independent
Draft Mandate to Power
determination IPP office Producer
to Nersa Minister to procure Office
of Energy
Figure 4: Governance structure of IPPO
The formation of the IPP Office’s procurement process, Figure 5, has been lauded as one of the key
elements to driving success.
RFP Preferred Grid connection
Bid Financial
(Request for bidder + commercial
Submissions close
proposals) announcement operation
Figure 5: IPPO procurement process
To date, the IPP office has facilitated 6 376 MW There has been four rounds of projects in the
over six Bid Windows and 112 projects under large REIPPPP with a price drop of more than
the REIPPPP. The success of this independent 80% in Solar PV over the last six years, which
mechanism has resulted in a rapid drop in is a testament to the programme’s success
RE prices, and the inclusion of a number of and independence.
international developers, manufacturers and EPCs.
Utility-Scale Renewable Energy: Market Intelligence Report 2019 16Average Tariff (R/kWh) decline MW awarded per Bid Window
4 1600
3.65
3.5 1400
3 1200
2.5 1000
2.18
2 800
1.51 1.17
1.5 600
1.19 0.91
1 400
0.62
0.5 200
0.87 0.75
0 0
Round 1 Round 2 Round 3 Round 4a,b Expedited BW1 BW2 BW3 BW4 BW
Expedited
Wind Solar PV
Solar PV Onshore Wind
Figure 6: Tariff decline and MW awarded in 4 Bid Windows
Figure 6 illustrates the average tariff decline in for each bid window. To date, 6 376 MW 4 has
the wind and solar PV sector over the four bid been procured with the status of the remaining
windows plus expedited round that have been projects shown in Table 6 below.
initiated, together with the megawatts awarded
Table 6: Status of remaining REIPPPP projects (MW)
Programmes Large IPP Small Scale IPP
Rounds Procured Operational Determined Procured Operational Determined
Wind 3 352 1 980 6 360 9
Solar PV 2 287 1 474 6 225 80
Concentrated 600 400 1 200 0
solar power 0 400
Landfill gas 8 0
Small hydro 19 22 540 0
Biomass 52 10
Section 34(1)(a) of the Electricity Regulation Act, No 4 of 2006 (ERA) allows the Minister of Energy, in
consultation with the NERSA, to make Ministerial Determinations for new generation capacity if they
believe that it is required to secure the continued uninterrupted supply of electricity. The Ministerial
Determinations may also outline the type of energy sources from which electricity must be generated.
4
Independent Power Producers Office (IPPO) presentation to the Parliamentary Portfolio Committee on Energy (PCE) on 6 March 2018.
17 Utility-Scale Renewable Energy: Market Intelligence Report 20192.4. Key players maintenance. Accordingly, the key players or
Market opportunities in the REIPPPP are best company types involved in this market are
categorised according to the project described in Figure 7, with an indication of the
development phases that the programme follows: project development stage in which they are
development, construction, operations and typically involved.
IPP: Independent power producer. It is responsible for project inception and development, land
acquisition, finance sourcing and bid submission. May sometimes be a project sponsor or
may submit a bid with the backing of such an entity.
Project stages involved: Project development, project construction, project operation and
maintenance.
OEM: Original equipment manufacturer (OEM). Suppliers of key technology, e.g. the
manufacturer of the selected turbine in a wind farm. This company will play a major role in
dictating the technology partners that will constitute a project and may also play the role
of O&M (see below).
Project stages involved: Project construction, project operation and maintenance.
O&M: Operation and maintenance (O&M) company. It is usually the main equipment supplier or a
technical entity well-versed in the specific technology.
Project stages involved: Project construction, project operation and maintenance.
EPC: Engineering, procurement and construction. Typically, this player is responsible for
managing the various sub-contracts in the construction phase of a project and may also
be involved in the design and development phase of the project.
Project stages involved: Project development, construction and O&M.
Figure 7: Typical company types involved at different stages of project life
2.5. REIPPPP market size 2.5.1. Economic value of renewable
The REIPPPP has attracted investment from energy facilities
prominent global RE project developers and Tier 1 The Council for Scientific and Industrial Research
component manufacturers. It has done so (CSIR) study (CSIR 2015) demonstrates that
because of the growth potential, localisation between January and June 2015, REIPPPP
requirements, the programme’s transparency projects with some 800 MWp and 1 GWp of wind
and strong government support. Global leaders and solar PV respectively, ‘generated up to R4
such as Abengoa, Mainstream Renewable Power, billion more in financial benefits than their cost’.
Jinko, and Canadian Solar, as well as South As projects from more recent rounds of the
African developers such as Pele Green Energy, programme come online, the installed capacity
Aurora Power Solutions and Biotherm Energy, and financial benefits realised will continue to
have entered the market. increase as these projects offer much lower
tariffs and costs (IPPO March 2017) than their
The REIPPPP has attracted more than R200 predecessors (see Table 7).
billion in investments into the South African
economy, of which R48.8 billion have been from
foreign direct investment (FDI). Some of the main
contributing countries are Germany, France, Italy,
Spain, and the USA.
Utility-Scale Renewable Energy: Market Intelligence Report 2019 18© GreenCape 19 Utility-Scale Renewable Energy: Market Intelligence Report 2019
Utility-Scale Renewable Energy: Market Intelligence Report 2019 20
Table 7: Tariffs offered by solar PV, wind and CSP projects over bid windows [R/kWh]

 Programmes            Large IPP                                                                                            Small-scale
                                                                                                                            IPP
 Rounds                Round 1        Round 2             Round 3               Round        Round 4         Expedited      S1         S2
 (AVG R/kWh)                                                                    3.5          a,b

 Wind                  1.51           1.19                0.87                               0.75            0.62           1.15

 Solar PV              3.65           2.18                1.17                               0.91            0.62           1.22       1.01

 Concentrated          3.55           3.32                1.93                  1.8
 solar power

 Landfill gas                                             1.11

 Small hydro                          1.36                                                   1.24

 Biomass                                                  1.65                               1.61                           1.65

2.5.2. Investments made to date                                                       (24.4%, R48.8 billion) investments. The programme
Total investments made in the programme (debt                                         has been successful not only in attracting
and equity) over the past four bidding windows,                                       significant investments but also in attracting
excluding the expedited round, totalled over R200                                     them from a wide variety of investment sources
billion as of March 2017 (IPP Office). This is split                                  (see Figure 8.)
between domestic (75.6%, R151 billion) and foreign

                                             Distribution of foreign investments

                                             Africa         133     1 473

     Middle East and India (Saudi Arabia + India)                 2 571         814

                 Asia (China and Japan + Korea)             1 545         127

                          Great Britain + Europe                 10 592                             25 351

                                              USA                                20 684                      5 161

                                                      0          5 000           10 000    15 000   20 000     25 000    30 000    35 000     40 000

                                                  Equity (R’ million)
                                                  Debt (R’ million)

Figure 8: Countries from where private investments were made in the REIPPPP

21                                                                    Utility-Scale Renewable Energy: Market Intelligence Report 2019
2.5.3. Allocations of generation capacity procured, with later rounds of the programme
Table 8 presents final capacities per round, having to adjust their allocated technology
including the small IPP programme. As the table because of favourable bid prices as well as high
shows, wind and solar PV are the dominant (over-) subscription rates.
technologies in terms of actual capacity
Table 8: Actual procured generation capacities per REIPPPP bid window
Programmes Large IPP Small Scale IPP
Rounds Round 1 Round 2 Round 3 Round 3.5 Round 4 S1 S2
a,b
Wind 639 555 785 0 1 363 5 5
Solar PV 625 414 435 0 813 30 50
Concentrated 150 50 200 200 0 0 0
solar power
Landfill gas 0 0 13 0 0 0 0
Small hydro 0 14 0 0 5 0 0
Biomass 0 0 17 0 25 10 0
A recent update from the IPP Office during the 2.5.4. Future pipeline based on IRP 2018
announcement of REIPPPP Rounds 3.5 and 4a,b, allocations
stated that 59% of the utility scale IPP projects Using an indicative R/MW overnight capital cost
were operational, but none of the small IPP per technology, an approximate market value per
projects were. The IPP office also indicated that technology based on IRP 2018 allocations is
44% of the total RE determination had been depicted in Table 9 below.
procured at the time of the announcement.
Table 9: Future pipeline based on IRP 2018 allocations
Technology Indicative ZAR IRP 2018 new Potential market
(million)/MW cost capacity (MW) value
Solar PV R15.6 million 6 000 R93 billion
Wind R17.5 million 14 400 R252 billion
SSEG R12.5 million 4 000 R50 billion
Utility-Scale Renewable Energy: Market Intelligence Report 2019 222.6. Economic development ■ Local content: capturing as much of the local
through the REIPPPP project spend as possible;
Energy security and investment aside, the ■ Ownership: advancing ownership by black
REIPPPP contributes directly to South Africa’s South Africans and local communities;
broader national development agenda. This is ■ Management control: increasing the presence
both by design and through the willingness of of black South Africans in management of the
industry players who recognise the South African economy;
socio-economic context in which they are ■ Preferential procurement: empowering black-,
developing projects. women- and youth-owned, and small
enterprises;
The REIPPPP’s economic development (ED) ■ Enterprise development: developing small
component accounts for 30% of each tender businesses in local communities and
proposal, while the tariff accounts for 70%. As the stimulating the local economy;
REIPPPP progresses, the tariffs are becoming ■ Socio-economic development: addressing
increasingly competitive, with the range and some of the socio-economic needs of
impact on the overall tender becoming less communities local to projects.
significant. It is therefore becoming more
important to improve the economic development Over the five bid rounds there has been little
objectives below to be more competitive. change between the minimum and target
development objectives, with percentages visible
■ Job creation: focusing on South African in the ED scorecard shown below. The only major
citizens, black South African citizens and change has been the local content requirements
those local to projects; in bid windows 2, 3, 3.5 and 4 shown in Table 10.
© GreenCape
23 Utility-Scale Renewable Energy: Market Intelligence Report 2019Table 10: Economic development through the REIPPPP BW 1 - 4
Bid Windows BW 1 BW 2 BW 3,3.5 and 4
Min Target Min Target Min Target
Job Creation
SA citizens 50% 80% 50% 80% 50% 80%
SA citizens who are black 30% 50% 30% 50% 30% 50%
Skilled black SA citizens 18% 30% 18% 30% 18% 30%
SA citizens from local communities 12% 20% 12% 20% 12% 20%
Local Content
Onshore Wind, CSP with storage, Small 25% 45% 25% 60% 40% 65%
Hydro, Landfill Gas, Biomass, Biogas
Solar PV and CSP 35% 50% 35% 60% 45% 65%
Ownership
Shareholding by black people and/or 12% 30% 12% 30% 12% 30%
black enterprises in the seller
Shareholding by local communities 3% 5% 3% 5% 3% 5%
in the seller
Shareholding by black people 8% 20% 8% 20% 8% 20%
and/or black enterprises in the
construction contractor
Shareholding by black people 8% 20% 8% 20% 8% 20%
and/or black enterprises in the
operations contractor
Management Control
Black top Management 0% 40% 0% 40% 0% 40%
Preferential Procurement
BBBEE Procurement spend - 60% - 60% - 60%
SME and QME (QSE and EME) - 10% - 10% - 10%
Procurement
Women-owned vendor procurement - 5% - 5% - 5%
Enterprise development
Enterprise development contributions - 0.6% - 0.6% - 0.6%
Adjusted enterprise development - 0.6% - 0.6% - 0.6%
contributions
Socio-economic Development
Socio-economic development 1.0% 1.5% 1.0% 1.5% 1.0% 1.5%
contributions
Adjusted socio-economic development 1.0% 1.5% 1.0% 1.5% 1.0% 1.5%
contributions
Utility-Scale Renewable Energy: Market Intelligence Report 2019 24The ED objectives are expected to change in African Photovoltaic Industry Association
future bid rounds as a result of local communities (SAPVIA) and the South African Wind Energy
within a 50 km radius of the project site receiving Association (SAWEA).
delayed income5 and local content rules being
open to exploitation. Among many others, highlights include over 31
207 job years created in construction and
In future rounds it is expected that there will operation and maintenance (IPPO 2017), whilst
be a number of improvements, including: numerous large investments have been made in
■ redefining a local community or clarity manufacturing and assembly. Qualifying
on the definition of ‘a local community’; communities will receive R29 billion in income
■ ensuring that local communities receive early, over the project’s 20-year lifespan as a result of
efficient and equitable benefits; the minimum ownership requirement of 2.5%.
■ a focus on technology-specific items for
localisation – laminating of panels, To truly demonstrate the impact and future
construction of towers, blades, etc. have benefits of the programme, it is necessary to look
to be done locally; at programmes on the ground. One such example
■ more stringent burdens of proof, for is the South African Renewable Energy
instance, CFOs will require signed certificates Technology Centre (SARETEC) at the Cape
from auditors. Peninsula University of Technology (CPUT)
campus in Bellville, Cape Town. As well as short
To date there are 62 community trusts courses on solar PV systems and biomass
implementing numerous economic development technologies, SARETEC now offers internationally
activities across SA. Many of these projects are accredited courses for:
supporting communities in rural locations, where
community resourcing is scarce. As with many ■ Wind turbine services technicians;
local development initiatives, the upskilling and ■ Solar photovoltaic service technicians.
integration of new technology, and partnerships
between international and local teams require The institution was specifically founded to cater
patience and consistency. These success stories for the REIPPPP’s skills requirements, particularly
are communicated by the various industry in the long-term operation and maintenance
associations concerned, including the South phases of projects.
© Nicholas Fordyce
5
Local community trusts comprising 2.5%-5% of the project are funded through free carry by the remaining shareholders and/or develop-
ment finance institutions through a loan. Given that the community does not inject any capital themselves, dividends are only repaid once
the loans are repaid. This can delay dividends to the community for 15 years.
25 Utility-Scale Renewable Energy: Market Intelligence Report 20193
Policies and regulation
This section focuses on policies and regulation that guide
and affect procurement in the renewable energy sector
3.1. Guiding policies via the economic development component
South Africa’s economic growth is guided by of the REIPPPP. The design of the REIPPPP
several key policies, as shown in Figure 9 takes into account all these policies,
(national Department of Economic Development, making it a highly strategic infrastructure
2011). Of these, the policies highlighted relate and development programme.
directly to procurement within the RE sector
National
Development
Plan (NDP)
New Growth
Path
Local
Procurement
Accord
Green
Economy
Accord
REIPPPP
Figure 9: Policies guiding South Africa’s economic growth trajectory
Utility-Scale Renewable Energy: Market Intelligence Report 2019 26National Development Plan (NDP) Supports procurement of at least 20 GW of RE by 2030 in its
outline of the country’s development path.
New Growth Path Sets targets creating jobs and identifies priority areas, with
infrastructure development named as key to the success of this
vision.
Local Procurement Accord As the economy grows and the country industrialises, this accord
sets an aspirational target of 75% of all products used in the
country to be manufactured locally. This is particularly evident in
the REIPPPP’s local content rules.
Green Economy Accord Incorporated within the New Growth Path, this accord between
government, labour and business seeks to shift the country’s
economy towards sustainable development, green job creation
and industrial development.
Other supporting programmes include the dti’s Specific to the procurement of new generation
special economic zone (SEZ) programme, which capacity, SA is guided by the IRP 2010-2030 (most
seeks to establish a dedicated economic zone in recently, the IRP 2018), which stems from the
each province that attracts specific economic broader national energy plan, embodied within
activities. The Atlantis SEZ for Green the Integrated Energy Plan (IEP). These plans are
Technologies in the Western Cape offers presented in Figure 10.
compelling support and incentives to
manufacturers of green technologies,
especially those supplying the REIPPPP.
New Growth Path
– National
Development Plan
Integrated
Energy Plan
(IEP)
Integrated
Resource
Plan (IRP)
Renewable
Energy White
Paper
REIPPPP
Figure 10: Eco-system of policies relating to the REIPPPP
27 Utility-Scale Renewable Energy: Market Intelligence Report 2019NDP Supports procurement of at least 20 GW of RE by 2030 in its
outline of the country’s development path.
IEP Outlines the general energy plan for the country. The IEP looks
into energy security, access to energy, reducing cost of energy
supply, energy efficiency, localisation and sustainability in all
energy matters.
IRP Specifically outlines the planning, sourcing and quantities of
electricity generation sources contributing to the county’s
generation mix.
RE White Paper Determines that a significant and equitable level of national
resources should be invested in RE, while also setting targets for
RE generation capacity.
3.2. Government departments involved in the energy
and electricity sector
Different government departments are involved in various capacities in executing the policies listed in
Section 3.1. The most prominent departments are listed below, with a brief summary of their interaction
with the REIPPPP:
National Treasury Ensuring value for money, affordability of electricity supply, and
providing sovereign guarantees for the signed PPAs.
Department of Environmental Ensuring environmental custodianship and assessment of
Affairs (DEA) environmental impact studies, as well as ensuring appropriate
land use.
Department of Trade and Responsible for ensuring industrialisation through the REIPPPP’s
Industry (dti) economic development component, especially local content; as
well as black economic empowerment and development of small
businesses.
Department of Public Shareholder in Eskom, the sole power off-taker.
Enterprises
3.3. Energy regulation Current interpretations of the Act require that any
Energy regulation in South Africa is governed by generation facility selling to a public entity requires
the Electricity Regulation Act, No 4 of 2006 (ERA). a determination (permission) from the minister of
This act establishes the national regulatory energy. This is currently a limitation on building
framework, and outlines the role of the national generation plants outside of the REIPPPP and
energy regulator (NERSA). In terms of large-scale selling energy directly to cities; however, a number
renewable energy, the most relevant aspect of of changes are expected, given the current 1 MW
the Act is the impact of its current interpretation exemption (facilities under 1 MW do not require a
on public purchase of energy. generation licence) and the 200 MW annual
allocation for SSEG in the IRP.
Utility-Scale Renewable Energy: Market Intelligence Report 2019 28© Nicholas Fordyce 29 Utility-Scale Renewable Energy: Market Intelligence Report 2019
4
                           Opportunities
                           and barriers
              Changes in the country’s electricity sector continue to present
                      a variety of opportunities for the RE market.

The dramatic drop in solar PV and wind prices has had a significant impact on South Africa’s future
energy mix. Based on the updated IRP 2018, government still expects to procure 24 GW of RE generation
by 2030 (see Table 11).

Table 11: Procurement outstanding based on IRP adjustments

 IRP                     RE goal 2030           Procured to            Determined to        To be Procured
 Adjustments                                    Date                   Date
 IRP 2010 – 2030         17 800                                                             11 424
 Policy Adjusted

 Draft 2016              19 647                                                             19 647
 IRP Base Case
 2030                                           6 376                  14 725
 Draft 2016 IRP          33 347                                                             33 347
 Carbon Budget
 2030

 IRP 2018 Update         30 630                                                             24 254

Technology improvements, improved risk
appetite and the global RE drive could result in
SA seeing solar PV and wind prices as low as                      The price of solar PV and wind could
R0.46/kWh and R0.56/kWh by 2030 (Wright et al.                    fall to R0.46/kWh an R0.56/kWh,
2017). There is potential for:                                    respectively, by 2030.
■ local government procurement of electricity

   from IPPs;
■ manufacturing opportunities from local

   content requirements; and
■ opportunities for greentech manufacturers in               RE sector’s growth. It also details additional and
   the proposed Atlantis GreenTech SEZ.                      continuing opportunities, outlining the nature of
                                                             the challenges and how they may be overcome
This section discusses the opportunities                     by custodians within government and the
presented by the REIPPPP and challenges to the               private sector.

Utility-Scale Renewable Energy: Market Intelligence Report 2019                                               30
4.1. Emerging opportunities
The influence of IRP 2018 on
4.1.1. Bid Window 5 of the REIPPPP Bid Window 5 opportunities
Post the release of the IRP 2018 for public
comment, the Minister of Energy released The major driver for BW 5 opportunities is
a statement stating that bid window 5 (BW5) the IRP 2018. It has some major changes in
of REIPPPP would be announced immediately comparison to the policy-adjusted IRP of
after the final gazetted version of the IRP 2018 2010, which resulted from:
was released. However, with elections in May and
troubles at Eskom, the timelines remain unclear. ■ drop in Eskom plant performance
availability (assumed to be 86% but 77%
That said, if the DOE aims to ensure continuity for 16/17);
in the market, the most optimistic result will be ■ demand 30% lower than 2010
that the BW5 submission and RFP occur in 2019 expectation;
with 2019/20 for commissioning from 2023 ■ technology cost decline – wind, solar.
onwards. This looks like the most plausible
outcome as Eskom’s Medium Term System These market changes have led to a
Adequacy Outlook indicates that there is a reduction of nuclear and coal, and the
potential electricity supply shortfall starting in exclusion of CSP plants up until 2030, and
2019. Figure 11 below shows how much is needed an increase in the contribution of RE to the
depending on demand and power station energy mix. RE can potentially fulfil 21% of
performance assumptions. Based on the energy production of 321 TWh by 2030, with
apparent shortfall6 we expect that round 5 the gas also playing a significant role in
REIPPP programme will be launched in 2019/20. the next decade.
Financial close for BW 4, 4b and 3.5 took
place at the end of July 2018, with 2 476
MW committed contracted capacity for
2019-2022 for PV, wind and CSP. After that,
there is speculation of a potential
procurement gap resulting from lower
electricity demand as a consequence of
low growth and increased efficiencies
from businesses.
The IRP 2018 seems to accommodate
numerous interests in the coal and RE
sector by not using the Least Cost Model,
which would delay wind and solar
procurement to 2027 and exclude coal
entirely. The merits for the proposed plan
will come under scrutiny, given the major
investment made into renewables to date,
the need for consistency, and potential job
losses in the coal sector.
6
The week-on-week energy availability factor (EAF) of South Africa’s generation fleet continues to plunge to its lowest level in years, from
67,88% in week 43 of 2018 to 66,37% in week 44 of 2018.
31 Utility-Scale Renewable Energy: Market Intelligence Report 2019You can also read