Dialogue on a RES policy framework for 2030 - Energypedia
←
→
Page content transcription
If your browser does not render page correctly, please read the page content below

Dialogue on a RES
 policy framework
          for 2030

                     Task 3.2.3 Report:

                     Phasing out economic support
                     to mature renewables?
                     Drivers, barriers and policy options

                         Authors:
                         Luis Janeiro, Corinna Klessmann,
                         Fabian Wigand, Katharina Grave; ECOFYS

                     June 2016

                     A report compiled within the European
                     IEE project towards2030-dialogue
                     (work package X)

                     www.towards2030.eu
                     Intelligent Energy - Europe, ALTENER
                     (Grant Agreement no. IEE/13/826/SI2.674882)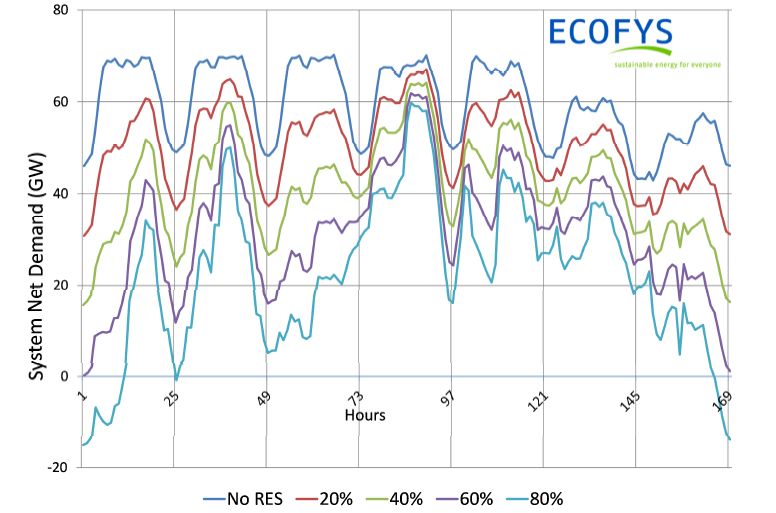
Project duration:   March 2014 – November 2016
                                    Funding             European Commission, EASME; Intelligent Energy Europe
                                    programme:          (IEE) - Programme, Contract No. IEE/13/826/SI2.674882
                                    Web:                www.towards2030.eu
                                    General contact:    contact@towards2030.eu

About the project
The aim of towards2030-dialogue is to facilitate and guide the RES policy dialogue for the period towards 2030.
This strategic initiative aims for an intense stakeholder dialogue that establishes a European vision of a joint
future RES policy framework.
The dialogue process will be coupled with in-depth and continuous analysis of relevant topics that include RES in
all energy sectors but with more detailed analyses for renewable electricity. The work will be based on results
from the IEE project beyond 2020 (www.res-policy-beyond2020.eu), where policy pathways with different de-
grees of harmonisation have been analysed for the post 2020 period. towards2030-dialogue will directly build
on these outcomes: complement, adapt and extend the assessment to the evolving policy process in Europe. The
added value of towards2030-dialogue includes the analysis of alternative policy pathways for 2030, such as the
(partial) opening of national support schemes, the clustering of regional support schemes as well as options to
coordinate and align national schemes. Additionally, this project offers also an impact assessment of different
target setting options for 2030, discussing advanced concepts for related effort sharing.

Who we are?
                                                        Vienna University of Technology, Energy Economics
                                                        Group (EEG), Austria (Project coordinator)
                                                        Fraunhofer Institute for Systems- and Innovations Re-
                                                        search (Fraunhofer ISI), Germany
                                                        Energy Research Centre of the Netherlands (ECN),
                                                        Netherlands
                                                        Center for European Policy Studies (CEPS),
                                                        Belgium
                                                        National Technical University of Athens (NTUA),
                                                        Greece
                                                        Consejo Superior de Investigagiones Cientificas (CSIC),
                                                        Spain
                                                        Ecofys Netherlands and affiliates (Ecofys),
                                                        Netherlands
                                                        REKK Energiapiaci Tanacsado Ltd (REKK ET),
                                                        Hungary
                                                        European University Institute, Florence School of
                                                        Regulation (EUI), Italy
The phase-out of economic support to mature renewables

      This report
      explores the necessary conditions for a potential ‘phase-out’ of economic support for mature re-
      newable technologies that is compatible with the levels of deployment required to reach the de-
      fined EU target of at least 27% renewables in 2030.

      The main ‘drivers and barriers of RES-E competitiveness’ - both on the cost and revenue side - are
      identified and analysed in detail. Possible policy measures to enhance drivers and/or overcome
      barriers are discussed.

      We conclude that in the medium term it may be possible to increase the share of RES-E without
      providing dedicated economic support. Such phase-out of economic support requires that two
      main conditions are met: firstly, expected future revenues from power markets are sufficiently
      high to cover generation costs; secondly, the risk tag attached to those revenues has to be ac-
      ceptable for investors in the energy sector.

      Nowadays, these conditions are not met yet, despite falling generation costs. RES targets and
      support schemes will still be needed for a transitional period until power markets provide suffi-
      cient and sufficiently predictable revenues for RES developers. The level of support needed during
      this transitional period will strongly depend on how policies affect the ‘drivers’ and ‘barriers’ of
      competitiveness described in this paper.

      Authors:
      Luis Janeiro, Corinna Klessmann, Fabian Wigand, Katharina Grave, ECOFYS

 Acknowledgement:                                                Legal Notice:
 The authors and the whole project consortium                    The sole responsibility for the content of this publication
 gratefully acknowledge the financial and intellec-              lies with the authors. It does not necessarily reflect the
 tual support of this work provided by the Intelli-              opinion of the European Union. Neither the EASME nor
 gent Energy Europe (IEE) Programme.                             the European Commission is responsible for any use that
                                                                 may be made of the information contained therein.
                                                                 All rights reserved; no part of this publication may be
                                                                 translated, reproduced, stored in a retrieval system, or
                                                                 transmitted in any form or by any means, electronic, me-
                                                                 chanical, photocopying, re-cording or otherwise, without
                                                                 the written permission of the publisher.
                                                                 Many of the designations used by manufacturers and
 with the support of the                                         sellers to distinguish their products are claimed as trade-
 EUROPEAN COMMISSION                                             marks. The quotation of those designations in whatever
 Executive Agency for Small and Medium-sized En-                 way does not imply the conclusion that the use of those
 terprises (EASME)                                               designations is legal without the content of the owner of
 Intelligent Energy Europe                                       the trademark.

                                                      Page iii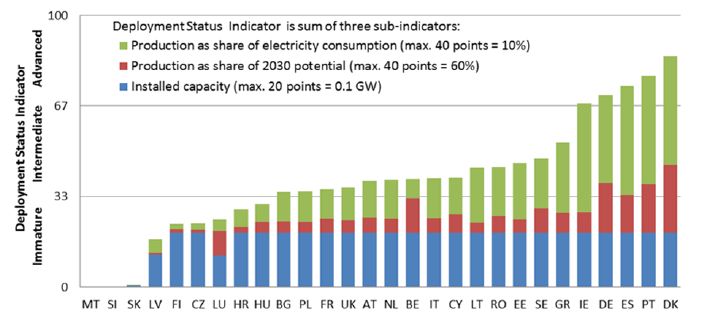
The phase-out of economic support to mature renewables

                                   Contact
                                   details

                                                Project coordinator:
                                                Gustav Resch
                                                Vienna University of Technology, Institute of Energy Sys-
                                                tems and Electrical Drives, Energy Economics Group (EEG)
                                                Address: Gusshausstrasse 25/370-3, A-1040 Vienna, Austria
                                                Phone: +43 1 58801 370354
                                                Fax: +43 1 58801 370397
                                                Email: resch@eeg.tuwien.ac.at
                                                Web: www.eeg.tuwien.ac.at

                                                Dissemination leader:
                                                Prof. John Psarras, Haris Doukas (Project Web)
                                                National Technical University of Athens (NTUA-EPU)
                                                Address: 9, Iroon Polytechniou str., 15780, Zografou,
                                                Athens, Greece
                                                Phone: +30 210 7722083
                                                Fax: +30 210 7723550
                                                Email: h_doukas@epu.ntua.gr
                                                Web: http://www.epu.ntua.gr

                                                Lead author of this report:
                                                Luis Janeiro
                                                Ecofys Netherlands B.V.
                                                Address: Kanaalweg 15G, 3526 KL
                                                Utrecht, the Netherlands
                                                Phone: +31 (0)30 662 3116
                                                Fax: +31 (0)30 662 3301
                                                Email: l.janeiro@ecofys.com
                                                Web: www.ecofys.com

                                                Page iv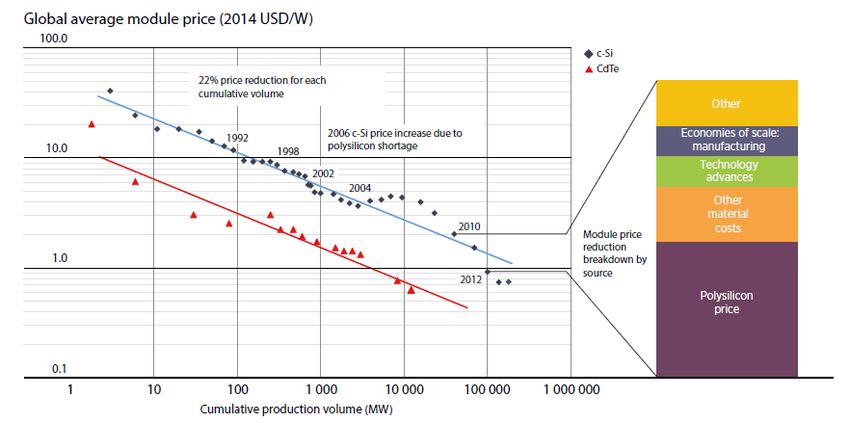
The phase-out of economic support to mature renewables

Executive Summary
The increased deployment of renewable energy is a key element of the European climate and energy policy,
intended to improve EU competitiveness, boost economic growth and create jobs. In October 2014 the European
Council agreed on a renewable energy target of at least 27% of final energy consumption for 2030. Thus, further
investments in renewable electricity (RES-E) generation technologies are needed to meet this target and even-
tually decarbonise the power sector. At the same time, there is a discussion on whether renewables support can
be phased out for mature RES-E technologies beyond 2020, assuming that the electricity and carbon markets will
be sufficient to trigger the needed RES-E investments.

This report takes a closer look at the business case of variable RES-E, particularly for wind and solar PV, and
explores under which conditions support to mature RES-E can be phased out in the future without endangering
the needed RES investments.

Our analysis is focused on the future competitiveness wind and solar PV in the wholesale markets, not the retail
markets, which follow different market dynamics.

Preconditions for phasing out economic support for RES-E: market
revenues need to cover generation costs and correspond to inves-
tors’ risk tolerance
The notion of competitiveness for RES-E has traditionally been based on the comparison of the Levelised Cost of
Electricity (LCOE) of RES-E technologies with those of conventional power sources, which used to be ‘price-set-
ting’ technologies in wholesale markets. While LCOEs of mature renewables are quickly approaching those of
conventional technologies, this definition of competitiveness may be too narrow. A more relevant question is
when will the revenues from the electricity market be sufficient to refinance the LCOE of new investments in
RES-E?

The main components of LCOE are: investment costs, costs of capital and operation and maintenance costs (see
Figure 3). Revenues from RES-E developers come mainly from electricity sales in the wholesale electricity market.
Other sources of revenue from e.g. balancing, capacity or ancillary markets are in principle possible although
mostly negligible to this day.

Figure 1      Generation cost (levelised cost of electricity- LCOE) and revenue components

Currently, revenues from electricity markets are in most cases insufficient for RES-E generators to cover the gen-
eration costs. Therefore, economic support from RES-E support schemes are used to close that gap.

                                                     Page v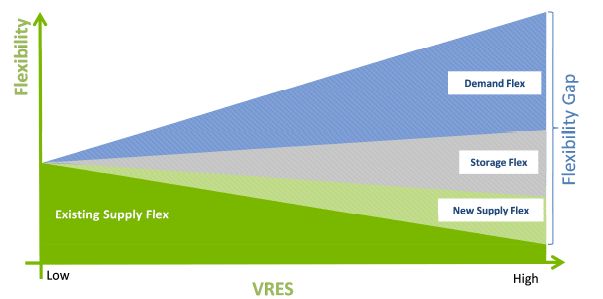
The phase-out of economic support to mature renewables

In the medium or long-term it may be possible to phase-out economic support for RES-E technologies to the
extent that two main conditions are met: firstly, expected future revenues from power markets are sufficiently
high to cover generation costs; secondly, the risk tag attached to those revenues is acceptable for investors in
the energy sector.

Nowadays, these conditions are not yet met, and it is unclear whether they will be widely met before 2030.
RES targets and support schemes will still be needed for a transitional period until power markets provide suffi-
cient and sufficiently predictable revenues for RES developers. The level of support needed during this transi-
tional period will strongly depend on how policies affect the ‘drivers’ and ‘barriers’ of competitiveness described
in this paper.

The phase-out of RES-E support can be accelerated by several driv-
ers but also hampered by a number of barriers
Adequate policies and regulations can mitigate the effect of existing barriers for RES competitiveness as well
as enable the positive effects of identified drivers (see Figure 2). As a result, these policies and regulations can
bring reduction in generation costs and increase in revenues for RES plants with reduced - and ultimately no -
economic support.

Figure 2      Barriers and drivers of RES-E competitiveness

Drivers for reduction of the generation cost
Technology cost reduction. Progressive technology cost reduction has been one of the key levers to reduce
power generation costs for any technology, in particular relevant for wind and PV. As deployment of renewable
energy technologies continues, it is expected that technology costs will continue to decrease in the future by ca.
20% for wind onshore and ca. by 30% by solar PV by 2030 (Fraunhofer et al. 2014).

Long term stability and credibility of RES- and climate policies. Stable, reliable and predictable policies and reg-
ulatory frameworks are important to provide a planning horizon for project investors and a project pipeline for
component and service providers and thus – reduce the cost of capital.

RES sector maturity. In general, wind turbines and PV systems are subject to global competition. However, the
specific maturity of the national renewable energy sectors may have an effect in the actual generation costs, due
to high competition among specialised companies, availability of qualified professional, adaptation of regula-
tions, more advanced and customised financial mechanisms and lower risk premiums for developers, as well as
knowledge transfer and best institutional practices for permitting procedures.

                                                      Page vi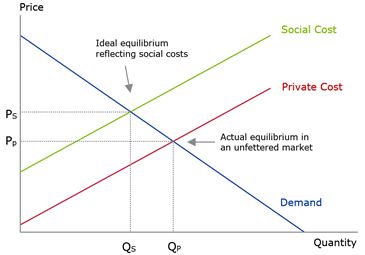
The phase-out of economic support to mature renewables

Favourable financing conditions. National credit rating and the interest rate can have a considerable impact on
the cost of capital. While policy and revenue uncertainty impair the availability of credit and cost of capital for of
RES-E plants, specific financing solutions, such as soft loans and loan guarantees, can help.

Barriers for reduction of the generation cost
Revenue risk. Since RES-E plants are highly capital intensive, high revenue risks from the electricity markets result
in substantially higher generation costs, reducing the available financing options. Existing support schemes miti-
gate revenue risk for RES-E project developers to different degrees. Without any support or remuneration
scheme, RES-E plants are fully exposed to market risks.

Market entry costs. Market entry costs are usually related to grid access and administrative barriers, such as
lengthy and complex permitting procedures, lack of information of grid capacity, intransparent assessment meth-
ods, etc. Securing actual grid capacity, assuring availability of information on grid connection capacity, transpar-
ent assessment methods, as well as eliminating land ownership disputes issues shorten project development
time and decrease its cost. Information about future grid development and an increased transparency of the grid
connection procedure can also drive cost reductions. Finally, the costs of connecting to the grid can be reduced
by adopting a shallow grid connection charging regulation where grid upstream reinforcement costs are social-
ized via the network tariffs and no or little costs are charged to the connecting entity.

Market integration costs. Current power market rules are not always fully prepared to incorporate increasing
volumes of variable RES-E generation (vRES), where the actual power output of the generation plants is uncertain
until the time of delivery, while predictability increases towards this time. The costs for balancing solar PV and
wind uncertainty in the system can be significantly reduced with appropriate market design options, e.g. through
reducing the scheduling or dispatch periods and gate closure times.

Drivers increasing RES-E market revenues
High fossil fuel prices. Fossil fuel prices are a key cost component of fossil-fuel-based electricity production and
their price developments have a direct impact on the competitiveness of RES-E. At the moment fossil fuel prices
are relatively low and there is no evidence to expect that fossil fuel prices will reach unprecedentedly high levels in the
period 2020-2030.

Adequate externality pricing. Climate change and depletion of energy resources form the largest externalities
of fossil energy use but externalities include also particulate matter, ozone depletion, water depletion, metal
depletion and terrestrial acidification and many other. The EU Emission Trading Scheme (EU ETS) is the corner-
stone of EU climate policy and the main instrument aimed at internalising negative externalities in the EU by
setting a market price for carbon. However, current carbon prices fail to appropriately reflect the negative exter-
nalities related to fossil energy sources, estimated at €50/tonneCO2 or more. The degree to which the carbon
price approaches these real externality costs in the future will be a determinant factor of RES-E competitiveness
and thus of the possible phase-out of economic support; however, most analysts do not expect such carbon price
increase over the 2020-2030 period.

Balancing and ancillary services. Balancing and ancillary services could constitute an additional source of reve-
nues for RES-E if the right regulatory framework is set.

Barriers decreasing RES-E market revenues
Decreasing market value with increased RES-E penetration. Wind and solar technologies are characterised by
high investment costs and very low relative operational costs. In practice, this means that they can offer electric-
ity in the power market at prices close to zero, preceding most conventional generation technologies in the merit

                                                         Page vii
The phase-out of economic support to mature renewables
order. This means that windy and sunny periods tend to be the low price periods in systems with large penetra-
tion of wind and solar PV technologies. Additionally, wind and solar PV are driven by their resource availability,
so they tend to operate precisely in those periods of low prices, undermining their own revenues. This has been
known as the ‘cannibalism’ effect and it has strong implications for energy policy makers as higher penetrations
of vRES in the power markets can result in an increased relative need for net support payments to bridge the gap
between decreasing revenues from the wholesale market and the LCOE of these technologies. Future increases
in carbon prices could partially mitigate this effect by ‘flattening’ the merit-order curve; however, a long term
and sustainable solution to this issue is to achieve increasing levels of flexibility in the power system and market.
Limited flexibility of power systems. Limited flexibility of power systems is an important barrier for further de-
ployment of vRES generators such as wind and PV plants. Future systems and markets with increasing shares of
vRES will need additional flexibility to maintain system reliability as the variations in supply and demand will be
larger and faster. Future power market regulations should be designed to provide sufficient economic incentives
for all market actors to contribute to the flexibility of the system. Flexibility in the power systems can be improved
by increasing the flexibility of generators and consumers, but also by implementing energy storage solutions,
increasing interconnection capacity with other systems, adapting power market rules and/or expanding market
size.
Subsidies for conventional technologies. Conventional generation largely benefits from various (historical) in-
terventions and subsidies, often much less obvious than renewable energy support. Examples of interventions
are certain energy tax structures and exemptions, financial government participation in oil and gas extraction
and the (partial) coverage of risks by governments related to nuclear accidents and transport, to name a few.
From an economic perspective, a socially responsible and progressive phase-out of policy support to conven-
tional generation will result in improving competitiveness of renewables, thereby reducing the need for support.
Shifting from dedicated economic support to an enabling market
framework for RES-E
The transition towards the phase-out of dedicated economic support will require a shift in focus in (renewable)
energy policies. RES policy (for mature technologies) should progressively move away from a narrow notion of
dedicated RES-E economic support to one in which policies are aimed at providing the right conditions for re-
newables to recover their costs from the electricity markets.
This means, on the one hand, creating an adequate regulatory environment to trigger investment in new RES-
E generation. The level of long-term ambition and reliability of policy frameworks are two critical elements to
achieve this. Likewise, policies can greatly improve the business case for renewables by reducing market entry
barriers e.g. costly grid connection or administrative procedures, where these barriers still prevail. Last but not
least, phasing out support for emission intensive conventional sources will contribute to create a level playing
field.
On the other hand, it means reforming the markets to ensure that they are adapted to the special characteris-
tics of (variable) renewables and that they provide sufficient economic incentive for RES investors. Along with
an appropriate pricing of carbon, the key element to achieve this will be the creation of the appropriate regula-
tory incentives to increase the levels of flexibility in the power markets. This is critical to ensure that long term
revenues for renewables will be able to cover investment costs with increased levels of penetration.
The success in accelerating the phase-out of economic support for mature RES-E technologies will go hand in
hand with the progress made in the transition in renewable energy policy and power market transformation.
Page viiiThe phase-out of economic support to mature renewables
Table of contents
1 Introduction ..................................................................................................................................... 1
1.1 Background .................................................................................................................................................................. 1
1.2 Scope of this paper ...................................................................................................................................................... 1
2 Necessary conditions for phasing-out economic support ............................................................... 3
2.1 Defining the pre-conditions for the ‘phase-out’ of economic support ........................................................................ 3
2.2 Elements of RES Competitiveness: Drivers and barriers .............................................................................................. 4
3 Elements determining RES-E generation costs ................................................................................ 6
3.1 Driver 1: Technology cost reductions .......................................................................................................................... 8
3.2 Driver 2: Long-term stability and credibility of RES and climate policies ................................................................... 10
3.3 Driver 3: RES sector maturity ..................................................................................................................................... 11
3.4 Driver 4: Favourable national financing conditions ................................................................................................... 13
3.5 Barrier 1: Revenue risk............................................................................................................................................... 14
3.6 Barrier 2: Market entry costs ..................................................................................................................................... 16
3.7 Barrier 3: Market integration costs ............................................................................................................................ 16
4 Elements determining revenues for RES-E .................................................................................... 18
4.1 Driver 1: High fossil fuel prices .................................................................................................................................. 19
4.2 Driver 2: Adequate externality pricing ....................................................................................................................... 21
4.3 Driver 3: Provision of balancing and ancillary services .............................................................................................. 23
4.4 Barrier 1: Decreasing market value with increased penetration ............................................................................... 24
4.5 Barrier 2: Limited flexibility of power systems .......................................................................................................... 26
4.6 Barrier 3: Subsidies to conventional technologies ..................................................................................................... 29
5 Discussion and conclusions ............................................................................................................ 30
5.1 Discussion .................................................................................................................................................................. 30
5.2 Conclusions ................................................................................................................................................................ 31
References ............................................................................................................................................. 33
Page ixThe phase-out of economic support to mature renewables
Figures
Figure 1 Generation cost (levelised cost of electricity- LCOE) and revenue components ...............................v
Figure 2 Barriers and drivers of RES-E competitiveness.................................................................................. vi
Figure 3 Generation cost (levelised cost of electricity) and revenue components ............................................. 3
Figure 4 Elements of RES-E competitiveness. Barriers and drivers ................................................................. 5
Figure 5 Main elements determining electricity generation costs ...................................................................... 6
Figure 6 Global average module price (2014 USD/Watt). Source: IRENA, 2015 ................................................. 8
Figure 7 Evolution of wind turbine prices in EUR/kW based on the year of delivery and per year of contract
signature (PCSD) Source: JRC, 2015 ........................................................................................................................ 9
Figure 8 Future specific investment costs for PV power. Source: Fraunhofer ISI, et al. 2014 ............................. 9
Figure 9 Future specific investment costs for wind power. Source: Fraunhofer ISI, et al. 2014 ....................... 10
Figure 10 Evolution of generation capacity in the EU 28. Source: Eurostat ................................................... 12
Figure 11 Deployment Status Indicator for onshore wind (above) and PV plants (below) in the EU-28 in 2012
13
Figure 12 Deployment Status Indicator for onshore wind (above) and PV plants (below) in the EU-28 in 2012
13
Figure 13 Payments by support scheme type (Source: Ecofys) ...................................................................... 14
Figure 14 Factors determining future revenues for RES-E projects (I) ............................................................ 18
Figure 15 Evolution of fossil fuel prices in different markets. Source: Ecofys (source data: ENERDATA). ...... 20
Figure 16 Global oil demand and price scenarios. Source: IEA, 2015 ............................................................. 21
Figure 17 Externalities – result from the difference in private and social costs ............................................. 22
Figure 18 Illustration of the merit order effect. Source: own elaboration ..................................................... 25
Figure 19 Estimation of market value for wind and PV generation with increased penetration (Hirth, L. 2013)
26
Figure 20 Daily patterns of electricity demand (No RES) and net electricity demand at different vRES
penetration levels. Source: Ecofys, 2014 .............................................................................................................. 27
Figure 21 Flexibility gap in electricity systems with increased penetration of vRES. Source: Ecofys, 2014 .... 28
Figure 22 Total support provided in the 28 Member States (in billion €2012) per technology, including EU
level support. Source: Ecofys et al., 2014b ........................................................................................................... 29
Tables
Table 1 Drivers and barriers for reduction of generation costs for RES-E.......................................................... 7
Table 2 Revenues for RES-E developers in wholesale markets. Drivers and barriers ...................................... 19
Page xThe phase-out of economic support to mature renewables
List of Abbreviations
CSP: Concentrated Solar Power
EC: European Commission
EU ETS: European Union Emissions Trading System
IEA: International Energy Agency
LCOE: Levelised Cost of Electricity
LNG: Liquefied Natural Gas
PV: Photovoltaics
RES: Renewable Energy Source
RES-E: Renewable Energy Source - Electricity
vRES: Variable Renewable Energy Sources
Page xiThe phase-out of economic support to mature renewables
1 Introduction
1.1 Background
The increased deployment of renewable energy sources (RES) is a key element of the European climate and
energy policy, intended to mitigate climate change, improve EU competitiveness, boost economic growth and
create jobs1.
The EU has made substantial progress towards meeting its 20% renewable energy target set for 2020 (Ecofys et
al., 2014); however, it is widely accepted that a new policy framework for the period up to 2030 is needed to
ensure regulatory certainty for investors. In January 2014, the EC put forward its proposal, including a renewable
energy target of at least 27% of final energy consumption for 2030. The European Council reached an agreement
in October 2014 confirming an EU-wide target of at least 27%. The European Commission is now tasked with
working out the specifics of the 2030 framework in order to reach this target in a cost-efficient manner.
National support schemes have been key drivers of the growth experienced by renewable electricity (RES-E)
markets across Europe in the recent years. Renewable energy technology costs have significantly decreased.
However, as the share of renewables in the electricity system rises, so have the total costs of support schemes.
As a result, national governments are looking at ways to lower costs of support schemes. A trend towards a
gradual lowering of support levels and higher exposure to the market has emerged in the recent years. The Eu-
ropean Commission has repeatedly called for increased market exposure of RES-E producers2, with the aim to
reduce market distortions. Similarly, it has also called for increased economic efficiency of support instruments
- e.g. by the introduction of competitive mechanisms 3- and an eventual phase-out of economic support for ma-
ture technologies, that is - capable of competing in the market, allowing power and carbon markets alone to
drive (renewable) energy production and investment decisions.
1.2 Scope of this paper
Economic support for renewable energy has been historically justified as a required policy incentive to trigger
deployment of new low-carbon technologies, compensating for incomplete internalisation of environmental ex-
ternalities, decreasing dependency on energy imports, and increasing the diffusion of immature technologies, in
turn decreasing their costs.
In this paper we discuss the necessary conditions for a potential ‘phase-out’ of economic support for RES-E that
is compatible with the levels of RES deployment required to reach the defined EU RES target of at least 27% in
2030.
Thus, the aim of this paper is to analyse the following research question:
Under which conditions can support to mature RES-E be phased out without endangering the needed RES
investments?
1 (COM (2012) 271) and earlier EC documents.
2 (SWD (2013) 439 final) Delivering the internal electricity market and making the most of public intervention
3In 2014, the European Commission released new Environmental and Energy Aid Guidelines that provide guidance to Mem-
ber States as to which support schemes are compliant with EU state aid rules.
Page 1The phase-out of economic support to mature renewables
We carry out a qualitative analysis of market conditions and policy options that could enable a progressive phase-
out of financial support for RES-E. Detailed techno-economic calculations fall out of the scope of this study.
We focus primarily on onshore wind power and solar photovoltaics (PV), since both technologies have achieved
substantial reductions in costs, and high levels of deployment across Europe in recent years. They are thus in-
creasingly considered mature RES-E. Furthermore, their observed growth trends indicate that they are likely to
be dominant RES-E technologies in the power sector after 2020.
Both PV and wind are variable renewable sources (vRES). As it will be discussed later, this is a determinant feature
when analysing the competitiveness of the technologies in the power market; however, many of the arguments
and discussion in this paper could be extended to other RES-E technologies.
Our analysis is focused on the future competitiveness of RES-E generators in the wholesale markets. Distributed
RES-E generation is also becoming increasingly competitive in many European retail markets - i.e. self-consump-
tion of PV electricity is in some cases already cheaper than buying electricity from a supplier - and may play an
important role in achieving the EU RES-E 2030 target; however, the market dynamics, distributional effects and
the portfolio of policy options to support further and faster deployment are fundamentally different from those
for wholesale markets, and worth of a specific study of its own.
In chapter 2 we define in broad terms what we mean by “phase-out of economic support” and identify the key
elements of RES-E competitiveness. Subsequently, in chapters 3 and 4 we discuss in more detail the elements of
RES-E competitiveness previously identified as well as policies that potentially reduce economic support needs
and eventually phase out economic support. In chapter 5 we draw conclusions for policy-makers from our anal-
ysis in the previous chapters.
Page 2The phase-out of economic support to mature renewables
2 Necessary conditions for phasing-out economic
support
2.1 Defining the pre-conditions for the ‘phase-out’ of economic
support
The Levelised Cost of Electricity (LCOE) is the metric often used to compare the competitiveness of generation
technologies. It is the present value of the total cost of building and operating a plant over its financial life, con-
verted to equal annual payments and amortised over the expected annual generation (Klessmann et al., 2013).
The notion of competitiveness for RES-E has traditionally been based on the comparison of the LCOE of RES-E
technologies with those of conventional power sources, which used to be ‘price-setting’ technologies in whole-
sale markets. While LCOEs of mature renewables are quickly approaching those of conventional technologies,
this definition of competitiveness may be too narrow. A more relevant question is when will the revenues from
the electricity market be sufficient to refinance new investments in RES-E?
The specific time and place when RES-E technologies reach a point of competitiveness in the power markets is
highly dependent on the specific market context and is influenced by a number of factors besides the technology
cost reduction, such as wholesale market prices, administrative costs, financing conditions, taxes and the renew-
able resource availability, among others.
Figure 3 below shows the two sides of the business case for RES projects, breaking down the main components
of generation costs and revenues for developers. Generation costs are composed of investment costs (cost of
developing the project and building the generation plant), costs of capital (the cost of raising sufficient funds to
cover investment costs) and operation and maintenance costs. Revenues from RES-E developers come mainly
from electricity sales in the wholesale market and additional economic support when available. Other sources of
revenue from e.g. balancing, capacity or ancillary markets are in principle possible although mostly negligible to
this day.
Figure 3 Generation cost4 (levelised cost of electricity) and revenue components
4 Fuel costs are an additional component of the generation cost breakdown for (RES-E) technologies other than wind or PV.
Page 3The phase-out of economic support to mature renewables
In the current situation, revenues from power markets are in most cases insufficient for RES-E project developers
to cover the generation costs. Therefore, economic support is still needed. A model-based assessment of future
renewables deployment at national and EU level assuming achievement of the 27% target by 2030 shows that
the necessary remuneration for renewables is expected to decline over time (Resch et al.2015); however, some
degree of support is expected to be needed in the period 2020-2030.
It will be possible to progressively phase-out economic support for mature RES technologies when RES develop-
ers can build business cases for their generation projects counting exclusively on revenues from the power mar-
kets. This, in turn, requires that the two following main conditions are met:
1. The level of revenues expected from power markets is sufficient to cover the generation costs (in-
cluding a certain economic return on investment, reflected in the cost of capital).
2. The level of risk associated with investments in RES-E, which strongly influences the generation
costs, is in line with the expected levels of return on investment.
The second element is of particular importance for RES-E generators, since wind and solar are characterised by
a high share of capital costs compared to their (very low) operating costs. This means that the largest share of
the generation costs for these plants is incurred already at the time of investment. Once the investment is done
there is little margin for optimisation of generation costs to adapt to power price changes.
2.2 Elements of RES Competitiveness: Drivers and barriers
It is generally perceived that the potential phase-out of economic support for renewables (in particular for PV
and onshore wind installations) should happen along with technological improvements that bring LCOE of re-
newables sufficiently low to compete on price with conventional generation technologies; however, renewable
technology costs are only part of the picture. While technology costs are a key element of RES competitiveness,
there are several other key influencing factors that need to be considered.
As a matter of fact, generation costs can also be reduced e.g. by tackling existing administrative and market
barriers that result in higher overall required investment costs for RES-E developers. Likewise, risk-mitigating
policies can substantially reduce the cost of capital, which is typically a main component in the cost structure of
RES-E generation projects.
Expected future revenues for RES developers can also be affected by a large number of factors. These include
power market design and regulation issues, the demand profile of the particular market where renewables op-
erate, the existing generation portfolio, among many others. In addition to electricity sales on the wholesale
market, RES-E producers could potentially obtain additional revenues participating in the balancing and ancillary
services markets.
Besides the level of revenues, the risks associated to those potential revenues also influence RES-E competitive-
ness, playing a key role in the final investment decisions. The predictability of project costs and revenues plays a
similar role.
All the factors mentioned above determine the potential business case for RES-E technologies (both from the
revenue side or the cost side) and therefore their potential for increased penetration in the future power mar-
kets. We identify all these aforementioned elements as ‘drivers and barriers of RES-E competitiveness’.
Page 4The phase-out of economic support to mature renewables
An overview of these elements can be found in Figure 4 below:
Figure 4 Elements of RES-E competitiveness. Barriers and drivers
Adequate policies and regulations can mitigate the effect of existing barriers for RES competitiveness as well as
enable the positive effects of identified drivers. As a result, these policies and regulations can bring reduction in
generation costs and increase in revenues for RES plants with reduced - and ultimately no - economic support.
In the following sections we discuss in depth the elements of RES competitiveness identified above as well as the
possible policy instruments and measures that can be implemented to act upon them.
Page 5The phase-out of economic support to mature renewables
3 Elements determining RES-E generation costs
An analysis of the elements composing the Levelised Costs of Electricity (LCOE) of RES-E offers insights into the
major levers to reduce RES-E generation costs and ultimately phase out economic support.
The LCOE reflects all costs needed to build a plant, operate it throughout its technical lifetime, and decommission
it. These costs are then normalized over the total net electricity generated. The use of LCOE allows for compari-
sons of costs across different generation technologies, with different unitary investment costs, capacity installed,
operation and maintenance costs and other characteristics such as technical lifetime. Figure 5 below shows the
main elements determining the LCOE of power generation technologies.
Figure 5 Main elements determining electricity generation costs
Investment costs include costs for land, engineering, technology, project development and construction of the
RES-E plant. While technology costs are a major component of the investment costs, the “soft” costs for project
development for RES-E technologies may also represent a substantial part of total costs.
The cost of capital is determined by the interest rate paid for debt, the expected return on equity, the debt/eq-
uity ratio, the period for which debt and equity need to be committed as well as fees paid (Klessmann et al.,
2013). The Weighted Average Cost of Capital (WACC) is often used as a measure of the cost of capital taking into
account the debt/equity ratio of different project costs. It represents the minimum return that a generation
project must earn to satisfy its creditors, owners, and other providers of capital.
The cost of capital of RES-E projects is highly dependent on national financial conditions, e.g. on the macroeco-
nomic rating of a country, but also on the national energy policy framework and power market regulations and
their stability.
Operation costs include the costs for operation and technical maintenance of the generation plant, costs for
guarantees and insurances as well as fuel and carbon costs. As wind and solar-PV plants do not have fuel nor
carbon costs, their operating costs are significantly lower – in relative terms - than those of conventional energy
sources.
Page 6The phase-out of economic support to mature renewables
Finally, the total electricity generation of the plant is determined by the load factor (full-load hours of operation
vs 8,760 total hours/year). All else equal, the larger the load factor, the smaller the generation costs expressed
in EUR/MWh. For solar PV and wind plants this element is mainly determined by the availability of the renewable
resource and the efficiency of the technology. However, it may be (negatively) influenced by market and/or sys-
tem regulations if these allow for the (uncompensated) curtailment of RES-E generators.
Table 1 below shows a list of drivers and barriers for the reduction of generation costs of RES-E technologies. In
the following subsections we analyse how these influence the generation cost components described above. For
each of them we discuss the possible options available for policy-makers to enhance and capitalise on the drivers
and address the barriers in order to create the right conditions for further investments in RES-E generation.
Table 1 Drivers and barriers for reduction of generation costs for RES-E
Drivers (+) Barriers (-)
Technology cost reductions Revenue risk
(reduces investment costs) (increases cost of capital)
Long-term stability of RES (and Market entry costs
overall energy) policies (increases investment costs)
Generation Costs (reduces cost of capital)
Market integration costs
RES sector maturity (increases operation costs)
(reduces both investment and oper-
ation costs)
Favourable financing conditions
(reduces cost of capital)
Page 7The phase-out of economic support to mature renewables
3.1 Driver 1: Technology cost reductions
Technology costs account for a very significant share of the overall investment costs for RES-E projects. Progres-
sive technology cost reduction has been one of the key levers to reduce power generation costs for any technol-
ogy. It is particularly relevant for wind and PV since the weight of the capital costs in the total costs is higher than
for other power market participants.
The significant reductions in the cost of wind turbines and PV modules and inverters have resulted in a substantial
reduction of generation costs in recent years. These reductions are expected to slow down but continue in the
future, following a phenomenon well-known for emerging technologies: the experience curve or learning curve
(Arrow, Kenneth J. 1962). Among the reasons driving costs down and explaining the learning curve we include:
increased experience; economies of scale derived from larger markets, organisational and process improve-
ments, etc.
Solar PV
In the past, module prices decreased by roughly 22% every time the cumulative installed capacity doubled. As a
result, in the past 20 years, the cost of PV modules and systems has been reduced very significantly. Figure 6
below shows the learning curve for PV modules and the main drivers behind the cost reduction.
Figure 6 Global average module price (2014 USD/Watt). Source: IRENA, 2015
Wind
Historical learning rates5 for wind power were roughly 10% until 2004 when wind turbine prices grew strongly,
partially explained by supply/demand imbalances and increase in component prices. After 2009, manufacturing
overcapacity, the reduction in raw materials costs caused by the financial crisis and increasing competition cre-
ated downward pressure on prices again (JRC, 2015). Figure 7 below shows the evolution of wind turbine prices
in recent years.
5 Learning rate: % of reduction in costs when installed capacity is doubled.
Page 8The phase-out of economic support to mature renewables
Figure 7 Evolution of wind turbine prices in EUR/kW based on the year of delivery and per year of contract signature
(PCSD) Source: JRC, 2015
As deployment of renewable energy technologies continues, it is expected that technology costs will continue to
decrease in the future, even though the cost decrease is usually less pronounced the more technologies mature.
Figure 9 and Figure 8 below show projections for the development of investment costs up to 2030. According to
these, wind onshore investment costs could decrease by around 20% and solar PV costs by around 30% by 2030
(Fraunhofer ISI et al. 2014).
Figure 8 Future specific investment costs for PV power. Source: Fraunhofer ISI, et al. 2014
Page 9The phase-out of economic support to mature renewables
Figure 9 Future specific investment costs for wind power. Source: Fraunhofer ISI, et al. 2014
3.2 Driver 2: Long-term stability and credibility of RES and cli-
mate policies
Credible renewable energy and climate policies can contribute to reducing generation costs without necessarily
providing dedicated economic support.
Providing policy stability is a key element to reduce the cost of capital. Stable, reliable and predictable political
targets and regulatory frameworks are important to provide a planning horizon for project investors and a project
pipeline for component and service providers. For instance, quantitative RES-E targets express a commitment to
encourage investments not just into RES-E and its supply chain, but also into the necessary transmission and
distribution grids (Piria et al., 2013).
Credible RES targets contribute to the credibility of the policy support framework and therefore they may have
a substantial positive impact in the cost of capital. Interviews with financing experts carried out over the course
of the RESHAPING6 project shown that LCOE of RES-E projects are assessed to be up to 10% lower if market actors
do not expect abrupt changes in the regulatory or support framework (Rathmann et al. 2011).
In the period while economic support for RES is still required, a key lever to provide political stability is to avoid
retroactive support scheme changes. Retroactive changes are changes that are announced and negatively impact
projects and their financial viability when investments have already taken place (i.e. projects that are under con-
struction or in operation). Retroactive policy changes in economic support to RES have been implemented in
several EU countries7.
The motivation behind these changes is often to cut costs immediately, but the short-term policy cost saving may
be outweighed by the increase of policy costs that come with higher risk premiums for RES-E projects at a later
stage. The negative effects of retroactive policy changes in the investment environment in the RES sector may
persist in the medium-term. The resulting high risk premiums for developers are a serious barrier to build busi-
ness cases without the need for economic support.
6 http://www.reshaping-res-policy.eu/
7 See e.g. EPIA, 2013
Page 10The phase-out of economic support to mature renewables
3.3 Driver 3: RES sector maturity
In general, wind turbines and PV systems are subject to global competition. However, the specific maturity of
the local renewable energy sectors may have an effect in the actual generation costs, in the competiveness of
RES technologies in specific power markets and therefore in the outlook for a phase out of economic support in
those countries. This is the case for the following reasons:
Firstly, advanced RES markets are characterised by the presence of a larger number of specialised companies
(equipment manufacturers and distributors, developers, installers, etc.) and increased access to qualified and
specialised professionals. These two factors typically result in increased competition, streamlined manufacturing
and installation processes and therefore reduced generation costs.
Secondly, the experience accumulated by public and private institutions in mature RES markets may contribute
to a reduction in investment costs. This may happen e.g. by means of adaptation of regulations and technical
codes to the new technologies, which in turn reduces the amount of time and resources that developers need
to spend to comply with administrative and permitting procedures. Similarly, experience accumulated by finan-
cial institutions may result in more advanced and customised financial mechanisms and lower risk premiums for
developers.
Public policies may speed up the process to market maturity by implementing training programmes for profes-
sionals, incentivising knowledge transfer and adopting best institutional practices for permitting procedures.
Again, a key element is policy stability. ‘Stop and go’ policies typically create excessive long-term risks for the
consolidation of domestic RES industries.
The European market for wind and PV can be considered relatively mature, but there are significant differences
among Member States. Renewable generation technologies have achieved substantial reductions in costs and
increased levels of penetration in the European power markets in recent years. In particular, wind and PV are by
far the predominant renewable technologies being installed in the EU markets nowadays. Figure 10 shows the
net installed capacity for all non-fossil generation technologies in Europe from 1990 to 2013. Solar PV and on-
shore wind are the two RES technologies with the highest growth in recent years.
Page 11The phase-out of economic support to mature renewables
Figure 10 Evolution of generation capacity in the EU 28. Source: Eurostat
While it is clear that both wind and solar are quickly advancing to technological maturity and achieving increasing
levels of penetration in the European power markets, the situation varies substantially depending on the tech-
nology and Member State considered. Figure 11 and Figure 12 below show the deployment status indicator8 for
wind onshore and PV respectively for the EU-28 Member States. Both graphs show substantial differences in RES
market maturity across EU Member States. This means that there is still potential for decreasing RES investment
costs by increasing market maturity, especially in the Member States with less developed markets.
8 The Deployment Status Indicator aims to quantify how advanced the market for a specific renewable technology is in a
specific Member State. Source: Held et al. 2014 DIA-CORE D2.1: Assessing the performance of renewable energy support
policies with quantitative indicators – Update 2014.
Page 12The phase-out of economic support to mature renewables
Figure 11 Deployment Status Indicator for onshore wind in the EU-28 in 2012. Source: Held et al. 2014
Figure 12 Deployment Status Indicator for PV plants in the EU-28 in 2012. Source: Held et al. 2014
3.4 Driver 4: Favourable national financing conditions
National credit rating and the national interest rate can have a considerable impact on the cost of capital. The
availability of finance is however not only a result of the domestic macroeconomic conditions, but also on the
ease of getting credit for RES-E projects in particular. While policy and revenue uncertainty impair the availability
of credit and cost of capital for of RES-E plants, specific RES-E financing solutions could help. These could include
soft loans with low interest rates or grace periods, but also loan guarantees where the government underwrites
debt for a project or provides guarantees for the case a project defaults. Such financing support reduces the risk
exposure of lenders and thereby reduces the cost of capital of RES-E projects (Rathmann et al. 2011).
Page 13The phase-out of economic support to mature renewables
3.5 Barrier 1: Revenue risk
Uncertainty about future revenues increases the level of risk for RES-E projects, resulting in an increase in risk
premiums and therefore in higher costs of capital. Since RES-E plants are highly capital intensive, high revenue
risks result in substantially higher generation costs, endangering the business case for RES-E project developers.
In addition to increased generation costs, the higher risk premiums imply that investment in RES-E projects be-
comes unattractive for the more risk averse spectrum of investor profiles, reducing the financing options availa-
ble for RES-E developers.
Existing support schemes mitigate revenue risk for RES-E project developers to different degrees: quota schemes
expose the operator to both wholesale market revenue and green certificate price risks (in some cases limited);
feed-in premium schemes also expose RES-E to wholesale market revenue risk, but guarantee a level of support
payments. Fixed feed-in tariffs (FIT) and sliding feed-in premiums (i.e. contracts for difference) provide the high-
est level of revenue stability as they provide a fixed payment (in the case of FIT) or a stable combination of
support premium and market price (in the case of the sliding premium).
Figure 13 Payments by support scheme type (Source: Ecofys)
A number of Member States has shifted from fixed feed-in tariffs to feed-in premium schemes that further the
market integration of RES-E by gradually exposing them to market prices (even though the associated revenue
risk differs strongly from a sliding to a fixed feed-in premium scheme). Through participation to the wholesale
market, RES-E producers have an incentive to optimise their production according to market prices. In markets
without economic support, the revenue for RES-E generators is not protected by the design of the support
scheme. RES-E plants are fully exposed to market risks.
In this situation, the revenue risk can be split into two main elements, namely: price risk and volume risk.
Price risk refers to the uncertainty and variability of the future power prices that RES-E developers will obtain
from the markets.
Market prices evolve due to a combination of a large number of factors e.g. level of electricity demand, fossil
fuel prices, capacity availability, market design elements such as the availability of capacity mechanisms, changes
in the weather, among many others.
In the last few years, wholesale power market conditions across the EU have become very difficult for prospective
investors in new generation. Power prices are in most cases insufficient to cover life-cycle generation costs, not
only for renewables, but also for mature conventional technologies. Among the reasons for this situation is the
excess generation capacity present in some Member States as a result of stagnated demand following the eco-
nomic crisis as well as the increasing volumes of renewable generation.
Page 14The phase-out of economic support to mature renewables
Future power prices in wholesale markets are difficult to predict for all market actors; however, RES-E developers
are particularly vulnerable to this uncertainty due to its capital intensive cost structure characterised by large
initial investments.
However, market revenues for RES-E developers depend not only on the average wholesale market price but
also on the relative market value9 of RES-E technologies in a specific wholesale market. As it will be discussed
later in section 4.4, the market value of variable, almost zero marginal cost technologies like solar PV and onshore
wind decreases with the level of penetration of the technology in the market.
In the absence of sufficient predictability of future power prices, potential investors will be very reluctant to
invest in RES-E projects; however, future price risk may be mitigated by entering into long-term contracts. The
availability of a long-term contract may reduce generation costs for RES-E generators by ~20% through a combi-
nation of increased possible leverage and reduced costs of capital (Weiss et al. 2013). However, the financial
terms of the long-term contract will be influenced by the RES market value and the market price risk.
The long-term predictability of revenues for RES-E can be improved with the implementation of functioning,
transparent and liquid forward power markets; while this is already the case in some parts of Europe, others still
struggle with barriers for the participation of RES-E generators in these markets, including: lack of transparency
of market rules; high cost of guarantees to formalise contracts; non-availability of forward products suitable for
RES-E generators.
Volume risk refers to the amount of energy that the RES-E generator is able to sell in the market. In this paper
we mainly focus in wind onshore and solar PV. Both these technologies are resource-driven (vRES) and therefore
‘non-dispatchable’. Current power systems and markets were designed primarily with dispatchable technologies,
resulting generally in low levels of system flexibility. The availability of wind and solar resource determines the
time at which power can be generated and the power output. When wind and solar power are curtailed at times
of congestion in the grid, this results in energy generation lost and revenues foregone.
Levels of curtailment can be reduced by increasing system flexibility (e.g. through increased demand response
grid reinforcement, power storage, larger control areas – regionalisation of power system as well as use of more
grid friendly vRES technologies). Another measure that has been used so far is granting priority dispatch to re-
newable generators. Curtailment risk can be lowered with clear, precise and transparent grid management and
dispatch rules, so that revenue losses linked to curtailment can be predicted up-front by RES-E operators. Nev-
ertheless, risk of curtailment will likely increase with increasing shares of vRES. Curtailment could be interpreted
as a system service in situations when the power system simply cannot absorb the amount of power fed into the
grid during high-resource-low-demand moments. It should be priced in a structured way by a well-designed an-
cillary services market.
Some countries compensate RES-E generators for curtailment, in order to limit the related volume and financial
risk and this compensation rules may constitute the starting point for the ancillary services debate.
9 Ratio of the average price per MWh received by a specific technology and the average wholesale market price
Page 15You can also read