The QBE Australian Housing Outlook 2017-2020 - CONTENTS - QBE Insurance Group
←
→
Page content transcription
If your browser does not render page correctly, please read the page content below
CONTENTS

     The QBE
     Australian
     Housing
     Outlook
     2017–2020
About this report
Produced by BIS Oxford Economics
for QBE Lenders’ Mortgage Insurance.
This report provides an analysis and
forecast of the key drivers influencing
the residential housing market nationally,
as well as across each of Australia’s state and
territory capital cities and selected regional
centres. The analysis presents an outlook
for the performance of the residential
market, as measured by historical and
forecast movement in the median house
price and median unit price. The forecast
annual percentage changes in the median
house price and median unit price in
the price forecast charts in this report
are often rounded to the nearest whole
number. Any reference to price growth
in the text may not be identical to that
indicated in the charts due to the impact
of this rounding. The Australian Housing
Outlook 2017 to 2020 report has been
updated with reference to the recently
published data from the 2016 Census.
The regional weightings used in providing
the weighted median house and unit
price have been revised to account for the
updated dwelling counts at the 2016 Census.
The new weightings have resulted in some
minor revisions to the weighted median
house and unit prices since 2011, when
the last Census dwelling stock count was
undertaken. Revised population estimates
and household counts (by age) resulting
from the 2016 Census have resulted in an
update to recent estimates of the underlying
demand for dwellings. The analysis of this
data has also provided insights upon which
to base updated forecasts of underlying
demand for dwellings in each state.
The revisions to underlying demand have
necessitated a reassessment of the dwelling
stock deficiency or oversupply in each
state (and forecasts), which in turn is a key
component of the dwelling price forecasts.

DISCLAIMER: The information contained in this
publication has been obtained from BIS Oxford Economics
Pty Ltd and does not necessarily represent the views or
opinions of QBE Insurance (Australia) Limited ABN 78 003
191 035 (QBE). This publication is provided for information
purposes only and is not intended to constitute legal,
financial or other professional advice and has not been
provided with regard to the investment objectives or
circumstances of any particular reader. While based on
information believed to be reliable, no guarantee is given
that it is accurate or complete and no warranties are made
by QBE as to the accuracy, completeness or usefulness
of any of the information in this publication. The opinions,
forecasts, assumptions, estimates, derived valuations
and target price(s) (if any) contained in this material are
as of the date indicated and are subject to change at any
time without prior notice. The information referred to
may not be suitable for specific investment objectives,
financial situation or individual needs of recipients and
should not be relied upon in substitution for the exercise
of independent judgment. Recipients should obtain
their own appropriate professional advice. Neither QBE
nor other persons shall be liable for any direct, indirect,
special, incidental, consequential, punitive or exemplary
damages, including lost profits arising in any way from the
information contained in this material. This material may
not be reproduced, redistributed, or copied in whole or in
part for any purpose without QBE’s prior written consent.

CONTENTS

                  Welcome to
             The QBE Australian Housing
                 Outlook 2017–2020

               Houses versus units, capital cities or
              regional centres, there’s never been a
              more compelling time to examine the
                   Australian housing market

The detached house on a quarter acre block with a Hills Hoist in the backyard was always
the typical Australian dream. But with units accounting for around 46% of all residential
construction, significantly more in our major capital cities, it’s clear that more of us are now
considering life in an apartment.

One of the key themes in this year’s QBE Australian Housing Outlook is the growing prevalence
of units on the property landscape. In the background to this, the interplay between
demand, supply and lending activity paints an evocative picture of a myriad of separate but
interconnected property markets across Australia. Continued population growth, set against
historic low interest rates, has been a key driver that has delivered the market to where it is today.

This is the 16th year we’ve partnered with BIS Oxford Economics to present the QBE
Australian Housing Outlook. Inside, you’ll find state and territory analysis and forecasts
of house and unit prices for the next three years.

This year, we’ve added to our regional coverage to include Toowoomba in Queensland and
Launceston in Tasmania. We’ve also revisited some key mining towns in Queensland and
Western Australia for a pulse check of these markets. We shine a spotlight on regulator measures
to influence investor demand and track the effect this is having on our property market.

We know the dream for Australians is to own their own home and for many that’s a significant
challenge. However, for some 105,000 homeless people, simply finding shelter is a daily
battle. It’s my hope that as we address the housing needs of our growing population, we can
as a community also tackle the wider issue of homelessness.

You may have noticed this year’s QBE Australian Housing Outlook has a new look and I’d like
to invite you to take a closer look at the report and share your thoughts with us.

Phil White
CEO
QBE LENDERS’ MORTGAGE INSURANCE

                                                            The QBE Australian Housing Outlook 2017–2020   1
Table of                                                                                  Demand and supply

                                                                                                   Keeping pace
         contents                                                                                  Units now account for an increased
                                                                                                   share of demand as affordability,
                                                                                                   and perhaps lifestyle, inform
                                                                                                   property choices and accessibility

                                                                                                                        50
    SECTION                                                                           PAGE

    01.            Introduction                                                          1

    02.            Housing outlook                                                      4

    03.            State and Territory overview
                   State and Territory outlook
                                                                                        6
                                                                                        8
                   New South Wales outlook                                             10
                   Victoria outlook                                                     14         New South Wales outlook
                   Queensland outlook                                                   18
                   Western Australia outlook
                   South Australia outlook
                                                                                       24
                                                                                       28
                                                                                                   Growing pains
                   Tasmania outlook                                                     31
                   Australian Capital Territory outlook                                34          Upswing in NSW property sector
                   Northern Territory outlook                                          36
                                                                                                   has partly fuelled the state’s
                                                                                                   economic growth, but affordability
                                                                                                   remains challenging

    04.            National rental activity                                           38

    05.            Economic outlook                                                   40
                                                                                                    10
    06.            Buyer activity                                                     44

    07.            Demand and supply                                                  50

    08.            Glossary of terms                                                  56

              This is an interactive PDF designed to enhance your experience. The best way to
2             utilise this PDF is through Adobe Reader. Click on the links above in the contents
              or use the buttons throughout to navigate the report.
Queensland outlook

  18                                                                       Solid stock
                                                                           Improving economic fundamentals
                                                                           are now emerging in Queensland’s
                                                                           post-mining boom, but Brisbane is
                                                                           forecast for an oversupply of units

                                                                           Economic outlook

                                                                           Fundamentally
                                                                           sound
                                                                           A downturn in residential
                                                                           construction likely to create
                                                                           a subdued national economy,
                                                                           while low interest rates support
                                                                           affordability in some markets

Buyer activity

A mixed                                                     44                                         40
market
Owner occupiers benefit from
low interest rates, while investors
are influenced by lenders

                                      Victoria outlook

                                      People power
                                      Dwelling commencements
                                      set to ease, but Victorian economy
                                      likely to benefit from high
                                      levels of migration

                         14
                                                                             The QBE Australian Housing Outlook 2017–2020   3
02.   Housing
                          outlook

       Australian
       housing snapshot

    Economic indicators 2020 forecast
                                                                                          Overseas
     Cash rate            Employment growth                  Unemployment rate            migration

     1.75% 1.6% 5.7%
     2017 1.5%            2017 2.2%                          2017 5.7%
                                                                                          231,900
     Consumer Price                                          Gross Domestic               year to
                                                      2.7

     Index (CPI) growth                                      Product (GDP)                March 2017
                                        2.5

                                               2.5

                                                             growth
                                 1.9

     2.7%                                                    2.9%
                           1.0

                                                                                          26.8%
                                                      2020
                          2016

                                        2018

                                               2019
                                 2017

     2017 1.9%                                               2017 1.9%                    from March 2016

     Housing                Population
     affordability

     31.2%
                            24,511,800                                        1.6%
     at June 2017           at March 2017                                     from 2016

4
CONTENTS

Borrowing rates 2020 forecast
 Standard variable rate       Interest only                       Housing investor rate           Interest only
                              – owner occupier                                                    – investor

 5.5% 6.0% 6.0% 6.5%
 2017 5.3%                    2017 5.8%                           2017 5.8%                       2017 6.3%

 House commencements                                                  Vacancy            Sydney                Brisbane
                                                                      rates                    1.8%                  2.8%
 ‘000s pa                     ‘000s pa                                at June 2017       2016 1.8%             2016 2.8%

 105.8                        110.0                                                      Melbourne
                                                                                               2.2%
                                                                                                               Perth
                                                                                                                     7.3%
 10 years to 2012             five years to 2017
                                                                                         2016 2.7%             2016 6.0%

 Unit commencements                            Unit dwellings                                          Total dwelling
                                                                                                       commencements
                                               as a proportion of total
 ‘000s pa           ‘000s pa                   dwelling commencements
                                                                                                       153.4                ‘000s
                                                                                                                            pa

 52.6               94.0                       33% 46%
                                                                                                       10 years to 2012

 10 years to 2012   five years to 2017         10 years to 2012    five years to 2017
                                                                                                       204.0                 ‘000s
                                                                                                                             pa
                                                                                                       five years to 2017

                                                                                        The QBE Australian Housing Outlook 2017–2020     5
03.               State and Territory
                                           overview

                  States at
                  a glance

                                        NSW                            VIC                          QLD                           WA

               Population

            at March 2017           7,837,700                    6,290,700                    4,907,600                     2,576,000

       2012–2017 growth                  7.5%                         11.8%                         7.9%                         7.0%
    ANNUAL MOVEMENT
              2016/17

          First home buyer
                 (FHB) loans            -6.6%                         -2.0%                        11.2%                         -6.5%
            Non FHB loans                0.2%                         0.7%                          0.7%                         -7.9%
    Investor loans (value)              19.7%                         13.9%                         -1.6%                       -17.6%

                                      Sydney                    Melbourne                      Brisbane                         Perth
           Median house
       price at June 2017           $1,177,769                    $852,724                     $550,840                      $520,519
      Annual movement
      (year to June 2017)                   12.4%                        13.7%                         2.0%                             -7.5%
      2017–2020 forecast
    growth % house price
                                            -0.2%                        10.2%                          7.1%                            2.8%

             Median unit
       price at June 2017           $790,063                      $561,709                      $414,812                     $402,247

      Annual movement
      (year to June 2017)                    7.3%                         7.8%                         -3.1%                        -0.8%
      2017–2020 forecast
      growth % unit price                   -3.8%                        -4.8%                         -7.2%                        -0.6%

             Affordability 1                39.7%                        36.2%                        20.6%                         20.2%

                               1   Percentage of monthly disposable household income for mortgage repayment. Mortgage repayment based
6                                  on 75% of the median house price.
CONTENTS
                                              Darwin

                                                       Northern
                                                       Territory

                                                                                 Queensland

                                  Western
                                  Australia
                                                                                                    Brisbane
                                                          South
                                                         Australia

                          Perth
                                                                                  New South Wales
                                                                                            Sydney
                                                                                           Canberra
                                                                   Adelaide
                                                                               Melbourne
                                                                                      ne

                                                                              Victoria

                                                                                   Tasmania
                                                                                           Hobart

   SA         TAS        ACT                           NT

                                                                              Population
1,721,000   520,100    409,100                  245,000                       at March 2017


  4.1%        1.6%       9.2%                          4.8%                   2012–2017 growth

                                                                              ANNUAL MOVEMENT
                                                                              2016/17

                                                                              First home buyer
  -1.0%       0.3%       1.7%                      30.4%                      (FHB) loans

  0.6%       13.1%      -0.3%                      -12.1%                     Non FHB loans

  -0.3%      12.8%      21.4%                     -22.8%                      Investor loans (value)

Adelaide    Hobart     Canberra                  Darwin
                                                                              Median house
$477,206    $424,264   $645,000               $540,000                        price at June 2017

                                                                              Annual movement
    4.2%        6.1%       4.1%                         -6.3%                 (year to June 2017)

    6.9%       10.8%      16.3%                         -0.9%                 2017–2020 forecast
                                                                              growth % house price

                                                                              Median unit
$360,434    $331,317   $425,000               $470,000                        price at June 2017

                                                                              Annual movement
    6.8%       -0.5%      -2.3%                         -6.0%                 (year to June 2017)

                                                                              2017–2020 forecast
    3.2%       8.7%        2.4%                         -3.2%                 growth % unit price

   20.5%       17.8%      14.8%                         19.7%                 Affordability 1

                                                         The QBE Australian Housing Outlook 2017–2020           7
03.             State and Territory
                                         outlook

                            On the
                           horizon
               Low interest rates and investor
                 activity have been demand
               drivers, but regulator measures
                  are set to dampen future
                         price growth

    The outlook for house and unit prices is likely to become more subdued over the
    next year or two. Many markets are now building too much stock, particularly
    units, after new dwelling starts peaked at a record 233,600 dwellings in 2015/16.
    Restrictions on bank lending to investors are expected to be an increasingly prominent
    feature of the outlook for the market over 2017/18. This will most likely reduce investor
    purchaser activity and slow price growth. Owner occupier demand is also expected
    to weaken, as the emerging downturn in new dwelling commencements translates into
    lower building activity over 2017/18 and 2018/19 and negatively affects the economy.

    Demand and supply
    Population growth has been strong. Net overseas migration inflows rose from 178,600
    in 2014/15, to an estimated 215,000 in 2016/17. Slowing economic growth is expected
    to cause net overseas migration to ease to 175,000 by 2019/20. While lower than
    recent cycles, this figure is up compared to the long-term, 20-year trend of 171,100 per
    annum and is higher than most years through the 1990s and early 2000s. This will
    continue to fuel underlying demand for dwellings. New dwelling commencements rose
    to record levels in 2014/15 and 2015/16, and are still well above underlying demand.
    Only New South Wales, Victoria and Tasmania are expected to be in dwelling deficiency
    over the next three years. However, the excess stock in markets is more likely to be for
    units, which have accounted for the larger share of the upturn in new dwelling supply.

    Lending environment
    Low interest rates have helped drive up prices and investors have been a key source
    of demand. Successive initiatives by the financial regulators to dampen speculative
    investment has resulted in banks lowering loan-to-value ratios to investors, as well
    as charging higher interest rates to investors and for interest only lending. The latest
    restrictions on interest only loans are expected to cause a slowdown in investor
    lending over 2017/18. This is likely to have a negative effect on dwelling prices, with
    price falls expected in some cities.

    Median prices
    Median house price growth in Sydney and Melbourne is expected to weaken in
    2017/18 due to lower investor activity in the market. This is expected to have a greater
    affect in Sydney, given its greater recent influence from investors. The emerging
    momentum in house price growth in Canberra and Hobart is forecast to continue
    in 2017/18. Modest house price rises are expected in Brisbane and Adelaide; with
    these markets being dampened by weak local economic conditions. The downturns
    in Perth and Darwin are forecast to bottom out in 2017/18 although any recovery
    is likely to be drawn out. Unit price growth is forecast to underperform house price
    growth. A disproportionately higher number of units being built in most markets
    will result in an excess supply in units. Restrictions on investor lending will also have
    a negative effect, given units are more favoured by investors.

8
CONTENTS
Median prices by capital city quarter ended June 2017
Houses
Sydney Melbourne Brisbane Perth Adelaide Hobart Canberra Darwin
$’000 % VAR $’000 % VAR $’000 % VAR $’000 % VAR $’000 % VAR $’000 % VAR $’000 % VAR $’000 % VAR
Forecast growth (%)
2017–2020 -0.2 10.2 7.1 2.8 6.9 10.8 16.3 -0.9
Forecast
2020 1,150.0 1.3 940.0 2.2 590.0 2.6 535.0 1.9 510.0 3.0 470.0 1.1 750.0 2.7 540.0 0.9
2019 1,135.0 -2.6 920.0 2.2 575.0 1.8 525.0 1.0 495.0 1.0 465.0 3.3 730.0 5.8 535.0 0.0
2018 1,165.0 -1.1 900.0 5.5 565.0 2.6 520.0 -0.1 490.0 2.7 450.0 6.1 690.0 7.0 535.0 -0.9
Prior years
2017 1,177.8 12.4 852.7 13.7 550.8 2.0 520.5 -7.5 477.2 4.2 424.3 6.1 645.0 4.1 540.0 -6.3
2016 1,048.0 2.5 749.9 7.5 540.0 5.3 562.7 -3.8 458.1 3.1 400.0 10.5 619.5 7.8 576.0 -5.6
2015 1,022.6 24.1 697.7 15.6 512.8 4.3 584.7 -3.0 444.5 2.1 361.9 1.2 574.5 4.5 610.0 -1.7
2014 824.0 17.3 603.6 10.5 491.6 6.3 602.8 5.8 435.4 6.3 357.8 6.0 550.0 1.9 620.8 1.4
2013 702.5 8.2 546.3 3.4 462.5 4.0 569.8 10.7 409.7 0.5 337.4 -2.1 540.0 5.9 612.0 7.4
2012 649.1 -0.4 528.4 -5.3 444.6 -2.9 514.7 -1.6 407.7 -3.0 344.5 -1.6 510.0 -1.9 570.0 10.7
2011 651.6 -0.4 558.2 -3.5 457.7 -5.7 522.9 -3.9 420.4 -2.2 350.0 -0.7 520.0 4.0 515.0 -7.3
2010 654.5 15.1 578.4 24.8 485.3 9.1 544.3 9.3 429.7 11.1 352.6 8.4 500.0 10.7 555.3 18.2
2009 568.6 1.2 463.5 0.1 444.8 -3.2 498.0 -1.9 386.9 -2.1 325.3 2.4 451.8 -3.8 469.9 11.0
2008 561.8 1.0 463.1 11.1 459.3 13.1 507.8 -1.8 395.0 16.0 317.7 5.6 469.5 6.1 423.3 7.2
2007 556.4 2.7 416.9 11.2 406.1 16.0 517.0 9.8 340.7 10.6 300.8 6.1 442.5 13.5 395.0 12.9
2006 541.7 -0.9 374.7 7.5 350.2 7.0 470.8 48.7 308.0 7.6 283.5 13.3 390.0 6.0 350.0 25.1
2005 546.6 0.9 348.6 4.0 327.2 2.1 316.6 13.8 286.1 6.8 250.1 6.2 368.0 -1.9 279.8 9.7
2004 541.9 6.7 335.0 7.0 320.5 29.1 278.2 15.6 268.0 16.4 235.5 58.8 375.0 13.7 255.0 23.8
2003 507.8 15.7 313.0 9.8 248.3 27.4 240.7 16.3 230.3 24.7 148.2 25.3 330.0 29.4 206.0 3.0
2002 438.7 20.8 285.1 18.7 194.9 17.9 207.0 12.1 184.6 17.6 118.3 4.8 255.1 21.5 200.0 7.0
2001 363.1 17.5 240.2 7.4 165.3 2.7 184.6 4.6 156.9 6.6 112.9 -0.3 210.0 14.1 187.0 -1.8
2000 308.9 14.3 223.6 14.2 161.0 6.7 176.5 6.8 147.2 11.2 113.3 6.7 184.0 15.0 190.4 8.2
Units
Sydney Melbourne Brisbane Perth Adelaide Hobart Canberra Darwin
$’000 % VAR $’000 % VAR $’000 % VAR $’000 % VAR $’000 % VAR $’000 % VAR $’000 % VAR $’000 % VAR
Forecast growth (%)
2017–2020 -3.8 -4.8 -7.2 -0.6 3.2 8.7 2.4 -3.2
Forecast
2020 760.0 -0.7 535.0 -0.9 385.0 -2.5 400.0 1.3 372.0 1.9 360.0 1.4 435.0 1.2 455.0 1.1
2019 765.0 -2.5 540.0 -0.9 395.0 -2.5 395.0 0.0 365.0 0.0 355.0 2.9 430.0 1.2 450.0 0.0
2018 785.0 -0.6 545.0 -3.0 405.0 -2.4 395.0 -1.8 365.0 1.3 345.0 4.1 425.0 0.0 450.0 -4.3
Prior years
2017 790.1 7.3 561.7 7.8 414.8 -3.1 402.2 -0.8 360.4 6.8 331.3 -0.5 425.0 -2.3 470.0 -6.0
2016 736.2 2.8 521.2 2.6 428.1 -0.8 405.7 -5.5 337.5 1.3 333.1 10.6 435.0 1.6 500.2 4.2
2015 716.0 15.6 508.0 4.9 431.8 4.3 429.3 -1.4 333.1 -2.1 301.1 -1.9 428.0 4.4 480.0 -1.0
2014 619.5 12.2 484.1 6.1 413.9 4.9 435.3 0.0 340.0 4.2 307.0 -1.0 409.9 0.0 485.0 4.5
2013 552.0 6.6 456.3 2.5 394.6 1.0 435.3 6.4 326.5 2.4 310.0 4.8 410.0 -2.4 464.0 6.7
2012 517.9 4.3 445.3 -3.2 390.7 -0.3 409.1 1.8 318.9 -4.5 295.8 1.7 420.0 0.0 435.0 2.4
2011 496.4 2.2 460.1 0.0 391.9 -2.6 401.8 -3.0 333.9 -0.4 291.0 -0.3 420.0 1.2 425.0 -2.9
2010 485.6 15.7 460.3 18.3 402.2 6.8 414.3 7.7 335.1 8.6 292.0 5.6 415.0 10.7 437.6 15.1
2009 419.9 3.0 388.9 4.4 376.5 -2.9 384.5 -0.9 308.7 4.6 276.4 1.1 375.0 7.1 380.1 15.5
2008 407.5 -0.1 372.6 7.7 387.8 11.4 388.0 0.9 295.2 11.9 273.3 9.9 350.0 -1.4 329.0 17.8
2007 408.2 1.6 345.9 12.7 348.2 13.2 384.5 11.3 263.8 14.7 248.6 -1.2 355.0 9.2 279.3 4.4
2006 401.7 0.8 307.0 6.2 307.7 10.2 345.6 34.2 229.9 5.0 251.7 12.0 325.0 4.2 267.5 32.1
2005 398.3 1.2 289.2 1.6 279.3 9.1 257.5 15.6 218.9 7.5 224.6 8.7 312.0 4.0 202.5 6.6
2004 393.7 3.4 284.5 1.3 256.0 20.6 222.8 6.0 203.7 12.3 206.7 45.0 300.0 15.4 190.0 20.9
2003 380.7 2.5 280.8 6.0 212.2 10.1 210.1 19.9 181.4 29.7 142.6 26.5 260.0 20.4 157.1 2.8
2002 371.5 13.5 264.9 19.0 192.7 4.0 175.2 16.4 139.8 11.4 112.7 10.4 216.0 39.4 152.8 7.8
2001 327.3 5.1 222.5 11.6 185.2 1.2 150.4 8.5 125.5 16.9 102.1 -11.6 155.0 9.2 141.8 1.1
2000 311.5 10.9 199.4 14.1 183.0 11.4 138.7 9.2 107.3 9.4 115.4 12.4 142.0 5.2 140.3 -8.0
The QBE Australian Housing Outlook 2017–2020 903. New South Wales
outlook
Growing Sydney house market
pains The Sydney residential market
has been in significant deficiency
since 2005/06 as rising migration
has contributed to population
growth and an increase in
Upswing in NSW property sector demand for housing.
has partly fuelled the state’s Market conditions
economic growth, but affordability Low interest rates and the persistent
underlying shortage of dwellings, combined
remains challenging with a buoyant state economy, led to the
median house price escalating rapidly
at an average of 10.4% per annum in the
six years to June 2017 to be $1,177,800.
Over the 12-months to June 2017,
price growth was focused in Middle (15.1%)
and Outer (12.5%) ring Sydney suburbs,
while Inner ring Sydney suburbs (7.8%) grew
at a slower pace. Population growth remains
strong, although there are signs of a rising
net interstate migration outflow.
Significant capital growth and low interest
rates have caused investor activity to surge,
with the value of residential investor
loans in New South Wales having grown
at 9.8% per annum over the last decade.
In comparison, the value of loans to owner
occupiers grew by just 4.9% per annum
over the same period.
Investors
Median house price growth peaked at
24.1% over 2014/15 before price growth
slowed to just 2.5% in 2015/16. The easing
in price growth over 2015/16 was despite
the strong fundamentals of the Sydney
market. The slowdown was a result of
changes to bank lending policy in response
to guidelines issued by the Australian
Prudential Regulation Authority (APRA)
to curb speculative investor lending.
The value of loans to investors fell by 17%
in 2015/16, partly offset by some growth
in lending to owner occupiers.
However, a combination of a 50 basis point
cut to interest rates in 2016 and some more
favourable lending conditions for investors
brought a 20% recovery in investor lending
in 2016/17. New APRA guidelines were
introduced in March 2017 specifically
targeting interest only lending favoured
by investors. This measure is anticipated
to keep growth in investor lending in check
through 2017/18, and cause price growth
to weaken.
10CONTENTS
Owner occupiers disposable income. Although banks have Sydney unit market
Growth of owner occupier loans is also been more aggressively courting owner
expected to slow. New dwelling supply occupiers by reducing the owner occupier
variable rate by around 10 basis points in
The upturn in new dwelling supply
began to outpace underlying demand
recent months, affordability is still a similar
in Sydney since 2010/11 has been
in 2015/16, although the market remains
percentage to the previous downturn in
characterised by a proportionate
in overall undersupply. Rental vacancy
the mid-2000s. The stamp duty exemption
increase in both house and unit
rates are largely below the 2% mark,
introduced in July 2017 to first home buyers, supply. High density completions
indicating a tight market. However,
is expected to have little effect in Inner began to accelerate in 2012/13
affordability has become increasingly
strained. Mortgage repayments on 75% and Middle ring Sydney suburbs where with the share of total dwelling
of Sydney’s median house price at June 2017 median prices are well above the $650,000 completions rising to 52% in 2016/17.
accounts for 39.7% of average household threshold for a full stamp duty concession. This came mainly at the expense
of medium density completions
with a small fall in the share
of detached house completions.
Outlook
Median unit price
With completions well ahead of demand, the state’s dwelling shortage lowered
Price growth in the Sydney unit market
to an estimated 39,300 dwellings at June 2017 and is projected to ease to around
continues to lag behind the house market.
12,900 at June 2020. While this will ease owner occupier demand, it will create
Sydney’s median unit price rose by an
challenges for investors, who are finding it increasingly difficult to obtain finance
estimated 8.1% per annum over the six-year
to be able to outbid owner occupiers. As a result, house prices are expected
period to June 2017 compared to price
to decline by a cumulative 4% over the two years to 2018/19 before modest
growth of 10.4% per annum for houses.
growth returns to take the median house price to $1,150,000 at June 2020.
After surging by 12.2% in 2013/14 and 15.6%
in 2014/15, median unit price growth has
started to flatten out. Regulatory changes
announced in late 2015 had a greater impact
on investor demand and in turn, the unit
market. Median unit price growth eased
to just 2.8% in 2015/16, but strengthened
New South Wales: dwelling prices to 7.3% in 2016/17 as investor demand
($’000) recovered, taking the median unit price
FORECAST
1,280 to $790,100 at June 2017.
Sydney house price
2016: +2 2018: -1
2017: +12 2019: -3
2020: +1
Outlook
Sydney real
house price With higher interest rates and
2016: +1 2018: -3 lower loan-to-value ratios for
640 2017: +10 2019: -5
2020: -1 investor lending, capacity for
investors to enter the market
Sydney unit price
or pay higher prices is limited.
2016: +3 2018: -1
2017: +7 2019: -3
This will put downward pressure
2020: -1 on unit prices as investors retreat
from the market. Yields in Sydney
Sydney real unit price are also at record lows. The large
320
2016: +2 2018: -3 volume of new apartment
2017: +5 2019: -5
2020: -3 construction taking place is likely
to push vacancy rates up and put
Wollongong downward pressure on rental
house price
2016: +11 2018: +5 growth as the dwelling deficiency
2017: +13 2019: -1 is slowly eroded. However, some
160 2020: +1
support to price growth might
Newcastle be provided by first home buyers
house price
2016: +4 2018: +7 taking advantage of the recently
2017: +13 2019: +2 introduced exemptions on stamp
2020: +2
duty. Sydney’s median unit price
is forecast to decline a cumulative
80 4% over the forecast period to reach
97 98 99 00 01 02 03 04 05 06 07 08 09 10 11 12 13 14 15 16 17 18 19 20 $760,000 at June 2020.
The QBE Australian Housing Outlook 2017–2020 1103. New South Wales
outlook
New South Wales and Sydney regions
2
1
Sydney median house price annual % change Regional New South Wales
In addition to local economic demand
Inner Middle Outer Median and supply factors, residential property
prices in the Newcastle and Wollongong
regions are often impacted by the
7.8% 15.1% 12.5% 12.4%
residential cycle in Sydney. Relative
housing affordability drives migration
between the state capital and these
regional centres.
12CONTENTS
Regional New South Wales centres
2 Newcastle and the Hunter region:
Tourism and logistics hub growth
Recent declines in coal sector
investment have created more Price
challenging local economic growth
conditions in the Hunter region,
although global demand for thermal
7%
coal remains strong and this should
keep production volumes up.
pa
Newcastle’s role as a logistics hub is also
anticipated to continue to drive employment Rental
while other sectors such as tourism should vacancy
increasingly offset continued weakness rates
in the coal sector.
Newcastle experienced solid price growth
in the five years to June 2017, averaging
7% per annum as purchaser sentiment
improved and low interest rates supported
2.3%
market entry. Notably, this growth has lagged
1 Wollongong region: City commuters behind that of Sydney and Wollongong.
Forecast
house price
Newcastle offers first home buyers a more
Wollongong has a diversified economy with tourism and affordable option. However, the distance
education playing a significant role in economic growth.
12%
from Sydney means that this advantage
The Illawarra region has benefited from deteriorating in affordability would not typically benefit
housing affordability in Sydney. a commuter population, and population
movement into Newcastle needs to be
Wollongong is within commuting distance of Sydney CBD with
driven by local employment fundamentals. Unemploy-
around 20% of the Wollongong region’s employed population
working in Sydney historically. The latest 2016 Census data on In line with rising prices, new building activity
ment
place of employment has yet to be released, although given has been increasing. Nevertheless, the market
Sydney’s lower unemployment rate relative to the Illawarra region, remains tight with vacancy rates well below the
this share is likely to remain similar, if not increase.
The affordability gap between Wollongong and Sydney widened
considerably in the initial stages of the Sydney upturn, making
3% market balanced rate. The unemployment
rate has improved, falling from a high of 8.4%
in June 2015 to 6.2% in March 2017.
6.2%
Wollongong increasingly attractive for Sydney residents.
In June 2013, the median house price in Wollongong was 65% of the
Outlook: The redevelopment of the Newcastle
median house price in Sydney. Since then, this ratio eased to a low
Interchange as well as the light rail line will encourage job
of 57% at June 2015, before rising back to 61% at June 2017. In this
creation and further investment in the area, and the outlook
time, the median house price in Wollongong increased a cumulative
for the Hunter region economy remains positive. Price
63%, or an average 13% per annum, to $732,800 at June 2017.
momentum is forecast to carry into 2017/18, with house
The median house price in Wollongong relative to Sydney is almost prices projected to grow 7% before easing in the two years
back to 2013 levels. This would indicate less scope for the median to 2019/20 in line with the Sydney market. The median
house price in Wollongong to significantly outperform the Sydney house price at June 2017 of $568,700 is forecast to increase
market going forward, despite lower house prices. a cumulative 12% to $635,000 at June 2020.
Outlook: Those looking to escape the deterioration
of affordability in Sydney will find less incentive to migrate
to Wollongong. Further price growth is still expected given
its lower relative price, although Wollongong house price
growth is forecast to slow. Wollongong’s median house
price growth is forecast to be 5% in 2017/18 before being
largely flat over the following two years to take the median
house price to $770,000 at June 2020.
The QBE Australian Housing Outlook 2017–2020 1303. Victoria
outlook
People Melbourne house market
power Record population growth has been
the key ingredient of the Melbourne
residential market upturn. High net
overseas migration and record net
interstate migration inflows have
Dwelling commencements driven strong underlying demand.
set to ease, but Victorian economy The market has also been driven by low
interest rates, rising rents and tight vacancy
likely to benefit from high rates, resulting in strong investor and
levels of migration upgrader activity. A deficiency of dwellings
remains across the Melbourne market
despite surging new dwelling supply, and
the median house price in Melbourne
increased by a cumulative 56% in the four
years to $852,700 at June 2017. Over the
year to June 2017, price growth has been
heavily concentrated in Middle (13.1%) and
Outer ring suburbs (16.4%) while Inner (-1.5%)
ring suburbs saw a price decline.
Price growth
Investors have been a feature of this
upturn, which has been encouraged by
tight vacancy rates and low interest rates.
The impact of investor demand was evident
in 2015/16, when annual price growth
paused at 7.5% and investor demand fell
by 13% as banks tightened lending policy
towards investors. Median house price
growth strengthened by 14% in 2016/17,
corresponding with a 14% rebound in
investor loans after interest rates were
cut in 2016 and bank lending policy was
reassessed. Another round of restrictions
to investor lending and interest only loans
is expected to cause investor lending
to ease again from 2017/18.
Buyer activity
The rise in house prices has led to increasingly
strained affordability, which has hampered
first home buyer activity. The number
of loans to first home buyers in Victoria
has been reasonably flat, and trending
slightly downwards over the past four
years. In contrast, upgrader and downsizer
activity has been robust, as rising house
prices encouraged sales activity. Stronger
first home buyer demand may emerge
in 2017/18 with stamp duty exemptions
making it easier for some to enter
the market.
14CONTENTS
Demand and supply Dwelling starts in Victoria peaked at 68,700 Melbourne unit market
Net overseas migration into the state has in 2015/16. Completions have also been
averaged 64,700 per annum in the past rising and are now outpacing underlying
The unit market has been largely flat
four years, while net interstate migration has demand. Dwelling completions will begin
over the four years to 2016/17. Over
also reached record highs, at an estimated to fall away in line with the emerging
this period, Melbourne’s median
19,000 people in 2016/17 and an average downturn in dwelling commencements,
unit price grew a cumulative 8%, and
13,700 per annum in the past four years. but population growth is also expected
in 2015/16 and 2016/17 was below
Victoria has had the strongest population to begin to ease, and the current deficiency
2% per annum. This reflects the
growth of all states which has supported of dwellings in the state is forecast to briefly
growth in new unit supply with unit
strong underlying demand for dwellings. transition to a modest oversupply in 2018/19.
completions surpassing completions
of houses in these two years.
Outlook Supply
Total new dwelling supply in Melbourne
The house market is expected to outperform the unit market in Melbourne. The rise since 2011/12 has occurred on the back of
in unit completions in the past five years has been greater than house completions. surging unit construction. Unit completions
In addition, the negative impact of regulatory initiatives aimed at investors and rose from 44% to 60% of total dwelling
any rise to vacancy rates are also likely to have more of an impact on the unit completions between 2010/11 and 2016/17,
market. With Melbourne’s upturn in new dwelling supply not as strong for houses, and the unit market is estimated to have
the market for houses is estimated to still be in undersupply. As a result, moderate some level of oversupply. Record apartment
median house price growth of 6% is forecast in 2017/18 before price growth completions are on track to continue
flattens out as Victoria’s undersupply decreases and economic conditions slow. in 2017/18 and will cause vacancy rates
At June 2020, the median house price is forecast to be $940,000, a cumulative to increase and negatively impact rental
10% increase over the three-year forecast period. growth and unit prices. These factors
will dampen investor demand, which will
be compounded by the current tightening
in investor lending by the banks.
Outlook
Victoria: dwelling prices Melbourne
The median unit price in Melbourne
house price is expected to decline as the
($’000) FORECAST 2016: +7 2018: +6
2017: +14 2019: +2
oversupply in units accelerates.
1,280
2020: +2 The retreat of investors in this
environment is forecast to see
Melbourne real
house price the median unit price decline
2016: +6 2018: +3
by a cumulative 5% to $535,000
2017: +12 2019: 0
2020: -1 at June 2020.
640 Melbourne unit price
2016: +3 2018: -3
2017: +8 2019: -1
2020: -1
Melbourne real
unit price
2016: +2 2018: -5
320 2017: +6 2019: -3
2020: -4
Geelong
house price
2016: +6 2018: +4
2017: +13 2019: -1
2020: +1
160 Bendigo
house price
2016: +3 2018: +3
2017: -2 2019: 0
2020: +1
Ballarat
house price
2016: +2 2018: +4
2017: +8 2019: 0
80
2020: +1
97 98 99 00 01 02 03 04 05 06 07 08 09 10 11 12 13 14 15 16 17 18 19 20
The QBE Australian Housing Outlook 2017–2020 1503. Victoria
outlook
Victoria and Melbourne regions
3
1
2
Melbourne median house price annual % change Regional Victoria
The regional centres of Geelong and Ballarat
Inner Middle Outer Median are close enough to Melbourne to support
regular commuter transit while Bendigo
would attract infrequent commuters.
-1.5% 13.1% 16.9% 13.7% Conditions in the Melbourne market have an
influence on the local residential market in the
regional centres of Geelong and Ballarat. The
construction of the Regional Rail Link has benefited
all three centres. While it doesn’t necessarily reduce
the trip duration to Melbourne, a more frequent and
reliable transport service is likely to make Geelong
and Ballarat more desirable as residential centres.
16CONTENTS
Regional Victoria centres
1 Ballarat : Infrastructure investment
The median house price in Ballarat
Price has grown by a cumulative 19% or
growth about 4.5% per annum over the past
four years. In the year to June 2017,
price growth reached 8% taking the
2 Geelong:
4.5
median house price to $340,000.
% Employment shift to service sector
pa Population growth has been solid while
the local economy has benefited from
state government initiatives such as the The median house price in Geelong increased 12.6% in the
Rental development of the $48 million Ballarat year to June 2017 to $475,000. The closure of the Alcoa
vacancy GovHub, which relocates a number of operation in 2014 has largely been worked through while
rates government departments to the Ballarat CBD. the losses in employment from the Ford manufacturing
The unemployment rate has decreased from shutdown in late 2016 has been somewhat offset by gains
6.5% in June 2016 to 4.5% in March 2017 while in service sector employment.
2.5% vacancy rates remain tight at 2.5% in June 2017.
Outlook: Large infrastructure
The relocation of WorkSafe Victoria and the National Disability
Insurance Agency to Geelong will boost employment while the
construction sector will also be supported by new head office
projects such as the Eureka developments for each body. The unemployment rate was 6.3%
Forecast Stadium development, the in the March quarter 2017, an improvement from its peak of 8.4%
house price Ballarat Link Road and the in the March quarter 2015. Vacancy rates have also fallen to 2.2%
Ballarat West Employment Zone in June 2017 indicating a tightening market.
should support employment and
6% population growth, and therefore
demand for dwellings over the
next three years. The outlook
Outlook: The outlook for the local economy is positive.
Geelong will also continue to benefit from an affordability
advantage over Melbourne. However, the recent strong
for Ballarat remains positive and
price growth in Geelong and competition from Melbourne’s
Unemploy- median house prices are forecast
outer western suburbs, which are closer to central
ment to rise a cumulative 6% to reach
Melbourne, is expected to limit stronger price growth.
$360,000 at June 2020.
Geelong’s median house price is forecast to grow 4%
in 2017/18 as price growth in Melbourne also slows, before
4.5% flattening out to be $495,000 at June 2020, representing
a cumulative rise of 4% over this period.
3 Bendigo: New infrastructure
The construction of the Bendigo Hospital has been one of the key employment
drivers in recent years. Its impact on the local economy was significant,
improving unemployment from 7.6% in March 2015 to 4.5% in March 2017.
Median house prices have also steadily risen in light of greater dwelling demand. The median
house price reached $350,000 in March 2017 before easing slightly to $334,000 in June
quarter 2017. Bendigo’s vacancy rate remains tight, below the 2% mark, which suggests that
rental dwelling demand remains strong.
Outlook: With the completion of the first phase of the Bendigo Hospital, the next
phase consists of smaller scale works. There are also no upcoming projects of
comparable size to maintain local economic growth and job creation. Without any
significant economic drivers emerging, house price growth in the Bendigo market
is expected to be limited at 3% in 2017/18. Growth is then expected to be flat with
the median house price at $350,000 in June 2020 representing a total 5% increase.
The QBE Australian Housing Outlook 2017–2020 1703. Queensland
outlook
Solid Brisbane house market
stock Median house prices
The Brisbane market has not
experienced as steep an increase
in price growth as seen in Sydney
and Melbourne in the past five
Improving economic fundamentals years. Low interest rates, relative
are now emerging in Queensland’s attractive affordability and a
moderate undersupply in the
post-mining boom, but Brisbane is market nevertheless supported
some buyer demand.
forecast for an oversupply of units
Over the four years to 2015/16, the median
house price in Brisbane experienced
moderate price growth of 5.0% per annum.
However, as banks move to rein in investor
lending, and unit completions continue to
add record levels of dwellings to the market,
it appears that sentiment has deteriorated.
Vacancy rates are trending upwards and price
growth eased to just 2.0% in 2016/17 to take
the median house price to $550,800 at June
2017. Median house price growth in the year
was minimal across Inner Brisbane (0.7%)
and Outer Brisbane (1.0%), while being slightly
stronger in the Middle ring suburbs (2.9%).
Demand and supply
Migration inflows into Queensland fell in line
with the downturn in the state economy, and
population growth has eased. The downturn
also corresponded with a collapse in dwelling
construction, which fell below underlying
demand and a dwelling deficiency emerged.
The resulting tight vacancy rates as well
as healthy yields supported investor activity
through to 2014/15, which in turn drove
new dwelling building that began to exceed
underlying demand from 2015/16.
Investors
On the back of this investor activity, new
dwelling completions have more than
doubled from 13,650 dwellings in 2013/14,
to an estimated 28,000 dwellings in
2016/17, and this has tipped the market into
oversupply. Completions have been primarily
for units, and this is where an oversupply
in Queensland is expected. Compared to
Sydney and Melbourne, investment lending
has not recovered since falling in 2015/16,
highlighting the retreat of investors due
to the excess unit supply in the market.
18CONTENTS
Owner occupier demand has been in the number of first home buyer loans Brisbane unit market
somewhat buoyed by low interest rates, in Brisbane over the past three years.
which in turn have improved affordability. The Brisbane market did not see the level
Attractive affordability has also allowed of upgrader and downsizer activity rise The sharp rise in unit
more first home buyers into the market as in Melbourne and Sydney given the commencements has been
and there has been modest growth slower price growth. concentrated in Inner Brisbane.
Analysis of inner Brisbane
apartment pre-sales over
the past five years suggests
Outlook that interstate and overseas
Overall, the outlook for house prices in Brisbane remains moderate. The local economy purchasers have accounted
will continue its slow transition away from mining and start to recover. Employment for nearly half of demand.
prospects should return with some improvements in public sector spending, as well Together with demand from local investor
as continuing growth in export sectors such as education and tourism. Underlying purchasers, this has resulted in rental
demand is forecast to strengthen a little and a downturn in new dwelling completions stock rising greater than tenant demand
should see the oversupply in the market contained. Cumulatively, Brisbane’s median and escalating vacancy rates, particularly
house prices are expected to rise 7% over the forecast period to $590,000 at June 2020. in inner Brisbane. Investors are now
becoming discouraged and this has been
compounded by banking restrictions
on investor lending. As a result, the
median unit price fell 0.8% in 2015/16
and a further 3.1% in 2016/17.
Brisbane house price
Brisbane and Gold Coast: dwelling prices 2016: +5 2018: +3
2017: +2 2019: +2
($’000)
1,280
FORECAST
2020: +3 Outlook
Brisbane real
house price With Brisbane’s oversupply
2016: +4 2018: 0 concentrated mainly in the unit
2017: 0 2019: -1
2020: 0
market, unit prices are expected
640
to remain on their downward
Brisbane unit price trend. Unit completions are
2016: -1 2018: -2
2017: -3 2019: -2 expected to ease but remain
320
2020: -2 well above underlying demand
as recently commenced
Brisbane real
unit price projects are completed. This will
2016: -2 2018: -5
increasingly apply downward
2017: -5 2019: -5
160 2020: -5 pressure on rents and
consequently prices. Greater
Gold Coast
house price competition for tenants of inner
2016: +8 2018: +4 city apartments is forecast
80 2017: +5 2019: +1
97 98 99 00 01 02 03 04 05 06 07 08 09 10 11 12 13 14 15 16 17 18 19 20 2020: +2 to cause investor owners
to lower rents to try to draw
Gold Coast unit price
2016: +7 2018: +2
tenants from more affordable
2017: +1 2019: +1 city fringe locations. Those who
2020: +1 are looking to sell are expected
Regional Queensland: dwelling prices to also find it increasingly
Sunshine Coast
($’000) house price difficult as more apartments
FORECAST
640 2016: +6 2018: +3
2017: +4 2019: +1 come onto the re-sale market.
2020: +1
Median unit prices are
Townsville forecast to contract a further
house price
320 2016: -4 2018: 0 7% on the June 2017 median,
2017: -4 2019: 0 to $385,000 at June 2020.
2020: +2
This will be a greater decline
Cairns house price than seen in the unit markets
2016: -1 2018: +1
160 2017: +2 2019: +1
in Sydney and Melbourne
2020: +1 highlighting the estimated
magnitude of unit oversupply
Toowoomba in Brisbane.
house price
80 2016: -2 2018: +3
97 98 99 00 01 02 03 04 05 06 07 08 09 10 11 12 13 14 15 16 17 18 19 20 2017: +3 2019: +3
2020: +2
The QBE Australian Housing Outlook 2017–2020 1903. Queensland
outlook
Queensland and Brisbane regions
5
4
3
2
1
Brisbane median house price annual % change Regional Queensland
The regional Queensland markets
Inner Middle Outer Median of Gold Coast, Sunshine Coast and
to a lesser extent, Toowoomba, have
generally moved in line with the
0.7% 2.9% 1.0% 2.0%
residential market in Brisbane.
Whilst the Townsville market is being dragged
down by the downturn in mining investment,
Cairns is seeing some positive signs from
the strengthening tourism sector. Interstate
migration flows from New South Wales and
to a lesser extent Victoria have also supported
demand for dwellings in the regional markets.
20CONTENTS
Regional Queensland centres
1 Gold Coast: 2018 Commonwealth Games
The Gold Coast market is typically
more expensive than the metropolitan
Brisbane market given the price
premium on its desirable beach and
inland waterway locations.
Price
The Gold Coast also offers a hinterland growth
environment within commuting distance to
Brisbane. Local economic conditions have been
7%
boosted by a number of infrastructure projects
and related works associated with the 2018
Commonwealth Games, as well as the current pa
upturn in residential building. The second phase
of the Gold Coast Light Rail and the expansion
of The Star Gold Coast casino and Pacific Fair
have created further employment drivers. The Rental
Gold Coast’s unemployment rate decreased
vacancy
rates
from a high of 6% in December quarter 2014,
to 5.3% in March quarter 2017. Vacancy rates
were low at just 1.7% at June 2017.
The median house price in the Gold Coast has
experienced strong growth of almost 7% per
1.7%
annum to reach $627,800 in the two years to
June 2017. Growth in the median unit price has 2 Toowoomba : Infrastructure boost
been slower, rising by 4.1% per annum in the Forecast
past two years to $406,000 at June 2017. Unit house price Toowoomba benefits from its position as the western
price growth has lagged as unit completions gateway to South East Queensland as well as its prime
have risen rapidly and take time to be absorbed. location on the Melbourne to Brisbane freight route.
Outlook: Market sentiment
is expected to remain positive
6% The local economy has outperformed the state economy for much
of the last decade, supported by the agricultural, manufacturing and
tourism industries. Several large infrastructure projects have also
as local economic drivers keep contributed to employment growth such as the construction of the
employment strong. The Gold Coast Second Range Crossing and the development of Wellcamp Airport.
median house price is forecast Unemploy-
to rise a cumulative 6% in the next ment Overall, unemployment has remained largely unchanged at a healthy
three years to $665,000 at June 4.9% in March quarter 2017 while vacancy rates hover around the
2020, largely in 2017/18 (after the balanced 3% mark. The median house price has been relatively flat
5.3%
pre Commonwealth Games surge at around $385,000 over the past two years to June 2017.
in investment) before slowing
in 2018/19 and 2019/20. Unit price Outlook: Toowoomba will benefit from the work done
growth is forecast to be similar on the construction of the Second Range Crossing due to
at a cumulative 5% over the forecast open in late 2018, and the traffic it takes out of Toowoomba.
period to be $425,000 at June 2020. The potential for increased freight activity at the new
Brisbane West Wellcamp Airport could also contribute
to local employment growth. In the medium to longer
term, the Inland Rail project will further turn Toowoomba
into a logistics hub, connecting Brisbane to Melbourne
and to the rest of the interstate rail networks. This will add
to growth in the local economy. Over the three years to
2020, the outlook for Toowoomba is for moderate growth
of around 2.5% per annum, although this could be greater
if these projects have a greater contribution to the local
economy and population growth.
The QBE Australian Housing Outlook 2017–2020 2103. Queensland
outlook
Regional Queensland centres continued
3 Sunshine Coast: Construction and tourism
Demand in the Sunshine Coast benefits from interstate migration, particularly
from downsizers/retirees from New South Wales. The local economy relies
mostly on construction and tourism to underpin employment growth.
The Sunshine Coast is experiencing an undersupply of dwellings due to a prolonged period of
low dwelling construction. Meanwhile, underlying demand appears to be recovering due to rising
interstate migration. Vacancy rates remain tight with rents and prices seeing solid growth. The
median house price has risen 5% per annum over the past two years to be $570,000 at June 2017.
Outlook: The outlook for Sunshine Coast remains moderate. Price growth is
forecast to be modest in 2017/18 before flattening out. The construction of the
Sunshine Coast University Hospital was a significant contributor to employment
growth, but has now been completed. By June 2020, the median house price
is expected to be $595,000; a total rise of 4% over the next three years.
4 Townsville: Mining investment decline
The Townsville economy is experiencing the drag of the
decline in mining investments in regional Queensland
and is also struggling to absorb the loss of other key
employment drivers.
Fiscal consolidation by the Federal and State Government has seen
public administration and defence related employment decline. The
closure of the Palmer Nickel and Cobalt Refinery has also contributed
to job losses, and the unemployment rate has climbed to 10.8% in
March quarter 2017 while participation rates have fallen to record lows.
5 Cairns: Strengthening tourism sector This has weighed on population growth and therefore demand.
Vacancy rates remain high at 5.0% in June quarter 2017, above
the balanced market rate of 3%. The median house price has also
Cairns, together with Townsville, are the two main cities
steadily declined and is down 14% from its peak in June 2010
in Northern Queensland. The Cairns economy is heavily
to be $325,000 at June 2017.
reliant on tourism to drive employment and growth
and is less affected by the mining and resource industry
than Townsville. Outlook: The Townsville median house price is expected to
Local economic conditions have improved with a strengthening in be at, or close to, bottom, and price growth is forecast to be flat
the tourism sector due to a lower Australian dollar as well as strong over the two years to 2018/19 before the wider Queensland
migration inflows. recovery shows some momentum. The median house
price in Townsville is forecast to be $330,000 at June 2020.
After a long period of low construction activity, dwelling completions
have picked up. However, vacancy rates have tightened to 1.8%
in June quarter 2017 suggesting a shortage of dwellings still firmly
in place. On balance, house price growth has been flat, but is higher
than the same quarter of the previous year, at $415,000 in June 2017.
Outlook: The outlook for Cairns remains moderate with
the median house price forecast to be $430,000 at June
2020. This amounts to a 4% cumulative increase over the
forecast period. Unemployment still remains relatively high
at 6.7% in March 2017, and its price disparity with Townsville
is also widening.
22CONTENTS
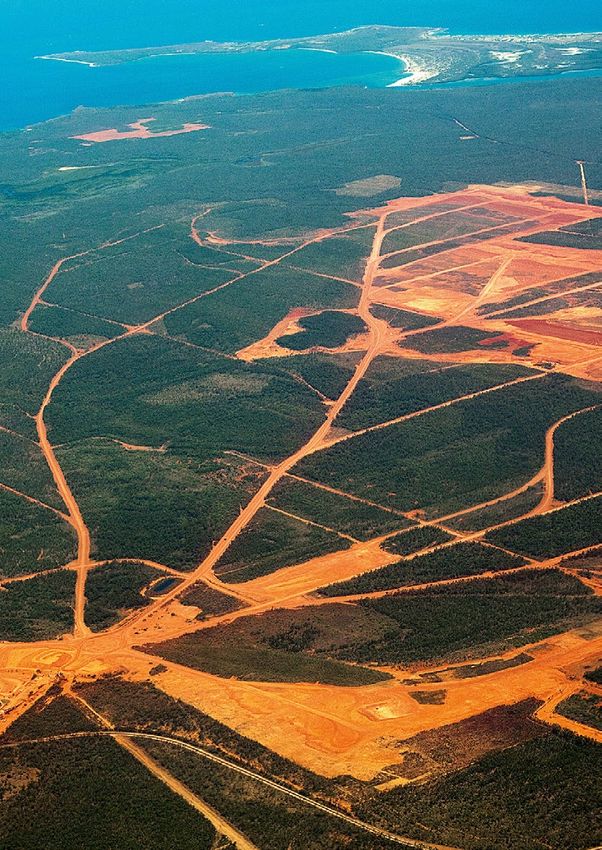
Queensland regional mining centres
The mining investment boom in the early part of the decade benefited many
regional centres throughout Queensland. Servicing the mining sector and the
billions of dollars spent expanding capacity also brought wider investment Outlook
and economic growth. As projects are completed and investment spending Sales volumes as well as price
unwinds, many regional centres have struggled. Smaller localities such growth is likely to remain subdued
as the Isaac Region bore the brunt of the downturn compared to the larger, for a number of years although
more diversified regional centres such as Gladstone and Mackay. there might be some brave
Gladstone and Mackay experienced a smaller boom and bust cycle compared to smaller investors entering these markets.
centres such as the Isaac Region. Both are large centres with more diversified economic bases, The median house price in the
and have performed better through the downturn. The median house price in Gladstone rose Isaac Region has recovered slightly
by 32% to its peak and by 16% in Mackay. Conversely, their median house prices are now 35% since bottoming out in March 2016,
and 22% lower respectively at June quarter 2017. In contrast, the Isaac Region, which contains suggesting the worst is behind it.
the smaller towns of Dysart and Moranbah, experienced a 97% rise in its median house price The market in Mackay looks to have
between December 2007 and March 2012. This surge was then followed by a large decline, also bottomed out. Its median
which has taken the median house price 77% lower, to $153, 000 at June quarter 2017. house price also increased between
December 2016 and June 2017,
Both Gladstone and Mackay also had high levels of unemployment at 7.0% and 6.3% while vacancy rates tightened
in the March quarter 2017 respectively. This suggests that these regions have a greater from over 9% in 2015, to 4.5% in
percentage of permanent residents who are less likely to leave when employment prospects June 2017. In contrast, Gladstone’s
decline. The 2.0% unemployment rate in the Isaac Region in March quarter 2017 reflects median house price reached a new
the temporary nature of residents in smaller mining centres. Without other employment trough in June 2017.
opportunities in the smaller centres, the unemployed population leaves.
The volumes of sales in these mining centres have fallen significantly since the peak
in the market in 2011/12. Property owners are more likely to hold their property than
sell at a significant loss in a weak market.
Median house prices and unemployment rates
MEDIAN HOUSE PRICE ($) UNEMPLOYMENT
SALES IN PRIOR YEAR % CHANGE RATE (%)
PEAK
START OF JUNE 2017 START TO JUNE MARCH MARCH
REGION UPTURN PEAK TROUGH QTR TO PEAK 2017 2013 2017
Median house price ($) 335k 660k 124k 153k
Isaac Region
(MORANBAH, DYSART)
Sales in prior year 440 659 88 199 97% -77% 1.0 2.0
Date DEC 07 MAR 12 MAR 16 JUN 17
Median house price ($) 365k 480k 312k 312k
Gladstone Region Sales in prior year 906 1,531 599 599 32% -35% 4.2 7.0
Date MAR 09 DEC 11 JUN 17 JUN 17
Median house price ($) 370k 430k 325k 337k
Mackay Region Sales in prior year 3,832 3,251 1,781 1,752 16% -22% 3.1 6.3
Date SEP 07 SEP 12 DEC 16 JUN 17
Median house price ($) 427k 551k – 551k
Greater Brisbane 29% 0% 5.7 5.8
Date DEC 08 JUN 17 – JUN 17
The QBE Australian Housing Outlook 2017–2020 2303. Western Australia
outlook
Small steps
forward
Still facing challenging conditions
after the mining investment
boom, Perth’s house prices are
forecast for minimal growth
24CONTENTS
Perth house market
The decline in mining investment interstate outflow has also increased.
saw economic conditions weaken Western Australia lost an estimated 11,500
significantly in Perth. With further people to other states in 2016/17, in contrast
Outlook
declines in mining engineering to a peak net gain of 11,400 in 2012. Overall, the Perth market is expected
investment forecast, the state economy to remain weak for some time.
is expected to remain subdued. The current downturn in the state economy The rising excess of dwellings and
and residential market has seen all segments subdued economic conditions will
Median house prices of purchaser demand decline. Investors have keep prices in check. However,
Vacancy rates have trended upwards to 7.3% particularly retreated due to the combination the market is expected to be close
at June quarter 2017 while rents have fallen of falls in house prices and APRA’s policy to the bottom and prices are forecast
13% in the past three years. Perth’s median changes impacting investor loans. to stabilise in 2017/18. As mining
house price fell by 14% in the three years investment bottoms out over
to June 2017 to be $520,500. The largest New dwelling supply 2018/19, so will the state economy
decline took place in the Middle ring suburbs While the market started to slow after and house prices. The forecast
(-9.2) while declines were also seen in Inner peaking in 2013/14, the lag in bringing median house price of $535,000 at
(-5.7%) and Outer (-6.2%) ring suburbs. June 2020 will represent cumulative
houses and units to completion saw
growth of 3% over the next three
supply peak in 2015/16. During this
Demand years, although this will all take place
period, underlying demand for dwellings
As mining investment weakened, the at the end of this period.
went into a sharp decline as population
unemployment rate trended upwards
to 7.6% in March quarter 2017, and is growth slowed. There is now a significant
expected to remain elevated over the oversupply of dwellings in Perth. Although
next three years. Fewer employment dwelling completions have now peaked,
opportunities has led to a noticeable fall they currently remain well ahead of
Perth unit market
in net overseas migration, to an estimated underlying demand. The excess in dwellings
14,000 in 2016/17. This was down from its across Western Australia was estimated The strong mining related migration
peak of 53,200 people in 2011/12. The net at 24,900 dwellings in June 2017. into Perth, both overseas and interstate,
has generally been temporary in
nature. This boosted demand in the
unit market, rather than houses.
As population growth has reversed,
unit rents and vacancy rates have
Perth: dwelling prices also weakened causing the median
($’000) unit price to fall by 7.6% over the past
FORECAST
1,280 three years to $402,200 at June 2017.
Supply
The unit market has seen rising completions
Perth house price
across Perth over the past three years.
2016: -4 2018: 0 During this time the share of unit
2017: -7 2019: +1
640 2020: +2 completions increased from 20% to 30%
of total dwelling completions. While the total
Perth real
house price market is in oversupply, it is estimated that
2016: -5 2018: -3 the oversupply is greater in the unit market.
2017: -9 2019: -2
2020: -1
320 Perth unit price
2016: -5 2018: -2
Outlook
2017: -1 2019: 0 Both houses and units are forecast
2020: +1
to experience minimal price growth.
Perth real unit price However, there appears to be
2016: -6 2018: -4 greater downside in the unit market.
160 The retreat of investors will have
2017: -3 2019: -2
2020: -1 a greater impact on units, while
the unit oversupply will keep price
growth in check over the forecast
period. The Perth median unit price
is forecast to decline a total of less
80
97 98 99 00 01 02 03 04 05 06 07 08 09 10 11 12 13 14 15 16 17 18 19 20
than 1% over the next three years
to be $400,000 at June 2020.
The QBE Australian Housing Outlook 2017–2020 25You can also read