Long Term Plan 2018-2028 - Whanganui District Council's - Consultation Document
←
→
Page content transcription
If your browser does not render page correctly, please read the page content below
Whanganui District Council’s

Long Term Plan
2018—2028

Consultation
Document
Contents
Message from Our infrastructure strategy . . . . . . . . . . . . . . . 38
Mayor Hamish McDouall. . . . . . . . . . . . . . . . . . . 4
What’s most critical for our district?. . . . . . . . . 38
Overview of our core infrastructure . . . . . . . . . 38
Important issues for the next ten years . . . . . . 6
Water supply. . . . . . . . . . . . . . . . . . . . . . . . . . . . . . . . . . 38
Paying for the impact of Stormwater drainage . . . . . . . . . . . . . . . . . . . . . . . . . . 39
Wastewater. . . . . . . . . . . . . . . . . . . . . . . . . . . . . . . . . . . 39
forestry harvesting on our roads . . . . . . . . . . . . . . 7
Roading and footpaths. . . . . . . . . . . . . . . . . . . . . . . . . 39
Summary of options. . . . . . . . . . . . . . . . . . . . . . . . . . . . 9
Parks and recreation. . . . . . . . . . . . . . . . . . . . . . . . . . . 40
Revitalisation of our port. . . . . . . . . . . . . . . . . . . . 14
Cultural and events facilities. . . . . . . . . . . . . . . . . . . . 40
Summary of options. . . . . . . . . . . . . . . . . . . . . . . . . . . . 16
Property. . . . . . . . . . . . . . . . . . . . . . . . . . . . . . . . . . . . . . 40
Our stormwater network. . . . . . . . . . . . . . . . . . . . 18
Ports. . . . . . . . . . . . . . . . . . . . . . . . . . . . . . . . . . . . . . . . . 40
Summary of options. . . . . . . . . . . . . . . . . . . . . . . . . . . 20
Information services . . . . . . . . . . . . . . . . . . . . . . . . . . . 40
Our financial strategy – funding Priorities . . . . . . . . . . . . . . . . . . . . . . . . . . . . . . . . . . 41
our community into the future . . . . . . . . . . . . 22 Proposed key infrastructure projects
2018-2028. . . . . . . . . . . . . . . . . . . . . . . . . . . . . . . . 42
What is our financial strategy?. . . . . . . . . . . . . . 22 Future years. . . . . . . . . . . . . . . . . . . . . . . . . . . . . . 45
Where the money comes from. . . . . . . . . . . . . . . . . . 23
Where the money is spent. . . . . . . . . . . . . . . . . . . . . . 23 Changes to the levels of service. . . . . . . . . . . 46
Managing our debt . . . . . . . . . . . . . . . . . . . . . . . . . . . . 25
Keeping rates affordable. . . . . . . . . . . . . . . . . . . . . . . 26
More for you to think about… . . . . . . . . . . . . . 49
Other revenue. . . . . . . . . . . . . . . . . . . . . . . . . . . . . . . . . 28
Balanced budget. . . . . . . . . . . . . . . . . . . . . . . . . . . . . . 29 Kerbside recycling. . . . . . . . . . . . . . . . . . . . . . . . . . . . . 49
Whanganui Regional Museum. . . . . . . . . . . . . . . . . . . 49
Who pays – and how Whanganui Resource Recovery
do we make the system fairer? . . . . . . . . . . . . 30 Centre Trust . . . . . . . . . . . . . . . . . . . . . . . . . . . . . . . . . . 50
Library hubs . . . . . . . . . . . . . . . . . . . . . . . . . . . . . . . . . . 50
Wastewater and trade waste. . . . . . . . . . . . . . . . 30
Heritage incentive funding. . . . . . . . . . . . . . . . . . . . . . 50
Resilient roading . . . . . . . . . . . . . . . . . . . . . . . . . . 33
Sport and recreation strategy. . . . . . . . . . . . . . . . . . . 50
Animal management. . . . . . . . . . . . . . . . . . . . . . . 34 Dog pound . . . . . . . . . . . . . . . . . . . . . . . . . . . . . . . . . . . 50
Port and river. . . . . . . . . . . . . . . . . . . . . . . . . . . . . 34 Regional facilities. . . . . . . . . . . . . . . . . . . . . . . . . . . . . . . 51
Funding growth. . . . . . . . . . . . . . . . . . . . . . . . . . . 35 Transferring of our marine and
airport activity . . . . . . . . . . . . . . . . . . . . . . . . . . . . . . . . . 51
What does this mean for my rates? . . . . . . . . 36 Wakefield Street Bridge. . . . . . . . . . . . . . . . . . . . . . . . . 51
Dublin Street Bridge. . . . . . . . . . . . . . . . . . . . . . . . . . . 52
Wikitoria Culvert . . . . . . . . . . . . . . . . . . . . . . . . . . . . . . 52
Lower river control . . . . . . . . . . . . . . . . . . . . . . . . . . . . 52
Property Portfolio Investment Plan. . . . . . . . . . . . . . 52
Changes to development contributions. . . . . . 53
2 Long Term Plan 2018–2028 Consultation Document
Our Leading Edge Strategy.  .  .  .  .  .  .  .  .  .  .  .  .  .  . 54

What’s the same & what’s changed .  .  .  .  .  .  .  . 55

Independent auditor’s report .  .  .  .  .  .  .  .  .  .  .  .  . 56

Tell us what you think… .  .  .  .  .  .  .  .  .  .  .  .  .  .  .  .  .  . 58

Supporting Documents

You can find the following documents at
www.whanganui.govt.nz/long-term-plan or call
(06) 349 0001 to request a copy:

•     Financial Strategy
•     30-Year Infrastructure Strategy
•     Forecasting assumptions
•     Full financial statements
•     Funding Impact Statement and rates
      information
•     Proposed fees and charges 2018/19
•     Full list of capital expenditure projects by
      group
•     Project updates
•     Activity plans including performance
      measures
•     Draft Revenue and Financing Policy
•     Development Contributions Policy
•     Liability Management Policy
•     Investment Policy
•     Draft Rates Remission Policy, Draft Rates
      Postponement Policy and Draft Policy on the
      Remission and Postponement of Rates on
      Māori Freehold Land
•     Significance and Engagement Policy

Contents                                                                          3
Message from
Mayor Hamish McDouall

Tēnā koutou Whanganui,
While our day to day life at Council is often         to grow over the next ten years and we must
looking at immediate opportunities or current         ensure our infrastructure will match further
problems, we need to look to the future. We           increases in population.
need to try and pierce into the unknown and
                                                      In the previous ten year plan 2018-19 was always
have a vision for the district which lasts decades.
                                                      anticipated to be a year of significant rates rises,
In essence the Council must look ahead 30 years,
                                                      as this is the year that the wastewater treatment
and plan for ten.
                                                      plant becomes operative. However due to the
The Long Term Plan is the document that is the        great work of staff, and the careful oversight of
basis for this planning. The projects embodied in     this Council we have managed to pull the rates
the plan are not supposition or crystal-ball          rise down from 12% to an average of 4.5% for
gazing. They are informed by evidence, science,       next year. This is the biggest rate rise in the ten
projections, and models. When you add the             year plan – overall the average rate rise is only
political will of myself and all the Councillors      slightly above projected inflation over the next
around the table to grow Whanganui then the           decade at 2.4%.
end point is the document you have in your
                                                      Not one of the elected officials has any doubt
hands.
                                                      that rate rises can hit households, particularly
We need to grapple with the fact of climate           those on fixed incomes, very hard. We are
change, and what that means for our                   working to make sure your money is spent on
infrastructure. We need to consider that our          things that will enhance Whanganui, and that the
demographics are projected to change and what         organisation that we govern is running lean.
that will mean for new subdivisions and
extended services. I am so pleased to see that
Whanganui grew by net 700 people last year.
Our predictions are that Whanganui will continue

4                                                           Long Term Plan 2018–2028 Consultation Document
And yet we are intending to do a great deal.          pushing to increase our tolerance for the
We are improving our stormwater capability to         unexpected.
mitigate flooding and support our wastewater
                                                      We are a tight-knit community. I know we look
facility; we are intending to extend Fitzherbert
                                                      out for one another and communities succeed
Avenue through to Mosston Road; and we are
                                                      when they are united. I ask that you take part in
beginning to address the impact of forestry
                                                      this consultation process and join me as we
harvesting on our roads.
                                                      voyage into the future together – please submit
We are also reducing our debt – up to $30M over       to this plan. Please contribute your wisdom on
the period of the Long Term Plan.                     these important decisions. While this is nominally
                                                      Council’s plan, I want this to be a plan to which all
Other highlights                                      parts of Whanganui’s community have
The word governance stems from the word               contributed.
gubernate which is Latin for ‘steer’ or ‘pilot’.
To me this is the essence of our role, and highly
appropriate given our rich history. As elected
officials we are tasked with setting the course for
the district. This responsibility should weigh on
                                                      Hamish McDouall
our shoulders.
                                                      Mayor
Piloting a course does not mean we will be free of
rapids or other challenges. Technology is
changing the way we do things, while climate
change is forcing us to change things. As
contradictory as this may sound, this plan is
intended to prepare for uncertainty. We’re

Message from Mayor Hamish McDouall                                                                        5
Important issues for the
next ten years
How do we address our top three?

We want your feedback on three important issues for Whanganui.
We’ve considered options for each of them and we’re interested in
your views on these. We’ve outlined the benefits and risks associated
with each option and highlighted our preferred option for each issue.
The preferred options have been included in our financial forecasts.

6                                         Long Term Plan 2018–2028 Consultation Document
1
Paying for the impact of
forestry harvesting on our roads

High volumes of harvestable timber are about to reach maturity in the
Whanganui District. The highest harvest volumes are expected in
2024–2029 when over half of our timber trees will be ready for cutting.

Transportation of this timber is expected to have                                 Our current Roads and Footpaths Rate is based
a big impact on roads in our district, with road                                  on capital value. The low capital values per
pavement renewals estimated to cost around                                        hectare for exotic forestry (plantation forestry)
$12.2M over the next ten years. The major costs                                   properties mean that they currently contribute
are expected to affect us after 2024.                                             much less towards our roads than similar sized
                                                                                  dairy, pastoral or horticultural properties. Total
Whanganui District Council is applying to the                                     roading rates from exotic forestry properties
New Zealand Transport Agency (NZTA) for a                                         amounted to $90,000 in 2017/18.
subsidy toward these costs and we have assumed
for this plan that we will be successful in getting                               The valuations and roading rates for farming land
our standard 61% subsidy rate. This will still leave                              uses are as follows:
$4.8M for the Council to fund over the next ten
years, with about $1.5M of this required between                                                                  Capital value per Roading rates
                                                                                   Land use
years one and six of this Long Term Plan and the                                                                           hectare    per hectare

remaining $3.3M between years seven and ten.
                                                                                   Exotic forestry                        $2,600                 $4
90% of the cost in years one to six is expected to
be created by forestry located within the                                          Average other farming                  $8,800              $15
Whanganui District, at an average cost of                                          land uses
$225,000 per year. We are looking at the best
way to fund these extra costs.
                                                    Forest harvest tonnage and roading expenditure
                   4,000,000                                                                                                           $10M
                                                                                                                                              Forestry roading expenditure ($M)

                                                                                                                                        $8M
                   3,000,000
 Harvest tonnage

                                                                                                                                        $6M
                   2,000,000
                                                                                                                                        $4M

                   1,000,000
                                                                                                                                        $2M

                          0                                                                                                             $0M
                               2018-20   2021-23   2024-26   2027-29    2030-32    2033-35    2036-38   2039-41    2042-44   2045-47

                                                      Harvest tonnage      Forestry roading expenditure ($M)

Important issues for the next ten years                                                                                                                                           7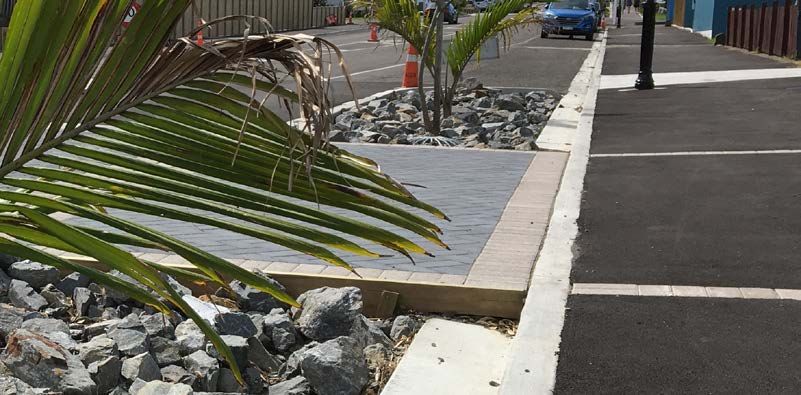
The low roading rates paid by forestry properties
made sense during the growing period as forestry
properties placed lower demands on the roading
network. However road usage by these properties
is changing as the forests are harvested and the
Council’s costs are increasing as a result.

We will continue to work with the forestry
industry on local solutions in addition to lobbying
central government for a national funding
solution before the bulk of these costs are
incurred in years seven to ten. At this stage our
assumption is that our only external funding
source will be 61% subsidy from NZTA, leaving
the remaining 39% to be funded by Council.

Our preferred option is to introduce a new
targeted roading rate to exotic forestry
(plantation forestry) property owners from
2018/19 to help make the funding fairer. This new
targeted rate would be based on capital value
and would be in addition to the existing Roads
and Footpaths Rate. We want to hear your
thoughts on this proposal.

8                                                     Long Term Plan 2018–2028 Consultation Document
Summary of options

    OPTION 1

    Fund forestry roading impacts from existing rating sources
    (i.e. the Roads and Footpaths Rate), based on the current roading rating
    allocation. (32% Farming, 32% Residential and 36% Commercial).
    Impact on rates                                     Impact on debt

    No additional rate for exotic forestry              None
    properties.
                                                        Impact on levels of service
    Costs attributable to forestry properties in
                                                        No change
    the Whanganui District (average $225,000
    per year in Years 1 – 6 and $800,000 per year
    in Years 7 – 10) would be funded from the
    existing Roads and Footpaths Rate.                  Option 1 would shift the cost of the damages
                                                        caused by forestry onto other ratepayers. The
       Years 1 – 6                           $ / year   impact on commercial and other farming
                                                        ratepayers would be large with a substantial
      Average residential                         $5    part of the roading activity (36% and 32%
                                                        respectively) funded by the small number of
      Average farming                           $58
                                                        ratepayers in the commercial and farming
                                                        categories. Council will continue to lobby
      Average commercial                        $77
                                                        central government for a national funding
                                                        solution to be in place ahead of Year 7 when
      Average exotic forestry                    $16
                                                        costs begin to climb.

       Years 7-10 (only if no additional     $ / year
       government support available)

      Average residential                        $16

      Average farming                         $203

      Average commercial                       $270

      Average exotic forestry                   $55

Important issues for the next ten years                                                                 9
OPTION 2 (preferred)

     Collect $135,000 per annum by implementing a new targeted rate for
     exotic forestry properties. This would mean that exotic forestry
     properties pay 2.5 times their current contribution to roading.
     Impact on rates                                    Impact on debt

     An additional $135,000 per year from exotic        None
     forestry properties.
                                                        Impact on levels of service
     The rest of the costs caused by forestry           No change
     properties in the Whanganui District (on
     average $90,000 per annum in Years 1 to 6
     and $650,000 per year in Years 7 – 10) would
                                                        Option 2 would see about 60% of the costs
     be funded from the existing Roads and
                                                        attributable to exotic forestry properties paid
     Footpaths Rate.
                                                        by those properties in Years 1 – 6, with the
       Years 1 – 6                           $ / year   rest funded by the Roads and Footpaths Rate.
                                                        This would provide a balance between the
       Average residential                        $2    small group of forestry ratepayers and the
                                                        rest of the community. It would mean that the
       Average farming                          $23     rest of the community would have a minor
                                                        increase to their Roads and Footpaths Rate
       Average commercial                        $31    to fund part of the costs caused by exotic
                                                        forestry properties. Council will continue to
       Average exotic forestry                 $681     lobby central government for a national
                                                        funding solution to be in place ahead of Year
                                                        7 when costs begin to climb.
       Years 7 – 10 (only if no additional   $ / year
       government support available)

       Average residential                       $14

       Average farming                         $168

       Average commercial                      $224

       Average exotic forestry                  $721

10                                                             Long Term Plan 2018–2028 Consultation Document
OPTION 3
A staged approach with a new targeted rate to be assessed on exotic
forestry properties to collect:
• $90,000 in Year One
• $112,000 in Year Two
• $135,000 in Year Three and beyond
This would mean that exotic forestry properties would pay double their current contribution to
roading in Year 1, 2.25 times in Year 2 and 2.5 times in Year 3 and beyond.
Impact on rates Impact on debt
An additional $90,000 in Year 1, $112,000 in None
Year 2 and $135,000 in Year 3 and beyond
Impact on levels of service
from exotic forestry properties.
No change
The remainder of the costs attributable to
forestry properties in the Whanganui District
(on average $112,000 per year in Years 1 – 6
Option 3 would gradually increase funding
and $650,000 per year from Years 7 – 10)
from exotic forestry properties, reaching 60%
would be funded from the existing Roads and
funding by these properties by Year 3. The
Footpaths Rate.
remainder would be funded by the Roads
Years 1 – 6 $ / year and Footpaths Rate. This would allow exotic
forestry property owners to prepare for the
Average residential $2 increase in rates and manage their costs and
cash flows, but it would mean an increase to
Average farming $29 the Roads and Footpaths Rate for the rest of
the community to fund part of the costs
Average commercial $39 caused by exotic forestry properties. Council
will continue to lobby central government for
Average exotic forestry $568 a national funding solution to be in place
ahead of Year 7 when costs begin to climb.
Years 7-10 (only if no additional $ / year
government support available)
Average residential $14
Average farming $168
Average commercial $224
Average exotic forestry $721
Important issues for the next ten years 11OPTION 4
Implement a new targeted rate to exotic forestry properties to recover
the full costs of forestry roading impacts attributable to properties
located in the Whanganui District.
This would mean that exotic forestry properties pay about 3.5 times their
current contribution to roading in Years 1–6.
Impact on rates Impact on debt
An additional $225,000 per annum from None
exotic forestry properties in Years 1 – 6 and
Impact on levels of service
$800,000 per year in Years 7 – 10.
No change
Years 1 – 6 $ / year
No impact on the existing Roads and Option 4 would see all of the costs
Footpaths Rate. attributable to exotic forestry properties paid
for by those properties. This would mean a
Average residential $0 significant rates increase for the small group
of exotic forestry property owners in Year 1
Average farming $0 which could cause affordability and cash flow
issues, particularly for the properties who are
Average commercial $0
some time away from receiving income from
their harvest and for remote properties which
Average exotic forestry $1,123
may become uneconomic. No costs of
forestry roading impacts would be passed on
Years 7-10 (only if no additional $ / year to the rest of the community. Council will
government support available) continue to lobby central government for a
national funding solution to be in place ahead
Average residential $0 of Year 7 when costs begin to climb.
Average farming $0
Average commercial $0
Average exotic forestry $3,939
12 Long Term Plan 2018–2028 Consultation DocumentPreferred option Assumptions
Our preferred option is Option 2. We believe Our key assumptions are:
this option balances affordability for both
• that forests are harvested at maturity and
exotic forestry ratepayers and the rest of the
transported via expected routes.
community who pay the Roads and
Footpaths Rate, while also recognising who • that roading deterioration from the
causes these costs. transportation of timber across our
roading network occurs as predicted by
our computer modelling.
• that Council will secure New Zealand
Transport Agency (NZTA) funding for
forestry related road surface damages at
its standard subsidy rate of 61%.
• that Council will continue to lobby central
government for a national funding solution
to be in place ahead of Year 7 when costs
begin to climb.
Important issues for the next ten years 132
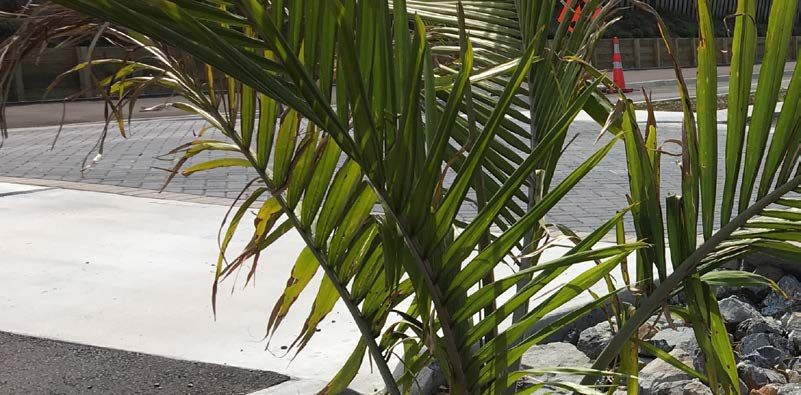
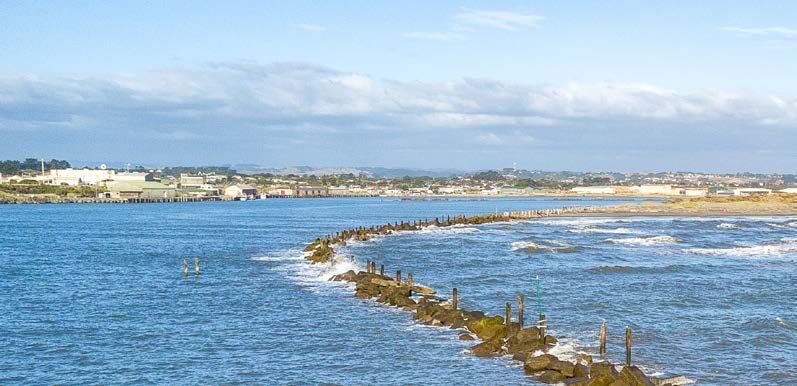
Revitalisation of our port
In 2010 Whanganui District Council purchased and took back control of
the port business at Castlecliff Port in the interests of the district and to
determine whether there were opportunities to repair the infrastructure
and grow the business, or whether the facility should be closed. At the
time the port structures were suffering from many decades of deferred
maintenance and this is still an issue today.
In 2015 the Council considered a number of The government provided $500,000 for a
options for the future of the commercial port, business case which should be completed by late
including closure, but decided to keep a window June 2018. Developing the business case involves
of opportunity alive for the port, investing $2M to comprehensive engagement with businesses
upgrade part of Wharf One. wishing to develop in the port area, formation of
consultation groups, public meetings and a
In 2017, the Council applied to the government master-planning process. More recently, on 23
via the region’s Accelerate25 Programme for February 2018 the government announced that
funding to undertake a business case to identify the Provincial Growth Fund (PGF) will invest more
how government, Council and private business than $6M towards revitalisation of the Whanganui
investment in the port and surrounding area will Port and upgrade of the town’s rail line. Subject to
grow the Whanganui economy and increase the business case, the government will support
employment. works to the port to the level of $3M.
14 Long Term Plan 2018–2028 Consultation DocumentThe business case and master plan should demonstrate that investment in the port will attract private investment in business ventures and has both economic and community benefits, and that it is approved by the government and the Council. The Council has provided for a contribution in the Long Term Plan. Subject to the final business case, it is envisaged that the money will be used for a number of activities including: removal of derelict land-based structures, upgrading wharf structures, providing vessel launch and retrieve facilities for commercial vessels and developing land and water based recreational facilities. The Council’s proposed capital expenditure is budgeted at $0.5M for year one, $2.7M for year two, $0.6M for year three, and $3.1M for year five – there is no capital expenditure for the Port in year four. This expenditure will be loan funded. The proposed investments for years one to three are for port-related structures and in year five for community facilities. It is important to note that the amounts and time frames of the proposed investment included in the Long Term Plan are provisional at this stage and may alter in the process of finalising the business case and obtaining government and Council approval for the programme. Important issues for the next ten years 15
Summary of options

     OPTION 1 (preferred)

     Proceed with the Port Revitalisation Programme, should the business
     case be approved.
     Impact on rates                                    Impact on debt

     Minimal impact on rates for Years 1–2 until        A total of $6.8M loan-funded over Years One
     loans have been fully drawn down.                  to Five of this plan:

      Years 3–5                              $ / year   •   $0.5M in Year 1
                                                        •   $2.6M in Year 2
       $0.4M per year from rates to begin to repay      •   $0.6M in Year 3
       the debt and service the interest.               •   $3.1M in Year 5

      Average residential                       $24     Impact on levels of service

                                                        An increased level of service at the port
      Average farming                           $26     including opportunities for land and water-
                                                        based recreational facilities.
      Average commercial                        $36

      Year 6 onward                          $ / year   Option 1 depends on the business case
                                                        demonstrating that the commercial and
       From Year 6 we will require $0.7M per annum      community benefits will be worth the
       from rates to repay the debt and service the
                                                        proposed investment. To explain the
       interest.
                                                        commercial benefits we will need to show
                                                        how new infrastructure at the port will attract
      Average residential                       $36
                                                        new or grow existing business and bring
                                                        economic development and job growth.
      Average farming                           $38

                                                        To attract government investment the Council
      Average commercial                        $53.
                                                        must also invest on behalf of the community.
                                                        Generally government and council economic
                                                        development initiatives take place because,
                                                        while the opportunity has been identified, the
                                                        level of return and/or risk means the private
                                                        sector will not undertake the business
                                                        development on its own.

                                                        The proposed investment in community
                                                        infrastructure for facilities such as a
                                                        swimming area, recreational park and
                                                        facilities for non-powered recreational craft,
                                                        also depends on the community benefits
                                                        being worth the estimated costs.

16                                                            Long Term Plan 2018–2028 Consultation Document
OPTION 2
Do not proceed with the Port Revitalisation Programme.
Impact on rates Impact on levels of service
None There will continue to be low levels of service
and most of the facility will continue to look
Impact on debt dilapidated.
None
The Harbour Endowment and Council will
fund repairs to port infrastructure only when
absolutely required for business or health and
safety reasons.
There will be no community facilities built in
the port area.
This option would see businesses make their
own decisions about where and when to
invest in or around the port area. Although
this option saves money in the short term, it
means there will be no programme to attract
government investment and business growth.
Preferred option Assumptions
Our preferred option is Option 1 because it Our key assumptions are:
provides the Council with an opportunity to
• that the business case will be approved by
attract government investment in regional
the government and the Council
economic development, which will help
grow the district. • that construction and upgrade work will
be complete by 2023. Future stages will
be dependent on supporting business
cases
• that proposed costs are favourable in
relation to the community benefits.
Important issues for the next ten years 173
Our stormwater network
We provide stormwater collection and disposal to protect the health and
safety of our community, including land and property. We provide an urban
stormwater network which includes a piped stormwater system and a
network of open waterways.
Some parts of our district are more prone to Previously, the Council has made no provision for
experiencing poor stormwater drainage and may upgrading the stormwater network to improve its
be exposed to more frequent flooding events than performance, or to prepare for the potential long
others. term effect of climate change on the network.
The Council recently completed a detailed The stormwater modelling study has shown that to
stormwater modelling study to assess the drainage upgrade all the undersized pipes to an acceptable
capacity (performance) of the urban stormwater design standard, a total investment of $80M would
network. The way the stormwater network is be required. However we do not believe such an
currently performing is significantly below investment would be financially sustainable to the
acceptable standards. In addition the impacts of community.
anticipated climate change are likely to cause
Our preferred option is to invest in priority areas
further deterioration to the capacity of the
first, with a much smaller investment programme
stormwater network over the next 50 years –
of $25M. This approach would address the highest
causing even worse stormwater drainage, and
risk to residential properties and improve the
more frequent flooding.
18 Long Term Plan 2018–2028 Consultation Documentoverall performance of the stormwater system. We are not including any funding for treatment of
The areas with the most dwellings located in a our stormwater, because we comply with the
potential flood zone have been assigned the stipulations of our discharge consent for
highest priority, in descending order. Using this stormwater from Horizons Regional Council
method, the first three priority areas are: (Horizons).
1. Central City area (Halswell St, London St,
Harrison St)
2. Springvale, College Estate and Cemetery area
3. Aramoho-West (Brunswick Rd, Kaikokopu
Stream, Tangingongoro Stream) area
The rest of the network, including Whanganui
East, Putiki, Gonville and Aramoho-East, will be
upgraded over a much longer period.
Because of the long-term nature of this project,
we will rate fund the capital costs. Council uses
loan funding for one-off capital projects to
smooth funding requirements and ensure that the
generations who benefit pay their fair share for
long-term assets. However in this case the project
itself has been staged with a consistent annual
budget available each year to undertake the
works. This has been proposed with affordability
for the community and the desire to reduce debt
in mind. Loan funding would not be appropriate
because we would continue to borrow for this
project for decades to come, which would not
achieve Council’s objective of reducing debt. It
would also incur significant interest costs.
Important issues for the next ten years 19Summary of options
OPTION 1
Retain the status quo. This would mean no funding for any upgrades to
the stormwater network, and properties in certain areas would remain at
risk of flooding and/or poor stormwater drainage.
Impact on rates Impact of levels of service
None Retain the existing level of service over the
short term (50 years), due to
climate change This means even worse
stormwater drainage, and more frequent
flooding.
OPTION 2
Upgrade all undersized assets within the stormwater network as soon as
possible.
Impact on rates
Years 2 – 10: $ / year
• $80M over 40 years, at $0.5M in Year 1,
• $1M per year for Years 2-10 and then
Average residential $57
• $2.33M per year thereafter.
Average commercial $210
The Stormwater Disposal Rate is charged on
Capital Value, so the impact will vary from
(Note: farming properties are generally not serviced and
property to property
therefore do not pay for stormwater)
Year 1 $ / year Impact on debt
$0.5M funded from loans in Year 1 only.
Average residential $30
Impact of levels of service
Average commercial $111
Gradual improvement to the performance of
the network over 40 years, to reflect today’s
standard.This will greatly improve stormwater
drainage, and reduce the frequency of
flooding.
20 Long Term Plan 2018–2028 Consultation DocumentOPTION 3 (preferred)
Upgrade only the priority areas (to today’s standard), and the remainder
in descending order of priority over time.
Impact on rates Impact on debt
$25M over 30 years, at $500K per year for $0.5M funded from loans in Year 1 only.
Years 2-10 and then $1M per year thereafter.
Impact of levels of service
The Stormwater Disposal Rate is charged on Gradual improvement to the performance of
Capital Value, so the impact will vary from the stormwater network for the priority areas
property to property only (to today’s standard) over 20 years, and
then a gradual improvement to performance
Year 1 $ / year of the remainder of the stormwater network
(to a similar standard) thereafter.
Average residential $2
This would mean improved stormwater
drainage to the priority areas, and a reduced
Average commercial $6
frequency of flooding.
Years 2 – 10: $ / year
Average residential $28
Average commercial $105.
(Note: farming properties are generally not serviced and
therefore do not pay for stormwater)
PREFERRED OPTION ASSUMPTIONS
Our preferred option is Option 3 as we Our key assumptions are:
believe this balances affordability to the
• that climate change is progressive, over
community with addressing the highest risk
the long term
areas first, improving stormwater drainage
where it is most needed and helping to • that today’s standard is unlikely to change
reduce the frequency of flooding events. significantly over the long term
• that affordability is a key driver for this
activity
Important issues for the next ten years 21Our financial strategy – funding our
community into the future
What is our financial strategy?
An important part of our work leading up to this In planning for the future we have considered the
Long Term Plan has been the development of our likely impact of climate change on our assets,
Financial Strategy. The Financial Strategy particularly in roading and stormwater. Our
describes how we plan to finance our services in population is expected to grow modestly over
a sustainable way over the long term. Its purpose the next ten years followed by a levelling off and
is to ensure the Council manages financial subsequent decline. We have an ageing
decisions carefully when it chooses which community with a large and increasing
services to provide. Our expenditure and funding proportion on fixed incomes, and our community
plans must be sustainable so that we have the is less wealthy than other places in New Zealand.
capacity and resources to deliver affordable
For these reasons, the aim of our financial
services to residents and ratepayers in the
strategy is for the Council to be an affordable and
medium to long term.
financially sustainable organisation while at the
In simple terms, we must live within our means, same time delivering good quality services and
ensuring that current ratepayers are paying the promoting growth within the district. This can be
reasonable costs of the services they are summarised as living within our means while still
consuming. contributing to Whanganui being a great place to
live.
Our Financial Strategy is designed to give you an
understanding of both our current and future We are focused on:
financial positions. It also outlines the main
factors that affect demand for the Council’s • managing our finances prudently and
sustainably
services and their costs, as well as the financial
challenges and risks we face and how these risks • keeping rates at affordable levels
will be addressed. • reducing debt with corresponding reductions
in interest costs
Major infrastructure work over the past 30 years, • improving our financial resilience
including separation of the stormwater and • looking for efficiencies in the way we do
wastewater systems, improved water supply and business
construction of the wastewater treatment plant • changing the way we manage our assets to
has provided our community with assets that will get better value for money and reduce risk to
serve many decades into the future. These our critical assets
projects have, however, had a significant impact • investigating and pursuing non-rates revenue
on the amount of debt that the Council carries. streams
This has been combined with rates rises in the • encouraging sustainable growth
past that have not always kept pace with the
ever-growing list of services delivered by the
Council.
22 Long Term Plan 2018–2028 Consultation Document0.3%
3% 1%
3%
7% Where the Council gets its money
Rates - excluding water by meter, trade waste and penalties
11% Fees and charges
Subsidies
Loans raised
Rates - water by meter, trade waste and penalties
External funding
Investment income
Development Contributions
12%
63%
6%
9%
Where the Council spends its money
Operating costs
41% Capital expenditure
Personnel costs
18% Debt repayment
Finance costs
26%
Where the money comes from Further information on our other revenue sources
can be found on page 28.
Whanganui District Council needs about $93M
per annum on average to fund its services.
Where the money is spent
Our largest funding source is rates. Other funding
Operating our services
comes from user fees and charges, subsidies,
investment income, development contributions, We plan to spend $67M on average over the ten
external funding such as donations and grants, years of this plan on operating our services.
and capital funding sources like loans and special
Our operations will be mainly business as usual
funds.
over the course of the plan. Even business as
usual costs more each year because prices for
items such as labour and materials increase.
65–75% of our funding Inflation is included in our future years’ forecast
comes from rates expenditure. We use the Local Government Cost
Our financial strategy – funding our community into the future 23Our proposed capital expenditure by group
of activities 2018-2028
$50M
$38M Provision of roads and footpaths
Parks and recreation
Investments
Transportation
$25M Community facilities and services
Corporate
Stormwater drainage
Community and cultural
$13M
Water supply
Provision of roads and footpaths
Sewerage and the treatment and
disposal of sewage
$0M
2018/19 2019/20 2020/21 2021/22 2022/23 2023/24 2024/25 2025/26 2026/27 2027/28
Index (LGCI) to adjust future costs because it is The Council has made significant investments in
relevant to the types of goods and services that infrastructure in the past 30 years. Our focus for
councils purchase such as pipes and roading. The the next ten years is on essential infrastructure
forecast average increase in the LGCI over the ten and investing in capital that supports growth. Our
years of this plan is 2.3%. major capital projects are outlined in the
Infrastructure Strategy section of this document
The main changes that will impact on operating (see page 43).
costs over the period of this Long Term Plan are:
The projects outlined in this plan are in many
• The operation of the new wastewater different stages of development – some are in
treatment plant from 2018/19. preliminary investigations, others require
• The requirement for Council to fund the port resource consents, and others are awaiting
operation due to the returns of the Harbour funding commitments from others. The plan
Endowment investment property portfolio includes likely costs for each project, but things
being insufficient to meet the needs of the can change.
port from 2018/19.
We plan to spend about $10M on infrastructure
Capital projects related to growth in the next ten years to address
We plan to spend $27M on average over the ten expected demand and meet the needs of the
years of this plan on capital expenditure. Years National Policy Statement for Urban
one to three of the plan have higher capital Development Capacity 2016. This spending is for
expenditure due to the Sarjeant Gallery the growth areas identified in the Springvale
redevelopment. The impact of the forestry West and Otamatea Structure Plans. The cost for
harvest on our roads is most evident from 2024 this infrastructure will be funded by debt. We
onward. have recently consulted on a development
contributions policy that will allow us to recover a
Capital expenditure is primarily funded by loans, significant portion of these costs from developers
NZTA subsidies for our roads, rates, external who benefit when the land is developed.:
funding sources like grants and donations for the
Sarjeant Gallery, and development contributions. You can view the capital expenditure
over a 20 year period (2008-2028) in our
Financial Strategy.
24 Long Term Plan 2018–2028 Consultation Document$10.4
Our capital expenditure
2018-2028 ($M)
$88.4
Replacing existing assets
Level of service increases
Growth
$168.0
Managing our debt With the completion of the construction of the
wastewater treatment plant in early 2018, the
The Council uses debt to help pay for long-term focus of the ten-year period of this Long Term
assets. Borrowing smooths the impact on rates Plan is on delivering core infrastructure projects
for one-off capital projects. It also spreads the that support growth, maintaining and improving
cost of the asset over time so that the our critical assets, and repaying debt.
generations that have use of the asset also
contribute to paying for it. Debt is repaid by other We will loan fund $70M of capital projects over
funding sources such as rates, fees and charges the ten-year period, but we have planned to
and development contributions. repay $94M of debt over the same period.
Average debt principal repayments of $9.4M per
annum are built into our forecasts. We have
We expect to have debt of assumed that on average the Council will pay
$113M by 30 June 2018. 5.5% interest on debt over the ten years of this
plan.
We are proposing to continue the Debt
To ensure we are sustainable we will ensure we Retirement Rate that we introduced in 2012
meet the following self-imposed limit: throughout the life of this plan to address debts
for stormwater and roading.
• debt is less than 200% of total revenue
Major infrastructure work over the past 30 years,
including the separation of the stormwater and Our district’s debt level
wastewater systems, improved water supply and
the wastewater treatment plant, has provided our
is about 122% of our total
community with assets that will serve for many revenue in 2018/19.
decades into the future.
That’s the equivalent of a household
earning $50,000 per year and having a
mortgage of around $61,000.
Our financial strategy – funding our community into the future 25Proposed debt 2018-2028 compared to debt limit (200% of total revenue)
$250
$200
$150
131% 127% 133%
$M
122% 129%
119%
107% 100%
$100 91% 86%
$50
$0
2018/19 2019/20 2020/21 2021/22 2022/23 2023/24 2024/25 2025/26 2026/27 2027/28
Debt ($M) Debt limit (200% of total revenue) ($M)
We also propose to change the way we fund our Keeping rates affordable
roading activity. We propose to continue the
The Council will collect around 60-70% of its
fixed rate per SUIP1 (the Storm Damage Rate, to
annual income from rates (excluding water
be renamed the Roading Resilience Rate)
by meter and trade waste targeted rates and
over the period of this Long Term Plan to fund
penalties) over the next ten years.
the roading activity. This will help to spread the
roading cost burden more fairly and affordably Total rates (excluding water by meter, trade waste
across all ratepayers. targeted rates and penalties) will increase to
$71M by 2028.
Implementing this rate will improve our financial
resilience in roading which is important should Our self-imposed financial limits for rates are:
we face unexpected costs due to damage from
weather events (see page 33 for further • rates revenue (excluding water by meter and
information). trade waste targeted rates and penalties) is
no more than 75% of total revenue
With these mechanisms in place we expect to
• rates increases (excluding water by meter
reduce debt to $88M by 30 June 2028. and trade waste targeted rates and penalties)
are no more than the Local Government
inflation rate plus 3% in 2018/19 and the Local
By 2027/28 we expect Government inflation rate plus 2% in all other
our debt to be 86% of our years (after accounting for growth)
total revenue. These limits are the maximums we have set.
We stay within the limits in all years of the Long
This is the equivalent of a household Term Plan and in some years we are well below
earning $50,000 per year and having a these limits.
mortgage of less than $43,000.
1 (SUIP) separately used or inhabited part of a rating unit
26 Long Term Plan 2018–2028 Consultation DocumentProposed rates revenue 2018-2028 compared to rates limit (75% of total revenue)
$80
69%
69% 68%
71% 69%
71% 71%
65%
63%
$60 59%
$M
$40
$20
$0
2018/19 2019/20 2020/21 2021/22 2022/23 2023/24 2024/25 2025/26 2026/27 2027/28
Rates revenue ($M) (excluding water by meter, trade waste and penalties) Rates limit (75% of total revenue) ($M)
2018/19 2019/20 2020/21 2021/22 2022/23 2023/24 2024/25 2025/26 2026/27 2027/28
Proposed rates 4.5% 3.7% 3.6% 1.5% 1.6% 1.6% 0.7% 3.2% 0.7% 2.3%
increase*
Rates increase limit 5.0% 4.2% 4.2% 4.2% 4.3% 4.3% 4.4% 4.5% 4.6% 4.7%
Rates as a % of total 59% 63% 65% 71% 71% 71% 69% 69% 68% 69%
revenue
* after accounting for growth of $200,000 per year
We expected in the 10-Year Plan 2015-2025 that We are mindful that the community has limited
the 2018/19 year would have a higher rates ability to pay for services and we need to offer
increase than normal with the new wastewater value for money. More information on what this
treatment plant becoming operational. We will be means for your rates is contained on page 36.
able to treat our wastewater effectively before it
is discharged to the sea.
Rates are forecast to
increase by an average of
2.4% annually (including
inflation).
Our financial strategy – funding our community into the future 27Other revenue budgeted $1M per annum in dividends and loan
repayments from WDCHL’s investment in GasNet.
With a financial strategy focused on reducing debt
and keeping rates affordable, we will continue to Development contributions
look at ways to increase the Council’s income from Development contributions allow councils to
sources other than rates. We forecast collecting recover their growth-related capital expenditure
around 25-35% of our income from sources other from developers who will benefit. Whanganui
than rates over the next ten years. District Council has recently consulted on a new
policy for collecting development contributions,
Fees and charges
which is proposed to come into effect from 1 July
We charge fees to recover all or some of the costs 2018. These will be targeted at the urban
of our services, where there is a private benefit to expansion areas identified in both the Otamatea
a specific user. The proposed fees and charges to West and Springvale Structure plans. We are
be effective 1 July 2018 are being consulted upon forecasting income of $3.5M from development
alongside this Long Term Plan and are available at contributions over the period of this Long Term
www.whanganui.govt.nz/long-term-plan. We will Plan.
continue to review our fees and charges annually.
Asset sales
Subsidies and grants
We continue to investigate selling our surplus
We receive a range of subsidies from central assets. Asset sales are an important potential
government and these are an important source of funds to help us achieve our debt
component of our non-rates income. Roading repayment strategy, but we are mindful that this is
subsidies from the New Zealand Transport Agency an issue people can feel very strongly about. We
(NZTA) are by far the biggest single subsidy consulted on the sale of forestry investment in our
source at an average of $9.7M per annum over the last Long-term Plan 2015-2025 and the community
ten year Long Term Plan period. After a number of generally supported the sale. The forestry
years of reductions, our base NZTA financial investment was conditionally sold by tender, with
assistance rate (FAR) has levelled off at 61% and is the sale subject to Overseas Investment Office
expected to remain at this level. This is 1% higher approval. The Council awaits the final decision of
than earlier indications. We are assuming that the Overseas Investment Office. We have assumed
NZTA will subsidise damages to our roads as a in this plan that the sale will proceed before 30
result of the forestry harvest at this rate. We have June 2018 and the sale proceeds will be applied to
also forecast external income of $29M in years reducing debt in the Wastewater activity (for
one to three of this plan in the form of funding for further information, see the Wastewater and Trade
the redevelopment of the Sarjeant Gallery. This Waste section of ‘Who Pays’ on page 30). We
includes funding from central government, trusts, have not included any forecast income from asset
corporate sponsors and private philanthropic sales over the next ten years into our plan, with
donations. the exception of the sale of the library bus which
is being replaced with alternatives. Any significant
Investment income
assets proposed for sale will be subject to
Income from our investment portfolio is an community consultation at the time.
important component of our non-rates income
that helps to reduce the burden on our ratepayers
and/or repay debt. Whanganui District Council
Holdings Ltd (WDCHL) is the Council’s investment
arm. It oversees investment activities that aim to
enhance the development of our district and
provide an acceptable financial return to the
community. For this Long Term Plan we have
28 Long Term Plan 2018–2028 Consultation DocumentBalanced budget • This ‘risk-based’ approach to asset
management ensures the service capacity
We have a ‘balanced budget’ requirement – this and integrity of assets throughout their
means we must ensure that each year’s projected useful lives are maintained.
operating revenues are set at a level sufficient
• We do not rate fund depreciation; instead we
to meet that year’s projected operating expenses directly fund our assets when they are
(including depreciation) unless the Council replaced and we make regular loan
resolves that it is financially prudent to do repayments. We believe that this is a more
otherwise. prudent and stable approach as funding is
not influenced by factors such as revaluations
Although the ‘balanced budget’ requirement is
and large capital projects that can cause
not met for a number of years we believe that
spikes in depreciation. In addition this
this is a financially prudent budget for the
approach ensures that each generation that
following reasons:
uses an asset pays their fair share towards
• We are consistently reducing our overall debt that asset.
each year from 2020/21 onwards. • This plan includes depreciation for large new
• We are adopting a ‘risk-based’ approach to assets including the wastewater treatment
asset management, meaning that critical plant, Sarjeant Gallery redevelopment and
assets are maintained and non-critical assets port revitalisation. We do not expect to have
are replaced when they wear out rather to fund significant renewal expenditure for
than when they are at the end of their these assets for some time.
theoretical lives. • We have included $10.4M in this long term
plan for growth related projects.
Council’s forecast operating surplus or deficit for each year:
2018/19 2019/20 2020/21 2021/22 2022/23 2023/24 2024/25 2025/26 2026/27 2027/28
Forecast surplus / 11,794 8,307 5,612 (3,195) (1,352) (2,274) (154) 1,477 1,134 (370)
(deficit) ($000)
Our financial strategy – funding our community into the future 29Who pays – and how
do we make the system fairer?
We are continually reviewing our funding structure to ensure it works for
our community.
We are consulting on our Draft Revenue In addition we are proposing some changes
and Financing Policy and Proposed Fees to our rating structure which are outlined
and Charges for 2018/19 separately from below. You can provide feedback via our
this Long Term Plan and you can view website
these documents and provide feedback on www.whanganui.govt.nz/long-term-plan
our website at
www.whanganui.govt.nz/long-term-plan
1. Wastewater and trade waste
The new Whanganui urban wastewater treatment You can view the draft Revenue and
plant will soon be operational, so we have Financing Policy, our draft Fees and
reviewed the costs of providing the service, who Charges for 2018/19, and our proposed
should pay and how. rates and provide feedback on our website
at www.whanganui.govt.nz/long-term-plan
The city wastewater rate (otherwise known as the
‘pan tax’) remains the fairest way to charge all
properties connected to the system for the Trade waste
availability of the wastewater network and We have assessed that the fairest way of
discharges of a domestic nature. There is no allocating costs between municipal and trade
practical way to measure these discharges. waste users is to take a marginal cost approach.
This means that businesses who discharge trade
Trade wastes are wastewater discharges of a
wastes pay for the additional costs over and
non-domestic nature and include tankered waste
above the cost of conveying, treating and
discharges to the Council’s wastewater system.
disposing of discharges of a domestic nature.
Trade wastes incur additional costs to the Council
Under this approach municipal users are no
to convey, treat and discharge. We are proposing
better or worse off than they would be if the
some changes to the way we charge businesses
trade waste businesses did not discharge their
who discharge trade wastes. These changes will
waste to the Council’s wastewater system.
have an impact on our rates and fees and charges
and our Revenue and Financing Policy. We are We do not currently charge for tankered waste
consulting separately on our draft Revenue and discharges to the Council’s city wastewater
Financing Policy and draft fees and charges for system, but we propose to introduce fees and
2018/19. charges to reflect the costs involved in conveying,
treating and disposing of the effluent they
discharge.
30 Long Term Plan 2018–2028 Consultation DocumentWe also propose to change the funding structure for major trade waste users (that is, those that discharge over 100m3/day). We want to retain these businesses in Whanganui as they have a significant positive impact on the local economy and employment, but we also need to ensure they pay their fair share. Major trade waste businesses will pay for the additional capital cost we have incurred to upsize the Whanganui urban wastewater treatment plant to cater for their discharges. Targeted rates will be set on each of the major trade waste businesses’ properties, based on repayment of their share of the capital cost over a 25 year period. These businesses will also pay for the cost of conveying, treating and disposing of the trade waste they discharge to our wastewater system. Targeted rates will fund fixed operating costs such as staff, while the variable operating costs such as electricity, gas and sludge chemicals will be funded via fees and charges based on the actual quantity and quality of effluent discharged by each business. We will investigate businesses discharging under 100m3/day to see whether any are discharging trade waste. We may implement volumetric fees and charges for these discharges in year two of this Long Term Plan if it is identified that these businesses are discharging trade waste over and above what they pay for in their city wastewater rate or ‘pan tax’. Further information on the rationale behind the proposed funding of the wastewater activity is contained in the Revenue & Financing Policy and the supporting Funding Needs Analysis for Wastewater. These documents are available on the Council’s website at www.whanganui.govt.nz/long-term-plan. Who pays – and how do we make the system fairer? 31
Wastewater and trade waste rates and fees for                has also recently sold some of its carbon credits.
2018/19                                                      The Council has decided to apply the net
                                                             proceeds of these asset sales to the wastewater
Whanganui District Council is expecting to sell its
                                                             activity to keep the Whanganui city wastewater
forestry investment portfolio (excluding
                                                             system affordable for those connected to it.
Waitahinga and Nukumaru) by 30 June 2018. It

The rates and charges proposed for 2018/19 for the Whanganui city wastewater system are summarised
as follows (GST inclusive):

  City                  Targeted rates                                                     No change to
  wastewater                                                                               funding structure
                        •   $425 per separately used or inhabited part of a rating unit
                            (SUIP) for connected residential properties
                        •   $425 per SUIP for connected non-residential properties
                            with a single pan
                        •   $212 per pan for connected non-residential properties with
                            multiple pans

 Trade waste            Targeted rates                                                     Funding structure
 more than                                                                                 changed
                        •   Varying contributions to the capital cost of the Whanganui
 100m3/day                  city wastewater treatment plant upgrade, plus
                        •   $34.848 per m3 average daily flow set via the discharge
                            permit issued under the Council’s Trade Waste Bylaw 2018,
                            plus
                        •   $11.786 per kg average daily Chemical Oxygen Demand
                            (COD) set via the discharge permit issued under the
                            Council’s Trade Waste Bylaw 2018, plus
                        •   $44.182 per kg average daily Total Suspended Solids (TSS)
                            set via the discharge permit issued under the Council’s
                            Trade Waste Bylaw 2018, plus
                        Fees and charges
                        •   $0.08238 per kg Chemical Oxygen Demand (COD)
                            discharged, plus
                        •   $0.25283 per kg Total Suspended Solids (TSS) discharged.

 Tankered waste         Fees and charges                                                   New
                        $9.90 per m3 effluent discharged

     Further detail is available in:

     •   The Draft Revenue and Financing Policy – being consulted upon separately alongside this
         Long Term Plan at www.whanganui.govt.nz/long-term-plan

     •   The Draft Fees and Charges for 2018/19 – being consulted upon separately alongside this
         Long Term Plan at www.whanganui.govt.nz/long-term-plan

     •   The Funding Impact Statement – Rates Information provided as supporting information to this
         Long Term Plan 2018-2028.

32                                                                  Long Term Plan 2018–2028 Consultation Document
2. Resilient roading
The Whanganui District has a significant hinterland
serviced by a roading network which is vulnerable $ / year Commercial Farming Residential
to weather events. In 2016/17 we introduced a new
rate (the Storm Damage Rate) to fund the repair Rate per SUIP $45 $50 $45
of damage caused to our infrastructure in the
June 2015 weather event. This rate was intended
The rate will secure additional funding for roading
to be in place for a five year period. The majority
from residential ratepayers and will ease the
of costs to be funded by the rate were for roading,
burden on farming and commercial ratepayers.
with a smaller portion allocated to our wastewater
This will enable us to ensure that our roading
and stormwater systems.
activity is sustainable and resilient into the future.
Reinstatement works resulting from the June 2015
Alternative options
weather event are now complete and costs were
lower than expected, but we have significant debt If the proposal was not implemented, the Council
in our roading activity which is not being would cease the Storm Damage Rate from
effectively addressed. We also expect climate 2021/22 and then fund the increased amounts
change to increase the vulnerability of our roading required to increase roading resilience from the
network into the future and this will result in existing Roads and Footpaths Rate. This would
additional costs. add a significant rates burden to farming and
commercial ratepayers but lower the contribution
The roading debt has risen due to increasing costs from residential properties from year four of this
and decreasing subsidies from NZTA. This has Long Term Plan.
meant that the Council has had to balance using
borrowing and rates to fund the increasing The average impact of funding the same amount
shortfall. from the Roads and Footpaths Rate is:
The current rating structure for roading has 32% of
$ / year Commercial Farming Residential
the total rates requirement contributed by farming
ratepayers, 36% from commercial ratepayers and Average rate per $195 $217 $17
32% from residential ratepayers. As there are a SUIP
small number of ratepayers in the farming and
commercial categories, increasing rates to repay
The Council could choose not to rate fund the
debt imposes a significant burden on these
additional amount from 2021/22. This would
ratepayers. Our efforts to keep rates affordable
reduce rates for all ratepayer groups but would
have meant that the Council has not been able to
increase debt by $856,000 per annum from
sustainably manage the ongoing costs of roading
2021/22 onward to maintain service levels. This
– resulting in an increasing debt balance.
would not be sustainable or prudent and would
To address this issue we propose to continue the not achieve the Council’s objective of increasing
Storm Damage Rate over the period of this Long financial resilience, especially in light of potential
Term Plan as the Roading Resilience Rate. future impacts to the roading network as a result
The rate will continue to be set on a per SUIP2 of climate change.
basis, with farming properties paying $5 more
than residential and commercial properties given
that most weather-related damage occurs on
|rural roads.
2 (SUIP) separately used or inhabited part of a rating unit
Who pays – and how do we make the system fairer? 33You can also read