Climate Change Action Plan 2011-2020 - Northern ...
←
→
Page content transcription
If your browser does not render page correctly, please read the page content below
Climate Change Action Plan 2011-2020
For Further Information
Visit      www.darwin.nt.gov.au
Contact    The Manager, Climate Change & Environment
           08 8930 0530
© Darwin City Council 2011

Acknowledgements
Council acknowledges the assistance and advice provided by their Climate Change and Environment Advisory Committee
and wishes to thank all staff and community members who have contributed in any way to the development of the Climate
Change Action Plan 2011–2020. Council also thanks the staff at the Bureau of Meteorology, Darwin, for their contribution and
acknowledges the advice and references from the relevant Australian and Territory government departments and organisations.

Disclaimer
The information in this document has been gathered from the most current data available at the time of writing.
All figures and diagrams have been sourced from various government and climate change research organisations documents,
especially from those listed under References at the back of this document and through their websites.
The Climate Change Action Plan 2011–2020 should be read in the setting of being ‘a living document’. As such the Plan will be
reviewed every three years and appropriated amendments made.
Further, anticipated additional contemporary information which will be released over the forthcoming years by governments and
research organisations will be considered alongside the current information provided throughout the term of the Climate Change
Action Plan 2011–2020.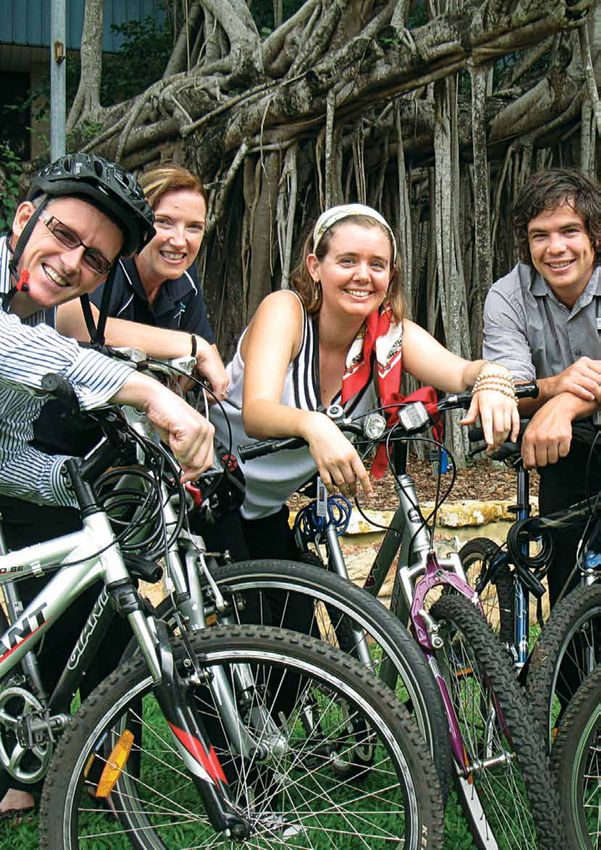
Table of Contents
             Introduction                                                      4
             Foreword                                                          4

             Executive Summary                                                 5

             Section 1 – Climate Change Policy Structures                      8
             1.1 Global Architecture – The Convention and the Kyoto Protocol   9

             1.2 Australian Government’s Response to Climate Change            10

             1.3 Northern Territory Government Response to Climate Change      11

             1.4 Local Government Response to Climate Change                   11

             Section 2 – Climate Change Overview                               12
             2.1 What is Climate Change?                                       13

             2.2 What are Greenhouse Gases?                                    14

             2.3 Australia’s Historical Climate Changes                        16

             2.4 Australia’s Emissions                                         16

             2.5 Northern Territory’s Emissions                                17

             2.6 Darwin City Council’s Emissions                               18

             2.7 Rainfall and Sea Level Impacts                                19

             2.8 Severe Weather Events                                         21

             2.9 Temperature Increases                                         22

             2.10 Coastal Erosion                                              23

             2.11 Biodiversity                                                 24

             2.12 Climate Change and its effects on Darwin                     25

             2.13 Summary of Climate Change effects                            25

2   Climate Change Action Plan 2011-2020 City of Darwin
Introduction
Section 3 – Climate Change Action Plan 2011-2020                               26
3.1 Implementation                                                             27

                                                                                            Policy Structures
                                                                                            Climate Change
                                                                                                                         Section 1
3.2 Benefits                                                                   27

3.3 Commitment                                                                 27

Section 4 – Corporate Actions                                                  28
4.1 Climate Change                                                             29

4.2 Water                                                                      30

                                                                                            Climate Change
4.3 Land                                                                       31

                                                                                                                         Section 2
                                                                                               Overview
4.4 Air Quality                                                                31

4.5 Biodiversity                                                               32

4.6 Recycling and Waste                                                        32

4.7 Energy                                                                     34

                                                                                            Climate Change Action
Section 5 – Community Actions                                                  36

                                                                                                Plan 2011-2020

                                                                                                                         Section 3
5.1 Climate Change                                                             37

5.2 Water                                                                      38

5.3 Land                                                                       38

5.4 Biodiversity                                                               38

5.5 Recycling and Waste                                                        39

5.6 Energy                                                                     40

                                                                                                 Corporate Actions
                                                                                                                     Section 4
Section 6 – Abbreviations, Glossary and References                             42
6.1 Abbreviations                                                              43

6.2 Glossary                                                                   44

6.3 References                                                                 46
                                                                                                 Community Actions
                                                                                                                     Section 5
                                                                                            Abbreviations, Glossary
                                                                                               and References

                                                                                                                         Section 6

                                  City of Darwin Climate Change Action Plan 2011-2020   3
Foreword
          Darwin is a thriving tropical city with a population      it can control. The challenge for the Council is to
          of 77,290 and bordered on three sides by a harbour        balance the sometimes competing interests and
          three times the size of Sydney Harbour. The City          needs of the community with the available resources
          encompasses a total land area of about 112 square         and capacity to deliver on those interest and needs.
          kilometres, including many types of parkland
                                                                    Climate change is occurring and is relevant to a wide
          and reserves, and several beaches. The original
                                                                    range of local government functions, thus become a
          inhabitants of the Darwin area were the Larrakia
                                                                    high profile issue for Darwin City Council.
          (Larrakeyah) Aboriginal people. Darwin City Council
          is one of four Darwin coastal managers, the others        Council is taking leadership by addressing mitigation
          being the Australian Government (Department of            and adaptation focusing on infrastructure and
          Defence), the Northern Territory Government               general business, by embarking on organisational
          and the Larrakia Nation.                                  and community behaviour change, by working
                                                                    in partnership with the Australian and Northern
          As the Northern Territory’s capital city, Darwin
                                                                    Territory Governments, environmental organisations,
          is a vibrant destination renowned for its tropical
                                                                    scientific and tertiary institutions, indigenous
          climate as well as being Australia’s gateway
                                                                    and community interests, by sharing knowledge
          to world class nature and cultural experiences.
                                                                    and advice, and embarking on joint projects with
          A city of shady parks and gardens, with a range
                                                                    partners including the Larrakia people.
          of restaurants, new apartments and tourist venues
          including the Wharf Precinct, Cullen Bay and the          This Action Plan provides a framework for
          Darwin Convention Centre at the waterfront, Darwin        Darwin City Council to implement a suite of actions
          is an increasingly popular place to live and visit.       over the next 10 years to reduce greenhouse gas
          East Point Reserve, just a few minutes drive from         emissions and tackle the issue of climate change for
          the city centre, is a favourite spot for sunset picnics   Council’s operations and to support community goals.
          and home to a colony of Agile wallabies. Darwin
          has excellent walking and bicycle paths along the
          foreshore and through the parks and suburbs.
          Although Council is limited in its powers and ability
          to control town planning or urban development,
          the Council actively advocates on behalf of the           GRAEME SAWYER
          community and focuses its attention on matters            LORD MAYOR

4   Climate Change Action Plan 2011-2020 City of Darwin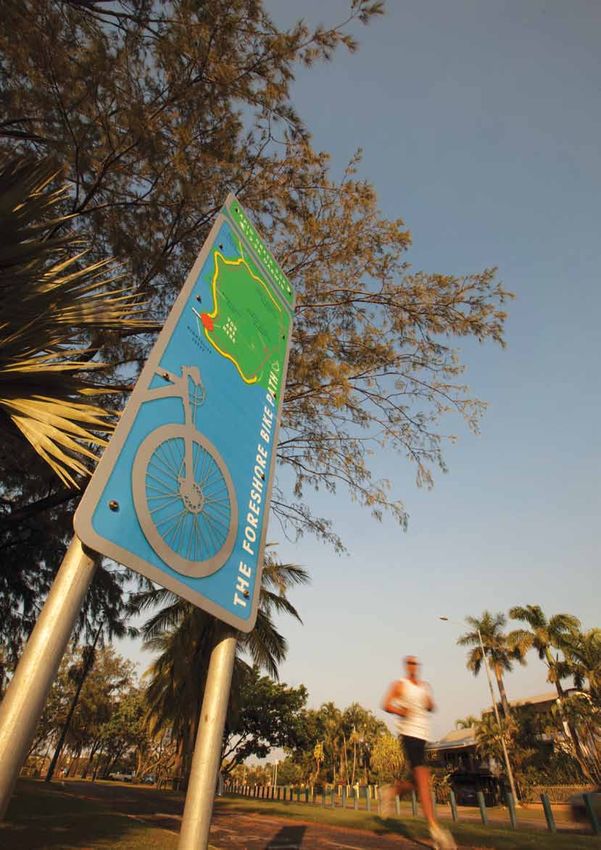
Introduction
Executive Summary
Darwin City Council (Council) through its Evolving             meeting the challenge by taking into consideration
Darwin Strategic Directions: Towards 2020 and                  a range of infrastructure and cost-effective energy
Beyond, provides a vision of enhancing Darwin’s                savings initiatives to reduce our contribution to

                                                                                                                             Policy Structures
                                                                                                                             Climate Change
unique lifestyle and tropical feel with a strong focus         global greenhouse gas emissions.

                                                                                                                                                          Section 1
on the environment and sustainability, for residents
                                                               Council is well placed to do this and by taking
and visitors alike.
                                                               positive steps to reduce its carbon foot print, Council
Increasingly, jurisdictions are seeing human induced           is in a position to lead and influence the community
climate change as one of the most significant and              to reduce their greenhouse gas emissions through
controversial global environmental issues facing               the way it conducts its own activities.
local, regional and global communities.
                                                               By taking leadership and responsibility towards
Climate change is relevant to a wide range of local            reducing its local contribution to a global problem
government functions, and has become a high                    Council will be on the path to creating an

                                                                                                                             Climate Change
profile issue for Council.                                     inspirational workplace and City.

                                                                                                                                                          Section 2
                                                                                                                                Overview
Council acknowledges and respects the importance               Council recognises that delaying action to address
of addressing climate change and environmental                 climate change will increase the environmental and
priorities in a way that is not only beneficial for            societal consequences as well as the costs. Strong
the organisation and community but also for                    leadership at all levels is needed.
the land and water managed by adjoining Local
                                                               Council is committed to meeting the challenge.
Governments, the Australian and Northern Territory
                                                               We owe this to future generations.
Governments, and the Larrakia people. Council also
accepts responsibility to provide a strong response            At the Council Meeting on 28 September 2010 the

                                                                                                                             Climate Change Action
locally in order that Australia can meet national and          Climate Change Policy was adopted. The Climate

                                                                                                                                 Plan 2011-2020
                                                               Change Action Plan 2011-2020 underpins this policy.

                                                                                                                                                          Section 3
international environmental obligations.
Infrastructure represents a major investment for
Council and so it is important to ensure that it is            i. Policy Summary
designed and constructed to accommodate the                    Council is committed to finding practical and
predicted effects of climate change. The additional            effective ways to address climate change concerns
expense of making new infrastructure and buildings             within the municipality.
more resilient to climate change is costly, but to not
                                                               This will include managing climate change risks
do so has the potential to be even more so. Coastal
                                                               to natural and human systems and the built
storm surges and subsequent flooding to urban

                                                                                                                                  Corporate Actions
                                                               environment within the municipality using a
facilities, along with the degradation and failure

                                                                                                                                                      Section 4
                                                               combination of sustainable adaptation and
of materials requires recognition of likely climate
                                                               mitigations measures.
change, its impacts and the appropriate adaptation
measures which need to occur now.                              Council will ensure that its objectives of the climate
                                                               change policy are incorporated into strategic
Adaptation to climate change is a relatively new
                                                               planning and decision making processes and
policy challenge. It is important of Council to
                                                               operations of Council.
encourage sustainable development for the future
growth and strategic planning of Darwin. Council is
                                                                                                                                  Community Actions
                                                                                                                                                      Section 5
                                                                                                                             Abbreviations, Glossary
                                                                                                                                and References

                                                                                                                                                          Section 6

                                                      City of Darwin Climate Change Action Plan 2011-2020                5
Preparing Australian communities for the unavoidable impacts
    of climate change is a national priority of local government.

6   Climate Change Action Plan 2011-2020 City of Darwin
Introduction
ii. Policy Objectives                                          iv. Policy Statement
• To provide effective and strong leadership                   Council recognises that meeting the challenges of
  to the region to respond to climate change                   climate change requires a partnership between
  and build a sustainable region.                              government, business and the community as a whole.
• To develop and implement strategies designed                 Council is committed to delivering a range of

                                                                                                                            Policy Structures
                                                                                                                            Climate Change
  to manage climate change risks to natural and                mitigation and adaptation measures to meet

                                                                                                                                                         Section 1
  human systems and the built environment                      the adverse impacts of climate change for
  within the municipality using a combination of               the organisation, for the community and for
  sustainable adaptation and mitigation measures.              environment sustainability.
• To provide Council and the public with objective
                                                               Council will provide leadership on and demonstration
  information that will assist in understanding
                                                               of actions that can be undertaken to reduce
  the problem, alternatives, opportunities
                                                               greenhouse gas emissions. Council can work to
  and/or solutions.
                                                               increase awareness and advocate action to abate
• To review climate change risks and impacts                   emissions and adapt to the impacts of global warming.
  (for example, sea level rise, carbon footprint,

                                                                                                                            Climate Change
  temperature rises, a higher frequency of                     Council acknowledges and respects the importance

                                                                                                                                                         Section 2
                                                                                                                               Overview
  severe cyclones) as further research information             of addressing climate change and environmental
  becomes available.                                           priorities within its sphere of influence in a way that is
                                                               beneficial to the organisation, the Darwin community,
• To comply with applicable legal requirements
                                                               the biodiversity of the region and Australia.
  and implement any relevant Australian and
  Northern Territory Government policies, guidelines           Council will incorporate climate change priorities
  and/or directives.                                           in decisions about land use, infrastructure design,
                                                               power and fuel usage, location and management of
                                                               parks and reserves and water management.

                                                                                                                            Climate Change Action
iii. Background

                                                                                                                                Plan 2011-2020
Preparing Australian communities for the                       Council recognises that this approach to climate

                                                                                                                                                         Section 3
unavoidable impacts of climate change is                       change should be flexible and able to adapt to the
a national priority of local government.                       changing political and legislative environment.

Climate variability occurs naturallyi however the
                                                               v. Implementation and delegation
overwhelming weight of contemporary science
indicates that anthropogenic (human induced)                   The Chief Executive Officer will lead a whole of
climate change is accelerating at an increasing rate           Council approach to climate change which will
with the first decade of 2000-2010 being the hottest           include management participation from all areas
on record.                                                     of Council.

                                                                                                                                 Corporate Actions
Increased climate variations are expected to result

                                                                                                                                                     Section 4
in adverse economic, social and environmental                  vi. Evaluation and review
outcomes unless otherwise addressed.                           On-going evaluation of the progress of mitigation
Local government activities likely to be directly              and adaptation strategic outcomes will be
impacted by climate change such as sea level and               undertaken by the Climate Change and Environment
water table rises and storm surges include planning            section of Council.
for future developments and road infrastructure.               The Climate Change and Environment Advisory
There will also be impacts on natural resources,               Committee will continue to provide advice to Council
health and building regulations and community                  on climate change risks and impacts (for example,
                                                                                                                                 Community Actions

infrastructure and services.                                   sea level rise, carbon footprint, temperature rises,
                                                                                                                                                     Section 5

Council has been active on the issue of climate                a higher frequency of severe cyclones) as further
change since 2004 when it joined the Cities for                research information becomes available.
Climate Protection (CCP™) Program.
Council’s Climate Change Policy provides the
opportunity to promote Council’s roles and
responsibilities for adaptation to the impacts of
climate change and identify priorities for mitigation
through collaborative action across the three tiers of
                                                                                                                            Abbreviations, Glossary

governments and the whole of community.
                                                                                                                               and References

                                                                                                                                                         Section 6

                                                      City of Darwin Climate Change Action Plan 2011-2020               7
Section 1 – Climate Change Policy Structures
    Actions to address climate change are being undertaken at global,
    international, regional and local levels. With the purpose of proving
    a prospective on the role that Darwin City Council (Council) can play in
    contributing to climate change management a snapshot of the major
    evolving structures and policies for climate change is considered useful.

    After reviewing a wealth of information, the following international, national
    and Northern Territory significant events have been taken into account in the
    development of Council’s Climate Change Action Plan 2011-2020.

8   Climate Change Action Plan 2011-2020 City of Darwin
Introduction
1.1 G
lobal Architecture – The countries, called Conference of Parties (COPs), who
have ratified the Treaties. For example the meeting
Convention and the Kyoto Protocol
of countries in Copenhagen in December 2009 was
The driver for management of climate change COP 15, the 15th meeting of countries who have
at the global level is the United Nations Framework ratified the UNFCCC.
Convention on Climate Change (UNFCCC), an
Outcomes from recent COPs have focussed on
Policy Structures
Climate Change
international treaty formulated in 1992. The
Section 1
progressing high road climate policy. Outcome
prime goal of UNFCCC is to manage atmospheric
of COP 13 (held in Bali, Indonesia in December
greenhouse gas concentrations at a level that will
2007) saw agreement on a comprehensive
‘prevent dangerous human interference with the
process to implement a shared vision for long term
climate system’. Currently 195 countries (referred to
cooperation, up to and after 2012, by developed
as parties) have ratified UNFCCC.
and developing countries to reach an agreed and
In 1997 the Kyoto Protocol was added to the UNFCCC. adopted (binding) decision at COP 15 scheduled
The Protocol embeds the principle that countries for Copenhagen, Denmark, in December 2009.
have ‘common but differentiated responsibilities’. The shared vision was to be constructed consistent
The Protocol recognises developed countries, with principle of ‘common but differentiated
Climate Change
compared to developing countries, have traditionally
Section 2
responsibilities and respective capabilities, and
Overview
been the major source of anthropogenic emissions taking into account social and economic conditions’.
of greenhouse gas (GHG) emissions to atmosphere.
The outcome of COP 15 was the non-binding
The major feature of the Kyoto Protocol is that Copenhagen Accord. The Accord ‘agreed that deep
it sets legally binding targets for 37 industrialised cuts in global emissions are required according to
countries and the European community for reducing science and as documented in Intergovernmental
GHG emissions. These amount to an average of Panel on Climate Change (IPCC) 4th Assessment
5% against 1990 levels over the five-year period Report with a view to reducing global emissions so
Climate Change Action
2008-2012. Australia’s target under the Kyoto as to hold the increase in global temperature below
Plan 2011-2020
Protocol is to limit GHG emissions to 8% above 2 degrees C’. Consistent with the Accord, developed
Section 3
the 1990 level. countries (referred to as Annex 1 countries)
committed to implementing quantified economy
A key component of the Kyoto Protocol is
wide emission targets for 2020.
that countries are able to use ‘market based
mechanisms’ covering mitigation actions in The outcome of the most recent COP (COP 16 held in
developed and developing countries to meet their Cancun, Mexico, December 2010) was to affirm the
emission reduction commitments. Currently intent of the Copenhagen Accord, and agreement to
193 countries, including Australia but with notable establish a large (US $100B by 2020) ‘Green Carbon
exception of USA, have ratified the Kyoto Protocol. Fund’, as well as the new Climate Technology Centre
Corporate Actions
and Network.
The major distinction between the Protocol
Section 4
and the Convention is that while the Convention Processes and programs to implement global
encouraged industrialised countries to stabilize GHG structures to manage GHG emissions are a works
emissions, the Protocol commits them to do so. in progress. COP 17 is scheduled for Durban, South
Africa in December 2011 (for more information visit
The work of developing, implementing and
http://unfccc.int/2860.php).
monitoring the progress on the UNFCCC and the
Kyoto Protocol is directed by annual meetings of
Community Actions
Section 5
Abbreviations, Glossary
and References
Section 6
City of Darwin Climate Change Action Plan 2011-2020 91.2 A
ustralian Government Response technology, land and the energy sector, were
developed and released in the lead up of the
to Climate Change
2010 update of The Garnaut Climate Change Review.
Australia’s climate change policy is evolving, The updated Garnaut Climate Change Review was
consistent with processes detailed in UNFCCC and then presented to the Australian Government on
the Kyoto Protocol supplemented further by other 31 May 2011 (for more information visit
initiatives such as the Carbon Farming Initiative. http://www.garnautreview.org.au).
Australia’s evolving policy for climate change will
The Australian Government released Australia’s
in all likelihood settle on a mixture of regulatory
Emissions Projections, 2010 in February 2011 and
requirements and incentive programs to offset
has reiterated its intention to introduce a carbon
carbon emissions. For the regulatory component
price in Australia to reduce emission and meet the
current Australian Government policy calls for
2020 target it made to the Kyoto Protocol target of
the interim carbon price on GHG emissions from
limiting emissions.
nominated industries transferring into a cap and
trade system to manage mandated GHG emission Australia releases official projections of its
target. The Carbon Pollution Reduction Scheme GHG emissions annually. The previous projections
developed by the Australian Government in were released as part of Australia’s Fifth
2009 continues to provide frameworks for National Communication on Climate Change,
GHG management. a report under the United Nations Framework
Convention on Climate Change (referred to as
The Australian Government commissioned
the 2009 projections).
Professor Ross Garnaut AO to examine the impacts
of climate change on the Australian economy, This document is considered to be the Australian
resulting in the The Garnaut Climate Change Review Government’s most contemporary key document
which recommended medium to long-term policies in relation to Australia’s response to the Kyoto
and frameworks to improve the prospects for protocol target and for the Australian economy
sustainable prosperity. and communities.
A series of papers addressing developments across
a range of subjects including climate change science
and impacts, emissions trends, carbon pricing,
10 Climate Change Action Plan 2011-2020 City of DarwinIntroduction
1.3 N
orthern Territory Government • Local service delivery needs to be improved
in partnership with governments and the
Response to Climate Change
private sector.
Northern Territory Climate Action Policy (2009)
1.4.2 L ocal Government Association of the
has an aspirational goal of 60% carbon emissions
Northern Territory (LGANT)
reduction by 2050, compared to 2007 emissions.
Policy Structures
Climate Change
This document has nine key elements which provide LGANT has been working with councils to undertake
Section 1
the focus for collaborative action including: climate change risk assessments for their
municipality or shire with the following three
1. Government leadership on climate change.
project aims:
2. A focus on green energy.
1. Undertake a risk assessment at the
3. Land management.
community level.
4. Building green cities and towns.
2. Initiate a community awareness program.
5. Rethinking waste.
3. Develop an action plan for climate
6. Expanding green business and industry. change adaptation.
Climate Change
7. Developing a green workforce.
1.4.3 Darwin City Council
Section 2
Overview
8. Promoting green communities.
Evolving Darwin – A dynamic, different and diverse
9. Living with change.
city provides strategic direction for Council to
Further, under the Northern Territory Government 2020 and beyond. It outlines a series of goals and
headline actions, coastal wetlands at risk from associated outcomes including:
rising sea levels, are noted to be given specific
2.1.4 Provide a clean and liveable municipality.
interventions aimed to reduce salt water intrusion,
protect fishing and biodiversity. 2.2.3 Manage and improve the pathway and
cycleway network and encourage safe
Climate Change Action
Developed by the Northern Territory Government, cycling and walking.
Plan 2011-2020
Territory 2030 - Strategic Plan 2009 is a road
Section 3
4.1.1 Develop and implement a climate
map for the future setting priorities to guide
change policy and strategies for reducing
Government’s efforts over the next two decades.
of carbon emissions.
It contains 128 targets linked to six key priorities:
education, society, economic sustainability, health 4.2.1 Develop and implement a water
and wellbeing, the environment, and knowledge, efficiency plan.
creativity and innovation. 4.3.1 Lobby for, provide and develop contemporary
waste management practices.
1.4 L ocal Government Response 4.4.2 Enhance water quality, ecological systems
Corporate Actions
to Climate Change and biodiversity in Council.
Section 4
1.4.1 Australian Local Government Association The Climate Change Action Plan 2011-2020 follows
(ALGA) on from the Environmental Management Plan
2005-06 which addressed a range of environmental
The ALGA adopted the Climate Change ALGA Position priorities for Council and Community.
Paper and Discussion Document which discusses
local government’s place in addressing climate The Climate Change Action Plan 2011-2020 is to
change as well as identifying areas for action and inform Council activities for the next ten years
next steps. ALGA identifies the following: regarding corporate and community activities.
• At the local level, local government will need to Council has a Climate Change and Environment
Community Actions
prepare for climate change and at the very least Advisory Committee which consists of external
Section 5
develop the capacity to protect its own assets and experts who provide input and advice to Council
adapt to localised conditions. on a ‘needs be’ basis.
• Local government has an important role in The development of a new $50,000 Climate
providing leadership and education to assist Change and Environment Community Grant
citizens and businesses to understand and accept Program for 2011 has further strengthened
their responsibilities to address climate change. Council’s commitment to reducing the community’s
environmental footprint.
Abbreviations, Glossary
and References
Section 6
City of Darwin Climate Change Action Plan 2011-2020 11Section 2 – Climate Change Overview
‘Climate Change’ is the changing of long-term weather patterns.
Whilst Darwin will still have alternating Wet and Dry seasons, it is possible
that the Wet will have more rain, and the Dry will become hotter.
The climate has often changed in the past. In fact, we are living today
in a period of time when the Earth’s climate alternates between cool
and warm, when sheets of ice kilometres-high push across the continents
over thousands of years, and then recede.
12 Climate Change Action Plan 2011-2020 City of DarwinIntroduction
2.1 What is Climate Change?
The Intergovernmental Panel on Climate Change Figure 2.1 shows what the world may have looked
(IPCC) defines the phenomena of climate change like at the peak of the last glacial maximum, when
as ‘a change of climate which is attributed directly the ice cap surrounding the North Pole had expanded
or indirectly to human activity that alters the to cover much of Europe and North America.
Policy Structures
Climate Change
composition of the global atmosphere and which
There are many theories about the causes of
Section 1
is in addition to natural climate variability observed
historical climate change. When considering
over comparable time periods’.ii
current climate change, the most relevant
‘Climate’ is a statistical description of weather contributor is that of GHG. The theory is that in
conditions and their variations, including both the past, a slight increase in the average global
averages and extremes in a given area. Darwin temperature from any particular trigger lead to a
has a tropical climate with pronounced Wet and slight increase in the emission of GHG, which lead
Dry seasons, with most rain falling between to a further increase in temperature and a further
December and March, and warm rainless days increase in emissions. What is unique about current
from May to September. climate change is that human civilisation is acting
Climate Change
as a ‘climate change trigger’ producing vast amounts
Section 2
Overview
‘Climate Change’ is the changing of long-term
of GHG in only a few centuries.
weather patterns. Whilst Darwin will still have
alternating Wet and Dry seasons, it is possible 2.1.1 Mitigation
that the Wet will have more rain, and the Dry will
Climate change mitigation focuses on reducing the
become hotter.
amount of GHG we emit into the atmosphere. This
The climate has often changed in the past. In fact, action will help to avoid future impacts of climate
we are living today in a period of time when the change beyond what is already projected.
Earth’s climate alternates between cool and warm,
2.1.2 Adaptation
Climate Change Action
when sheets of ice kilometres-high push across the
Plan 2011-2020
continents over thousands of years, and then recede. Climate change adaptation addresses the changes
Section 3
already projected to occur. Adaptation increases our
Ice sheets last covered the continents (known as a
ability to cope with a changing climate including
‘glacial period’) about fifteen thousand years ago,
variability and extreme weather events.
and until recently were expected to do so again.
Parts of the ice sheets still remain today,
as seen in Antarctica and Greenland.
Figure 2.1: The world at the peak of the last glacial maximum
Corporate Actions
Section 4
Community Actions
Section 5
Source: Intergovernmental Panel on Climate Change http://www.ipcc.ch/.
Abbreviations, Glossary
and References
Section 6
City of Darwin Climate Change Action Plan 2011-2020 132.2 What are Greenhouse Gases?
There are several gases which create a greenhouse Earth’s climate. Since industrialisation, humans have
effect. The most important include water vapour, burned enough fossil fuels to increase the level of
carbon dioxide, methane and ozone. The major CO2-e to 391 parts per million of carbon dioxide in
anthropogenic (human induced) GHG is carbon the atmosphere, a rise above natural levels that the
dioxide (CO2), mostly produced through the burning world has not seen for several million years.
of fossil fuels. However, ‘carbon emissions’ is the
2.2.1 What do Greenhouse Gases actually do?
colloquial term used to describe all anthropogenic
GHG, not just CO2. Each GHG has a different global warming, or heat
trapping, potential. The global warming potential of
Some gases cause a greater warming effect than
each of the major GHG, as well as the key source of
others, so for simplicity and ease of comparison, GHG
the gases, is shown in Table 2.1.
are converted into an equivalent of carbon dioxide
known as CO2-e. For example, methane (CH4) has Sunlight shines onto the Earth’s surface, where
a warming effect 25 times that of carbon dioxide it is absorbed and then radiates back into the
equivalent, so atmosphere as heat. In the atmosphere GHG trap
some of this heat and the rest escapes into space, a
1 tonne of CH4 = 25 tonnes of CO2-e1
process commonly known as the ‘Greenhouse Effect’
Over the past 750,000 years, atmospheric CO2-e (see Figure 2.2). Scientists have calculated that if
levels have remained between 180 and 280 parts it were not for these gases, Earth might be 40°C
per million.iii The difference of 100 parts per million cooler.iv However, increasing the amount of GHG
of CO2-e correlates with drastic changes to the leads to increased trapping of heat, which is known
as ‘Global Warming’.
Table 2.1: Key Sources of Greenhouse Gas Emissions
Greenhouse Gas Source Greenhouse
Warming
Potential*
Carbon dioxide Burning of fossil fuels
Land clearing 1.0
Cement manufacture
Methane Waste decomposition without air (e.g. when waste is
buried in landfill)
Coal-bed methane from coal mining
25
Leakage of natural gas
Grass digestion by grazing animals
Burning of biomass fuels
Nitrous oxide Soil, nitrogen fertiliser decomposition
298
Burning of petroleum products
Chlorofluorocarbons (CFCs) Leakage from refrigeration and air-conditioning systems
4750 - 14400
Aluminium smelting
*100-Year Greenhouse warming potential (GWP) (per kilogram of gas) in terms of kg CO2-e.
Source: adapted from Intergovernmental Panel on Climate Change (2007) Working Group I Contribution to the Fourth Assessment
Report, Climate change 2007—the physical science basis Chapter 2 Changes in atmospheric constituents and in radiative forcing.
Comparing gases in this way refers to the ‘Global warming potential’ of each gas. This depends on both the warming effect of the gas, and
1
its longevity in the atmosphere. The standard potential is set upon the warming potential over 100 years, with CO2 having the value 1.
14 Climate Change Action Plan 2011-2020 City of DarwinIntroduction
2.2.2 How does Global Warming change the Climate?
Current theory suggests the level of GHG in the The global climate is very dependant upon
atmosphere is actually a delicate balance, so temperature. Small changes in temperature
that the Earth could get very cold when GHG are can change ocean currents, wind patterns, and the
removed and very warm when gases are added. To size of the ice caps. This can fundamentally change
Policy Structures
understand just how delicate this balance is, current the normal weather to patterns never seen before
Climate Change
Section 1
climate change is being caused by GHG trapping an by humans.
increase of less than 0.5% of the Sun’s energy.2 v
Figure 2.2: A simplified diagram of the Greenhouse Effect
Climate Change
Section 2
Overview
Climate Change Action
Plan 2011-2020
Section 3
Corporate Actions
Section 4
Source: Australian Greenhouse Office http://www.climatechange.gov.au/.
Community Actions
Section 5
Abbreviations, Glossary
2
adiation from the Sun is 343 watts per square metre (W/m2). The increase in radioactive forcing from anthropogenic sources is about
R
1.6 W/m2, or 0.46%.
and References
Section 6
City of Darwin Climate Change Action Plan 2011-2020 152.3 Australia’s Historical Climate Changes
Australia’s climate has changed a great deal over the and the sea level rose until it reached the present
last twenty two thousand years, before stabilising level where it has remained steady for about five
about five thousand years ago. thousand years.
The temperature was about 6°C cooler twenty two All of these changes occurred because of a
thousand years ago, so cold that much of the Earth’s temperature rise of 6°C. It is very likely there will be
water was frozen into the massive ice sheets that significant warming through the 21st century and
covered much of Europe and North America. This beyond. Current science models estimate a further
meant that the sea level was about 135 metres 2°C to 7°C rise by 2100.
lower than today.
Reduction of GHG emissions could significantly
Australia and New Guinea were joined by a land reduce long-term warming. In Australia, the average
bridge, and the coastline of what became Australia surface temperature has increased by about 0.7°C
was several hundred kilometres closer to Timor. As since 1960 with some areas having warmed faster
can be seen in Figure 2.3, the Gulf of Carpentaria and some showing relatively little warming. The
was an inland lake. warming has caused an Australia-wide average
increase in the frequency of extremely hot days and
As the temperature began to rise, the vast polar
a decrease in the frequency of cold days.
ice caps and sheets around the globe melted,
Figure 2.3: Australia and New Guinea joined by a land bridge
22 thousand years ago 15 thousand years ago
10 thousand years ago 5 thousand years ago – present
Source: Coller, M. The Sahul Time Project, Monash University http://sahultime.monash.edu.au/.
2.4 Australia’s Emissions
Australia produced about 549 million tonnes of The Northern Territory produces 17 million tonnes of
measured GHG in 2009vi, about 25 tonnes per person. GHG per yearvii, about 79 tonnes per person. Whilst
This is approximately 2% of total global emissions, or this is approximately 3% of Australia’s total GHG
six times the global average per person.3 emissionsviii, it equates to three times the Australian
average per person, and nineteen times the global
average per person as Figure 2.4 demonstrates.
3
Global emissions are approximately 29,000 Mt of CO2-e per year. The world’s population is estimated to be about 6.8 billion people.
16 Climate Change Action Plan 2011-2020 City of DarwinIntroduction
Figure 2.4: Tonnes of CO2-e per capita by State and Territory
90
80
70
Policy Structures
Climate Change
60
Section 1
50
tCO2-e
40
30
20
10
0
Climate Change
NSW QLD Vic WA SA NT Tas ACT
Section 2
Overview
National average tCO2-e per capita
Source: adapted from Australian Government (2011) Australia’s National Greenhouse Gas Accounts - State and Territory
Greenhouse Gas Inventories 2009, and Australian Bureau of Statistics Australian Demographic statistics.
2.5 Northern Territory’s Emissions
In December 2009 the Northern Territory Government • Presence of some major emissions-intensive
Climate Change Action
(NTG) released its Northern Territory Climate Change industries in the Territory, particularly the
Plan 2011-2020
Policy. Figure 2.5 demonstrates the breakdown of mining sector.
Section 3
GHG emissions in the Northern Territory. • High rate of savanna burning, which accounts
The Northern Territory’s emissions profile is unique for over a third, and in some years up to a half,
because of the: of the Territory’s total emissions. Without
savanna burning, our emissions profile is similar
• Vast geographical area of the Northern Territory to that of other parts of Australia, with stationary
and its low population density. energy (i.e. electricity generation) being the
• Territory’s climate, which gives rise to a high use largest source.
of air-conditioning.
Corporate Actions
Section 4
Figure 2.5: Northern Territory’s greenhouse gas emissions
1%
Stationary energy 25%
Agriculture (excluding
25% savanna burning) 18%
Land use, land use
33%
change and forestry 13%
Community Actions
Transport 9%
Section 5
Waste 1%
18%
0% 9% Industrial emissions 0%
1% Savanna burning 33%
13%
Fugitive emissions 1%
Abbreviations, Glossary
Source: Department of Chief Minister (2009) Northern Territory Climate Change Policy 2009, Darwin.
and References
Section 6
City of Darwin Climate Change Action Plan 2011-2020 172.6 Darwin City Council’s Emissions
Council’s emissions are produced in three key sectors: emissions, of which just under half is from street
stationary energy (electricity), transport (petrol/ lighting. Figure 2.7 provides a further breakdown
diesel) and waste (landfill). Regular Greenhouse Gas of electricity related emissions. Fuels such as petrol
Inventories are undertaken externally for Council. and diesel account for about 10% of Council’s
Figure 2.6 demonstrates the breakdown of Council’s emissions, the majority from diesel. 35% of Council’s
emissions. Electricity creates 55% of Council’s emissions come from waste, such as office paper
and garden material.
Figure 2.6 Council’s Emissions in 2009 4
Electricity 55%
Transport 10%
Waste 35%
35%
55%
10%
Source: adapted from RG Consulting (2010) Greenhouse Gas Emission Inventory 2010 Darwin City Council Report no.
D-001-10, Darwin.
Figure 2.7 Council’s Electricity emissions breakdown 2009
Park lighting, barbeques
8% and miscellaneous 8%
Street lighting 47%
Traffic lights 3%
42%
Buildings and facilities 42%
47%
3%
Source: adapted from RG Consulting (2010) Greenhouse Gas Emission Inventory 2010 Darwin City Council Report no.
D-001-10, Darwin.
4
ote: as landfill emissions have historically been reported as emissions generated by the community, the waste figure has been
N
extrapolated using 2001 percentages.
18 Climate Change Action Plan 2011-2020 City of DarwinIntroduction
Energy audits undertaken by Council for the 2009 of organic waste is captured from the site via a
period show that Council’s corporate emissions network of below ground wells and interconnecting
were in the vicinity of 10,881 tonnes of CO2-e for pipe work. The gas is converted to electricity which
the period. This is a 5% increase when compared is exported into the electricity network, and on sold
to 10,358 CO2-e calculated for the 2007 period. This by Power and Water Corporation.
increase can be attributed to new infrastructure
This facility has generated over 52,000 megawatt
Policy Structures
Climate Change
(street lighting, parks and community centre)
Section 1
hours of renewable energy since it was
associated with the new suburb of Lyons coming on
commissioned in August 2005. The combustion of
line and an increase in service to accommodate for
landfill gas to generate this base-load electricity,
population growth.
which is typically 50% methane, equates to the
Data provided to Council through its involvement with abatement of over 40,000 tonnes of carbon dioxide
the CCPTM program calculated that, by implementing equivalent greenhouse gas emissions each year.
reductions identified in the Greenhouse Action Plan The facility produces enough electricity to power
2001-2010 Council’s corporate emissions would approximately 1,800 homes each year. ix
be in the vicinity of about 11,536 tonnes of CO2-e
per annum by 2010. This figure relates to Council’s 2.7 Rainfall and Sea Level Impacts
Climate Change
Section 2
operations only. 2.7.1 Rainfall
Overview
The first renewable energy project in tropical Rainfall for Australia as a whole has been relatively
Australia, the Darwin Renewable Energy Facility, stable (see Figure 2.8); however the geographical
located at the Shoal Bay Waste Disposal Site, is distribution has changed significantly in the last 50
a partnership between Darwin City Council and years. x xi Annual rainfall for Darwin has steadily
LMS Generation Pty Ltd. The facility generates increased by 50-60 millimetres per decade.
approximately 9,000 megawatt hours of base-load Predictions for the next several decades are unclear,
renewable electricity each year using gas collected however percentiles are often use to provide
Climate Change Action
from the site. Gas generated from the breakdown estimates of future activity.
Plan 2011-2020
Section 3
Figure 2.8: Trend in annual rainfall 1960-2010
Corporate Actions
Section 4
Community Actions
Section 5
Source: Bureau of Meteorology http://www.bom.gov.au/.
Abbreviations, Glossary
and References
Section 6
City of Darwin Climate Change Action Plan 2011-2020 19The 50th percentile is often used as the ‘best 2.7.2 Sea Level
estimate’ of the future, which suggests little change
The Fourth Assessment Report of the IPCC – 2007
in annual total rainfall. The 10th and 90th percentiles
states that sea levels have remained fairly constant
are ‘outlier’ scenarios. The greater the difference
for the last five thousand years, yet began to rise over
between the 10th and 90th percentiles, the higher
the last century at an increasing rate as a result of
the overall uncertainty in the projections. Figure 2.9
climate change. The rise is caused predominantly by
demonstrates rainfall percentile climate prediction
thermal expansion (water expands as it warms), and
where the ‘High Emissions’ scenario is considered
the loss of land-based ice due to increased melting. xiii
‘business as usual’, and aligns well with current GHG
emissions globally. xii From a global perspective, Figure 2.10 demonstrates
Figure 2.9: Rainfall Climate prediction for 2030 actual and estimated sea level rise from 1800
to 2100. The red section shows the recorded sea
level, which became more accurate within the 20th
century. The green line represents the introduction
of accurate satellite mapping. The blue section
represents the upper and lower limits for the sea
level which were predicted in the 1990s. xiv The sea
has risen about 20 centimetres over the last century,
and in 2010, is currently tracking above the highest
predictions made twenty years ago.
The projected sea level for Darwin is an 80 centimetre
increase between 1990 and 2100, at the current rise
of 7.2 millimetres per year. xv This projection does not
include contributions from ice sheet melting, which
could substantially increase the upper limit of sea
level rise to several metres. xvi
Source: Climate Change in Australia
http://www.climatechangeinaustralia.gov.au/ntrain1.php.
Figure 2.10: Sea Level change projection
Source: Intergovernmental Panel on Climate Change (2010) Fourth Assessment Report http://www.ipcc.ch/.
20 Climate Change Action Plan 2011-2020 City of DarwinIntroduction
2.8 Severe Weather Events Figure 2.11: Tropical Cyclone Monica 2006
2.8.1 Cyclones
Tropical storms are not predicted to be more
frequent, but instead potentially more severe
(Category 3–5), with larger peak wind speeds
Policy Structures
Climate Change
and heavier rain. Currently Darwin’s building
Section 1
planning and emergency systems are prepared
to deal with a Category 4 cyclone. (Cyclone 4 is
quoted for Building/Planning and Category 5 for
Emergency systems).
Future Australian cyclones are likely to continue
to form in the Top End and projections show the
potential is for them to move further south, thus
continuing the trend over the last half-century.
Source: Bureau of Meteorology http://www.bom.gov.au/.
Climate Change
Section 2
Overview
2.8.2 Storm Surges
The combination of more powerful cyclones with of deaths associated with cyclones are as a result of
rising oceans poses a potential risk of severe storm storm surges. xvii
surges, as much of Darwin is located only a few
The Northern Territory Government released an
metres above sea level. As Figure 2.12 demonstrates,
updated version of its Darwin Area Storm Surge
Climate Change Action
a storm surge occurs when the winds of a cyclone
Inundation for 2100 in August 2011 which identifies
Plan 2011-2020
causes water to pile up against the coast. Unusually
primary (100 year average recurrence interval) and
Section 3
large waves then develop, which sweep inshore like
secondary (1,000 year average recurrence interval)
a giant bulldozer. Storm surges are most dangerous
storm surge. xviii
when occurring at high tide. Worldwide, the majority
Figure 2.12: Storm Surge
Source: Hunter, J (2010)
Presentation to Darwin City Council.
Corporate Actions
Section 4
Community Actions
Section 5
Abbreviations, Glossary
and References
Section 6
City of Darwin Climate Change Action Plan 2011-2020 212.9 Temperature Increases
Since 1960 the average temperature in Darwin has Since 1910, the average minimum temperature
increased by about 0.5-0.7°C (see Figure 2.13). 2000 recorded at Darwin Airport has increased by
to 2010 was Australia’s warmest decade on record. approximately 2.5°C. xix xx
Figure 2.13: Trend Mean Temperature 1960-2010
Source: Bureau of Meteorology http://www.bom.gov.au/.
The average annual number of days with a Figure 2.14: Temperature Prediction for 2030
maximum temperature above 35°C has increased
from 7.9 days during the 1941-1970 period, to
13.1 days during the 1981-2010 period, and under
the best case scenarios will be 28 days by 2030,
and 49 days by 2070.
Figure 2.14 outlines temperature predictions for
2030. Temperature is predicted to increase further
by between 0.6°C to 1.5°C by 2030. There is a high
level of confidence that warming will continue
into the future, since all scenarios show warming.
The current best estimate (50th Percentile, High
Emissions) is for warming of 0.6°C to 1.0°C by 2030.
The worst-case scenario suggests possible warming
of between 1.0°C and 1.5°C by 2030. xxi Under this
scenario there could potentially be 308 days above
35°C annually by the year 2070.
Source: Climate Change in Australia
http://www.climatechangeinaustralia.gov.au/nttemp1.php.
22 Climate Change Action Plan 2011-2020 City of DarwinIntroduction
2.10 Coastal Erosion
Council commissioned a report on coastal erosion Higher sea levels will also result in more frequent
in 2008, Coastal Erosion Issues in the East Point flooding above a given level. Unless such changes are
and Nightcliff of Darwin (for more information visit taken into account, design criteria for existing coastal
http://www.darwin.nt.gov.au/aboutcouncil). structures will progressively become outdated. xxiv
Policy Structures
Climate Change
Coastal erosion is an ongoing issue under current Coastal infrastructure is of particular concern
Section 1
weather patterns, and is predicted to increase during as much of Australia’s population and infrastructure
future intense storm events. is in the coastal zone, increasing vulnerability to
climate change. Council assets are vulnerable to
Coast lines in Darwin have eroded at an average
inundation from sea level rise and extreme sea level
of 30 centimetres per year over the last three
events. Erosion and inundation threats are a critical
decades, xxii consistent with the estimation that
issue for Council, the community and the Northern
erodible coasts will recede one metre for every
Territory Government.
centimetre rise in sea level. xxiii However, as the sea
level is rising at an increasing rate, there will be an
increased rate of erosion.
Climate Change
Section 2
Overview
Figure 2.15: Erosion at Nightcliff
Climate Change Action
Plan 2011-2020
Section 3
Corporate Actions
Section 4
Source: Jones, G., Baban, S. and Pathirana, S. (2008) Coastal Erosion Issues in the East Point and Nightcliff areas in Darwin.
Southern Cross University, Lismore.
Community Actions
Section 5
Abbreviations, Glossary
and References
Section 6
City of Darwin Climate Change Action Plan 2011-2020 232.11 Biodiversity
The interaction of climate change with existing Darwin emerged as Australia’s Most Sustainable
stresses – such as land clearing, fire, invasive pest City in the Australian Conservation Foundation’s
plants and animal species, water quality – all add Sustainable Cities Index in 2010. Biodiversity is
further levels of complexity especially in the low considered a core assessment element in liveability
lying wetlands throughout the top end including the and sustainability indexes, scoring highly in the area
world heritage listed Kakadu National Park which of biodiversity, with Darwin considered to have a
is intrinsically linked with Darwin in terms of iconic pristine environment when scored alongside other
biodiversity in the region and the tourism links for capital cities. xxviii
the Top End Capital City.
However, attention to careful on-going protection
Kakadu is of very low elevation (0.2 to 1.2 metres of Darwin’s biodiversity is critical, particularly
above sea level), and as such is at severe risk of as increased demands for land clearing, new
being inundated with sea water (see Figure 2.16). developments and increased infrastructure are
72% of the freshwater habitat is vulnerable to a sought to meet the fast growing City.
30 centimetre sea level rise, which is predicted to
The climate change vulnerability of a new or existing
occur by the year 2050. This would promote the
infrastructure assets relies on a combination of
growth of salt-tolerant systems such as mudflats
responses to the retention of vegetation when
and mangroves at the expense of freshwater
addressing structural and physical changes.
wetland species. xxv
Protection measures and increased plantings are key
Climate change poses an increased risk to the
contemporary responses which international and
remaining natural ecosystems in Darwin. xxvi
national local governments are considering in order
For example, East Point Reserve will come
to enhance biodiversity.
under increasing threat from the sea level. xxvii
Figure 2.16: Vulnerable areas of Kakadu National Park to sea level rise
Source: Bayliss, B., Brennan, K., Eliot, I., Finlayson, C.M., Hall, R., House, T., Pidgeon, R., Walden, D. and Waterman, P. (1997)
Vulnerability assessment of predicted climate change and sea level rise in the Alligator Rivers Region, Northern Territory
Australia. Supervising Scientist Canberra.
24 Climate Change Action Plan 2011-2020 City of DarwinIntroduction
2.12 C limate Change and • An extension of the jellyfish season due to higher
water temperatures.
its effects on Darwin
• Increase in riparian and aquatic weeds and algal
Darwin has already been affected by climate blooms which will impact on water quality.
change as a result of more extreme weather events.
• Saltwater intrusion into fresh water aquifers
However, the available data for future climate
in some areas.
Policy Structures
Climate Change
change effects on Darwin is limited. The predicted
Section 1
effects are severe, although they remain potential • Health impacts including the potential
rather than actual risks and include: spread of disease.
• Potential for rainfall, particularly increased
extreme rainfall events.
2.13 S ummary of Climate
• A rising sea level.
Change effects
• A greater proportion of severe cyclones. Darwin faces significant challenges to its built
and natural environment if the current predictions
• Increased risk of storm surges.
are borne out. It will be difficult to adapt to
• Increased daily temperature maximums. these changes. Economic studies have clearly
Climate Change
Section 2
• Continued coastal erosion.
Overview
demonstrated that the global cost of adapting
• Continued loss of and risk to biodiversity. to climate change is many times more than the cost
of moving to a carbon-free global economy. 5
• Risk of a contaminated water supply.
Figure 2.17 demonstrates predicted surface
Other possible effects which may impact
temperatures in two scenarios – the pink as a
Darwin include:
business as usual basis versus a scenario where
• An increase in displaced people with the potential emissions are capped for 50 years (between
for people to move to Darwin as the sea level 2000-2050) at 1 trillion tonnes.
Climate Change Action
rises and inundates communities situated along
Plan 2011-2020
low lying coastal areas.
Section 3
Figure 2.17: Median projections and uncertainties of global – mean surface air temperature based on two emissions scenarios.
Corporate Actions
Section 4
Community Actions
Source: Climate Commissioner (2011) The Critical Decade – Climate science, risks and responses, Climate Commission, Canberra.
Section 5
Abbreviations, Glossary
5
S ee The Stern Review on the Economics of Climate Change - www.hm-treasury.gov.uk/sternreview_index.htm,
or The Garnaut Review - www.garnautreview.org.au
and References
Section 6
City of Darwin Climate Change Action Plan 2011-2020 25Section 3 - Climate Change Action Plan
2011-2020
Darwin City Council (Council) is committed to the challenge of reducing its
climate change footprint through the development of this Climate Change
Action Plan 2011-2020 which aims to develop and strengthen partnerships
as well as reducing greenhouse gas (GHG) emissions to meet mitigation
and adaptation actions.
26 Climate Change Action Plan 2011-2020 City of DarwinIntroduction
3.1 Implementation 3.2.2 Social
Darwin City Council is committed to the challenge • The improvement of public health through
of reducing its climate change footprint through the improved local air quality.
development of this Climate Change Action Plan • The implementation of the plan will require the
2011-2020 which aims to develop and strengthen development of partnerships with the commercial,
Policy Structures
Climate Change
partnerships as well as reducing GHG emissions to residential and industrial sectors of the community.
Section 1
meet mitigation and adaptation actions. This can act to improve community relations and
Sections 4 and 5 identify actions and performance foster a greater sense of community.
indicators. A range of infrastructural and behaviour • The community will see Council as a leader in
change initiatives will subsequently be developed addressing climate change by taking positive
and implemented in order to ensure the outcomes action to reduce its emissions.
and performance indicators are met. These ‘on 3.2.3 Environmental
ground’ initiatives will also help to provide a basis
for informing targets. • The implementation will reduce Council’s
environmental footprint, and in doing so provide
Darwin City Council developed its Climate Change
Climate Change
a means of mitigating and adapting to the
Section 2
Overview
Action Plan 2011-2020 with advice from Council’s predicted effects of climate change.
Climate Change and Environment Advisory
• It is expected implementation will also play a role
Committee, taking into consideration its earlier
in the improvement of local air quality, reduction
document called Climate Change and Environmental
in waste to landfill as well as reducing pressure on
Action Plan 2009-2012.
water and energy reserves.
The Climate Change Action Plan 2011-2020 Plan • Efficient resource use is central to the plan and is
provides context for Council’s Climate Change Policy a core environmental imperative.
and was endorsed at the Second Ordinary General
Climate Change Action
Council Meeting on 25 October 2011. 3.3 Commitment
Plan 2011-2020
Section 3
3.3.1 Resourcing
3.2 Benefits
The budget requirements and priorities contained
The following list of benefits will result from the
in the plan will be assessed on an annual basis.
implementation of the Climate Change Action Plan
Council will investigate the use of realised savings,
2011-2020.
resulting from the energy efficiency initiatives, to be
3.2.1 Economic reinvested to fund additional programs and actions.
• Energy efficiency initiatives will reduce the 3.3.2 Reporting
financial costs associated with Council’s
The Climate Change Action Plan 2011-2020 should
Corporate Actions
energy usage.
be seen as an opportunity for Council to attend to
Section 4
• Leading by example and assisting the mitigation and adaptation activities to reduce its
community by providing information and impact on climate change. It should be noted that
guidance for actions that can reduce community the Action Plan is seen as a living document.
and personal energy consumption and therefore
lead to financial savings. The Action Plan may require modification from time
to time to reflect new science and initiatives as well
• The implementation of measures within the plan
as budget constraints. Council will report on the
may have flow on benefits for the local economy
progress, amendments and any new initiatives for
through the development of new markets in
the plan through its annual report.
Community Actions
areas such as renewable energy and the creation
of local job opportunities. The Action Plan has been included in Council’s central
Section 5
business plan and reporting system (Interplan®).
All actions within the Action Plan have been
incorporated into individual departmental business
plans for completion.
Monitoring of the Action Plan and reporting against
each of these actions will occur each month per
Council’s internal performance reporting process.
Abbreviations, Glossary
and References
Section 6
City of Darwin Climate Change Action Plan 2011-2020 27You can also read